unityEnergy use and carbon emissionsThrough energy efficiency projects and considerationof carbon offset activities, our carbon footprint isbeing reduced.In <strong>2011</strong>, MMG used a total of 6,452,901 718,366gigajoules (GJ)of energy, of which 3,423,836 GJ 481,752 was indirect energysourced from the electricity grid, and 3,029,066 GJ wasdirect consumption of diesel and other fuels. A total of765,418 tonnes of CO 2 e greenhouse27,020gas emissions wereproduced in <strong>2011</strong>, with 555,9388,925tonnes coming fromindirect electricity use and 209,479 1,962 tonnes from directconsumption of diesel and other fuels. Energy efficiencyand emissions intensity trends have remained, onaverage, fairly steady throughout <strong>2011</strong>.Throughout our operations, offices and transportactivities, the efficient use of energy is important inminimising greenhouse gas emissions. Current energyand emissions reduction programs under way includethe preparation6000of energy management plans for 2010our Australian 5000<strong>2011</strong>mining operations, and meeting ourEnergy Efficiency 4000 Opportunities (EEO) commitments.We undertook Location 3000 a Climate Change Study in <strong>2011</strong> (seepage 58). We also have systems in place to meet our2000obligations under the National Greenhouse and Energy1000<strong>Report</strong>ing Scheme (NGERS).tal Energy Consumption (GJ) <strong>2011</strong> Total Energy Consumption (GJ)1 2,953,6914 2,261,185<strong>2011</strong> energy efficiencyThe term “energy efficiency” describes the amount ofenergy that we consume per unit of production. Energyefficiency indicators, such as gigajoules per tonne*Corporate includes Dugald River project employeesof concentrate, are used to measure the effectivenessof our energy-use reduction projects and strategies.Key performance indicators (KPIs) can showimprovements in efficiency even when our totalenergy consumption increases.Between 2010 and <strong>2011</strong>, MMG’s operations experiencedvariations in energy efficiency performance. The energyefficiency KPI is based on the energy required to producea tonne of concentrate (or copper cathode in the caseof Sepon). Consequently, this KPI is greatly influencedby factors such as ore grade, recovery rates and stripratios (the quantity of waste rock mined to enable oneunit of ore).Sepon experienced an 11% improvement in energyefficiency, resulting from a significant (25%) increase incopper cathode production following commissioning ofthe expanded copper processing plant, but only a 15%increase in energy consumption. This improvement isoffset somewhat by a 25% reduction in gold production.Energy efficiency at Century also improved by 10%,associated with a 12% reduction in energy consumptionbut only a 3% reduction in concentrate production.At Golden Grove, energy efficiency worsened by 24%.This was associated with the combination of a 14%increase in material mined due to the reopening of theScuddles underground mine that was on care andmaintenance in 2010, but a 2% reduction in oreprocessed and a 17% reduction in concentrateproduction. Similarly, Rosebery experienced an 8%reduction in energy efficiency due to an increase inmaterial mined and processed, but with concentrateproduction remaining essentially the same as last year.2010 Total GHG Emissions (T CO2e) <strong>2011</strong> Total GHG Emissions (T CO2e)Century 338,917 316,267Golden Grove 115,784 118,852Rosebery 0 (inc Avebury) 30,748 38,388Sepon 218,110 288,858Dugald River 361 1,744Exploration 748 644Melbourne Group Office 652 665CENTURYGOLDENGROVEROSEBERYSEPONEXPLORATIONCORPORATEENERGY CONsUMPTION (GJ)GREENHOUSE GAS EMISSIONS (T CO 2 e)7,000,0008000006,000,0007000005,000,000 6000004,000,000 5000003,000,000 4000002,000,000 3000002000001,000,000100000001,925 1,9621,958,234 2,261,185472,845481,752698,080718,3663,220,691 2,953,6912010 <strong>2011</strong>OtherSeponRoseberyGolden GroveCentury800,000700,000600,000500,000400,000300,000200,000100,0000652218,11030,748115,784338,9172010665288,85838,388118,852316,267<strong>2011</strong>OtherSeponRoseberyGolden GroveCentury*Other: Melbourne Group Office; Exploration; and Dugald River*Other: Melbourne Group Office; Exploration; and Dugald River56
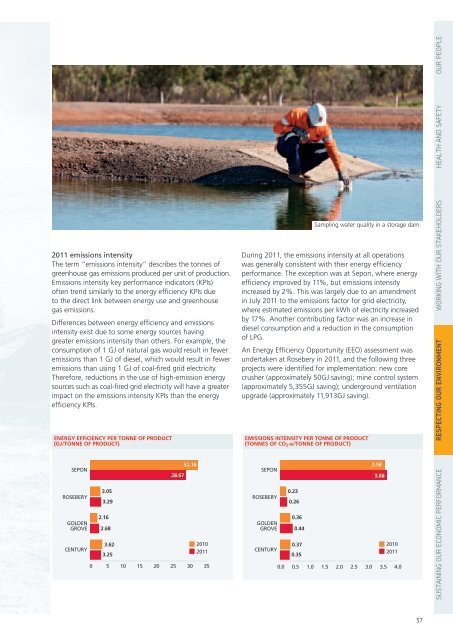
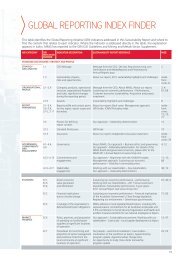
11 Communityst Index6000<strong>2011</strong> emissions 65.9% intensityThe term5000“emissions intensity” describes the tonnes ofgreenhouse 400050.8%gas emissions produced per unit of production.Emissions 3000 intensity key performance 38.9% indicators (KPIs)often trend 2000 similarly to the energy efficiency KPIs dueto the direct link between energy use and greenhouse1000gas emissions.0<strong>2011</strong> CommunityDifferences between energy efficiency and emissionsTrust IndexROSEBERY CENTURY GOLDEN GROVEintensity exist due to some energy sources havinggreater emissions intensity than others. For example, theconsumption *Corporate of 1 includes GJ of natural Dugald River gas project would employees result in feweremissions than 1 GJ of diesel, which would result in feweremissions than using 1 GJ of coal-fired grid electricity.Therefore, reductions in the use of high-emission energysources such as coal-fired grid electricity will have a greaterimpact on the emissions intensity KPIs than the energyefficiency KPIs.SEPONROSEBERYGOLDENGROVECENTURYCENTURY3.053.292.162.683.623.25GOLDENGROVEROSEBERYSEPONEnergy efficiency per tonne of product(GJ/Tonne of product)EXPLORATION28.6732.162010<strong>2011</strong>CORPORATE2010<strong>2011</strong>0.0 0.5 0 1.0 5 1.5 102.0 152.5 20 3.0 3.5 25 4.0 30 356000During <strong>2011</strong>, the emissions intensity at all operationswas generally5000<strong>2011</strong>consistent with their energy efficiencyperformance. 4000 The exception was at Sepon, where energyefficiency 3000 improved by 11%, but emissions intensityincreased 2000 by 2%. This was largely due to an amendmentin July <strong>2011</strong> to the emissions factor for grid electricity,1000where estimated emissions per kWh of electricity increased0by 17%. Another contributing factor was an increase indiesel consumption and a reduction in the consumptionof LPG.An Energy *Corporate Efficiency includes Opportunity Dugald River (EEO) project assessment employees wasundertaken at Rosebery in <strong>2011</strong>, and the following threeprojects were identified for implementation: new corecrusher (approximately 50GJ saving); mine control system(approximately 5,355GJ saving); underground ventilationupgrade (approximately 11,913GJ saving).SEPONROSEBERYGOLDENGROVECENTURYCENTURY0.230.260.360.440.370.35Sampling water quality in a storage dam.GOLDENGROVEROSEBERYSEPONEmissions intensity per tonne of product(Tonnes of CO 2-e/Tonne of product)EXPLORATION3.583.662010CORPORATE2010<strong>2011</strong>0.0 0.5 1.0 1.5 2.0 2.5 3.0 3.5 4.0SUSTAINING OUR ECONOMIC PERFORMANCE RESPECTING OUR ENVIRONMENT WORKING WITH OUR STAKEHOLDERS HEALTH AND SAFETY OUR PEOPLE57