- Page 1 and 2: APPENDIX B TechnologyTechnology Cro
- Page 3 and 4: Technology NotesNew versions of tec
- Page 5 and 6: Function or TaskBinomcdf( functionb
- Page 7 and 8: Function or Taskbinompdf functionbi
- Page 9 and 10: Function or TaskBox-and-Whisker Plo
- Page 11 and 12: Function or TaskClrList commandClrL
- Page 13 and 14: Function or TaskDiagnosticOn/OffIns
- Page 15 and 16: Function or Taskgeometpdf( function
- Page 17: Function or TaskinvNorm functioninv
- Page 21 and 22: Function or Taskmode settingsKeystr
- Page 23 and 24: The probability of scoring 115 or l
- Page 25 and 26: Function or TaskNormal Probability
- Page 27 and 28: Function or TasknPr functionnPrKeys
- Page 29 and 30: Example 2:Twenty people were asked
- Page 31 and 32: Function or Taskrand functionrand(n
- Page 33 and 34: Function or TaskrandNorm( functionr
- Page 35 and 36: Function or TaskSeq( functionseq(ex
- Page 37 and 38: Function or TaskSortA( functionSort
- Page 39 and 40: Function or Tasksum( functionsum(li
- Page 41 and 42: Function or TaskWindow SettingsKeys
- Page 43 and 44: Function or TaskZInterval instructi
- Page 45 and 46: TI-Nspire CASFunction or Taskbinomc
- Page 47 and 48: Function or Taskbinompdf(numtrials,
- Page 49 and 50: Function or TaskBox and Whisker Plo
- Page 51 and 52: Function or TaskzIntervalKeystroke(
- Page 53 and 54: Function or TaskgeomPdf(p,x)Keystro
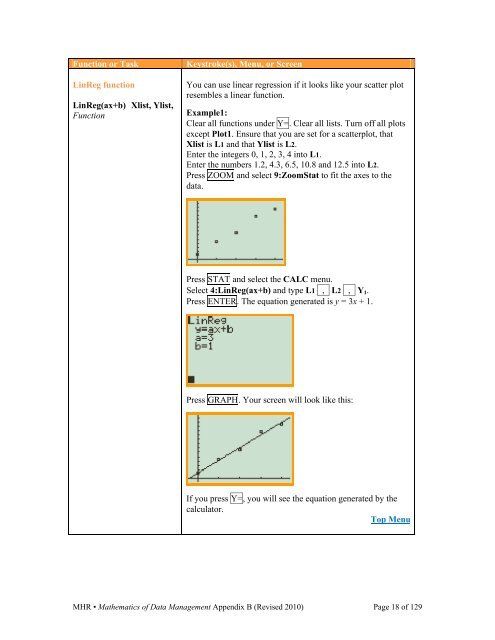
- Page 55 and 56: Function or TaskLinear RegressionKe
- Page 57 and 58: Function or Taskmean(list)Keystroke
- Page 59 and 60: Function or TasknormPdf(x,mean,stan
- Page 61 and 62: Function or TaskNormal Probability
- Page 63 and 64: Function or TaskOne-Variable Statis
- Page 65 and 66: Function or Taskproduct(list,start,
- Page 67 and 68: Function or Tasksum(list,start,end)
- Page 69 and 70:
Function or TaskrandInt(lowerbound,
- Page 71 and 72:
Function or TaskRandSeed numberKeys
- Page 73 and 74:
stDevSamp(list)You can determine th
- Page 75 and 76:
SpreadsheetsFunction or TaskAdd Wor
- Page 77 and 78:
Function or TaskBinomial Distributi
- Page 79 and 80:
Function or TaskCorrelation Coeffic
- Page 81 and 82:
Function or TaskFactorial functionM
- Page 83 and 84:
Function or TaskFiltered searchMicr
- Page 85 and 86:
Function or TaskFraction formatting
- Page 87 and 88:
Function or TaskLine of Best FitKey
- Page 89 and 90:
Function or TaskMean Value function
- Page 91 and 92:
Function or TaskNormal Distribution
- Page 93 and 94:
Function or TaskPermutations nPr:Ke
- Page 95 and 96:
Function or TaskRandom Real Numbers
- Page 97 and 98:
Function or TaskReferences:data fro
- Page 99 and 100:
Function or TaskStandard DeviationM
- Page 101 and 102:
Function or TaskVarianceMicrosoft®
- Page 103 and 104:
Function or TaskBinomialProbability
- Page 105 and 106:
Function or TaskcaseIndexKeystroke(
- Page 107 and 108:
Function or Taskcorrelation coeffic
- Page 109 and 110:
Function or TaskfilterKeystroke(s),
- Page 111 and 112:
Function or TaskInspectorKeystroke(
- Page 113 and 114:
Function or Taskinterquartile range
- Page 115 and 116:
Function or Taskmean()Keystroke(s),
- Page 117 and 118:
Function or TaskmodeKeystroke(s), M
- Page 119 and 120:
Function or TaskquartilesKeystroke(
- Page 121 and 122:
Function or TaskrandomInteger funct
- Page 123 and 124:
Function or Taskscatter plotKeystro
- Page 125 and 126:
Function or TaskStdDev()Keystroke(s
- Page 127 and 128:
Function or TaskuniqueRank() functi
- Page 129:
Function or TaskzScore functionalso