Technology Appendix - McGraw-Hill Ryerson
Technology Appendix - McGraw-Hill Ryerson
Technology Appendix - McGraw-Hill Ryerson

You also want an ePaper? Increase the reach of your titles
YUMPU automatically turns print PDFs into web optimized ePapers that Google loves.
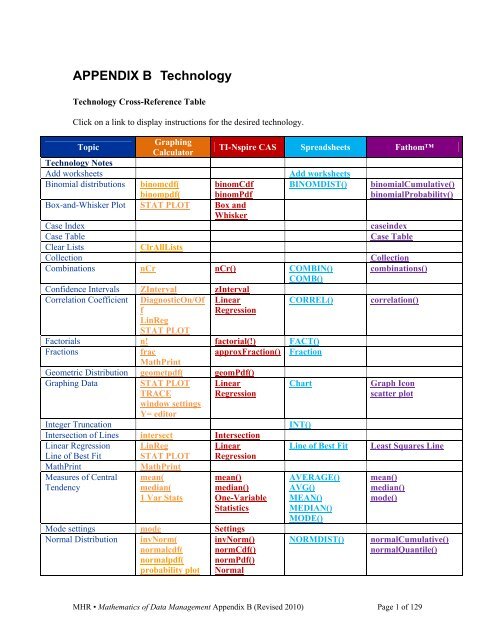
APPENDIX B <strong>Technology</strong><strong>Technology</strong> Cross-Reference TableClick on a link to display instructions for the desired technology.TopicGraphingCalculatorTI-Nspire CAS Spreadsheets Fathom<strong>Technology</strong> NotesAdd worksheets Add worksheetsBinomial distributions binomcdf(binompdf(binomCdfbinomPdfBINOMDIST() binomialCumulative()binomialProbability()Box-and-Whisker Plot STAT PLOT Box andWhiskerCase IndexcaseindexCase TableCase TableClear Lists ClrAllListsCollectionCollectionCombinations nCr nCr() COMBIN() combinations()COMB()Confidence Intervals ZInterval zIntervalCorrelation Coefficient DiagnosticOn/Of LinearCORREL() correlation()fLinRegSTAT PLOTRegressionFactorials n! factorial(!) FACT()FractionsfracMathPrintapproxFraction() FractionGeometric Distribution geometpdf( geomPdf()Graphing Data STAT PLOTTRACEwindow settingsY= editorLinearRegressionChartInteger Truncation INT()Intersection of Lines intersect IntersectionLinear RegressionLine of Best FitLinRegSTAT PLOTLinearRegressionLine of Best FitMathPrint MathPrintMeasures of CentralTendencymean(median(1 Var Statsmean()median()One-VariableStatisticsMode settings mode SettingsNormal Distribution invNorm(normalcdf(normalpdf(probability plotinvNorm()normCdf()normPdf()NormalAVERAGE()AVG()MEAN()MEDIAN()MODE()NORMDIST()Graph Iconscatter plotLeast Squares Linemean()median()mode()normalCumulative()normalQuantile()MHR • Mathematics of Data Management <strong>Appendix</strong> B (Revised 2010) Page 1 of 129
ShadeNorm(Probability PlotShade NormalcumulativeSum()product()seq()sortsum()Organizing Data augment(clrListcumSum(prod(seq(SortA(sum(COUNTIF()FillFiltered SearchMAX()SortSUM()count()FiltersInspectorSort AscendingSort DescendingsumuniqueRank()Permutations nPr nPr() PERMUT() PermutationsQuartilesRandom Numbersinterquartilerangequartiles1-Var Statsrand(randInt(randNorm(seedsOne-VariableStatisticsrand()randInt()randNorm()RandSeedRAND()RANDBETWEEN()iqr()quartilesrandom()randomInteger()randomNormal()ReferencingCell ReferencesReference fromanother sheetRounding Numbers round( round() ROUND()Scatter Plots STAT PLOT scatter plots Chart scatter plotSearch SearchSequence seq( seq()Standard Deviation stDev(1-Var StatsstDevSamp()One-VariableSTDEV()STDS()stdDev()Variancevariance(1-Var StatsStatisticsvarSamp()One-VariableStatisticsVAR()VARS()variance()Z-scores ZInterval zInterval zScoreMHR • Mathematics of Data Management <strong>Appendix</strong> B (Revised 2010) Page 2 of 129
<strong>Technology</strong> NotesNew versions of technology are released at various intervals. The current versionavailable to Ontario schools in June 2010 was used to prepare this technology appendix.Functions such as binompdf() can be selected from a menu, from the Catalog, or typeddirectly. The Catalog will also show you a summary of the syntax to be used with thefunction.<strong>Technology</strong> tends to be versatile, and many operations and processes can be achieved inmore than one way. This technology appendix will generally show you one way thatworks for a given operation, but others are available. A variety of approaches has beenused to give you a reasonable overview of the workings of the technology.Graphing CalculatorAll keystrokes shown are for the TI-83 Plus or TI-84 Plus family of graphingcalculators. The operating systems (OS) current at the time of writing are OS1.19 for theTI-83 Plus and OS 2.53 for the TI-84 Plus.TI-Nspire CAS (Computer Algebra System)The operating system current at the time of writing is OS 2.0.SpreadsheetsInstructions are for Microsoft® Excel® 2007 and Corel® Quattro Pro® 8. Similarfunctions can be found on other versions or spreadsheets, but may be accesseddifferently.FathomInstructions are for Fathom 2, but will generally work on Fathom (version 1) aswell. Screens may appear somewhat different, but functionality remains essentially thesame.MHR • Mathematics of Data Management <strong>Appendix</strong> B (Revised 2010) Page 3 of 129
Function or Taskaugment( functionaugment(listA,listB)Keystroke(s), Menu, or ScreenThe augment( function found under the LIST OPS menu isused to join together the elements of list A and list B. To seehow this works, create L1 and L2 as shown:Press 2 nd MODE to QUIT to the home screen.Press 2 nd STAT and the right arrow key to display the LISTOPS menu.Select 9:augument( and type L1,L2).Then, press STO> L3.Your screen will look like this:Press ENTER. You can inspect L3 by pressing the STAT keyand selecting 1:Edit. Your screen looks like this:Top MenuMHR • Mathematics of Data Management <strong>Appendix</strong> B (Revised 2010) Page 4 of 129
Function or TaskBinomcdf( functionbinomcdf (numtrials,p,x)Keystroke(s), Menu, or ScreenThe binomcdf( function allows you to calculate theprobability that an experiment whose only possible outcomesare success or failure, with a probability of success given by p,achieves x or fewer successes in the number of trials given bynumtrials. The value for x can also be a list of numbers.If x is not specified, then a list of values from x = 0 tox = numtrials is generated.Example 1:A die is rolled ten times. What is the probability of getting fiveor fewer 2s?Press 2nd VARS to access the DISTR menu. Scroll down andselect A:binomcdf(. Type 10,1/6,5) and press ENTER.The probability is approximately 0.997… as shown:Example 2:To find all of the cumulative probabilities for Example 1,above, from x = 0 to x = 10 and store them in list L1, retrievethe binomcdf( function as above, but leave out the parameterx. Then, press STO> followed by 2nd L1 :When you press ENTER, you will get a list of probabilitiesthat you can scroll through using the right arrow key.You can also inspect list L1 using the STAT key and selecting1:EDIT… .Continued on next pageMHR • Mathematics of Data Management <strong>Appendix</strong> B (Revised 2010) Page 5 of 129
Example 3:Suppose that you want the cumulative probabilities of getting3, 4 or 5 twos. This can be done as follows:Note: Brace brackets {} are required for the list of x values.Top MenuMHR • Mathematics of Data Management <strong>Appendix</strong> B (Revised 2010) Page 6 of 129
Function or Taskbinompdf functionbinompdf(numtrials, p, x)Keystroke(s), Menu, or ScreenThe binompdf function allows you to calculate theprobability that an experiment whose only possible outcomesare success or failure, with a probability of success given by p,achieves x successes in the number of trials given bynumtrials. x may also be a list of numbers. If x is notspecified, then a list of values from x = 0 to x = numtrials isgenerated. This can be stored in one of the graphingcalculator’s lists.Example 1:A die is rolled ten times. What is the probability of gettingexactly five 2s?Press 2nd VARS to access the DISTR menu. Scroll down,select 0:binompdf(. Type 10,1/6,5) and press ENTER. Theprobability is approximately 0.013.Example 2:To calculate all of the probabilities for Example 1, above,from x = 0 to x = 10 and store them in list L1, retrieve thebinompdf( function as above, but leave out the parameter x.Press STO> followed by 2nd L1 .When you press the ENTER key, you will get a list ofprobabilities that you can scroll through using the right arrowkey. You can also inspect list L1 using the STAT key andselecting 1:EDIT… .Continued on next pageMHR • Mathematics of Data Management <strong>Appendix</strong> B (Revised 2010) Page 7 of 129
Once these probabilities are in the list, you can graph themusing STAT PLOT.Example 3:Suppose that you want only the probabilities of getting 3, 4 or5 twos. This can be done as follows:Note: Brace brackets {} are required for the list of x values.Top MenuMHR • Mathematics of Data Management <strong>Appendix</strong> B (Revised 2010) Page 8 of 129
Function or TaskBox-and-Whisker PlotKeystroke(s), Menu, or ScreenA box-and-whisker plot will plot one-variable data in such away as to illustrate the minimum value, first quartile, median,third quartile and maximum value. To see how this works,clear all lists. Enter the integers from one to ten into L1. Press2nd Y= to access STATPLOT. Ensure that all plots are offexcept Plot1. Set up the parameters for Plot1 as shown:Press GRAPH and ZoomStat to set up the axes. Your screenwill look like this:The box runs from Q1 to Q3. The vertical line in the boxshows the location of the median. The left whisker extends tothe minimum data value, while the right whisker extends tothe maximum data value.Top MenuMHR • Mathematics of Data Management <strong>Appendix</strong> B (Revised 2010) Page 9 of 129
Function or TaskClrAllListsKeystroke(s), Menu, or ScreenTo clear a single list, press STAT and select 1:EDIT… toaccess the lists. Use the arrow keys to move the cursor to thelist name of the list that you want to clear. For L1, your screenwill appear as shown:Press CLEAR followed by ENTER to clear all entries inthe list.To clear all lists at once, press 2nd + to access theMEMORY menu:Select 4:ClrAllLists and press ENTER. A Donemessage will indicate that all lists have been cleared.You can check the lists by pressing STAT and selecting1:EDIT… .Top MenuMHR • Mathematics of Data Management <strong>Appendix</strong> B (Revised 2010) Page 10 of 129
Function or TaskClrList commandClrListlistname1,listname2,…Keystroke(s), Menu, or ScreenThe ClrList command found under the STAT EDIT menu isused to clear the entries in one or more lists. It also removesany formula associated with the list name. For example, toclear lists L1 and L2 type:Press ENTER.Note: If you want to clear all of the lists at once, it is faster touse the ClrAllLists command.Top MenuMHR • Mathematics of Data Management <strong>Appendix</strong> B (Revised 2010) Page 11 of 129
Function or TaskCombinationsnCrKeystroke(s), Menu, or ScreenThe TI84+ does not have a dedicated key for combinations. Tocalculate a combination, you will use the nCr functionavailable under the MATH PRB menu.Suppose that you want to evaluate the number of subsets of10 objects taken 7 at a time, or 10 choose 7. Type in 10.Press the MATH key, and then the right arrow key three timesto scroll over to the PRB menu. Select 3:nCr, type in a 7 andpress ENTER. The answer 120 appears.Top MenuFunction or TaskcumSum functioncumSum(listname)Keystroke(s), Menu, or ScreenThe cumSum function returns the cumulative sum of theelements in a list. It is useful for calculating cumulativefrequency for a distribution.Enter the numbers 1,3,5,7,9,11 in L1. Move the cursor to thetop of L2 on top of the list name.Press 2 nd STAT and the right arrow key to access the LISTOPS menu.Select 6:cumSum( and add L1).Press ENTER. You can inspect L2 by pressing STAT andselecting 1:Edit. Your screen looks like this:Top MenuMHR • Mathematics of Data Management <strong>Appendix</strong> B (Revised 2010) Page 12 of 129
Function or TaskDiagnosticOn/OffInstructionDiagnosticOn/OffKeystroke(s), Menu, or ScreenWhen you use one of the regression functions to generate acurve of best fit, the calculator will calculate correlationcoefficients that allow you to judge how good the fit is.However, you must first turn on the diagnostic mode. Press2nd 0 to access the CATALOG menu. Scroll down until youline up the black arrow on the screen with DiagnosticOn.Press ENTER. This will turn on the diagnostic mode. Try oneof the regression examples to see the coefficients displayed onthe screen.In a similar manner you can turn off the diagnostic mode byaccessing the CATALOG menu and selecting DiagnosticOff.In OS 2.53, you can set the Diagnostics On/Off from thesecond page of the mode screen. Press MODE and scrolldown to STAT DIAGNOSTICS.Top MenuMHR • Mathematics of Data Management <strong>Appendix</strong> B (Revised 2010) Page 13 of 129
Function or Task! (factorial)!Keystroke(s), Menu, or ScreenThe TI84+ does not have a dedicated factorial key. Tocalculate a factorial, you will use the ! function availableunder the MATH PRB menu.For example, evaluate 8!. Press MATH and then the rightarrow key to go to the PRB menu. Select 4: ! and pressENTER. The answer 40 320 appears.Note: The TI84+ has the same maximum 69! limit that mostscientific calculators have. Most spreadsheets have muchhigher limits.Top MenuFunction or Task>Frac functionvalue >FracKeystroke(s), Menu, or ScreenThe >Frac function found under the MATH menu willdisplay results of a calculation in fractional form.Example:Find the sum 1 + 1 , and display the result as a fraction rather2 3than as a decimal.Type 1 ÷ 2 + 1 ÷ 3 .Press MATH select 1:>Frac. Press ENTER.The result will look like this:Top MenuMHR • Mathematics of Data Management <strong>Appendix</strong> B (Revised 2010) Page 14 of 129
Function or Taskgeometpdf( functiongeometpdf(p,x)Keystroke(s), Menu, or ScreenThe geometpdf( function will return the probability that thefirst success of an event with probability p will occur on trialx.Example:Calculate the probability that the first roll of doubles on a pairof dice occurs on the fourth roll. In this case p = 1 6and x = 4.Press 2 nd VARS to access the DISTR menu, and selectoption D:geometpdf(.Type 1 ÷ 6 , 4 ) . Press ENTER.There is a probability of approximately 0.096 that the firstdoubles will occur on the fourth roll of the dice.Top MenuFunction or Taskinterquartile rangeKeystroke(s), Menu, or ScreenThe interquartile range of the elements of a list may bedetermined by carrying out the 1-Var Stats command on alist of data, as described later in this appendix. The results ofthe 1-Var Stats command include the first quartile Q1 andthe third quartile Q3. The interquartile range is calculated bysubtraction: Q3 – Q1.The semi-interquartile range is half of the interquartilerange.Top MenuMHR • Mathematics of Data Management <strong>Appendix</strong> B (Revised 2010) Page 15 of 129
Function or TaskintersectKeystroke(s), Menu, or ScreenYou can use the intersect function to find the point ofintersection of two lines or curves.Example 1:Turn off all STATPLOTs and clear all functions under Y=.Set the standard screen using Zstandard. Return to thefunction entry screen using the Y= key and enterY1 = 2x + 3 and Y2 = -3x + 1. Press GRAPH. Your screenwill look like this:Press 2nd TRACE to access the CALC menu, and select5:intersect . You will get a screen like this:Ensure that the flashing cursor is clearly on one of the lines. Ifit is not, use the arrow keys to put it there. Press ENTER.Ensure that the flashing cursor is now on the other line. If it isnot, move it there. Press ENTER.Next, use the arrow keys to move the cursor as close as youcan to the observed point of intersection, and press ENTER.If your guess was close enough, the calculator will find thepoint of intersection and display its coordinates. In this case,the answer is x = −0.4 and y = 2.2.This procedure will also work with other functions. If there ismore than one point of intersection, find them one at a time.Top MenuMHR • Mathematics of Data Management <strong>Appendix</strong> B (Revised 2010) Page 16 of 129
Function or TaskinvNorm functioninvNorm(area, mean,standard deviation)Keystroke(s), Menu, or ScreenThe invNorm function allows you to calculate thedistribution function which gives a probability specified byarea using a normal distribution with a given mean andstandard deviation. The mean and standard deviation areoptional. If they are not specified, the mean is assumed to bezero, and the standard deviation is assumed to be one.Example 1:An IQ test has a mean of 100 and a standard deviation of 10.You have a probability of 0.454 that a given participant scoredat or below a particular IQ, and wish to find this IQ.Press 2nd VARS to display the DISTR menu.Select 3:invNorm( .Type .454 , 100 , 10 ) .Press ENTER.The correct IQ is approximately 98.84.Top MenuMHR • Mathematics of Data Management <strong>Appendix</strong> B (Revised 2010) Page 17 of 129
Function or TaskLinReg functionLinReg(ax+b) Xlist, Ylist,FunctionKeystroke(s), Menu, or ScreenYou can use linear regression if it looks like your scatter plotresembles a linear function.Example1:Clear all functions under Y=. Clear all lists. Turn off all plotsexcept Plot1. Ensure that you are set for a scatterplot, thatXlist is L1 and that Ylist is L2.Enter the integers 0, 1, 2, 3, 4 into L1.Enter the numbers 1.2, 4.3, 6.5, 10.8 and 12.5 into L2.Press ZOOM and select 9:ZoomStat to fit the axes to thedata.Press STAT and select the CALC menu.Select 4:LinReg(ax+b) and type L1 , L2 , Y 1 .Press ENTER. The equation generated is y = 3x + 1.Press GRAPH. Your screen will look like this:If you press Y=, you will see the equation generated by thecalculator.Top MenuMHR • Mathematics of Data Management <strong>Appendix</strong> B (Revised 2010) Page 18 of 129
Function or TaskMathPrintAvailable with OS 2.53Keystroke(s), Menu, or ScreenYou can display mathematical expressions, especially fractions,as they are normally written on paper, using MathPrint.Access MathPrint by pressing MODE, and scrolling to thesecond page.Select MATHPRINT.You can enter fractions using fraction templates.Example:Determine the sum 1 + 1 .2 3● Press ALPHA then Y= to access F1.Select the n/d template.Use the template to enter 1 2 .Type +.Use the n/d template to enter 1 3 .Press ENTER.Additional Notes:You can also display mixed numbers using the Un/d template.You can use the mode screen to set the display to improperfractions u/d or mixed numbers Un/d.Top MenuMHR • Mathematics of Data Management <strong>Appendix</strong> B (Revised 2010) Page 19 of 129
Function or Taskmean( functionmean(listname)Keystroke(s), Menu, or ScreenThe mean( function under the LIST MATH menu returns themean of the list specified by listname.Example:Enter the numbers 1, 2, 3 and 4 into L 1 .Press 2nd STAT and choose the LIST MATH menu.Select 3:mean( and type L1 ) . Press ENTER.Top MenuFunction or Taskmedian functionmedian(listname)Keystroke(s), Menu, or ScreenThe median( function under the LIST MATH menu returnsthe median of the list specified by listname.Example:Enter the numbers 1, 2, 3, 4, 5, 6, 7 into L1.Press 2nd STAT and choose the LIST MATH menu.Select 4:median( and type L1 ) . Press ENTER.Top MenuMHR • Mathematics of Data Management <strong>Appendix</strong> B (Revised 2010) Page 20 of 129
Function or Taskmode settingsKeystroke(s), Menu, or ScreenIf you press MODE, you will see a number of mode settingsthat affect the way the TI84+ displays and interprets numbersand graphs:a) You have a choice of normal, scientific or engineeringformat for real numbers.b) You may choose a fixed number of decimal points forfloating point numbers from 0 to 9.c) You may measure angles in radians of degrees.d) You may choose your graph plotting as Func (y as afunction of x), Par (x and y are functions of a parameter t),Pol (polar coordinates r as a function of θ, or Seq (to plotsequences).e) You may choose to connect or not connect the dotscalculated for functions.f) You may plot your functions sequentially or simultaneouslyg) You may display numbers as real numbers, complexnumbers in vector form or complex numbers in polar form.h) You may plot your graph Full (Screen), as the top half ofthe screen with text at the bottom in Horiz mode or in the lefthalf of the screen with the corresponding table in the right halfof the screen in G-T mode.OS 2.53 adds a second page to the mode screen.To learn more about some of the new features, refer toMathPrint.Top MenuMHR • Mathematics of Data Management <strong>Appendix</strong> B (Revised 2010) Page 21 of 129
Function or Tasknormalcdf functionnormalcdf(lowerbound,upperbound, mean,standard deviation)Keystroke(s), Menu, or ScreenThe normalcdf function allows you to calculate theprobability that a given data point lies between lowerboundand upperbound using a normal distribution with a givenmean and standard deviation. The mean and standarddeviation are optional. If they are not specified, the mean isassumed to be zero, and the standard deviation is assumed tobe one.Example 1:An IQ test has a mean of 100 and a standard deviation of 10.Determine the probability that a given participant scoredbetween 90 and 115.Press 2nd VARS to access the DISTR menu.Select 2:normalcdf( and type 90 , 115 , 100 , 10 ) .Press ENTER.The probability that a given participant scored between 90 and115 is approximately 0.7745.Example 2:Calculate the probability that a participant scored 115 or less.In this case, the value of lowerbound is -∞. On the TI84+,you can approximate -∞ using a negative number like –1×10 99 .Select the normalcdf( function as above, and then type –12nd , to access the EE (Enter Exponent) function. Continuewith 99,115,100,10). Press ENTER.Continued on next pageMHR • Mathematics of Data Management <strong>Appendix</strong> B (Revised 2010) Page 22 of 129
The probability of scoring 115 or less is .933… .Top MenuMHR • Mathematics of Data Management <strong>Appendix</strong> B (Revised 2010) Page 23 of 129
Function or Tasknormalpdf functionnormalpdf(X, mean,standard deviation)Keystroke(s), Menu, or ScreenThe normalpdf function computes the probability densityfunction at a specified value for variable X using a normaldistribution with a given mean and standard deviation. Themean and standard deviation are optional. If they are notspecified, the mean is assumed to be zero, and the standarddeviation is assumed to be one.Example 1:An IQ test has a mean of 100 and a standard deviation of 10.You would like to determine the probability density functionat a value of X = 110.Press 2nd VARS to access the DISTR menu.Select 1:normalpdf( and type 110 , 100 , 10 ) .Press ENTER.The probability density is approximately 0.024 as shown.This function can be used to plot the probability distribution.Set your Window variables as shown.Press Y= to call up function editor. Press 2nd VARS to accessthe DISTR menu. Select 1:normalpdf(. Type X,100,10):Press GRAPH. You will see the probability distribution.Top MenuMHR • Mathematics of Data Management <strong>Appendix</strong> B (Revised 2010) Page 24 of 129
Function or TaskNormal Probability PlotKeystroke(s), Menu, or ScreenYou can check whether a list of data is normally distributed bymaking a plot of the data versus the z-scores of the data. Thisis the sixth graph type offered on the STATPLOT screen. Tosee how this works, you will generate two sets of data, onenormally distributed and the other not, and graph them.Press 2nd Y= to access the STATPLOT screen. Turn off allplots except Plot1. Select Plot1, ensure that it is On, andselect the sixth graph type, the Normal Probability Plot.Select Data List L1, Data Axis X and the small dot for theMark.QUIT to the main screen, press MATH and scroll to the PRBmenu. Select 6:randNorm( and type 50 , 20 , 50 ) .Press STO> and add L1.Press ENTER to generate the list of numbers.Press GRAPH and ZoomStat to set the axis variables.Notice that you have a straight line. This is not surprising,since you used the randNorm( function to select fifty randomnumbers from a normal distribution with a mean of 50 and astandard deviation of 20.Continued on next pageMHR • Mathematics of Data Management <strong>Appendix</strong> B (Revised 2010) Page 25 of 129
Now do it again, but selecting 50 random integers between 25and 75.QUIT to the main screen, press MATH and scroll to the PRBmenu. Select 5:randInt( and type 25, 75, 50). Press STO>and add L1.Press ENTER to generate the list of numbers. Press GRAPHand ZoomStat to set the axis variables.Notice that it is not a straight line. This is not surprising, sinceyou used the randInt( function to select fifty numbers atrandom.You can use this method to check whether or how closely a setof data matches a normal distribution.Top MenuMHR • Mathematics of Data Management <strong>Appendix</strong> B (Revised 2010) Page 26 of 129
Function or TasknPr functionnPrKeystroke(s), Menu, or ScreenTo calculate a permutation, use the nPr function availableunder the MATH PRB menu.Example:Evaluate the number of arrangements of 10 objects taken 7 ata time.Type 10. Press MATH and scroll over to the PRB menu.Select 2:nPr and type 7. Press ENTER.The answer 604 800 appears.Top MenuMHR • Mathematics of Data Management <strong>Appendix</strong> B (Revised 2010) Page 27 of 129
Function or TaskKeystroke(s), Menu, or Screen1 Var Stats The TI-84 Plus can calculate one-variable statistics for a list ofnumbers specified by Xlist. It can do it for grouped data by1-Var Stats Xlist, Freqlist adding the frequency list Freqlist.Example 1:Ten automobiles were tested for fuel economy, and werefound to burn the following amounts of fuel, measured in litresper 100 km:8.4, 5.0, 4.8, 5.9, 7.3, 8.2, 6.4, 8.1, 9.5, 4.2Clear the lists in your calculator, and enter the data into L1.Press STAT and from the CALC menu select 1:1-Var Stats.Press 2nd 1 to obtain L1, and press ENTER.You can scroll down to see more statistics:The meanings are:x is the meanΣx is the sum of all the valuesΣx 2 is the sum of the squares of the valuesSx is the sample standard deviationσx is the population standard deviationn is the number of values in the listminX is the lowest valueQ 1 is the first quartileMed is the medianQ 3 is the third quartilemaxX is the highest value.Continued on next pageMHR • Mathematics of Data Management <strong>Appendix</strong> B (Revised 2010) Page 28 of 129
Example 2:Twenty people were asked to write down the amount of cashthey were carrying. The data were arranged into intervals. Thefrequency of occurrence of each was noted, and the resultswere as follows:Midpoint ($) Frequency5 315 225 335 245 455 665 575 285 195 2Clear all lists, and enter the data into L1 and L2.Select 1-Var Stats as described in Example 1, but this timeadd L1,L2.Press ENTER.Top MenuMHR • Mathematics of Data Management <strong>Appendix</strong> B (Revised 2010) Page 29 of 129
Function or Taskprod functionprod(list,start,end)Keystroke(s), Menu, or ScreenThe prod( function is used to find the product of the elementsof a list beginning with element start and finishing withelement end. If start and end are not specified, then the entirelist is used.Example:Enter the list of numbers 1, 2, 3, 4 and 5in L1.Press 2nd STAT to access LIST. Select the MATH menu.Select 6:prod( and enter L1,2,4). Press ENTER.Top MenuFunction or TaskquartilesKeystroke(s), Menu, or ScreenThe quartiles of the elements of a list may be determined bycarrying out the 1-Var Stats command on the list, describedelsewhere in this appendix. The results of the 1-Var Statscommand include the first quartile Q1 and the third quartileQ3.Top MenuMHR • Mathematics of Data Management <strong>Appendix</strong> B (Revised 2010) Page 30 of 129
Function or Taskrand functionrand(numtrials)Keystroke(s), Menu, or ScreenSometimes it is useful to generate a random number. This canbe done using the rand function under the MATH PRB menu.The function is followed by an optional parameter numtrialswhich defaults to 1. Each use of the function returns a realnumber greater than 0 but less than 1. You can use multipliersto generate other real numbers, as shown in the examplesbelow.Example 1:Suppose that you simply call the rand function by itself.Under MATH PRB, select 1:rand, and press ENTER.A random real number between 0 and 1 is shown.Example 2:Suppose that you want three random real numbers between 0and 1. You must now add a value for the number of trials. UseMATH PRB, select 1:rand and enter (3). Press ENTER.You obtain three random real numbers as shown in the screenshot above.Example 3:Suppose that you want a real number greater than 0 but lessthan 100.Use the multiplier 100 with the rand function, as shown inthe screen shot above. Press MATH PRB, select 1:rand andenter × 100. Press ENTER. You obtain a real numbergreater than 0 and less than 100 as shown in the screen shotabove.A Note About Seeds: The random number seed discussed inthe section on seeds also applies to the rand function.Top MenuMHR • Mathematics of Data Management <strong>Appendix</strong> B (Revised 2010) Page 31 of 129
Function or TaskrandInt( functionrandInt(lowerbound,upperbound, numtrials)Keystroke(s), Menu, or ScreenWhen simulating probability problems, it is useful to generateintegers at random. This can be done using the randInt(function under the MATH PRB menu. The function isfollowed by a lowerbound, an upperbound and an optionalnumtrials.Example 1:Simulate the rolling of a die once.The lowerbound is 1, the upperbound is 6 and you need notenter the numtrials, since the default value is assumed to be 1.Press MATH and scroll to the PRB menu.Select 5:randInt( and type 1,6). Press ENTER.You will get a random integer between 1 and 6 as shown.Example 2:If you want three rolls of the die, press the same keystrokes toselect 5:randInt( again, but this time type 1,6,3).Press ENTER.You will get a list of three random rolls of the die as shown inthe screen shot above.Example 3:You can use the function twice to get the sum of two dicerolled independently, as shown in the screen shot above.A Note About Seeds: The random number seed discussed inthe section on seeds also applies to the randInt function.Top MenuMHR • Mathematics of Data Management <strong>Appendix</strong> B (Revised 2010) Page 32 of 129
Function or TaskrandNorm( functionrandNorm(mean, standarddeviation, numtrialsKeystroke(s), Menu, or ScreenYou can use the randNorm( function to select a randomnumber from a normal distribution with a given mean andstandard deviation. If numtrials is not specified, you get onevalue. If you want more values, set the value for numtrials.Example:An IQ test has a mean of 100 and a standard deviation of 10.Find three random values assuming a normal distribution.Press MATH and scroll to the PRB menu.Select 6:randNorm( and type 100,10,3).Press ENTER.You will get three random IQs from the distribution, similar tothe screen below:Use the right arrow key to scroll over the other values.You can store the results in a list if you wish by adding STO>L1 to the randNorm( function as shown below:A Note About Seeds: The random number seed discussed inthe section on seeds also applies to the randNorm function.Top MenuMHR • Mathematics of Data Management <strong>Appendix</strong> B (Revised 2010) Page 33 of 129
Function or Taskround( functionround(operand,#decimals)Keystroke(s), Menu, or ScreenThe round( function found under the MATH NUM menu willreturn the operand correctly rounded to the number of decimalpoints specified in #decimals. The operand can be a number,an expression, a list name or a matrix name. In the case of alist, the function will round all of the elements.Example:Evaluate 3 7to four decimal places.Press MATH and scroll to the NUM menu.Select 2:round( and type 3 ÷ 7 , 4 ) .Press ENTER.Top MenuFunction or Taskseeds for random numbersKeystroke(s), Menu, or ScreenA Note About Seeds: Whenever you use one of the randomnumber functions, you will always generate the same series ofrandom numbers. The start of the series is controlled by thevalue of the variable rand which is stored internally in theTI84+, and is set to zero by default. If you change the defaultvalue to something else, you can generate a different series ofnumbers.For example, change the default to 1 using the keystrokes1 STO MATH ⇐ 1.On the screen, it looks like this:Top MenuMHR • Mathematics of Data Management <strong>Appendix</strong> B (Revised 2010) Page 34 of 129
Function or TaskSeq( functionseq(expression, variable,begin, end, increment)Keystroke(s), Menu, or ScreenYou can use the seq( function to create a list of numbers withvarious properties. If the value of increment is not specified, itis assumed to be one.Example 1:Enter a list of the squares of all of the odd numbers from 5 to11 inclusive.The value of begin is 5, end is 11 and increment is 2.Press 2nd STAT to access the LIST menu.From the OPS menu, choose 5:seq(. Type ALPHA A andpress x 2 . Continue with , ALPHA A, 5, 11, 2).Then, press STO> L1.Press ENTER.Notice the list of odd number squares, as expected. Thesenumbers have also been entered into L1. You can inspect themthere by pressing STAT and selecting 1:EDIT… . You willsee a screen like this:Top MenuMHR • Mathematics of Data Management <strong>Appendix</strong> B (Revised 2010) Page 35 of 129
Function or TaskShadeNorm functionShadeNorm(lowerbound,upperbound, mean,standard deviation)Keystroke(s), Menu, or ScreenThe ShadeNorm( function allows you to shade the areaunder the probability density graph that a given data point liesbetween lowerbound and upperbound using a normaldistribution with a given mean and standard deviation. Themean and standard deviation are optional. If they are notspecified, the mean is assumed to be zero, and the standarddeviation is assumed to be one.Example 1:An IQ test has a mean of 100 and a standard deviation of 10.You would like to display and shade the probability densityfunction that a given participant scored between 90 and 115.First, set up your Window like this:Press 2nd VARS to access DISTR.From the DRAW menu, select 1:ShadeNorm(.Type in 90,115,100,10) and press ENTER.Notice that the probability represented by the shaded area hasalso been displayed.Top MenuMHR • Mathematics of Data Management <strong>Appendix</strong> B (Revised 2010) Page 36 of 129
Function or TaskSortA( functionSortA(listname)Keystroke(s), Menu, or ScreenThe SortA( function found under the LIST OPS menu willsort the list specified by listname into ascending order.Example:Enter 1,3,4 and 2 into L1.Press 2nd STAT for LIST and choose the OPS menu.Select 1:SortA and type L1). Press ENTER.Then display the list. Your result will look like this:Note: a related function is the SortD( function which sorts alist in descending order.Top MenuFunction or Taskstandard deviationstdDev(listname)Keystroke(s), Menu, or ScreenThe stdDev( function under the LIST MATH menu returnsthe standard deviation of the list specified by listname.Example:Enter the numbers 1, 2, 3, 4, 5, 6, 7 into L1.Press 2nd STAT and go to the LIST MATH menu.Select 7:stdDev(, and type L1). Press ENTER.Top MenuMHR • Mathematics of Data Management <strong>Appendix</strong> B (Revised 2010) Page 37 of 129
Function or TaskSTAT PLOTKeystroke(s), Menu, or ScreenThe plot routines which are used to plot graphs of data enteredinto the lists of the TI-84 Plus are controlled by the STATPLOT screen, which is accessed by pressing 2nd Y=. Thescreen has five options.Options 1, 2 and 3 control the three plot routines. Threedifferent statistical plots can be displayed on the graphingscreen at one time. Option 4 turns all plots OFF, and option 5turns all plots ON. If you select a plot, say Plot 1, then youwill see the following screen:The first line is used to turn Plot 1 ON or OFF.The second line allows you to select the type of graph youwant: scatter plot, xy-plot, histogram, modified box plot, boxplot or normal probability plot.The next line or lines let you choose which list will providethe data for the axis or axes.The last line lets you choose one of three symbols for datapoints.Top MenuMHR • Mathematics of Data Management <strong>Appendix</strong> B (Revised 2010) Page 38 of 129
Function or Tasksum( functionsum(list,start,end)Keystroke(s), Menu, or ScreenThe sum( function is used to find the sum of the elements of alist beginning with element start and finishing with elementend. If start and end are not specified, then the entire list isused.Example:Enter the list of numbers 1, 2, 3, 4 and 5in L1.Press 2nd LIST and go to the MATH menu.Select 5:sum( and type L1,2,4).Press ENTER. You will get the sum, 9, as shown.Top MenuFunction or TaskTRACE instructionKeystroke(s), Menu, or ScreenThe TRACE instruction allows you to move a cursor along agraph while a readout of the coordinates is displayed, asshown for the graph of y = x 2 :Turn off all plots using the STAT PLOT screen.Press Y=.Press the variable key X,T,θ,n, followed by x 2 .Choose the standard viewing window by pressing ZOOM 6,and you will see the graph of y = x 2 :Press TRACE, and the tracing cursor will appear on the graph.The coordinates of the point that the cursor is lying on aredisplayed at the bottom of the screen. Use the left and rightarrow keys to move the cursor on the graph.Top MenuMHR • Mathematics of Data Management <strong>Appendix</strong> B (Revised 2010) Page 39 of 129
Function or Taskvariance(listname)Keystroke(s), Menu, or ScreenThe variance( function under the LIST MATH menu returnsthe variance of the list specified by listname.Example:Enter the numbers 1, 2, 3, 4, 5, 6, 7 into L1.Press 2nd STAT and go to the LIST MATH menu.Select 8:variance(, and type in L 1 ).Press ENTER.Note: The variance is the square of the standard deviation.Top MenuMHR • Mathematics of Data Management <strong>Appendix</strong> B (Revised 2010) Page 40 of 129
Function or TaskWindow SettingsKeystroke(s), Menu, or ScreenThe WINDOW key can be used to set the limits and scales onboth the horizontal and vertical axes.Example:Plot y = x 2 for values of x from –20 to +20.Start by entering the function into the editor. Press Y=. Clearany existing functions. Move to Y1 using the cursor keys.Press the variable key X,T,θ,n. Then, press the x 2 key.Press WINDOW.Set Xmin to –20, Xmax to +20, Xscl to 5, Ymin to 0, Ymaxto 400, Yscl to 50 and Xres to 1.Press GRAPH. Notice the tick marks on the axes.Return to the WINDOW settings box, and experiment withthe settings. Check the graph to see the effects of yourchanges.Top MenuMHR • Mathematics of Data Management <strong>Appendix</strong> B (Revised 2010) Page 41 of 129
Function or TaskKeystroke(s), Menu, or ScreenY= editor The Y= editor, accessed by pressing the Y= key, allows youto enter functions for graphing or tabling purposes.Example:To graph y = x 2 , press Y=.Press the variable key X,T,θ,n, followed by x 2 .Choose standard viewing window settings by pressingZOOM 6.You will see the graph of y = x 2 :You may add up to ten functions. You can select or deselectwhether a function is plotted by moving the cursor to the equalsign in the function, and pressing the ENTER key to toggleselection/deselection.Top MenuMHR • Mathematics of Data Management <strong>Appendix</strong> B (Revised 2010) Page 42 of 129
Function or TaskZInterval instructionKeystroke(s), Menu, or ScreenThe ZInterval instruction allows you to find a desiredconfidence interval for the mean from a finite sample of adistribution whose population mean is not known, but whosestandard deviation is known.Example:Suppose that a manufacturer knows that the standard deviationfor the drying time of latex paints is 10.5 min. A sample of20 items are painted, and the mean drying time for the sampleis found to be 75.4 min. What is the 90% confidence intervalfor the mean of the population of paint drying times? Todetermine this, you can use the ZInterval instruction foundunder the STAT TESTS menu.Press STAT and go toTESTS menu. Select 7:ZInterval.Note that you perform the test with either raw Data or Statsalready calculated from a sample. Press the right-arrow andENTER to select the Stats option. Set the remainingparameters as shown:Note that 10.5 is the standard deviation of the distribution,75.4 is the sample mean, 20 is the number of samples, and 0.9is the confidence level desired.Scroll down to Calculate, and press ENTER.Continued on next pageMHR • Mathematics of Data Management <strong>Appendix</strong> B (Revised 2010) Page 43 of 129
You can be 90% certain that the population mean lies betweenabout 71.5 and 79.3. In this same manner, you can calculateconfidence intervals for other confidence levels.The calculation can also be performed using raw Data.Press STAT and go to the TESTS menu. Select 7:ZInterval.This time select the Data option. Note that the parameters youtyped in are still there.Note that the sample data must be entered in L1 (or whateverlist you specify) before attempting to Calculate theconfidence interval.Top MenuMHR • Mathematics of Data Management <strong>Appendix</strong> B (Revised 2010) Page 44 of 129
TI-Nspire CASFunction or Taskbinomcdf(numtrials, p,lowerbound,upperbound)Keystroke(s), Menu, or ScreenThe binomcdf(numtrials, p, lowerbound,upperbound)function allows you to calculate the probability that anexperiment whose only possible outcomes are success orfailure, with a probability of success given by p, achieves fromlowerbound to upperbound successes in the number of trialsgiven by numtrials.Example 1:A die is rolled ten times. What is the probability of getting fiveor fewer 2s?Press menu. Select Statistics/Distributions/binomCdf.Enter values as shown and press OK.The probability is about 0.997, as shown.Continued on next pageMHR • Mathematics of Data Management <strong>Appendix</strong> B (Revised 2010) Page 45 of 129
Example 2:What is the probability of rolling three, four or five 2s in 10trials? Enter the numbers as shown and press OK.The probability is approximately 0.222, as shown.Top MenuMHR • Mathematics of Data Management <strong>Appendix</strong> B (Revised 2010) Page 46 of 129
Function or Taskbinompdf(numtrials, p, x)Keystroke(s), Menu, or ScreenThe binompdf(numtrials, p, x) function allows you tocalculate the probability that an experiment whose onlypossible outcomes are success or failure, with a probability ofsuccess given by p, achieves x successes in the number oftrials given by numtrials.Example 1:A die is rolled ten times. What is the probability of gettingexactly five or fewer 2s?Press menu. Select Statistics/Distributions/binomPdf.Enter values as shown and press OK.The probability is approximately 0.013, as shown.Example 2:Suppose that you want the probabilities of getting exactly 3, 4or 5 twos. Enter the x values in brace brackets, separated bycommas. Then, press OK.Continued on next pageMHR • Mathematics of Data Management <strong>Appendix</strong> B (Revised 2010) Page 47 of 129
The probabilities are displayed as shown.You can copy the list of probabilities by pressing ctrl C,and paste it into the formula box of a spreadsheet columnby pressing ctrl C.The probabilities are displayed as entries in the column,as shown.This is useful if you want to use the probabilities in afurther analysis.Top MenuMHR • Mathematics of Data Management <strong>Appendix</strong> B (Revised 2010) Page 48 of 129
Function or TaskBox and Whisker PlotKeystroke(s), Menu, or ScreenTo create a Box-and-Whisker plot, use a Lists & Spreadsheetpage to enter a list of data.Example: The ten members of a club have ages 23, 34, 45,32, 35, 42,48,51,26 and 44.Open a Lists & Spreadsheet page. Label column A as age.Enter the ages.Then, open a Data & Statistics page.Click at the bottom of the page, and select the variable Age.A dot plot will be displayed.From the Plot Type menu, select Box Plot.The box plot will be displayed.Move the cursor over the plot to display values for theminimum, first quartile, median, third quartile, and maximum.Top MenuMHR • Mathematics of Data Management <strong>Appendix</strong> B (Revised 2010) Page 49 of 129
Function or TaskCombinations nCr(n,r)Keystroke(s), Menu, or ScreenTo calculate a combination, use the nCr(n,r) functionavailable under the Probability menu.Example:Evaluate the number of subsets of 10 objects taken 7 at a time,or 10 choose 7.Select Combinations, and type 10,7 between the brackets.Press enter.The answer 120 will be displayed.Top MenuMHR • Mathematics of Data Management <strong>Appendix</strong> B (Revised 2010) Page 50 of 129
Function or TaskzIntervalKeystroke(s), Menu, or ScreenThe zInterval calculation allows you to find a desiredconfidence interval for the mean from a finite sample of adistribution whose population mean is not known, but whosestandard deviation is known.Example:Suppose that a manufacturer knows that the standard deviationfor the drying time of latex paints is 10.5 min. A sample of 20items are painted, and the mean drying time for the sample isfound to be 75.4 min. What is the 90% confidence interval forthe mean of the population of paint drying times?From the Statistics/Confidence Intervals menu, selectzInterval.For the Data Input Method, select Stats. Press OK.Enter the data for the paint drying times, and select aconfidence interval of 90%.Press OK.The 90% confidence interval will be displayed.Top MenuMHR • Mathematics of Data Management <strong>Appendix</strong> B (Revised 2010) Page 51 of 129
Function or Taskfactorial(!)Keystroke(s), Menu, or ScreenTo calculate a factorial, select the factorial(!) functionavailable under the Probability menu.Example:Evaluate 8!.Type 8, then select the factorial(!) function. Press enter.The answer 40 320 will be displayed.Note: The limit for a factorial calculation is 449!Top MenuFunction or TaskapproxFraction()Keystroke(s), Menu, or ScreenSuppose you want to display a decimal number such as 0.5 asa fraction.Type 0.5.From the Number menu, select Approximate to Fraction.Press enter.The fraction will be displayed.Top MenuMHR • Mathematics of Data Management <strong>Appendix</strong> B (Revised 2010) Page 52 of 129
Function or TaskgeomPdf(p,x)Keystroke(s), Menu, or ScreenThe geomPdf(p,x) function will return the probability that thefirst success of an event with probability p will occur on trial x.Example:Consider the probability that the first roll of doubles on a pairof dice occurs on the fourth roll. In this case p = 1 6and x = 4.From the Statistics/Distributions menu, select GeometricPdf.Enter the probability and trial number as shown.Press OK.There is a probability of approximately 0.096 that the firstdoubles will occur on the fourth roll of the dice.Top MenuMHR • Mathematics of Data Management <strong>Appendix</strong> B (Revised 2010) Page 53 of 129
Function or TaskIntersectionKeystroke(s), Menu, or ScreenYou can use the Intersection function to find the point ofintersection of two lines or curves.Example 1:Open a Graphs page.Plot the functions f1 = 2x + 3 and f2 = -3x + 1.From the Analyze menu, select Intersection.Move the cursor to the left of the intersection, and left-click.Move the cursor to the right of the intersection, and left-click.The point of intersection and its coordinates will be displayed.This procedure will also work with other functions. If there ismore than one point of intersection, find them one at a time.Top MenuMHR • Mathematics of Data Management <strong>Appendix</strong> B (Revised 2010) Page 54 of 129
Function or TaskLinear RegressionKeystroke(s), Menu, or ScreenYou can use linear regression if your scatter plot resembles alinear function.Example:Open a Lists & Spreadsheet page.Label column A as day, and enter the integers 0, 1, 2, 3, and 4.Label column B as height_cm and enter the numbers 1.2, 4.3,6.5, 10.8 and 12.5.Open a Data & Statistics page. Select day for the x-axis, andheight_cm for the y-axis. The scatter plot will be displayed.From the Analyze/Regression menu, selectShow Linear (mx + b).The linear regression line and its equation will be displayed.If you do not need the graph, you can also determine theregression line on the Lists & Spreadsheets page. Return tothis page, and move the cursor to cell C1.Continued on next pageMHR • Mathematics of Data Management <strong>Appendix</strong> B (Revised 2010) Page 55 of 129
From the Statistics/Stat Calculations menu, select LinearRegression (mx+b).Select day for the X List, and height_cm for the Y List.Select OK. The parameters for the line of best fit will bedisplayed.Scroll down to view the correlation coefficient r.Top MenuMHR • Mathematics of Data Management <strong>Appendix</strong> B (Revised 2010) Page 56 of 129
Function or Taskmean(list)Keystroke(s), Menu, or ScreenThe mean(list) function calculates the mean of a list of data.Example:Open a Lists & Spreadsheet page.Label column A num, and enter the numbers 1, 2, 3 and 4.Open a Calculator page.From the Statistics/List Math menu, select Mean.Type num between the brackets, and press enter.The mean of the numbers will be displayed.Note: the mean is displayed in exact form. If you would like adecimal approximation, press ctrl before pressing enter.Top MenuFunction or Taskmedian(list)Keystroke(s), Menu, or ScreenThe median(list) function calculates the median of a list ofdata.Example:Open a Lists & Spreadsheet page. Label column A num, andenter the numbers 1, 2, 3, 4, 5, 6 and 7.Open a Calculator page.From the Statistics/List Math menu, select Median.Type num between the brackets, and press enter.The median of the numbers will be displayed.Top MenuMHR • Mathematics of Data Management <strong>Appendix</strong> B (Revised 2010) Page 57 of 129
Function or TasknormCdf(lowerbound,upperbound,mean,standarddeviation)Keystroke(s), Menu, or ScreenThe normCdf(lowerbound,upperbound,mean,standarddeviation) function calculates the probability that a givendata point lies between a lower bound and an upperbound using a normal distribution with a given mean andstandard deviation.Example:An IQ test has a mean of 100 and a standard deviation of 10.You would like to determine the probability that a givenparticipant scored between 90 and 115.From the Statistics/Distributions menu, select Normal Cdf.Enter the lower bound, upper bound, mean, and standarddeviation as shown. Select OK.The probability that a given participant scored between 90 and115 is about 0.77.If you want to include the left or right tail as one of thebounds, set the lower bound to –∞ for the left tail or the upperbound to ∞. You can find the ∞symbol on a chart accessed bypressing ctrl before pressing the Catalog key.Top MenuMHR • Mathematics of Data Management <strong>Appendix</strong> B (Revised 2010) Page 58 of 129
Function or TasknormPdf(x,mean,standarddeviation)Keystroke(s), Menu, or ScreenThe normPdf(x,mean,standard deviation) functioncomputes the probability density function at a specifiedx-value using a normal distribution with a given meanand standard deviation.Example:An IQ test has a mean of 100 and a standard deviation of 10.Determine the probability density function at a value ofx = 110.From the Statistics/Distributions menu, select Normal Pdf.Enter the x-value, mean, and standard deviation as shown.Select OK.The probability that a given participant has an IQ of 110 isapproximately 0.024.Top MenuMHR • Mathematics of Data Management <strong>Appendix</strong> B (Revised 2010) Page 59 of 129
Function or TaskinvNorm(area,mean,standard deviation)Keystroke(s), Menu, or ScreenThe invNorm(area,mean,standard deviation) functioncalculates the x-value that matches a given probability using anormal distribution with a given mean and standard deviation.Example 1:An IQ test has a mean of 100 and a standard deviation of 10.There is a probability of 0.454 that a given participant scoresat or below a particular IQ. Determine this IQ.From the Statistics/Distributions menu, select InverseNormal. Enter the given probability for the Area, mean, andstandard deviation as shown.Select OK. The desired IQ is about 98.8.Top MenuMHR • Mathematics of Data Management <strong>Appendix</strong> B (Revised 2010) Page 60 of 129
Function or TaskNormal Probability PlotKeystroke(s), Menu, or ScreenYou can check whether a list of data is normally distributed bymaking a plot of the data versus the z-scores of the data.Example:The ten members of a club have ages 23, 34, 45, 32, 35,42,48,51,26 and 44. Are the ages normally distributed?Enter the ages in a Lists & Spreadsheet page.Then, open a Data & Statistics page. A plot will be displayed.Click at the bottom of the plot, and select the variable age.From the Plot Type menu, select Normal Probability Plot.The normal probability plot graphs ages against the z-scores ofthe ages. Since the points form close to a straight line, the dataare likely normally distributed.If the plot deviates significantly from a straight line, the dataare likely not normally distributed.Top MenuMHR • Mathematics of Data Management <strong>Appendix</strong> B (Revised 2010) Page 61 of 129
Function or TaskShade NormalKeystroke(s), Menu, or ScreenYou can shade the graph of a normal distribution to representthe area being calculated by the normCdf() function.Example 1:An IQ test has a mean of 100 and a standard deviation of 10.Display and shade the probability density function that a givenparticipant scored between 90 and 115.Open a Lists & Spreadsheet page. Select cell A1.From the Statistics/Distributions menu, select Normal Cdf.Enter the values as shown, and check the Shade area box.Select OK.The probability and shaded graph is displayed. You can adjustthe border between the spreadsheet and the graph to displaymore of the graph.Top MenuMHR • Mathematics of Data Management <strong>Appendix</strong> B (Revised 2010) Page 62 of 129
Function or TaskOne-Variable StatisticsKeystroke(s), Menu, or ScreenThe TI-Nspire CAS can calculate one-variable statistics for alist of numbersExample 1:Ten automobiles were tested for fuel economy, and werefound to burn the following amounts of fuel, measured in litresper 100 km:8.4, 5.0, 4.8, 5.9, 7.3, 8.2, 6.4, 8.1, 9.5, 4.2Open a Lists & Spreadsheet page.Label column A1 l_100km and enter the data.Select cell B1. From the Statistics/Stat Calculations menu,select One-Variable Statistics. Set Num of Lists to 1.Select OK.Set X1 List: to l_100km.Select OK.A set of one-variable statistics for the fuel economy data willbe displayed. Scroll down to view all of the statistics.Continued on next pageMHR • Mathematics of Data Management <strong>Appendix</strong> B (Revised 2010) Page 63 of 129
Top MenuFunction or TaskcumulativeSum(list)Keystroke(s), Menu, or ScreenThe cumulativeSum(list) function calculates the cumulativesum of the elements in a list. It is useful for calculatingcumulative frequency for a distribution.Example 1:Ten automobiles were tested for fuel economy, and werefound to burn the following amounts of fuel, measured in litresper 100 km:8.4, 5.0, 4.8, 5.9, 7.3, 8.2, 6.4, 8.1, 9.5, 4.2Open a Lists & Spreadsheet page.Label column A1 l_100km and enter the data.Label column B cs.In the formula cell for column B, enter the formulacumulativeSum(l_100km). Press enter.The cumulative sums of the fuel economy data will bedisplayed.Top MenuMHR • Mathematics of Data Management <strong>Appendix</strong> B (Revised 2010) Page 64 of 129
Function or Taskproduct(list,start,end)Keystroke(s), Menu, or ScreenThe product(list,start,end) function is used to find theproduct of the elements of a list beginning with element startand finishing with element end. If start and end are notspecified, then the entire list is used.Example:Open a Lists & Spreadsheet page. Label column A as num.Enter the list of numbers 1, 2, 3, 4 and 5.Select cell B1. Enter the formula =product(num,2,4).Press enter.The product of the second to the fourth elements will bedisplayed.Top MenuFunction or Taskseq(expression, variable,low¸ high, step)Keystroke(s), Menu, or ScreenYou can use the seq(expression, variable, low¸ high, step)function to create a list of numbers with various properties. Ifthe value of step is not specified, it is assumed to be one.Example:Enter a list of the squares of all of the odd numbers from 5 to11 inclusive.Open a Lists & Spreadsheet page. Label column A as num.Select the formula cell for column A.Type seq(x 2 ,x,5,11,2) and press enter.The desired sequence will be displayed.Top MenuMHR • Mathematics of Data Management <strong>Appendix</strong> B (Revised 2010) Page 65 of 129
Function or TasksortKeystroke(s), Menu, or ScreenExample:You have the numbers 6, 2, 4, 3, and 8 in a list, and wish tosort them into ascending order.Open Lists & Spreadsheet page. Label column A as num.Enter the numbers in column A. Select the range of numbers.From the Action menu, select Sort, then Ascending. SelectOK. The list will be displayed in ascending order.You can also choose to sort in descending order.Top MenuMHR • Mathematics of Data Management <strong>Appendix</strong> B (Revised 2010) Page 66 of 129
Function or Tasksum(list,start,end)Keystroke(s), Menu, or ScreenThe sum(list,start,end function is used to find the sum of theelements of a list beginning with element start and finishingwith element end. If start and end are not specified, then theentire list is used.Example:Open a Lists & Spreadsheet page and label column A as num.Enter the list of numbers 1, 2, 3, 4 and 5.Select cell B1.Enter the formula =sum(num,2,4). Press enter.The sum of the 2nd to the 4th elements will be displayed.Top MenuFunction or TaskPermutations nPr(n,r)Keystroke(s), Menu, or ScreenTo calculate a combination, use the nPr(n,r) functionavailable under the Probability menu.Example:Evaluate the number of arrangements of 10 objects taken 7 ata time.Select Permutations, and type 10,7 between the brackets.Press enter.The answer 604 800 will be displayed.Top MenuMHR • Mathematics of Data Management <strong>Appendix</strong> B (Revised 2010) Page 67 of 129
Function or Taskrand(numtrials)Keystroke(s), Menu, or ScreenRandom numbers can be generated using the rand(numtrials)function. The function is followed by an optional parameternumtrials which defaults to 1. Each use of the function returnsa real number greater than 0 but less than 1. You can usemultipliers to generate other real numbers.Example 1:Suppose that you call the rand function by itself. You get arandom number between 0 and 1.Example 2:Suppose that you want three random numbers between 0 and1. Type 3 between the brackets.You can store the numbers directly to a list. Create a Lists &Spreadsheet page, and label column A as num. Then, type thefunction, press ctrl var to access sto, and type num. The sixnumbers will appear as a list.Example 3:Suppose that you want a real number greater than 0 but lessthan 100. Use the multiplier 100 with the rand function, asshown.Top MenuMHR • Mathematics of Data Management <strong>Appendix</strong> B (Revised 2010) Page 68 of 129
Function or TaskrandInt(lowerbound,upperbound,numtrials)Keystroke(s), Menu, or ScreenTo generate random integers, use the functionrandInt(lowerbound,upperbound,numtrials).Example:Generate six random integers between 5 and 10 inclusive.Type randInt(5, 10, 6) and press enter.Six random integers between 5 and 10 will be displayed.You can store the numbers directly to a list. Create a Lists &Spreadsheet page, and label column A as num. Then, type thefunction, press ctrl var to access sto, and type num. The sixnumbers will appear as a list.Top MenuMHR • Mathematics of Data Management <strong>Appendix</strong> B (Revised 2010) Page 69 of 129
Function or TaskrandNorm(µ,σ,numtrials)Keystroke(s), Menu, or ScreenTo generate random numbers from a normal distribution witha mean µ and a standard deviation σ, use the functionrandNorm(µ,σ,numtrials).Example:Choose six random numbers from a normal distribution with amean of 100 and a standard deviation of 10.Type randNorm(100, 10, 6) and press enter.Six random numbers from the distribution will be displayed.You can store the numbers directly to a list. Create a Lists &Spreadsheet page, and label column A as num. Then, type thefunction, press ctrl var to access sto, and type num. The sixnumbers will appear as a list.Top MenuMHR • Mathematics of Data Management <strong>Appendix</strong> B (Revised 2010) Page 70 of 129
Function or TaskRandSeed numberKeystroke(s), Menu, or ScreenA Note About Seeds: Whenever you use one of the randomnumber functions, you will always generate the same series ofrandom numbers. You can generate a different series ofnumbers by using the RandSeed number function. Picksomething unique for the parameter number, perhaps acombination of your age and street number.Top MenuFunction or TaskKeystroke(s), Menu, or Screenround(expression,numdigits) You can round a number or a variable using theround(expression,numdigits) function.Example:Round the result of dividing 3 by 7 to 4 digits.The answer is 0.4286.You can also use a defined variable as the expression, asshown.Top MenuMHR • Mathematics of Data Management <strong>Appendix</strong> B (Revised 2010) Page 71 of 129
Function or Taskscatter plotsKeystroke(s), Menu, or ScreenYou can create a scatter plot from two-variable data.Open a new Lists & Spreadsheet page. Enter labels andnumbers in columns A and B as shown.Open a Graphs page. From the Graph Type menu, selectScatter Plot. Use the var key to insert client as the x-variable,and age as the y-variable.From the Window menu, select Zoom – Data. The scatterplot will be displayed.Top MenuMHR • Mathematics of Data Management <strong>Appendix</strong> B (Revised 2010) Page 72 of 129
stDevSamp(list)You can determine the standard deviation of a list using thestDevSamp(list) function.Example:Determine the standard deviation of the data {1,2,3,4,5,6,7}.Open a Lists & Spreadsheet page. Lable column A as num.Enter the numbers 1, 2, 3, 4, 5, 6, 7 into column A.Select cell B1.Enter the formula =stDevSamp(num) and press enter.Note that the standard deviation is expressed in exact form.Select cell B2, and type =approx(b1). Press enter.The approximate standard deviation will be displayed.Alternatively, you can combine the two functions in one cell.Top MenuMHR • Mathematics of Data Management <strong>Appendix</strong> B (Revised 2010) Page 73 of 129
varSamp(list)You can determine the variance of a list using thevarSamp(list) function.Example:Determine the variance of the data {1,2,3,4,5,6,7}.Open a Lists & Spreadsheet page. Lable column A as num.Enter the numbers 1, 2, 3, 4, 5, 6, 7 into column A.Select cell B1.Enter the formula =varSamp(num) and press enter.Note that the variance is expressed in exact form.Select cell B2, and type =approx(b1). Press enter.The approximate variance will be displayed.Alternatively, you can combine the two functions in one cell.Top MenuMHR • Mathematics of Data Management <strong>Appendix</strong> B (Revised 2010) Page 74 of 129
SpreadsheetsFunction or TaskAdd WorksheetsMicrosoft® Excel:Insert/WorksheetCorel® Quattro® Pro:Insert/SheetKeystroke(s), Menu, or ScreenMicrosoft® Excel:If a new worksheet is required, right-click on the desiredSheet tab at the bottom and choose Insert, then Worksheet.You can also use this method to delete a worksheet, rename it,or insert other items.Corel® Quattro® Pro:If a new worksheet is required choose Insert/Sheet. The newworksheet will be inserted before the currently selectedworksheet. Simply drag the TAB for a worksheet to move it inthe worksheet list.Top MenuMHR • Mathematics of Data Management <strong>Appendix</strong> B (Revised 2010) Page 75 of 129
Function or TaskAverage functionMicrosoft® Excel:=AVERAGE(array)Corel® Quattro® Pro:@AVG(array)Keystroke(s), Menu, or ScreenMicrosoft® Excel:The average function is =AVERAGE(array).Example:Find the average of 6, 7, 8, 9, and 10.In cell A1 type =AVERAGE(6,7,8,9,10) and press Enter.The result will be 8.To find the average of cells B1 through B10, in cell A1 type=AVERAGE(B1:B10) and press Enter.Corel® Quattro® Pro:The average function is @AVERAGE(array).Example:Find the average of 6, 7, 8, 9, and 10.In cell A1 type @AVG(6,7,8,9,10) and press Enter.The result will be 8.To find the average of cells B1 through B10, in cell A1 type@AVG(B1..B10) and press Enter.Top MenuMHR • Mathematics of Data Management <strong>Appendix</strong> B (Revised 2010) Page 76 of 129
Function or TaskBinomial Distribution functionMicrosoft® Excel:=BINOMDIST(x,n,p,cumulative)Corel® Quattro® Pro:@BINOMDIST(x,n,p,cumulative)Keystroke(s), Menu, or ScreenThe BINOMDIST function returns the binomialdistribution probability of an individual term. It returnsthe probability of getting exactly x successes in n trialsof a binomial distribution where the probability ofsuccess on each trial is p.Example:Consider the rolling of two dice 20 times. What is theprobability of rolling exactly four doubles?In this case, x = 4, n = 20 and p = 1/6.Hence, BINOMDIST (4,20,1/6,FALSE) will return avalue of approximately 0.202.If you want the cumulative probability, i.e., theprobability of getting at least 4 doubles in 20 trials,change the last parameter to TRUE. In this example, thecumulative probability is about 0.769.Top MenuFunction or TaskChart/Graph featureInsert/Chart…Keystroke(s), Menu, or ScreenTo make a chart (graph) select the range of x and y data,including the column headings, and then choose Insert. Selectthe type of chart you want.Step through the Chart Wizard, supplying the information asrequired.In Corel® Quattro® Pro you will need to choose an area onthe worksheet to put the graph.Top MenuMHR • Mathematics of Data Management <strong>Appendix</strong> B (Revised 2010) Page 77 of 129
Function or TaskCombinations functionMicrosoft® Excel:=COMBIN(n,r)Corel® Quattro® Pro:@COMB(r,n)Keystroke(s), Menu, or ScreenMicrosoft® Excel:The n C r function is =COMBIN(n,r).Example:To find 10 C 7 , in cell A1 type =COMBIN(10,7) and pressEnter. The result will be 120.Corel® Quattro® Pro:The n C r function is @COMB(r,n).Example:Notice how the n and r are in counter-intuitive positions.In cell A1 type @COMB(7,10) and press Enter. The resultwill be 120.Top MenuMHR • Mathematics of Data Management <strong>Appendix</strong> B (Revised 2010) Page 78 of 129
Function or TaskCorrelation CoefficientfunctionMicrosoft® Excel:=CORREL(array1,array2)Corel® Quattro® Pro:@CORREL(array1,array2)Keystroke(s), Menu, or ScreenThe correlation coefficient for two attributes may becalculated using the correlation function CORREL.Microsoft® Excel:=CORREL(array1,array2)Example:Enter the data as shown below.In cell C1 enter =CORREL(A1:A5,B1:B5).The result will be approximately 0.987.Corel® Quattro® Pro:@CORREL(array1,array2)Example:Enter the data as shown below.In cell C1 enter @CORREL(A1:A5,B1:B5).The result will be approximately 0.987Top MenuMHR • Mathematics of Data Management <strong>Appendix</strong> B (Revised 2010) Page 79 of 129
Function or TaskCOUNTIF functionMicrosoft® Excel:=COUNTIF(array,value)Corel® Quattro® Pro:@COUNTIF(array,value)Keystroke(s), Menu, or ScreenThe COUNTIF function will count the number of cells in anarray that match a value.Microsoft® Excel:=COUNTIF(array,value)Example:Enter the data as shown below.In cell C1 enter @COUNTIF(B1:B6,”f”)The result should be 4.Corel® Quattro® Pro:=COUNTIF(array,value)Example:Enter the data as shown below.In cell C1 enter @COUNTIF(B1:B6,”f”)The result should be 4.Top MenuMHR • Mathematics of Data Management <strong>Appendix</strong> B (Revised 2010) Page 80 of 129
Function or TaskFactorial functionMicrosoft® Excel:=FACT(n)Corel® Quattro® Pro:@FACT(n)Keystroke(s), Menu, or ScreenMicrosoft® Excel:The n! function is =FACT(n).Example:To find 8!, in cell A1 type =FACT(8) and press Enter.The result will be 40 320.Note: Microsoft® Excel has a maximum: 170! = 7.3 × 10 306Corel® Quattro® Pro:The n! function is @FACT(n).Example:To find 8!, in cell A1 type @FACT(8) and press Enter.The result will be 40 320.Note: Corel® Quattro® Pro has a maximum: 170! = 7.3 ×10 306 Top MenuMHR • Mathematics of Data Management <strong>Appendix</strong> B (Revised 2010) Page 81 of 129
Function or TaskFill featureMicrosoft® Excel:Edit/Fill/Series…Corel® Quattro® Pro:Edit/Fill/Fill Series…Keystroke(s), Menu, or ScreenMany times you need cells filled with a series. The series maybe linear or a growth.Microsoft® Excel:Example:Suppose you need to fill a series of cells with a series such as2, 4, 8, … 1 048 576. Enter 1 into cell A1.Now choose cells A1 through A21.In the Editing Group, select Fill, then Series... .Select Growth and a step value of 2 and press OK.The desired series will be displayed in cells A1 to A21.Corel® Quattro® Pro:Example:Suppose you need to fill a series of cells with a series such as2, 4, 8, … 1 048 576. Enter 1 into cell A1.Choose cells A1 through A21 and select Edit/Fill/FillSeries… .Enter a starting value of 1, a step value of 2, and a stop valueof 1 048 576. Now choose Growth and press OK.Top MenuMHR • Mathematics of Data Management <strong>Appendix</strong> B (Revised 2010) Page 82 of 129
Function or TaskFiltered searchMicrosoft® Excel:Data/Filter/Auto FilterCorel® Quattro® Pro:Tools/QuickFilterKeystroke(s), Menu, or ScreenQuite often it is necessary to display cells whose value meetcertain criteria.Microsoft® Excel:Example:Enter and then select the data as shown below:Click on the Data tab, and select Filter.Choose the Gender filter by selecting the down arrow besideword Gender. Uncheck all but the “f” box. Now only thefemales are displayed.If you recheck all boxes, then all names are displayed.Next choose the Name filter. Select Text Filter, then CustomFilter… .).Now fill in the dialog box as shown and click on OK:Continued on next pageMHR • Mathematics of Data Management <strong>Appendix</strong> B (Revised 2010) Page 83 of 129
Persons with names after “d” in the alphabet will be displayed.Choose Data then Filter to turn off the filtering.Corel® Quattro® Pro:Enter and then select the data:Choose Tools/QuickFilter.Choose the Gender filter by selecting the down arrow besideword Gender. Choose “f”. Now only the females are displayed.Now choose (Show All) under the Gender filter. All namesare displayed.Next choose the Name filter. Select (Custom…). Now fill inthe dialog box as follows and click on OK:Persons with names after “d” in the alphabet will be displayed.Choose Tools/QuickFilter to turn off the filtering.Top MenuMHR • Mathematics of Data Management <strong>Appendix</strong> B (Revised 2010) Page 84 of 129
Function or TaskFraction formattingMicrosoft® Excel:Format Cells…/FractionCorel® Quattro® Pro:Format/Selection…/FractionKeystroke(s), Menu, or ScreenMicrosoft® Excel:To display real numbers as fractions select the cells.Right-click the selection, and choose Format Cells.Press the Number tab, and select Fraction.Adjust the number of digits as required, and press OK.Corel® Quattro® Pro:To display real numbers as fractions select the cells then useFormat/Selection…/Fraction. Within the dialog box set thedenominator required.Top MenuMHR • Mathematics of Data Management <strong>Appendix</strong> B (Revised 2010) Page 85 of 129
Function or TaskInteger TruncationfunctionMicrosoft® Excel:=INT(n)Corel® Quattro® Pro:@INT(n)Keystroke(s), Menu, or ScreenMicrosoft® Excel:The Integer Truncation function is =INT(n).Example:To convert 8.7 to an integer, in cell A1 type =INT(8.7) andpress Enter. The result will be 8.Note: The INT function simply removes the decimal portionof the number without rounding. If you want proper rounding,use =ROUND(n,d).Corel® Quattro® Pro:The Integer Truncation function is @INT(n).Example:To convert 8.7 to an integer, in cell A1 type @INT(8.7) andpress Enter. The result will be 8.Note: The INT function simply removes the decimal portionof the number without rounding. If you want proper rounding,use @ROUND(n,d).Top MenuMHR • Mathematics of Data Management <strong>Appendix</strong> B (Revised 2010) Page 86 of 129
Function or TaskLine of Best FitKeystroke(s), Menu, or ScreenMicrosoft® Excel:Example:The raw data of an experiment is shown.Use the Chart feature to create a scatter plot.Right-click on a data point, and select Add Trendline... .Choose Linear. Check the boxes for Display Equationon chart and Display R-squared value on chart, andclose the box.The line of best fit will be displayed, along with theequation and the coefficient of determination.Corel® Quattro® Pro:Example:Enter the raw data into a spreadsheet.Use the Chart feature to create a scatter plot.Then, select Tools/Numeric Tools/Regression. Enter thecell ranges for the data, and the program will displayregression calculations for the line of best fit.Top MenuMHR • Mathematics of Data Management <strong>Appendix</strong> B (Revised 2010) Page 87 of 129
Function or TaskMaximum Value functionMicrosoft® Excel:=MAX(array)Corel® Quattro® Pro:@MAX(array)Keystroke(s), Menu, or ScreenMicrosoft® Excel:The maximum value function is =MAX(array).Example:To determine the maximum value in a series such as from cellA1 to A15, in cell B1 enter =MAX(A1:A15) and press Enter.Corel® Quattro® Pro:The Maximum Value function is: @MAX(array).Example:To determine the maximum value in a series such as from cellA1 to A15, in cell B1 enter @MAX(A1:A15) and pressEnter.Top MenuMHR • Mathematics of Data Management <strong>Appendix</strong> B (Revised 2010) Page 88 of 129
Function or TaskMean Value functionCorel® Quattro® Pro:@MEAN(array)see also averageKeystroke(s), Menu, or ScreenCorel® Quattro® Pro:The Mean Value function is: @MEAN(array).Example:To determine the mean value in a series or matrix such asfrom cell A1 to A15, in cell B1 enter @Mean(A1:A15) andpress Enter.Top MenuFunction or TaskMedianMicrosoft® Excel:=MEDIAN(array)Corel® Quattro® Pro:Keystroke(s), Menu, or ScreenMicrosoft® Excel:The median function is: =MEDIAN(array).Example:To determine the median of a series such as from cell A1 toA10, in cell B1 enter =MEDIAN(A1:A10) and press Enter.@MEDIAN(array)Corel® Quattro® Pro:The median function is: @MEDIAN(array).Example:To determine the median of a series such as from cell A1 toA10, in cell B1 enter @MEDIAN(A1..A10) and press Enter.Top MenuMHR • Mathematics of Data Management <strong>Appendix</strong> B (Revised 2010) Page 89 of 129
Function or TaskModeMicrosoft® Excel:=MODE(array)Corel® Quattro® Pro:Keystroke(s), Menu, or ScreenMicrosoft® Excel:The mode function is =MODE(array).Example:To determine the mode of a series such as from cell A1 toA10, in cell B1 enter =MODE(A1:A10) and press Enter.@MODE(array)Corel® Quattro® Pro:The mode function is @MODE(array).Example:To determine the standard deviation of a series such as fromcell A1 to A10, in cell B1 enter @MODE(A1..A10) andpress Enter.Top MenuMHR • Mathematics of Data Management <strong>Appendix</strong> B (Revised 2010) Page 90 of 129
Function or TaskNormal Distribution:Calculating ValuesMicrosoft® Excel:= NORMDIST(boundary,mean, standarddeviation,cumulative)Corel® Quattro® Pro:Keystroke(s), Menu, or ScreenMicrosoft® Excel:The NORMDIST(boundary, mean, standarddeviation,TRUE) function allows you to calculate theprobability that a given data point lies below a boundary usinga normal distribution with a given mean and standarddeviation.To calculate the probability that a given data point liesbetween a lower boundary and upper boundary set up yourspreadsheet as follows:@NORMDIST(boundary,mean, standard deviation,1)In cell C8 type “=NORMDIST(C2,C4,C5,TRUE)” to find theupper boundary probability.In cell C9 type “=NORMDIST(C3,C4,C5,TRUE)” to find thelower boundary probability.In cell C10 type “=C8-C9” to find the probability that a givendata point lies between the lower boundary and upperboundary.The result will be displayed.Continued on next pageMHR • Mathematics of Data Management <strong>Appendix</strong> B (Revised 2010) Page 91 of 129
Corel® Quattro® Pro:The @NORMDIST(boundary, mean, standard deviation,1)function allows you to calculate the probability that a givendata point lies below a boundary using a normal distributionwith a given mean and standard deviation.To calculate the probability that a given data point liesbetween a lower boundary and upper boundary set up yourspreadsheet as follows:In cell C9 type: “@NORMDIST(C3,C4,C5,1)” to find theupper boundary probability.In cell C10 type: “@NORMDIST(C2,C4,C5,1)” to find thelower boundary probability.In cell C11 type: “+C9-C10” to find the probability that agiven data point lies between the lower boundary and upperboundary.The result will be displayed.Top MenuMHR • Mathematics of Data Management <strong>Appendix</strong> B (Revised 2010) Page 92 of 129
Function or TaskPermutations nPr:Keystroke(s), Menu, or ScreenMicrosoft® Excel:Microsoft® Excel: The nPr function for Excel is =PERMUT(n,r).Example:=PERMUT(n,r) Calculate 10 P 7 .Corel® Quattro® Pro:In cell A1 type =PERMUT(10,7). Press Enter.The result will be 604 800.@PERMUT(n,r)Corel® Quattro® Pro:The nPr function for Quattro Pro is @PERMUT(n,r).Notice that unlike the @COMB function the n and r arein intuitive positions.In cell A1 type @PERMUT(10,7). Press Enter.The result will be 604 800.Top MenuMHR • Mathematics of Data Management <strong>Appendix</strong> B (Revised 2010) Page 93 of 129
Function or TaskRandom IntegersMicrosoft® Excel:=RANDBETWEEN(lower,upper)Corel® Quattro® Pro:Keystroke(s), Menu, or ScreenMicrosoft® Excel:=lower+round(diff*rand(),0)Example:Generate a random integer from 6 to 10.Type =RANDBETWEEN(6,10)@RANDBETWEEN(lower,upper)Copy the formula to other cells to generate more randomintegers.Corel® Quattro® Pro:@RANDBETWEEN(lower,upper)Example:Generate a random integer from 6 to 10.Type @RANDBETWEEN(6,10)Copy the formula to other cells to generate more randomintegers.Top MenuMHR • Mathematics of Data Management <strong>Appendix</strong> B (Revised 2010) Page 94 of 129
Function or TaskRandom Real NumbersMicrosoft® Excel:=RAND()Keystroke(s), Menu, or ScreenMicrosoft® Excel:=rand()There is no argument for this function. Simply type thefunction into any cell.Corel® Quattro® Pro: =rand() will generate a real number from 0 to 1.=6*rand() will generate a real number from 0 to 6.@RANDCorel® Quattro® Pro:@RANDThere is no argument for this function. Simply type thefunction into any cell.+@rand() will generate a real number from 0 to 1.+6*@rand() will generate a real number from 0 to 6.Top MenuMHR • Mathematics of Data Management <strong>Appendix</strong> B (Revised 2010) Page 95 of 129
Function or TaskReferences:Relative ReferencingAbsolute ReferencingMixed ReferencingKeystroke(s), Menu, or ScreenIn spreadsheets there are two types of referencing:relative referencing These are references to cells that arerelative to the position of the formula.absolute referencing These are references to cells that alwaysrefer to a cells specific location. Depending on the task youwant to perform in a spreadsheet, you can use either. If adollar sign precedes the letter or the number, such as $B$7, thecolumn and row reference is absolute.Note: Relative references automatically adjust when you copythem, while absolute references always point at the same cell.Mixed referencesIf you copy the following reference down a column, B$7, thenthe resulting formulae will always refer to cell B7, because therow has an absolute reference. But, if you copy the formulaacross a row then the resulting formulae will reference row 7absolutely and will reference column B relatively.Top MenuMHR • Mathematics of Data Management <strong>Appendix</strong> B (Revised 2010) Page 96 of 129
Function or TaskReferences:data from cells in anotherworksheetKeystroke(s), Menu, or ScreenTo reference data that exists in another worksheet or file isvery similar to accessing data on a single work sheet.Microsoft® Excel:Example:Suppose that you have two worksheets. In Sheet 2 cell B2must be equal to cell A1 in Sheet 1.Do the following: Select B2 on Sheet 2 (where the data isgoing to). Press “=”. Now select Sheet 1 and then cell A1 andpress Enter. Sheet 2, cell B2 will now be equal to Sheet 1 cellA1. The formula in Sheet 2, cell B2 will be: =Sheet1!A1Corel® Quattro® Pro:Example:Suppose that you have two worksheets. In Sheet B cell B2must be equal to cell A1 in Sheet A.Do the following: Select B2 on Sheet B (where the data isgoing to). Press “+”. Now select Sheet A and then cell A1 andpress Enter. Sheet B, cell B2 will now be equal to Sheet Acell A1. The formula in Sheet B, cell B2 will be: +A:A1Top MenuMHR • Mathematics of Data Management <strong>Appendix</strong> B (Revised 2010) Page 97 of 129
Function or TaskRound functionMicrosoft® Excel:=ROUND(n,d)Corel® Quattro® Pro:Keystroke(s), Menu, or ScreenMicrosoft® Excel:The rounding function is =ROUND(n,d).Example:To round 8.787 to one decimal place, in cell A1 type=ROUND(8.787,1). Press Enter. The result will be 8.8.@ROUND(n,d)Corel® Quattro® Pro:The rounding function is: @ROUND(n,d).Example:To round 8.787 to one decimal place, in cell A1 type@ROUND(8.787,1). Press Enter. The result will be 8.8.Top MenuFunction or TaskSearchKeystroke(s), Menu, or ScreenThe search function is accessed by pressing CTRL-F.Top MenuFunction or TaskSort featureMicrosoft® Excel:Data/Sort..Corel® Quattro® Pro:Tools/Sort..Keystroke(s), Menu, or ScreenMicrosoft® Excel:Select the range of cells you want to sort.Right-click on the selection, and choose Sort.Select the type of sort desired.The sorted data will be displayed.Corel® Quattro® Pro:The sort feature is available through the Tools menu: Selectthe range of cells you need to sort then choose Tools/Sort... .Top MenuMHR • Mathematics of Data Management <strong>Appendix</strong> B (Revised 2010) Page 98 of 129
Function or TaskStandard DeviationMicrosoft® Excel:=STDEV(array)Corel® Quattro® Pro:@STDEV(array)Keystroke(s), Menu, or ScreenMicrosoft® Excel:The standard deviation function is =STDEV(array).Example:Determine the standard deviation of values listed in cells A1to A10.In cell B1, enter =STDEV(A1:A10). Press Enter.Corel® Quattro® Pro:The standard deviation function is @STDEV(array).Example:Determine the standard deviation of values listed in cells A1to A10.In cell B1, enter @STDEV(A1..A10). Press Enter.Top MenuMHR • Mathematics of Data Management <strong>Appendix</strong> B (Revised 2010) Page 99 of 129
Function or TaskSum of Values functionMicrosoft® Excel:=SUM(array)Corel® Quattro® Pro:Keystroke(s), Menu, or ScreenMicrosoft® Excel:The sum function is: =SUM(array).Example:Determine the sum of the values in cell A1 to A10.In cell B1, enter =SUM(A1:A10). Press Enter.@SUM(array)Corel® Quattro® Pro:The sum of values function is @SUM(array).Example:To determine the sum of the values in cell A1 to A10, in cellB1 enter @SUM(A1:A10). Press Enter.Top MenuMHR • Mathematics of Data Management <strong>Appendix</strong> B (Revised 2010) Page 100 of 129
Function or TaskVarianceMicrosoft® Excel:=VAR(array)Corel® Quattro® Pro:@VARS(array)Keystroke(s), Menu, or ScreenMicrosoft® Excel:The variance function is =VAR(array).Example:Determine the standard deviation of the values in cell A1 toA10.In cell B1 enter =VAR(A1:A10). Press Enter.Corel® Quattro® Pro:The variance of a sample function is @VARS(array).Example:To determine the standard deviation of the values in cell A1 toA10, in cell B1 enter @VARS(A1..A10). Press Enter.Top MenuMHR • Mathematics of Data Management <strong>Appendix</strong> B (Revised 2010) Page 101 of 129
Fathom 2Function or TaskbinomialCumulative()functionbinomialCumulative(x,n,p,min,max)Keystroke(s), Menu, or ScreenThe binomialCumulative() function is found under theFunctions – Distributions – Binomial menu. This functionreturns the probability of getting x or fewer successes in ntrials of a binomial distribution where the probability ofsuccess on each trial is p. Normally, x will take on valuesfrom 0 to n. However, if min and max are specified, then thevalue of x will go from min to max in steps of (max – min)/n.Example:Consider the rolling of two dice 20 times. What is theprobability of rolling up to four doubles?In this case, x = 4, n = 20 and p = 1 6 . Hence,binomialCumulative(4,20,1/6) will return a value ofapproximately 0.769.You can use this function in a case table to create a table ofcumulative probabilities as shown.Top MenuMHR • Mathematics of Data Management <strong>Appendix</strong> B (Revised 2010) Page 102 of 129
Function or TaskBinomialProbability()functionbinomialProbability(x,n,p,min,max)Keystroke(s), Menu, or ScreenThe binomialProbability() function is found under theFunctions – Distributions – Binomial menu. This functionreturns the probability of getting exactly x successes in n trialsof a binomial distribution where the probability of success oneach trial is p.Example:Consider the rolling of two dice 20 times. What is theprobability of rolling exactly four doubles?In this case, x = 4, n = 20 and p = 1 6 . Hence,binomialProbability(4,20,1/6) will return a value ofapproximately 0.202.You can use this function in a case table to create a table ofprobabilities as shown:Top MenuMHR • Mathematics of Data Management <strong>Appendix</strong> B (Revised 2010) Page 103 of 129
Function or Taskcase tableKeystroke(s), Menu, or ScreenFathom keeps data for a particular collection in a case tablewhich is linked to that collection.Run Fathom and open a new document. Drag a collection boxto the workspace. Note that it is called Collection 1.Now drag a case table to the workspace. Notice that it islinked to Collection 1.Now that you have a case table you can specify the attributesyou want to keep track of. Suppose that this collection willcontain information about the CDs that you own. One attributemight be the title of the CD. Double click on , and typein Title. Under Title, you can add in the CD titles that youown. Your screen should look like this:In a similar manner you can add other attributes, like Artist,Number of Tracks, or whatever else is important.Data can also be copied from other Windows applications tothe clipboard, and pasted into a case table.Top MenuMHR • Mathematics of Data Management <strong>Appendix</strong> B (Revised 2010) Page 104 of 129
Function or TaskcaseIndexKeystroke(s), Menu, or ScreenThe caseIndex function located under Functions – Special islike the “row number” in a spreadsheet.Example:Suppose that you want an attribute which runs from 1 to 20,perhaps to be used in the calculation of another attribute.Start Fathom and open a new document. Drag a collection tothe workspace.Drag a case table to the workspace. Double click on and rename it Index. Right-click on Index, and select EditFormula. Type caseIndex, and select OK.Right-click on casethe case table , select New Cases and typein 20. Notice that the Index attribute is now numbered from 1to 20, as shown.Top MenuMHR • Mathematics of Data Management <strong>Appendix</strong> B (Revised 2010) Page 105 of 129
Function or Taskcollection boxKeystroke(s), Menu, or ScreenFathom keeps track of the data entered into it using thecollection metaphor. Each collection is identified by acollection box that may be named in such a way as to identifythe collection.Example:Suppose that you wanted to keep track of your CD collectionin Fathom. Start Fathom and open a new document. Drag acollection box to the workspace.Notice that its default name is Collection 1. Double click onthe name. In the dialog box, type an appropriate name, likeCD Collection. You can now add a case table withappropriate attributes for your collection.Top MenuFunction or TaskCombinations functioncombinations(n,r)Keystroke(s), Menu, or ScreenThe combinations function or n C r is: combinations (n,r).Example:To evaluate the number of subsets of 10 objects taken 7 at atime, or 10 choose 7, create a new collection and a collectiontable with attributes n, r, and nCr.Right click on the nCr attribute and choose Edit Formula.Now choose Functions, Arithmetic, Combinations. Doubleclick on combinations. Choose Attributes and double-clickon n. Press “,” and then double click on r. Click on Apply andthen click OK.Top MenuMHR • Mathematics of Data Management <strong>Appendix</strong> B (Revised 2010) Page 106 of 129
Function or Taskcorrelation coefficientKeystroke(s), Menu, or ScreenThe correlation coefficient for two attributes may becalculated using the correlation function under the Functions– Statistical – Two Attributes menu.Example:Create a collection and case table for Height versusShoeSize, as shown in the screen shot below.Double click on the collection box to open the Inspector, andselect the Measures tab. Create a measure calledCorrelation.Right click under the Formula column in the Correlationrow, and select Edit Formula. Select the correlation functionunder the Functions – Statistical – Two Attributes menu,and type Height,ShoeSize between the brackets. Click OK.Note that you get a correlation coefficient of about 0.987between Height and ShoeSize.Top MenuMHR • Mathematics of Data Management <strong>Appendix</strong> B (Revised 2010) Page 107 of 129
Function or Taskcount functionKeystroke(s), Menu, or ScreenWhen given a list of data for an attribute, Fathom can counthow many times a specific condition occurs using the countfunction under Functions – Statistical – One Attribute.Example:Suppose that you have a collection of data on the students inyour school, and you would like to count how many have anentry of 16 in the attribute Age.Run Fathom and open a new document. Drag a collection andthen a case table to the workspace.Rename the attribute to Age, and enter ages of 14, 15,16, 15, 17, 16, 15, 18, 16 and 17.Double click on the collection box to open the Inspector.Select the Measures tab, and rename to Age16.Right click in the Formula column in the Age16 row, andselect the count function under Functions – Statistical – OneAttribute. Between the brackets, add in the conditionAge=16. Click OK.Notice that the value changes to 3, the number of occurrencesof age 16, as shown:Top MenuMHR • Mathematics of Data Management <strong>Appendix</strong> B (Revised 2010) Page 108 of 129
Function or TaskfilterKeystroke(s), Menu, or ScreenA filter may be added to an object in order to select only asubset of the data that is of interest.Example:Create a collection and a case table as shown.Suppose that you want to show only shoe sizes greater than10. Right-click on the case table, and select Add Filter.Then, type in the condition ShoeSize>10 and click OK.Your display will be adjusted like this:Top MenuMHR • Mathematics of Data Management <strong>Appendix</strong> B (Revised 2010) Page 109 of 129
Function or Taskgraph iconKeystroke(s), Menu, or ScreenThe graph icon is the third selection on the tool shelf, to theright of the collection box icon and the case table icon.You can create a new graph by clicking on the graph icon,holding the left mouse button down, and dragging it onto theworkspace.You can then drag attributes from a case table to the axes ofthe graph.Top MenuMHR • Mathematics of Data Management <strong>Appendix</strong> B (Revised 2010) Page 110 of 129
Function or TaskInspectorKeystroke(s), Menu, or ScreenThe Inspector for a collection may be opened by doubleclickingon the collection box. A new window will appear,with several panes. The first pane is the Cases pane, as shown:This pane allows you to inspect the collection case by case,and is particularly useful for collections that have manyattributes.The second pane is the Measures pane, which allows you todefine measures for the collection, such as the mean,correlation coefficient, some of which are describedelsewhere in this appendix.The third pane is the Comments pane, which allows you toadd comments relevant to the collection, as shown below:Continued on next pageMHR • Mathematics of Data Management <strong>Appendix</strong> B (Revised 2010) Page 111 of 129
The fourth pane is the Display pane, which allows you tocontrol how the data for a collection appears on the screen.More detail on how to program this feature is available in theFathom Reference Manual.The fifth pane is the Categories pane, which allows you toassign a category set to one or more attributes to define thevalid values for those attributes. More detail on how toprogram this feature is available in the Fathom ReferenceManual.Top MenuMHR • Mathematics of Data Management <strong>Appendix</strong> B (Revised 2010) Page 112 of 129
Function or Taskinterquartile rangeiqr(attribute)Keystroke(s), Menu, or ScreenThe interquartile range function found under the Functions– Statistical – One Attribute menu is used to calculate theinterquartile range for an attribute.Create a collection and case table as shown in the screenshot.Double click on the collection box to open the Inspector forthe collection, and select the Measures tab. Rename to InterQuartile.Right click on the Formula column for the InterQuartilemeasure, and select Edit Formula.Select the iqr() function under the Functions - Statistical –One Attribute menu, and type Marks between the brackets.You will see the interquartile range calculated under Value.The semi interquartile range is half of the interquartilerange.Top MenuMHR • Mathematics of Data Management <strong>Appendix</strong> B (Revised 2010) Page 113 of 129
Function or Tasklinear regressionKeystroke(s), Menu, or ScreenFathom generates a linear regression line when it graphsdata.Set up a new collection as shown.Graph the data as a scatter plot. Right click on the graph andchoose Least-Squares Line. You should now see:The equation of best fit is y = 2.91x + 1.2 with a coefficient ofdetermination r 2 = 0.99.Top MenuMHR • Mathematics of Data Management <strong>Appendix</strong> B (Revised 2010) Page 114 of 129
Function or Taskmean()Keystroke(s), Menu, or ScreenThe mean() function found under the Functions – Statistical– One Attribute menu is used to calculate the mean of anattribute.Create a collection and case table as shown.Double click on the collection box to open the Inspector forthe collection, and select the Measures tab. Rename toMean.Right click on the Formula column for the Mean measure,and select Edit Formula.Select the mean() function under the Functions − Statistical– One Attribute menu, and type Size between the brackets.You will see the mean calculated under Value, as shown.Top MenuMHR • Mathematics of Data Management <strong>Appendix</strong> B (Revised 2010) Page 115 of 129
Function or TaskmedianKeystroke(s), Menu, or ScreenThe median function found under the Functions – Statistical– One Attribute menu is used to calculate the median for anattribute.Create a collection and case table as shown.Double-click on the collection box to open the Inspector forthe collection, and select the Measures tab. Rename toMedian.Right click on the Formula column for the Median measure,and select Edit Formula.Select the median function under the Functions − Statistical– One Attribute menu, and type Marks between the brackets.You will see the median calculated under Value, as shown.Top MenuMHR • Mathematics of Data Management <strong>Appendix</strong> B (Revised 2010) Page 116 of 129
Function or TaskmodeKeystroke(s), Menu, or ScreenThere is no mode function in Fathom. You can find the modefor an attribute a by following the procedure for the medianand then using the formula given below. The derivation of thisformula is beyond the scope of this appendix.mean( a, rank (a) – uniqueRank (a) = max (rank (a) –uniqueRank (a)))Another way to find the mode is to sort the attribute a andthen scroll down the column looking for values that occurmultiple times.Top MenuFunction or TasknormalCumulativefunctionnormalCumulative (x,mean, standard deviation)Keystroke(s), Menu, or ScreenThe normalCumulative function under the Functions –Distributions – Normal menu allows you to calculate theprobability that a given data point is less than x using a normaldistribution with a given mean and standard deviation.Example:Suppose that a particular model of tire has a life with a meanof 64 000 km and standard deviation of 8000 km. What isthe probability that a tire will wear out at 60 000 km or less?Create a collection box and a case table as shown.Right click on the Probability attribute, and select thenormalCumulative function under the Functions –Distributions – Normal menu.Add Distance,64000,8000 between the brackets.The probability that a tire will wear out at 60 000 km or less isabout 0.309.Top MenuMHR • Mathematics of Data Management <strong>Appendix</strong> B (Revised 2010) Page 117 of 129
Function or TasknormalQuantile functionnormalQuantile(p, mean,standard deviation)Keystroke(s), Menu, or ScreenThe normalQuantile function under the Functions –Distributions – Normal menu is the opposite of thenormalCumulative function. Given a probability p, it allowsyou to calculate the value of x using a normal distribution witha given mean and standard deviation such that the probabilitythat a given data point is less than or equal to x is p.Example:Suppose that a particular model of tire has a life with a meanof 64 000 km and standard deviation of 8000 km. WhatDistance will see 25% of the tires wear out? Create acollection box and a case table as shown.Right-click on the Distance attribute, and select thenormalQuantile function under the Functions –Distributions – Normal menu.Add Probability,64000,8000 between the brackets.You can expect 25% of the tires to wear out by 58 604 km.Top MenuFunction or TaskpermutationsKeystroke(s), Menu, or ScreenFathom does not have a dedicated permutations function.To calculate the number of permutations of n objects taken r ata time, use the combinations function, and divide by r!.Top MenuMHR • Mathematics of Data Management <strong>Appendix</strong> B (Revised 2010) Page 118 of 129
Function or TaskquartilesKeystroke(s), Menu, or ScreenThe quartile functions in Fathom are Q1 and Q3, found underthe Functions − Statistical – One Attribute menu.Create a collection and case table as shown.Double-click on the collection box to open the Inspector forthe collection, and select the Measures tab. Rename to Q1.Right-click on the Formula column for the Median measure,and select Edit Formula.Select the Q1 function under the Functions - Statistical –One Attribute menu, and type Marks between the brackets.You will see the first quartile calculated under Value, asshown.You can calculate Q3 in a similar manner.Top MenuMHR • Mathematics of Data Management <strong>Appendix</strong> B (Revised 2010) Page 119 of 129
Function or Taskrandom functionrandom()Keystroke(s), Menu, or ScreenFathom has seventeen different random functions.random() will generate a random real number from 0 to 1.Example:Generate ten random numbers from 0 to 1.Open a new collection.Create a new case table.Double-click on the attribute and rename it Random.To add ten new cases, right-click on the Random attributeand select New Cases…Type in 10 and press Enter.Right-click on the Random attribute and choose EditFormula.Choose FunctionsDouble-click on random.Click OK.You now have 10 random real numbers between 0 and 1.If you use random(100), you will get numbers between 0 and100. If you use random(–10,10), you will get numbersbetween –10 and 10.Top MenuMHR • Mathematics of Data Management <strong>Appendix</strong> B (Revised 2010) Page 120 of 129
Function or TaskrandomInteger functionrandomInteger(lower,upper)Keystroke(s), Menu, or ScreenThe randomInteger function will generate random integersfrom lower to upper.Example:Generate 20 random numbers from 6 to 10.Open a new collection.Create a new case table.Double-click on the attribute and rename itRandomInt.To add twenty new cases, right click on the RandomIntattribute and select New Cases…Type in 20 and press Enter.To generate the random numbers, right-click the RandomIntattribute and choose Edit Formula.Now choose Functions.Double click on randomInteger.Type 6,10 between the brackets.Click OK.You now have 20 random numbers between 6 and 10.Top MenuMHR • Mathematics of Data Management <strong>Appendix</strong> B (Revised 2010) Page 121 of 129
Function or TaskrandomNormal functionrandomNormal(mean,standard deviation)Keystroke(s), Menu, or ScreenThe randomNormal function will generate random numbersfrom a normal distribution with a given mean and a givenstandard deviation.Example:Generate twenty random numbers from a normal distributionwith a mean of 100 and a standard deviation of 10.Open a new collection.Create a new case table.Double-click on the attribute and rename itRandomNorm.To add twenty new cases, right-click- on the RandomNormattribute and select New Cases…Type in 20 and press Enter.To generate the random numbers, right-click on theRandomNorm attribute and choose Edit Formula.Now choose Functions.Double-click on randomNorm.Type 100,10 between the brackets.Click OK.You now have 20 random numbers from a normal distributionwith a mean of 100 and a standard deviation of 10.Top MenuMHR • Mathematics of Data Management <strong>Appendix</strong> B (Revised 2010) Page 122 of 129
Function or Taskscatter plotKeystroke(s), Menu, or ScreenYou can draw a scatter plot by dragging attributes from acase table to a graph.Example:Create a collection and a case table as shown.Drag a Graph from the tool shelf to the workspace.Drag the Mass attribute to the horizontal axis of the graph.Drag the FuelBurn attribute to the vertical axis of the graph.A scatter plot will be displayed as shown.Top MenuMHR • Mathematics of Data Management <strong>Appendix</strong> B (Revised 2010) Page 123 of 129
Function or TasksortKeystroke(s), Menu, or ScreenYou can sort the entries in a case table using the SortAscending and Sort Descending functionsCreate a collection and case table as shown.Right-click on the Test attribute and select Sort Ascending.You will see the data sorted like this:If you want the data sorted in descending order, select SortDescending from the Data menu.Top MenuMHR • Mathematics of Data Management <strong>Appendix</strong> B (Revised 2010) Page 124 of 129
Function or TaskStdDev()Keystroke(s), Menu, or ScreenThe StdDev() function found under the Functions –Statistical – One Attribute menu is used to calculate thestandard deviation of an attribute.Example:Create a collection and case table as shown.Double-click on the collection box to open the Inspector forthe collection, and select the Measures tab. Rename to StdDev.Right-click on the Formula column for the StdDev measure,and select Edit Formula.Select the stdDev() function under the Functions − Statistical– One Attribute menu, and type Size between the brackets.You will see the standard deviation calculated under Value, asshown.Top MenuMHR • Mathematics of Data Management <strong>Appendix</strong> B (Revised 2010) Page 125 of 129
Function or Tasksum functionKeystroke(s), Menu, or ScreenThe sum function under the Functions − Statistical – OneAttribute menu can be used to find the sum of the entriesunder an attribute.Example:Create a collection and case table as shown.Double-click on the collection to open the Inpector, andrename to Sum.Right-click the Formula column at the Sum row and selectEdit Formula.Select the sum function under the Functions − Statistical –One Attribute menu and type Test between the brackets.You will see the value of 366 under the Value column.Top MenuMHR • Mathematics of Data Management <strong>Appendix</strong> B (Revised 2010) Page 126 of 129
Function or TaskuniqueRank() functionKeystroke(s), Menu, or ScreenThe uniqueRank() function under the Functions −Statistical – Transformations menu is used to rank theentries in an Attribute column of a case table.Example:Create a collection and a case table as shown.Right-click on the Rank attribute, and select Edit Formula.Select uniqueRank() from the Functions − Statistical –Transformations menu and add ShoeSize between thebrackets.The Rank attribute will now show the ranking of each entryunder the ShoeSize attribute.Note: if the ShoeSize attribute is sorted before applying theuniqueRank() function, then the ranks will be in order.Top MenuMHR • Mathematics of Data Management <strong>Appendix</strong> B (Revised 2010) Page 127 of 129
Function or Taskvariance()Keystroke(s), Menu, or ScreenThe variance() function under the Functions − Statistical –One Attribute menu computes the variance, or square of thestandard deviation.Example:Create a collection and case table as shown.Double-click on the collection box to open the Inspector forthe collection, and select the Measures tab. Rename to Variance.Right-click on the Formula column for the Variancemeasure, and select Edit Formula.Select the variance function under the Functions − Statistical– One Attribute menu, and type Size between the brackets.You will see the variance calculated under Value, as shown.Top MenuMHR • Mathematics of Data Management <strong>Appendix</strong> B (Revised 2010) Page 128 of 129
Function or TaskzScore functionalso known assampleZscoreKeystroke(s), Menu, or ScreenThe zScore function under the Functions − Statistical –Transformations menu calculates how many samplestandard deviations a value is from the mean.For example, if a sample has a mean of 100 and a standarddeviation of 10, then a value of 120 has a zScore of 2.Example:Create a collection and a case table as shown.Right-click on the zScore attribute, and select Edit Formula.Select zScore() from the Functions − Statistical –Transformations menu.Type Wechsler between the brackets.The zScore for each entry in the Wechsler attribute is nowdisplayed in the zScore attribute column.Top MenuMHR • Mathematics of Data Management <strong>Appendix</strong> B (Revised 2010) Page 129 of 129