Technology Appendix - McGraw-Hill Ryerson
Technology Appendix - McGraw-Hill Ryerson
Technology Appendix - McGraw-Hill Ryerson

You also want an ePaper? Increase the reach of your titles
YUMPU automatically turns print PDFs into web optimized ePapers that Google loves.
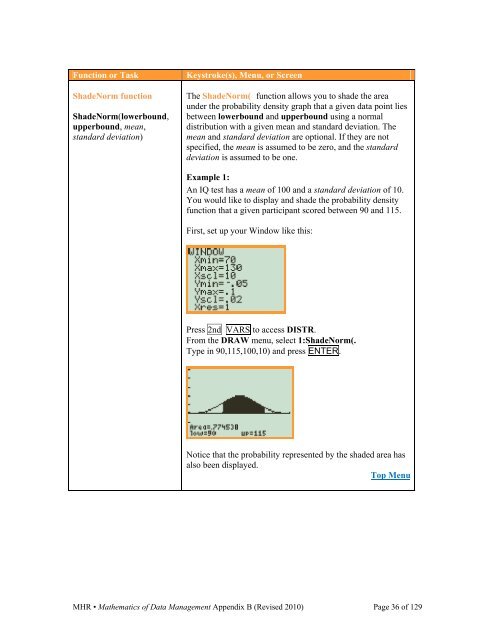
Function or TaskShadeNorm functionShadeNorm(lowerbound,upperbound, mean,standard deviation)Keystroke(s), Menu, or ScreenThe ShadeNorm( function allows you to shade the areaunder the probability density graph that a given data point liesbetween lowerbound and upperbound using a normaldistribution with a given mean and standard deviation. Themean and standard deviation are optional. If they are notspecified, the mean is assumed to be zero, and the standarddeviation is assumed to be one.Example 1:An IQ test has a mean of 100 and a standard deviation of 10.You would like to display and shade the probability densityfunction that a given participant scored between 90 and 115.First, set up your Window like this:Press 2nd VARS to access DISTR.From the DRAW menu, select 1:ShadeNorm(.Type in 90,115,100,10) and press ENTER.Notice that the probability represented by the shaded area hasalso been displayed.Top MenuMHR • Mathematics of Data Management <strong>Appendix</strong> B (Revised 2010) Page 36 of 129