Technology Appendix - McGraw-Hill Ryerson
Technology Appendix - McGraw-Hill Ryerson
Technology Appendix - McGraw-Hill Ryerson

Create successful ePaper yourself
Turn your PDF publications into a flip-book with our unique Google optimized e-Paper software.
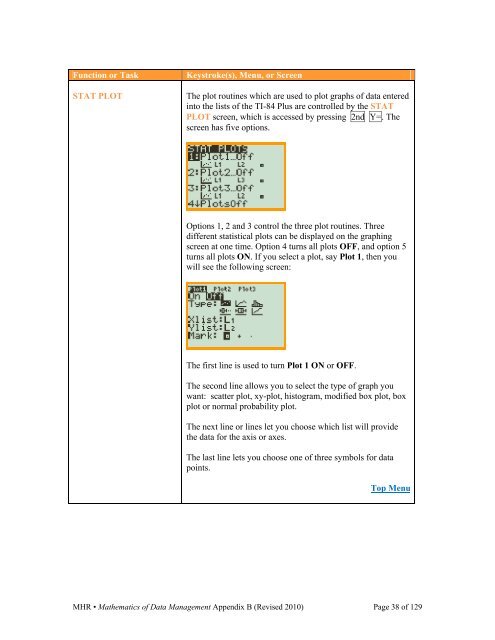
Function or TaskSTAT PLOTKeystroke(s), Menu, or ScreenThe plot routines which are used to plot graphs of data enteredinto the lists of the TI-84 Plus are controlled by the STATPLOT screen, which is accessed by pressing 2nd Y=. Thescreen has five options.Options 1, 2 and 3 control the three plot routines. Threedifferent statistical plots can be displayed on the graphingscreen at one time. Option 4 turns all plots OFF, and option 5turns all plots ON. If you select a plot, say Plot 1, then youwill see the following screen:The first line is used to turn Plot 1 ON or OFF.The second line allows you to select the type of graph youwant: scatter plot, xy-plot, histogram, modified box plot, boxplot or normal probability plot.The next line or lines let you choose which list will providethe data for the axis or axes.The last line lets you choose one of three symbols for datapoints.Top MenuMHR • Mathematics of Data Management <strong>Appendix</strong> B (Revised 2010) Page 38 of 129