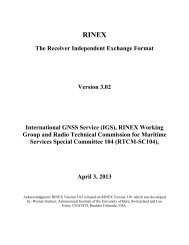
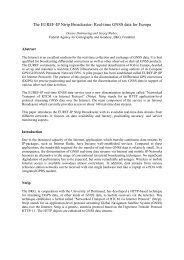
Thus, there is the potential of feedback to the scientific community in return for the servicerole provided to the surveying community. With a sufficiently dense network in southernCalifornia, satellite clock information, tropospheric and possibly ionospheric correctionscould also be made available.As an example of this scenario, we choose the two newest stations in the PGGA, LakeMathews in Riverside County and Pales Verdes in the Los Angeles Basin, about 90 kmapart (Figure 7). We consider Lake Mathews the known site (base station) and PalesVerdes a new site to be surveyed. The surveyor requires the base (RINEX) data for LakeMathews and Pales Verdes, the (time-tagged) coordinates of Lake Mathews and the <strong>IGS</strong>orbits for the period of the survey. Figure 8 demonstrates the precision that can beobtained in this scenario for the coordinates of the Pales Verdes site with a single 24-houroccupation. It shows the time history of 4 months of daily solutions using GAMIT, S10orbits (generated independently of these two sites), and ITRF91 coordinates for LakeMathews. The rms scatter of the baseline components from is 2,6 mm in north, 3,4 mm ineast, and 13.9 mm in the vertical, which is more than an order of magnitude better thanusing the broadcast ephemerides [Zhang, 1993].As another example, Tsuji et al. [1993] use the JPL precise ephemerides (as distributed bythe <strong>IGS</strong>) as fixed parameters, and estimate the daily coordinates of a regional network ofMinimac receivers in Japan for a period spanning June 1992 to August 1993. The globalnetwork site, Usuda, was also used as a single “common station” in the regional analysis.The resulting regional baseline was reported to be 1 to 2 parts in 10s in all threecomponents over distances of 1000 km. The cpu time for the daily data reduction of the 5-station regional array was 10 minutes using the GIPSY/OASIS-11 software on aHP900W735 workstation, which is over an order of magnitude less time than it would havetaken with a full global approach.Scenario 2. A multi-year project measures crustal deformation by running several weeklong, epoch-type campaigns every 1-2 years. To analyze a campaign <strong>IGS</strong> (clean RINEX)data simultaneously visible from the surveyed region are retrieved, including stationcoordinates and velocities, satellite initial conditions for the days of the survey, and thesolution files from the global <strong>IGS</strong> analysis. The survey data are analyzed simultaneouslywith the regional subset of the <strong>IGS</strong> data with orbit improvement to produce a second set ofsolution files, using the same physical models (software) and the epoch of the satelliteinitial conditions. The two sets of solution files can be combined easily to produce a set ofcoordinates for the survey stations with respect to the ITRF. Station velocities arecomputed by combining repeated measurements of the crustal deformation network.As an example, we refer to an ongoing project to measure crustal deformation across thetectonically active Indonesian archipelago [Purztodewo et al., 1993]. In 1991 and 1992a 6-station network was surveyed in Irian Jaya, the western part of the island of New Guinea,spanning the plate boundary between the Australian and Pacific Plates (Figure 9). In 1991,the data were analyzed in a simultaneous adjustment of global tracking and regional datasince the total number of stations was manageable. In 1992, the analysis was divided intotwo steps. In the first step, the Irian Jaya data were analyzed (10 stations in 1992) withdata from all <strong>IGS</strong> stations that had mutual visibility with those sites. Since the complete<strong>IGS</strong> data set analyzed at S10 was available in clean RINEX format, it was an easy exerciseto,clean thg Irian Jaya data with the subset of the <strong>IGS</strong> data (incidentally, this ensured thatthe data could be processed later in any combination without any further editing). Initialconditions for the satellite state vectors were obtained from the <strong>IGS</strong> orbits and asimultaneous adjustment of the Irian Jaya and regional <strong>IGS</strong> data with orbit improvementwas performed. Using three sets of solution files (the 1991 set, the 1992 total <strong>IGS</strong> set, and83
40 4North RMS = 2.44 mm20]1-MATH to PVEPBaseline length 90466.319 m160. ‘ “’’’’’>’’’’’’’’’’”’’’’’’”-40:East RMS=3.81mm20:.0 ;*~1-20 -j140 160 180 200 220 240 260-20:-40:-60 1 I I I I 1 1r140 160 180 200 220 240 260-603, .7+, . . . . . .1 . . . . . . . . . ,,..,.~140 160 180 200 220 240 26060j--’’’o’---’’’I’’.’..’ ~~Length RMS=3.73mm40:20:0 ;&~z-20:-40:day number, 1993-60 I 1 I I 1 I I140 160 180 200 220 240 260Figure 8. Time series for daily baseline determinations between the PGGA sitesat LakeMathews (MATH) and Pales Verdes (PVEP), in terms of north, east, and verticalcomponents and length. Each point represents a solution based on 24 hours of data.84
- Page 1 and 2:
●INTERNATIONAL ASSOCIATION OF GEO
- Page 3 and 4:
TABLE OF CONTENTS.FINAL AGENDA . .
- Page 5 and 6:
13:30 NGS14:00 S1014:30 EMR15:00 CO
- Page 7 and 8:
LIST OF PARTICIPANTS:Prof. Gerhard
- Page 10 and 11:
Table 1. Current IGS Analysis Cente
- Page 12 and 13:
The first field identifies the reco
- Page 14 and 15:
Summary InformationThe third produc
- Page 16 and 17:
From Figure 1 we find that there ar
- Page 18:
to define a reference clock in thei
- Page 22 and 23:
SESSION 2(IGS orbit products)
- Page 24 and 25:
1. introductionThe main objectives
- Page 26 and 27:
ecause of the above averaging. This
- Page 28 and 29:
RMS per center (m)o 0 0 0 0 0 oA0Iv
- Page 30:
Scale (ppb)I I I I I 11+-b~ul0Amo&I
- Page 33 and 34:
and NGS. Note that the day to day v
- Page 35 and 36: Rotation around X-axis (mas)1&0 0o
- Page 37 and 38: discussed in Section 3 are here see
- Page 39 and 40: -----------------------------------
- Page 41 and 42: Residuals in Meters1 1 1 1 1 1 1=%m
- Page 43 and 44: Residuals inMeters11111cnficJJw-o A
- Page 45 and 46: I I I—Residuals in Meters..—.
- Page 47 and 48: 1111ResidualsMeters,—{44
- Page 49 and 50: Residuals in MetersI I I II I I IIc
- Page 51 and 52: Rms in MetersI 1 ! I 1 10 n0 a0n.ff
- Page 53 and 54: IGS- and the COM-sets, but that the
- Page 55 and 56: Table 4.1 N.A. Baseline Repeatabili
- Page 57 and 58: ..Figure 5.1:Clock solutions for FA
- Page 59 and 60: specifically the preanalysis can be
- Page 61 and 62: discussion, a question as to whethe
- Page 63 and 64: SUMMARY OF SESSION 3This Session be
- Page 65 and 66: IGS POSITION PAPER, IGS ANALYSIS CE
- Page 67 and 68: and Earth orientation parameters (E
- Page 69 and 70: LbPIERS and IGSCentral Bureausand D
- Page 71 and 72: @ IGS will develop instructions, an
- Page 73: 2.2 Analysis Center System DesignFi
- Page 76 and 77: applied to the solution in order to
- Page 78 and 79: ..standard deviations. This is conv
- Page 80 and 81: known, the two solutions will be ad
- Page 82 and 83: errors, and can therefore be used a
- Page 84 and 85: International Terrestrial Reference
- Page 88 and 89: 90” 100” 110” 120” 130” 1
- Page 91 and 92: adiation parameters for each satell
- Page 93 and 94: Bock, Y., R.I. Abbot, C.C. Counselm
- Page 95 and 96: SUMMARY OF SESSION 4This session st
- Page 97 and 98: INTERNATIONAL EARTH ROTATION SERVIC
- Page 99 and 100: x- differences with IERS0.001”I I
- Page 101 and 102: SUMMARY OF SESSION 5In the last ses
- Page 103 and 104: 1) I(X3 PROCESSING/REPORTS/FORMATSS
- Page 105 and 106: IGS should foster and encourage reg
- Page 107 and 108: ..INTERNATIONAL GPS SERVICE FORGEOD
- Page 109 and 110: ortL.s.4
- Page 111 and 112: 1234567a91011121314IsIt17ItIs2C2122
- Page 113 and 114: . Ruth Neilan16S Central BureauJet
- Page 115 and 116: ON1T.>● Jim ZumbergeJet Propulsio
- Page 117: PROPOSED ORGANIZATION OF THE INTERN