2005 Annual Report / Crédit Agricole (Suisse) SA
2005 Annual Report / Crédit Agricole (Suisse) SA
2005 Annual Report / Crédit Agricole (Suisse) SA
- No tags were found...

Create successful ePaper yourself
Turn your PDF publications into a flip-book with our unique Google optimized e-Paper software.
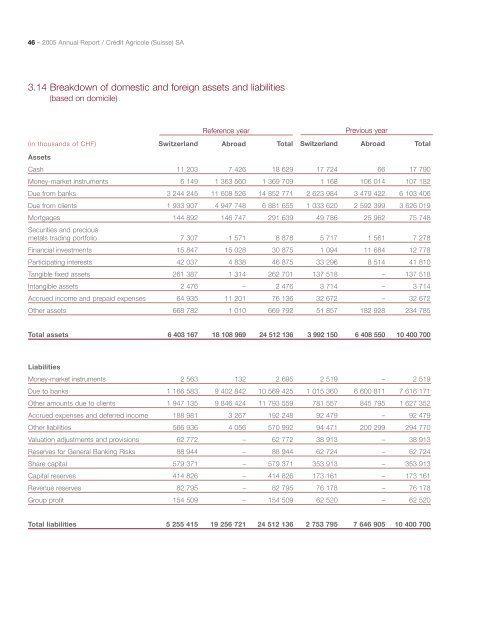
46 – <strong>2005</strong> <strong>Annual</strong> <strong>Report</strong> / Crédit <strong>Agricole</strong> (<strong>Suisse</strong>) <strong>SA</strong>3.14 Breakdown of domestic and foreign assets and liabilities(based on domicile)(in thousands of CHF)AssetsReference yearSwitzerland Abroad TotalPrevious yearSwitzerland Abroad TotalCash 11 203 7 426 18 629 17 724 66 17 790Money-market instruments 6 149 1 363 560 1 369 709 1 168 106 014 107 182Due from banks 3 244 245 11 608 526 14 852 771 2 623 984 3 479 422 6 103 406Due from clients 1 933 907 4 947 748 6 881 655 1 033 620 2 592 399 3 626 019Mortgages 144 892 146 747 291 639 49 786 25 962 75 748Securities and preciousmetals trading portfolio 7 307 1 571 8 878 5 717 1 561 7 278Financial investments 15 847 15 028 30 875 1 094 11 684 12 778Participating interests 42 037 4 838 46 875 33 296 8 514 41 810Tangible fixed assets 261 387 1 314 262 701 137 518 – 137 518Intangible assets 2 476 – 2 476 3 714 – 3 714Accrued income and prepaid expenses 64 935 11 201 76 136 32 672 – 32 672Other assets 668 782 1 010 669 792 51 857 182 928 234 785Total assets 6 403 167 18 108 969 24 512 136 3 992 150 6 408 550 10 400 700LiabilitiesMoney-market instruments 2 563 132 2 695 2 519 – 2 519Due to banks 1 166 583 9 402 842 10 569 425 1 015 360 6 600 811 7 616 171Other amounts due to clients 1 947 135 9 846 424 11 793 559 781 557 845 795 1 627 352Accrued expenses and deferred income 188 981 3 267 192 248 92 479 – 92 479Other liabilities 566 936 4 056 570 992 94 471 200 299 294 770Valuation adjustments and provisions 62 772 – 62 772 38 913 – 38 913Reserves for General Banking Risks 88 944 – 88 944 62 724 – 62 724Share capital 579 371 – 579 371 353 913 – 353 913Capital reserves 414 826 – 414 826 173 161 – 173 161Revenue reserves 82 795 – 82 795 76 178 – 76 178Group profit 154 509 – 154 509 62 520 – 62 520Total liabilities 5 255 415 19 256 721 24 512 136 2 753 795 7 646 905 10 400 700