PART ONE - Campbelltown City Council - NSW Government
PART ONE - Campbelltown City Council - NSW Government
PART ONE - Campbelltown City Council - NSW Government

Create successful ePaper yourself
Turn your PDF publications into a flip-book with our unique Google optimized e-Paper software.
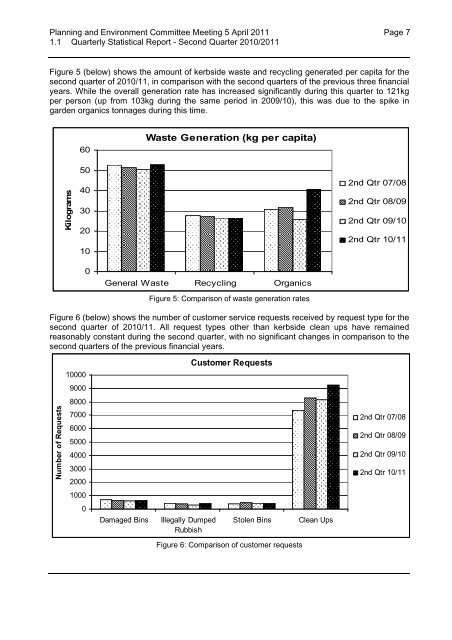
Planning and Environment Committee Meeting 5 April 2011 Page 71.1 Quarterly Statistical Report - Second Quarter 2010/2011Figure 5 (below) shows the amount of kerbside waste and recycling generated per capita for thesecond quarter of 2010/11, in comparison with the second quarters of the previous three financialyears. While the overall generation rate has increased significantly during this quarter to 121kgper person (up from 103kg during the same period in 2009/10), this was due to the spike ingarden organics tonnages during this time.60Waste Generation (kg per capita)Kilograms50403020102nd Qtr 07/082nd Qtr 08/092nd Qtr 09/102nd Qtr 10/110General Waste Recycling OrganicsFigure 5: Comparison of waste generation ratesFigure 6 (below) shows the number of customer service requests received by request type for thesecond quarter of 2010/11. All request types other than kerbside clean ups have remainedreasonably constant during the second quarter, with no significant changes in comparison to thesecond quarters of the previous financial years.10000Customer Requests90008000Number of Requests7000600050004000300020002nd Qtr 07/082nd Qtr 08/092nd Qtr 09/102nd Qtr 10/1110000Damaged BinsIllegally DumpedRubbishStolen BinsClean UpsFigure 6: Comparison of customer requests