Optical Fiber Sensors for Biomedical Applications
Optical Fiber Sensors for Biomedical Applications
Optical Fiber Sensors for Biomedical Applications

Create successful ePaper yourself
Turn your PDF publications into a flip-book with our unique Google optimized e-Paper software.
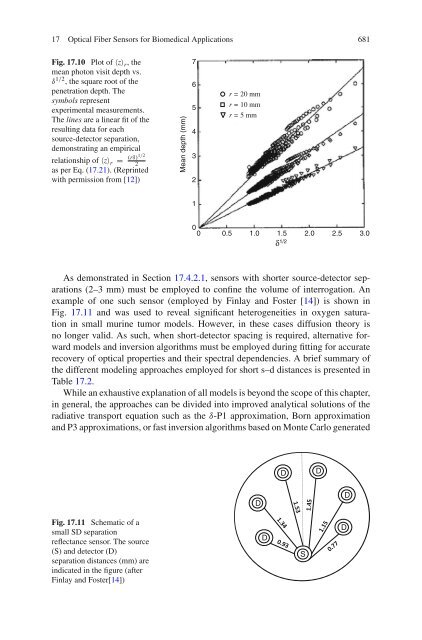
17 <strong>Optical</strong> <strong>Fiber</strong> <strong>Sensors</strong> <strong>for</strong> <strong>Biomedical</strong> <strong>Applications</strong> 681Fig. 17.10 Plot of 〈z〉 r ,themean photon visit depth vs.δ 1/2 , the square root of thepenetration depth. Thesymbols representexperimental measurements.The lines are a linear fit of theresulting data <strong>for</strong> eachsource-detector separation,demonstrating an empiricalrelationship of 〈z〉 r = (rδ)1/22as per Eq. (17.21). (Reprintedwith permission from [12])Mean depth (mm)765432r = 20 mmr = 10 mmr = 5 mm100 0.5 1.0 1.5 2.0 2.5 3.0δ 1/2As demonstrated in Section 17.4.2.1, sensors with shorter source-detector separations(2–3 mm) must be employed to confine the volume of interrogation. Anexample of one such sensor (employed by Finlay and Foster [14]) is shown inFig. 17.11 and was used to reveal significant heterogeneities in oxygen saturationin small murine tumor models. However, in these cases diffusion theory isno longer valid. As such, when short-detector spacing is required, alternative <strong>for</strong>wardmodels and inversion algorithms must be employed during fitting <strong>for</strong> accuraterecovery of optical properties and their spectral dependencies. A brief summary ofthe different modeling approaches employed <strong>for</strong> short s–d distances is presented inTable 17.2.While an exhaustive explanation of all models is beyond the scope of this chapter,in general, the approaches can be divided into improved analytical solutions of theradiative transport equation such as the δ-P1 approximation, Born approximationand P3 approximations, or fast inversion algorithms based on Monte Carlo generatedDDDDFig. 17.11 Schematic of asmall SD separationreflectance sensor. The source(S) and detector (D)separation distances (mm) areindicated in the figure (afterFinlay and Foster[14])DSD