Pinewood Studios: Business Case and Economic Impact Assessment
Pinewood Studios: Business Case and Economic Impact Assessment
Pinewood Studios: Business Case and Economic Impact Assessment

Create successful ePaper yourself
Turn your PDF publications into a flip-book with our unique Google optimized e-Paper software.
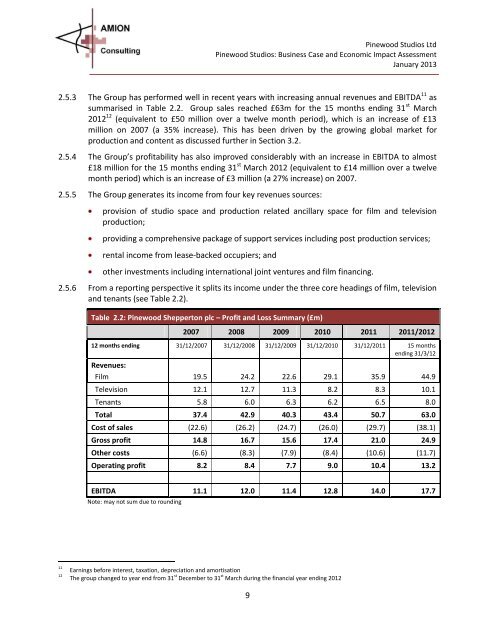
<strong>Pinewood</strong> <strong>Studios</strong> Ltd<strong>Pinewood</strong> <strong>Studios</strong>: <strong>Business</strong> <strong>Case</strong> <strong>and</strong> <strong>Economic</strong> <strong>Impact</strong> <strong>Assessment</strong>January 20132.5.3 The Group has performed well in recent years with increasing annual revenues <strong>and</strong> EBITDA 11 assummarised in Table 2.2. Group sales reached £63m for the 15 months ending 31 st March2012 12 (equivalent to £50 million over a twelve month period), which is an increase of £13million on 2007 (a 35% increase). This has been driven by the growing global market forproduction <strong>and</strong> content as discussed further in Section 3.2.2.5.4 The Group’s profitability has also improved considerably with an increase in EBITDA to almost£18 million for the 15 months ending 31 st March 2012 (equivalent to £14 million over a twelvemonth period) which is an increase of £3 million (a 27% increase) on 2007.2.5.5 The Group generates its income from four key revenues sources:provision of studio space <strong>and</strong> production related ancillary space for film <strong>and</strong> televisionproduction;providing a comprehensive package of support services including post production services;rental income from lease-backed occupiers; <strong>and</strong>other investments including international joint ventures <strong>and</strong> film financing.2.5.6 From a reporting perspective it splits its income under the three core headings of film, television<strong>and</strong> tenants (see Table 2.2).Table 2.2: <strong>Pinewood</strong> Shepperton plc – Profit <strong>and</strong> Loss Summary (£m)2007 2008 2009 2010 2011 2011/201212 months ending 31/12/2007 31/12/2008 31/12/2009 31/12/2010 31/12/2011 15 monthsending 31/3/12Revenues:Film 19.5 24.2 22.6 29.1 35.9 44.9Television 12.1 12.7 11.3 8.2 8.3 10.1Tenants 5.8 6.0 6.3 6.2 6.5 8.0Total 37.4 42.9 40.3 43.4 50.7 63.0Cost of sales (22.6) (26.2) (24.7) (26.0) (29.7) (38.1)Gross profit 14.8 16.7 15.6 17.4 21.0 24.9Other costs (6.6) (8.3) (7.9) (8.4) (10.6) (11.7)Operating profit 8.2 8.4 7.7 9.0 10.4 13.2EBITDA 11.1 12.0 11.4 12.8 14.0 17.7Note: may not sum due to rounding1112Earnings before interest, taxation, depreciation <strong>and</strong> amortisationThe group changed to year end from 31 st December to 31 st March during the financial year ending 20129