SmartSensor HD - Interprovincial Traffic Services
SmartSensor HD - Interprovincial Traffic Services
SmartSensor HD - Interprovincial Traffic Services

Create successful ePaper yourself
Turn your PDF publications into a flip-book with our unique Google optimized e-Paper software.
<strong>SmartSensor</strong> <strong>HD</strong>USER GUIDE
<strong>SmartSensor</strong> <strong>HD</strong>USER GUIDEwww.wavetronix.com • 78 East 1700 South Provo, Utah 84606 • 801.734.7200
© 2011 Wavetronix LLC. All Rights Reserved.<strong>SmartSensor</strong>, <strong>SmartSensor</strong> 105, <strong>SmartSensor</strong> <strong>HD</strong>, <strong>SmartSensor</strong> Advance, <strong>SmartSensor</strong> Matrix, <strong>SmartSensor</strong> V, <strong>SmartSensor</strong> Manager,Click, Command, DataCollector, DataMonitor, DataTranslator, DataView, Wavetronix, and all associated logos are trademarksof Wavetronix LLC. All other product or brand names as they appear are trademarks or registered trademarks of their respectiveholders.Protected by U.S. Patent Nos. 6,556,916; 6,693,557; 7,426,450; 7,427,930; 7,573,400; 7,889,097; 7,889,098; Canadian Patent No.2461411; and European Patent Nos. 1435036; 1438702; 1611458. Other U.S. and international patents pending.The Company shall not be liable for any errors contained herein or for any damages arising out of or related to this document or theinformation contained therein, even if the Company has been advised of the possibility of such damages.This document is intended for informational and instructional purposes only. The Company reserves the right to make changes in thespecifications and other information contained in this document without prior notification.FCC Part 15 Compliance: The Wavetronix <strong>SmartSensor</strong> sensors comply with Part 15 of the Federal Communications Commission(FCC) rules which state that operation is subject to the following two conditions: (1) this device may not cause harmful interference,and (2) this device must accept any interference received, including interference that may cause undesirable operation. FCC compliancestatements for applicable optional modules are to be found in the module specifications. Unauthorized changes or modificationsnot expressly approved by the party responsible for compliance with the FCC rules could void the user’s authority to operate thisequipment.Disclaimer: The advertised detection accuracy of the Wavetronix <strong>SmartSensor</strong> sensors is based on both external and internal testing, asoutlined in each product’s specification document. Although our sensors are very accurate by industry standards, like all other sensormanufacturers we cannot guarantee perfection or assure that no errors will ever occur in any particular applications of our technology.Therefore, beyond the express Limited Warranty that accompanies each sensor sold by the company, we offer no additional representations,warranties, guarantees or remedies to our customers. It is recommended that purchasers and integrators evaluate the accuracy ofeach sensor to determine the acceptable margin of error for each application within their particular system(s).WX-500-00519/2011
ContentsChapter 1 Introduction 5<strong>SmartSensor</strong> <strong>HD</strong> Package 5 • Selecting a Mounting Location6Part IInstalling the <strong>SmartSensor</strong> <strong>HD</strong>Chapter 2 Installing the <strong>SmartSensor</strong> <strong>HD</strong> 11Selecting the Mounting Height 12 • Attaching the MountBracket to the Pole 14 • Attaching the Sensor to the MountBracket 14 • Aligning the Sensor to the Roadway 15 • ApplyingSilicon Dielectric Compound 16 • Connecting the9-conductor Cable 16Chapter 3 Second Chapter 19Connecting Lightning Surge Protection 20 • Wiring to EarthGround 23 • Installing the Power Plant 24 • Connecting thePower Plant to Your Installation 28 • Wiring Communication29Part IIUsing <strong>SmartSensor</strong> Manager <strong>HD</strong>Chapter 4 Installing <strong>SmartSensor</strong> Manager <strong>HD</strong> 33Installing SSM<strong>HD</strong> 33 • Installing SSM<strong>HD</strong> on a HandheldComputer 36Chapter 5 Communication 39
Serial Connection 40 • Modem Connection 41 • InternetConnection 43 • Virtual Connection 44 • Viewing ConnectionInformation 46 • Troubleshooting Connections 47 •Communication Protocol Type 47 • Communication ScreenIcons 48 • Uploading the Sensor’s Embedded Software 49Chapter 6 Sensor Settings 53General Tab 53 • Comm Tab 54 • Advanced Tab 55Chapter 7 Lane Setup 591. Sensor Alignment 60 • 2. Lane Configuration – Automatic61 • 2. Lane Configuration – Manual 63 • 3. Lane Verification67Chapter 8 Data Setup and Collection 71Interval Data 72 • Per Vehicle Data 74 • Loop Emulation 75• Data Storage & Download 76 • Approaches 82 • Date andTime 83 • Data Push 84Chapter 9 Tools 87Backup/Restore 87Chapter 10 Appendix 89Appendix A - 8-conductor Cable Connector 89 • AppendixB - 9-conductor Cable Connector 90 • Appendix C - CableLengths 91 • Appendix D - Direct Serial Connections 93 •Appendix E - Signaling Delays 94
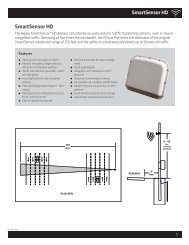
IntroductionIn this chapter˽˽<strong>SmartSensor</strong> <strong>HD</strong> Package˽˽Selecting a Mounting Location1The Wavetronix <strong>SmartSensor</strong> <strong>HD</strong> traffic sensor utilizes the latest technology to collectand deliver traffic statistics. The <strong>SmartSensor</strong> <strong>HD</strong> collects information through the useof a 24.125 GHz (K band) operating radio frequency and is capable of measuring trafficvolume and classification, average speed, individual vehicle speed, lane occupancy andpresence. The <strong>SmartSensor</strong> <strong>HD</strong> uses what is classified as frequency modulated continuouswave (FMCW) radar; it detects and reports traffic conditions simultaneously over as manyas ten lanes of traffic.Once <strong>SmartSensor</strong> <strong>HD</strong> is installed, the configuration process is quick and easy. After installation,this unit will require little or no on-site maintenance and can be remotely reconfiguredfor optimal performance. This user guide outlines the step-by-step process ofinstalling and configuring the <strong>SmartSensor</strong> <strong>HD</strong>. Any questions about the information inthis guide should be directed to Wavetronix or your distributor.<strong>SmartSensor</strong> <strong>HD</strong> PackageA standard <strong>SmartSensor</strong> <strong>HD</strong> package contains the following items:˽˽˽˽<strong>SmartSensor</strong> <strong>HD</strong> SS125 detector with installed backplate<strong>SmartSensor</strong> <strong>HD</strong> quick-reference guidesThe following items are not included but are necessary for installation:˽˽Sensor mount
6 INTRODUCTION • SMARTSENSOR <strong>HD</strong> USER GUIDE˽˽Sensor cableAdditional products may be purchased through your distributor. The following optionalitems are not included unless specifically ordered (check packing list for actual inventory):˽˽Contact closure adapter such as the Click! 100, 104, 110, 112/114, or 172/174.˽˽Click 200 surge protector˽˽Click 201/202 AC to DC converter˽˽Click 210 circuit breaker˽˽Click 230 AC surge protector˽˽<strong>SmartSensor</strong> <strong>HD</strong> User Guide (doesn’t have to be purchased, but does have to be requestedfrom Wavetronix)Selecting a Mounting LocationConsider the following guidelines when selecting a mounting location:˽˽˽˽˽˽˽˽˽˽˽˽Lane Coverage – Sensor mounting locations should be selected so that all monitoredlanes are within 6 to 250 ft. (1.8 to 76.2 m) of the sensor and run parallel with eachother. Multiple sensors should be considered if more than 10 lanes need to be simultaneouslymonitored. If lanes do not need to be simultaneously monitored, up to 22 lanescan be configured for collection by a single sensor.Parallel Lanes – When the sensor is used to collect both mainline and ramp data, thepole position should be selected so that the on and off ramp lanes run parallel withthe mainline. If lanes are not parallel, installation of multiple <strong>SmartSensor</strong> <strong>HD</strong> unitsshould be considered to achieve the sensor’s ±2 degree side-to-side angle requirement.Sensors on the Same Pole – When multiple sensors are mounted on the same pole,they will not be subject to interference if they are configured to operate using differentRF channels and are separated vertically by a few feet. The higher sensor would typicallybe used for the lanes farther from the pole in order to minimize occlusion.Sensors on Opposing Poles – <strong>SmartSensor</strong> <strong>HD</strong> units facing each other on opposingpoles should operate on different RF channels and be separated by a 70-ft. (21.3-m)lateral offset, if possible.Line of Sight – The <strong>SmartSensor</strong> <strong>HD</strong> is designed to work accurately in the presenceof barriers, but in general if there is an alternate mounting location that would avoidany type of structural occlusion, this is preferred. Avoid occlusion by trees, signs, andother roadside structures.Neighboring Structures and Parallel Walls – For best performance, it is preferred thatsensor locations have a 30-ft. (9.1-m) lateral separation from overhead signs, overpasses,tunnels, parallel walls, and parallel-parked vehicles in order to avoid multiplereflection paths from a single vehicle.
INTRODUCTION • SMARTSENSOR <strong>HD</strong> USER GUIDE 79–50 ft.(seemountingguidelines)RoadwayRoadway6 ft.minFigure I.1 – Portable (left) and Permanent (right) Sensor Stations˽˽˽˽˽˽˽˽˽˽˽˽Mounting Height – The mounting height should be based upon the offset from thelanes of interest. For each offset, the minimum, maximum, and best heights are shownin Table 1.1, found in Chapter 1. In general, the range of recommended heights isbetween 9 and 50 ft. (2.7 to 15.2 m).Mounting Offset – The minimum recommended offset (distance from the sensor tothe edge of the first lane of interest) is 6 ft. (1.8 m).Arterial Locations – Sensor sites on arterials or other roadway segments with regulatedstop lines should be selected at midblock positions to increase accuracy by avoidingpositions at which vehicles are often stopped in front of the sensor.Freeway Locations – The <strong>SmartSensor</strong> <strong>HD</strong> is often used at permanent ATR (automatictraffic recorder) stations. The number of stations along a single roadway and thedistance between stations should be selected to achieve adequate levels of statisticalconfidence. Permanent ATR stations, which are selected to cover interstate, principalarterial, and other national and state highways, are used to establish seasonal adjustmentfactors for count data from temporary collection sites (see Figure I.1).Cable Lengths – Ensure that you have sufficient homerun and sensor cabling. Cablescan be as long as 600 ft. (182.9 m) if they’re using 24 VDC operation and RS-485communications; for longer connections, alternate wired and wireless options shouldbe considered.Signaling Delay – After a vehicle passes in front of the sensor there will be a slightdelay before the data for that vehicle is sent from the sensor. In a time-sensitive application—forinstance, to supply a dynamic message sign with per vehicle warningmessages—it will be necessary to ensure the sensor is sufficiently far upstream fromthe sign that the system has time to collect the data, process it, and send it to the signby the time the vehicles reach the problem area. For specifics about signaling delay,see Appendix E.
Part IInstalling the <strong>SmartSensor</strong> <strong>HD</strong>Chapter 1 – Installing the <strong>SmartSensor</strong> <strong>HD</strong>Chapter 2 – Connecting Power and Surge Protection
Installing the <strong>SmartSensor</strong> <strong>HD</strong> 1In this chapter˽˽Selecting the Mounting Height˽˽Attaching the Mount Bracket to the Pole˽˽Attaching the Sensor to the Mount Bracket˽˽Aligning the Sensor to the Roadway˽˽Applying Silicon Dielectric Compound˽˽Connecting the 9-conductor Cable1Installing the <strong>SmartSensor</strong> <strong>HD</strong> is quick and easy. Once installed, the <strong>SmartSensor</strong> <strong>HD</strong>configures automatically and requires little or no on-site maintenance.The installation process includes attaching the mounting bracket to the pole; attaching thesensor to the mounting bracket; aligning the sensor; applying a silicon dielectric compoundto the sensor connector; and connecting the 9-conductor cable to the sensor.WarningDo not attempt to service or repair this unit. This unit does not contain any componentsand/or parts serviceable in the field. Any attempt to open this unit, except asexpressly written and directed by Wavetronix, will void the customer warranty. Anyvisible damage to exterior seal labels will void the warranty. Wavetronix is not liablefor any bodily harm or damage caused if unqualified persons attempt to service oropen the back cover of this unit. Refer all service questions to Wavetronix or an authorizeddistributor.
12 CHAPTER 1 • INSTALLING THE SMARTSENSOR <strong>HD</strong>CautionUse caution when installing any sensor on or around active roadways. Serious injurycan result when installation is performed using methods that are not in accordancewith authorized local safety policy and procedures. Always maintain an appropriateawareness of the traffic conditions and safety procedures as they relate to specificlocations and installations.Selecting the Mounting HeightAfter selecting a mounting location within the recommended range of offsets (see the introductionand Figure 1.1), use Table 1.1 to select a mounting height.RecommendedMount Area30 ft.Tilt Angle26 ft.1st Point ofInterest25 ft.35 ft.Figure 1.1 – Recommended Mounting HeightOffset from firstDetection Lane (ft/ m)RecommendedMounting Height(ft / m)Minimum MountingHeight (ft / m)6 / 1.8 12 / 3.7 9 / 2.7 19 / 5.8*7 / 2.1 12 / 3.7 9 / 2.7 19 / 5.8*8 / 2.4 12 / 3.7 9 / 2.7 20 / 6.1*9 / 2.7 12 / 3.7 9 / 2.7 21 / 6.410 / 3 12 / 3.7 9 / 2.7 22 / 6.711 / 3.4 12 / 3.7 9 / 2.7 23 / 712 / 3.7 13 / 4 10 / 3 24 / 7.313 / 4 13 / 4 11 / 3.4 25 / 7.6Maximum MountingHeight (ft / m)
CHAPTER 1 • INSTALLING THE SMARTSENSOR <strong>HD</strong> 13Recommended Offset14 / 4.3 14 / 4.3 11 / 3.4 26 / 7.915 / 4.6 15 / 4.6 12 / 3.7 26 / 7.916 / 4.9 15 / 4.6 12 / 3.7 27 / 8.217 / 5.2 16 / 4.9 13 / 4 28 / 8.518 / 5.5 17 / 5.2 14 / 4.3 29 / 8.819 / 5.8 17 / 5.2 14 / 4.3 30 / 9.120 / 6.1 18 / 5.5 15 / 4.6 30 / 9.121 / 6.4 19 / 5.8 15 / 4.6 31 / 9.422 / 6.7 20 / 6.1 16 / 4.9 31 / 9.423 / 7 22 / 6.7 16 / 4.9 32 / 9.824 / 7.3 24 / 7.3 16 / 4.9 33 / 10.125 / 7.6 26 / 7.9 17 / 5.2 33 / 10.126 / 7.9 26 / 7.9 17 / 5.2 34 / 10.427 / 8.2 27 / 8.2 18 / 5.5 35 / 10.728 / 8.5 27 / 8.2 18 / 5.5 35 / 10.729 / 8.8 27 / 8.2 18 / 5.5 36 / 1130 / 9.1 29 / 8.8 19 / 5.8 37 / 11.331 / 9.4 29 / 8.8 19 / 5.8 37 / 11.332 / 9.8 29 / 8.8 19 / 5.8 38 / 11.633 / 10.1 30 / 9.1 19 / 5.8 39 / 11.934 / 10.4 30 / 9.1 19 / 5.8 39 / 11.935 / 10.7 30 / 9.1 20 / 6.1 40 / 12.236 / 11 30 / 9.1 20 / 6.1 41 / 12.537 / 11.3 31 / 9.4 20 / 6.1 41 / 12.538 / 11.6 31 / 9.4 21 / 6.4 42 / 12.839 / 11.9 33 / 10.1 21 / 6.4 43 / 13.140 / 12.2 33 / 10.1 22 / 6.7 43 / 13.141 / 12.5 34 / 10.4 22 / 6.7 44 / 13.442 / 12.8 34 / 10.4 22 / 6.7 44 / 13.443 / 13.1 35 / 10.7 22 / 6.7 45 / 13.744 / 13.4 35 / 10.7 23 / 7 46 / 1445 / 13.7 36 / 11 23 / 7 46 / 1446 / 14 36 / 11 23 / 7 47 / 14.347 / 14.3 36 / 11 24 / 7.3 48 / 14.648 / 14.6 38 / 11.6 24 / 7.3 48 / 14.649 / 14.9 38 / 11.6 24 / 7.3 49 / 14.950–230 / 15.2–70.1 39 / 11.9 25 / 7.6 Must be < offsetTable 1.1 – Mounting Height Guidelines in Feet / Meters
14 CHAPTER 1 • INSTALLING THE SMARTSENSOR <strong>HD</strong>Attaching the Mount Bracket to the PoleBefore attaching the mount bracket to the pole, first make sure that your cables are longenough to reach the sensor and to stretch across the distance from the sensor to the cabinet.Follow the steps below to correctly attach the mount to the pole (see Figure 1.2):1 Insert the stainless steel straps through the slots in the mount bracket.2 Position the mount bracket on the pole so that the head of the mount is pointing towardsthe middle of the lanes of interest.3 Tighten the strap screws.NoteThe sensor will need to be adjusted later, to fine-tune the alignment, so be sure tokeep the straps adjustable.Figure 1.2 – Attaching the Mount Bracket to the PoleAttaching the Sensor to the Mount BracketUse the following steps to securely fasten the sensor to the mount bracket:1 Align the bolts on the sensor’s backplate with the holes in the mount bracket. The large26-pin connector at the bottom of the unit should be pointing towards the ground.2 Place the lock washers onto the bolts after the bolts are in the mount bracket holes.3 Thread on the nuts and tighten (see Figure 1.3).
CHAPTER 1 • INSTALLING THE SMARTSENSOR <strong>HD</strong> 15NoteDo not over-tighten the fasteners.Figure 1.3 – Attaching the Sensor to the Mount BracketAligning the Sensor to the RoadwayUse the following steps to correctly mount and align the <strong>SmartSensor</strong> <strong>HD</strong>:1 Tilt the sensor down so that the front is aimed at the center of the detection area (seeFigure 1.4).1 2 3 4 5 6 7 8 9 10Figure 1.4 – Up-and-down Positioning2 Adjust the side-to-side angle so that it is about two or three degrees right of perpendicular(see #Figure 1.5).1 2
16 CHAPTER 1 • INSTALLING THE SMARTSENSOR <strong>HD</strong>NoteThe side-to-side alignment will eventually be fine-tuned for better accuracy using<strong>SmartSensor</strong> Manager <strong>HD</strong> (SSM<strong>HD</strong>). That step will be addressed in Chapter 6, afterSSM<strong>HD</strong> has been installed.Side-to-side alignment should bealmost perpendicularFigure 1.5 – Side-to-side PositioningApplying Silicon Dielectric CompoundUse the following 1 steps 2 3 to 4correctly 5 apply the silicon dielectric 6 7 8 compound:9 101 Tear the tab off of the tube of silicon dielectric compound.2 Squeeze about 25% of the silicon into the connector at the base of the <strong>SmartSensor</strong><strong>HD</strong> (see Figure 1.6). Be sure to wipe off any excess compound.1 2Figure 1.6 – Applying Silicon Dielectric CompoundConnecting the 9-conductor CableThe sensor connector is keyed to ensure proper connection; once you have plugged thecable connector into the sensor connector, simply twist the cable connector clockwise until
CHAPTER 1 • INSTALLING THE SMARTSENSOR <strong>HD</strong> 17you hear it click into place. To avoid undue movement from the wind, strap the cable to thepole or run it through a conduit, but leave a small amount of slack at the top of the cable toreduce cable strain (see Figure 1.7).NoteIf you run the cable through the pole, do not drill through the sensor mount, as thesensor and sensor mount may need to be adjusted in the future.Figure 1.7 – Sensor ConnectorThe service end of the cable has a +DC and GND for a power supply of 12 to 24 VDC.Two communication ports (either RS-232 or RS-485) are available to connect the Smart-Sensor <strong>HD</strong> to a modem or other communication device. Typically, one RS-485 and oneRS-232 port are available.NoteIt is important to not that there are two different cables that you may be using. Many<strong>HD</strong> sensors, including all sensors built before 2010, use the 9-conductor cable, whichis a larger cable that uses a 26-pin connector as shown in Figure 1. Some (but not all)new <strong>HD</strong> sensors, however, use the <strong>SmartSensor</strong> 8-conductor cable, which is a smallercable that uses a 10-pin connector. If you have an 8-conductor cable, the installationprocess outlined in these last two sections will be the same, but your equipment willnot exactly match the equipment shown in Figures 1.6 and 1.7.
Connecting Power and Surge 2In this chapter˽˽Connecting Lightning Surge Protection˽˽Installing the Power Plant˽˽Connecting DC Power to Your Installation˽˽Wiring Communication2Once the sensor is installed, it will need to be wired for power and surge protection. WavetronixClick products allow you to quickly and easily include power and surge protectionin your sensor application. Please refer to the Click quick-reference guides for more comprehensiveproduct instructions.There are several ways your sensor might be set up:˽˽A two-part installation, with components in two areas: first, a pole by the road holdsyour sensor plus a pole-mount box with a surge protector inside. Second, a main trafficcabinet holds power and communications devices. The cabinet and pole are connectedvia a homerun cable that runs underground.NoteThis chapter assumes the box and cabinet are connected by an underground cablerun, but in certain circumstances they might not be.
20 CHAPTER 2 • CONNECTING POWER AND SURGE˽˽A single-part installation, with all components on the same pole. This pole holds yoursensor. Power and communications devices (most likely wireless) are in a pole-mountbox or there is a traffic cabinet at the base of the pole; either way there is no undergroundcable run. Power comes from the pole itself or from a battery and/or solarpanels at the pole.How you set up the devices in this chapter will vary depending on which of these installationsyou are using.Connecting Lightning Surge ProtectionThe sensor should be connected to at least one surge protection device. The Click 200 andequivalent devices are designed to prevent electrical surges along cables from damaging thesensor and/or the cabinet. It is also a convenient spot to terminate the cable coming fromyour sensor, as it has terminals for all the wires.NoteIf you choose not to use surge protection in your installation, please contact WavetronixTechnical <strong>Services</strong> for assistance.If you are using the one-part installation option above—no underground cable run—put aClick 200 in the pole-mount box/traffic cabinet (whichever is being employed) as a terminationpoint for the cable from the sensor, and as a way to protect the box/cabinet. Whenthere is no underground cable run, it is safest practice, as well as Wavetronix standard procedure,to connect the cable from the sensor in the UNPROTECTED side of the Click200.1 Install a Click 200 in the pole-mount cabinet/traffic cabinet by snapping it onto theDIN rail. Your power and communications devices will most likely also be on this DINrail; make sure the Click 200 is connected to them via wires or the shared communicationbus (connecting power will be covered later in this chapter; for how to connect tocommunications devices, see the Click Series User Guide).2 Wire the cable from the sensor to the UNPROTECTED side of the Click 200.
CHAPTER 2 • CONNECTING POWER AND SURGE 21<strong>SmartSensor</strong>Figure 2.1 – Using a Single Click 200NoteThe different cables available and how to wire them into the Click 200 will be coveredlater in this section.If you are using the two-part installation option above, you’ll have an underground cablerun as part of your installation, connecting the power and comms devices in the main trafficcabinet to the pole-mount box and sensor. When there is an underground cable run,it is safest practice, as well as Wavetronix standard procedure, to use two Click 200s, oneon each end of the cable: one in the main traffic cabinet and the other in the pole-mountcabinet. Both ends of the cable should be connected to the UNPROTECTED side oftheir Click 200s. This is important because the underground cable run will be susceptible tosurges caused by lightning striking the ground near it.If this run is shorter than 600 ft. (182.9 m), you can use a Wavetronix cable; see AppendixD for more on cable lengths.1 Install one Click 200 device in a pole-mount cabinet on the same pole as the sensorbeing protected. Install it by snapping it onto the DIN rail.2 Connect the cable from the sensor to the PROTECTED side of this Click 200. Thiscable should be kept as short as possible.3 Install another Click 200 in the main traffic cabinet. You will likely have power andcommunications devices in this cabinet; make sure the Click 200 is connected to themvia wires or the shared communication bus (connecting power will be covered later inthis chapter; for how to connect to communication devices, see the Click Series UserGuide).4 Connect the pole-mount box and the main traffic cabinet by running a cable from theUNPROTECTED side of the Click 200 in the pole-mount box to the UNPRO-
22 CHAPTER 2 • CONNECTING POWER AND SURGETECTED side of the Click 200 in the main traffic cabinet.<strong>SmartSensor</strong>Main <strong>Traffic</strong> CabinetPolemountBoxBoth ends of the homeruncable connect to theUNPROTECTED side of thesurge modules120VACFigure 2.2 – Underground Cable RunWiring the Click 200There are two cables that may be used with your sensor. Many <strong>SmartSensor</strong> <strong>HD</strong>s use the9-conductor cable. Certain newer devices, though, may use the newer 8-conductor cable,which is similar to the 9-conductor cable but has certain wires removed. To tell which oneyou have, look at the connector on the sensor and on the end of the cable. The 9-conductorcable has a larger 26-pin connector; the 8-conductor cable has a smaller 10-pin connector.The wiring for these two cables is almost identical; the differences are pointed out below.NoteIf you have an underground cable run that stretches more than 600 ft (182.9 m), youwill likely need to use a different cable; in that case the colors won't match the figurebelow.The Click 200 contains three terminal connectors on both the top and the bottom of themodule (see Figure 2.3). The terminal connectors are removable and are red-keyed, allowingeach connector to plug into only one specific jack. This both simplifies the wiringprocess and reduces the possibility of wiring errors.
CHAPTER 2 • CONNECTING POWER AND SURGE 23GND/-DC (Black)+DC (Red)+485 (White)-485 (Blue)Power DrainRS-485 DrainGround (Gray)RTS (Orange)CTS (Brown)RD (Purple)TD (Yellow)CTS (Brown)RTS (Orange)TD (Yellow)RD (Purple)-485 (Blue)+485 (White)Ground (Gray)RS-485 Drain+DC (Red)-DC (Black)RS-232 DrainPower DrainFigure 2.3 – Click 200 Terminal Connections (protected and unprotected sides)If you have an 8-conductor cable, it will have the following wiring differences:˽˽˽˽˽˽There is no gray ground wire.Instead of three drains, there is only one. This drain can be connected into any of thescrew terminals marked GND.The white +485 wire will have a blue stripe.NoteSee Appendices A and B for cable pinout diagrams for the 8-conductor cable and the9-conductor cable.Wiring to Earth GroundAll Click 200 devices should be mounted on a DIN rail that is connected to earth groundeither through an earth-grounded chassis or a 16 AWG or larger grounding wire attachedto a 7-ft. (2.1-m) grounding rod. Follow the steps below to correctly wire to earth ground:1 Connect the grounding wire from either the DIN rail or a GND screw terminal onthe UNPROTECTED side of the Click 200 to the lug bolt on the inside of the polemountcabinet.2 Connect another grounding wire from the exterior lug bolt to earth ground (see Figure2.4).
24 CHAPTER 2 • CONNECTING POWER AND SURGEFigure 2.4 – Earth Ground ConnectionsInstalling the Power PlantProvide power to your installation using the Click power plant. This set of modules includesthe following:˽˽˽˽˽˽Click 201/202 AC to DC converterClick 210 circuit breaker and switchClick 230 AC surge moduleA Click 201 provides 1 A of power and is capable of powering a single sensor, while a Click202 provides 2 A and can power two sensors. (There is also a Click 204 which provides 4 Aof power, but that will usually not be necessary in an installation such as the one outlinedbelow.) The Click 230 helps limit current surges on the power lines; the Click 210 interruptspower during overload conditions and provides a convenient way to turn power onand off.The power plant will either be in a pole-mount box or in a main traffic cabinet. If it’s in atraffic cabinet, the power will be sent to the pole via an underground cable run. How to installthe power plant and then wire to a Click 200 will be covered in the rest of this section.It should be noted that if you have ordered a Wavetronix preassembled cabinet, all of thiswiring and installation will already be done.
CHAPTER 2 • CONNECTING POWER AND SURGE 25NoteAn authorized electrical technician should perform installation and operation of thisunit. Persons other than authorized and approved electrical technicians should NOTattempt to connect this unit to a power supply and/or traffic control cabinet, as thereis a serious risk of electrical shock through unsafe handling of the power source. Extremecaution should be used when connecting this unit to an active power supply.Wiring in ACThe first step is to get AC power into the enclosure. (Sometimes the power source is actuallyDC; to see Wavetronix’s selection of DC power modules, see the Click Series UserGuide.) If you’re using a main traffic cabinet, wire from its power source; if you’re usinga pole-mount box, the power lines or cable can be brought in through the conduit on thebottom-left.NoteMake sure power to AC mains is disconnected while wiring AC input.Wiring the Click 210The first device in the power plant, as seen in Figure 2.5, is the Click 210. This is a compactcircuit breaker DIN rail device designed to interrupt an electric current under overloadconditions. The breaker is trip-free and can be easily reset after a current interruption bypushing the reset button.
26 CHAPTER 2 • CONNECTING POWER AND SURGEEarthGroundBlack (Line)Green (Ground)White (Neutral)Black (Ground)Red (+24VDC)Figure 2.5 – AC Surge ProtectionTo add a Click 210 circuit breaker and switch (see the left side of Figure 2.5):1 Mount the Click 210 onto the DIN rail.2 Connect the line conductor (usually black) from the AC terminal block or cord in toeither side of the module.3 Wire out of the other side.NoteFor ease in troubleshooting, it is recommended that you follow the wire color schemeoutlined in this chapter.Wiring the Click 230The next device in the power plant is the Click 230, which is the AC surge protector (seeFigure 2.5). To install:1 Mount the Click 230 onto the DIN rail next to the Click 210.2 Connect the line conductor (black) from the Click 210 to terminal 5 on the IN sideof the Click 230.3 Connect the neutral (usually white) wire from the AC terminal block or cord to theterminal marked 1 on the Click 230.4 Connect the ground wire from the AC terminal block or cord to the terminal marked3 on the Click 230.
CHAPTER 2 • CONNECTING POWER AND SURGE 275 Connect an outgoing and protected line wire to the terminal marked 2 on the Click230. The line wire should be black.6 Connect an outgoing and protected neutral wire to the terminal marked 6 on the Click230. The neutral wire should be white.The terminal blocks 3 and 4 are directly bonded via the metal mounting foot of the baseelement to the DIN rail. There is no need for any additional grounding between terminals3 and 4 and the DIN rail.Wiring the Click 201/202The final device in the power plant should be either a Click 201 or 202 (as shown in Figure2.5). These are AC to DC converters, also occasionally called the power supplies. As notedabove, the difference between the two is that the Click 201 outputs 1 A and the Click 202outputs 2 A (the Click 204 outputs 4 A but will probably not be needed for an <strong>HD</strong> installation).Choose which device suits your installation best, then follow the steps below toinstall it (see Figure 2.6):1 Mount the Click 201/202 onto the DIN rail next to the Click 230.2 Connect the line (black) wire from the Click 230 into the L screw terminal on the topof the Click 201/202.3 Connect the neutral (white) wire from the Click 230 to the N screw terminal to thetop of the Click 201/202.Figure 2.6 – Wiring AC Power into the Click 201/202NoteThe NC screw terminal is not connected internally. Connecting a wire to a no connect(NC) terminal simply gives it a convenient termination point.To wire the newly converted DC power out of the Click 201/202:
28 CHAPTER 2 • CONNECTING POWER AND SURGE1 Connect a +DC conductor (usually a red wire) to the + screw terminal on the bottomof the Click 201/202 (see Figure 2.7).2 Connect a -DC conductor (usually a black wire) to either of the – screw terminals onthe bottom of the Click 201/202.Figure 2.7 – Wiring DC Power Out of the Click 201/202NoteDo not wire into the screw terminal marked DC OK; it provides only 20 mA and shouldbe used only for monitoring the power supply.The screw terminal connectors on the top and bottom of the module are removable to simplifywiring and are red-keyed, allowing the connector to plug into only one correct jack.Connecting the Power Plant to Your InstallationNow the power plant is complete and you have reliable, safe DC power. The next step is toget that power to the rest of the installation.If the power plant is in a pole-mount box, this involves getting that power onto the T-bus;from there it will power any communication devices that may be on it. It will also powerthe Click 200, which will send the necessary 10–30 VDC, along with communications, tothe sensor.If the power plant is in a main traffic cabinet, this also will involve getting DC from thepower plant on the T-bus; from there it will power any communication devices on that bus.It will also power the Click 200, which will send that power, along with communications,along the homerun cable to the Click 200 in the pole-mount box. That Click 200 will putthe power (and communications) onto the T-bus, powering any communication devicesthat may be on it. It will also send the necessary 10–30 VDC, along with communications,to the sensor.
CHAPTER 2 • CONNECTING POWER AND SURGE 29To put power on the T-bus, you will first need to connect a 5-screw terminal block to theend of the T-bus, then follow the steps below to wire DC to it:1 Connect +DC (red) from the Click 201/202 to the top screw terminal on the 5-screwterminal block.2 Connect –DC (black) to the second screw terminal.+24V DC-DC+485-485GND(red wire)(black wire)GreenGrayFigure 2.8 – Connecting Power Directly to the T-busNoteGreen T-bus connectors conduct power and communication on the DIN rail backplate;gray T-bus connectors only conduct power and are used to distribute power withoutconnecting communication.You can also wire DC to the Click 200 itself; it will then put that power on the T-bus. Ifyou’d like to do that, follow these steps:1 Connect +DC (red) from the Click 201/202 to the +DC screw terminal.2 Connect -DC (black) to a GND screw terminal.GND+DCFigure 2.9 – Wiring DC Power into the Click 200Wiring CommunicationThe last thing to do is decide how to communicate with the sensor. How you do this willvary based on your installation. If your sensor is connected to a Click 200 in a pole-mount
30 CHAPTER 2 • CONNECTING POWER AND SURGEbox, and you want to access that sensor from a main traffic cabinet or from the traffic operationscenter, you will need some kind of communication between the two spots: either withthe homerun cable, which can carry both RS-232 and RS-485 communications, or by usinga Wavetronix Click communication device.Wavetronix has a variety of wired and wireless communication devices, such as the Click301 serial to Ethernet converter, which lets you communicate with the sensor via Ethernet,or the Click 400, which is a 900 MHz radio that communicates wirelessly with otherradios. See the Click Catalog, Click Series User Guide, or ITS Designer Training Guidefor more information.The Click 200 has several ports for other methods of communication. The faceplate has aDB-9 port you could connect to for RS-232 communication. There are also several RS-485connections:˽˽˽˽T-bus backplane: puts RS-485 on the T-bus. Because the Click 200 is connected tothe sensor, this T-bus connection means the sensor, the Click 200, and any other deviceon the T-bus all communicate with each other.RJ-11 connector on the faceplate for connecting to contact closure devices, if desired.NoteThe Click 200 does not convert RS-232 communication to RS-485. It simply providessurge protection for these two independent connections.
Part IIUsing <strong>SmartSensor</strong> Manager <strong>HD</strong>Chapter 3 – Installing <strong>SmartSensor</strong> Manager <strong>HD</strong>Chapter 4 – CommunicationChapter 5 – Sensor SettingsChapter 6 – Lane SetupChapter 7 – Data Setup & CollectionChapter 8 – Tools
34 CHAPTER 3 • INSTALLING SMARTSENSOR MANAGER <strong>HD</strong>NoteMicrosoft .NET Framework version 3.5 or higher needs to be installed on your computerbefore installing SSM<strong>HD</strong>. You can get the .NET Framework from the Microsoftwebsite.Follow these steps to install SSM<strong>HD</strong> on a PC:1 To download the install file, go to the Wavetronix website at www.wavetronix.com.2 Click the Support link near the top of the page. This will bring up a page with iconsfrom the three different Wavetronix product lines.3 Click the <strong>SmartSensor</strong> icon. This will bring up drop-down menus allowing you toselect a product by name or part number.4 Select <strong>SmartSensor</strong> <strong>HD</strong> or WX-SS-125. A list of links will appear.5 Select the <strong>SmartSensor</strong> Manager <strong>HD</strong> link (it will be near the top) to download theSSM<strong>HD</strong> install file.6 Once you’ve downloaded the file, double-click on it. Opening it executes a setup programthat will copy all the necessary files to your hard drive and place icons in the Startmenu and on the desktop of the PC or laptop (see Figure 3.1).Figure 3.1 – SSM<strong>HD</strong> Setup Wizard7 Select an installation location. The default location provided is normally “C:\ProgramFiles\Wavetronix.” Click Browse to choose another location (see Figure 3.2).
CHAPTER 3 • INSTALLING SMARTSENSOR MANAGER <strong>HD</strong> 35Figure 3.2 – Location to Be Installed8 Click the Install Now button.9 After SSM<strong>HD</strong> is installed, you can create shortcuts to the SSM<strong>HD</strong> software on thedesktop and in the start menu using the corresponding checkboxes (see Figure 3.3). Ifno shortcuts are desired, uncheck the corresponding boxes.Figure 3.3 – Shortcut Options10 Click the View release notes when finished checkbox to view the SSM<strong>HD</strong> releasenotes. The release notes contain additional information about the current version of theSSM<strong>HD</strong> software. A PDF reader program (i.e. Adobe Acrobat Reader) is required toview the release notes.11 Click Finish to complete the setup process.
36 CHAPTER 3 • INSTALLING SMARTSENSOR MANAGER <strong>HD</strong>NoteSSM<strong>HD</strong> is designed to display text with Normal Size display resolution (96 dpi). Ifyour test is too big and does not display properly, you can edit the Advanced Displayproperty settings on your PC to reduce the display resolution from 120 dpi down to96 dpi.Installing SSM<strong>HD</strong> on a Handheld ComputerIf you would like to run SSM<strong>HD</strong> on a handheld computer, consider purchasing a WavetronixInstall Kit, which includes a Socket Mobile SoMo 650 handheld computer thatcomes preconfigured with <strong>SmartSensor</strong> Manager <strong>HD</strong>, as well as Click Supervisor and theManager software programs for the other Wavetronix sensors. These software programs aretested for and supported on the SoMo 650.SSM<strong>HD</strong> can also be installed and will function on a handheld computer other than theSoMo 650. However, because of differing handheld computer technology, Wavetronix doesnot support any other handheld devices.Use these steps to install SSM<strong>HD</strong> on a handheld computer running Windows Mobile:1 Ensure the handheld computer is connected to the PC and synced.2 Click on the SSM<strong>HD</strong> Setup.exe file to run the setup program on the host computer.The SSM<strong>HD</strong> Setup Wizard will automatically check the host computer to see ifMicrosoft ActiveSync (Windows XP and older) or Windows Mobile Device Center(Windows Vista and Windows 7) is installed. These are programs that are used tocommunicate with a handheld device. If one of these programs is found, the option ofinstalling SSM<strong>HD</strong> to a handheld device will become available.3 Click the Pocket PC checkbox and then the Next>> button to install SSM<strong>HD</strong> on aconnected handheld device (see Figure 3.4). If both the Computer and Pocket PCboxes are checked, the setup program will first install the SSM<strong>HD</strong> software to the PC.
CHAPTER 3 • INSTALLING SMARTSENSOR MANAGER <strong>HD</strong> 37Figure 3.4 – Handheld Computer Installation Program4 Click Continue>> to start the handheld computer installation process (see Figure3.5). The setup program runs the Add/Remove Programs application for Windowshandheld devices. If a handheld device is connected to the computer, Add/RemovePrograms will immediately begin installing SSM<strong>HD</strong> on the device. If a handhelddevice is not connected to the computer, SSM<strong>HD</strong> will be downloaded the next time ahandheld device is connected to the computer.Figure 3.5 – Adding SSM<strong>HD</strong> to a Handheld Computer5 Click OK once the download is complete.
Communication 4In this chapter˽˽Serial Connection˽˽Modem Connection˽˽Internet Connection˽˽Virtual Connection˽˽Troubleshooting Connections˽˽Communication Protocol Type˽˽Address Book˽˽Viewing Connection Information˽˽Uploading the Sensor's Embedded Software4Use the SSM<strong>HD</strong> software to change settings, view data and configure the sensor to theroadway.First, physically connect your computer or handheld computer to the sensor. Next, launchSSM<strong>HD</strong> by either clicking on the icon that was placed on your desktop or clicking theicon found in the Start menu. The SSM<strong>HD</strong> main screen shown in Figure 4.1 will appear.The image of the earth in the lower left corner allows you to select the language forSSM<strong>HD</strong>. To change the language, click on the image and select the desired language fromthe drop-down list.The control beneath the earth image allows you to change the size of the window. There arethree options; click on a box to change the window to the corresponding size.
40 CHAPTER 4 • COMMUNICATIONFigure 4.1 – SSM<strong>HD</strong> Main ScreenTo interact with and configure the sensor in <strong>SmartSensor</strong> Manager <strong>HD</strong>, connect to thesensor through one of the following four types of connections, all available on the Communicationscreen:˽˽˽˽˽˽˽˽Serial connection – Made using RS-232 or RS-485 communicationModem connection – Made to an external analog modemInternet connection – Made using an IP address and a serial to Ethernet converterVirtual connection – Can be made for convenience in learning and demonstratingSSM<strong>HD</strong> functionality.Communication settings are stored in the system registry each time a connection is established.After the first connection is made to the sensor, <strong>SmartSensor</strong> Manager <strong>HD</strong> will savethe connection settings that were used. Click the lightning bolt icon on the right side ofthe communication link on the main SSM<strong>HD</strong> page to make a connection using the mostrecent parameters stored in the registry. The lightning bolt will only appear when there isno connection currently established.Serial Connection1 Click on Communication to access the Communication window (see Figure 4.2).2 Select the Serial tab.3 Set Port and Speed to the desired settings. The SSM<strong>HD</strong> software defaults to 9600bps; this baud rate is recommended and most likely will not need to be changed. Clickthe Advanced… button for additional serial settings.4 Click the Connect button.
CHAPTER 4 • COMMUNICATION 41Figure 4.2 – Serial Connection (left) and Advanced Settings (right)Advanced SettingsThe Advanced Settings screen contains the following fields:˽˽˽˽˽˽Timeout (ms) – Allows you to set an additional amount of time (in milliseconds) thatSSM<strong>HD</strong> will wait for a response when communicating with the sensor.Buffer (bytes) – Contains the number of bytes used by SSM<strong>HD</strong> to store data receivedfrom the sensor.Flow Control – Is usually only used if you are connecting through a RS-232 device thatrequires hardware handshaking.NoteWhen connecting directly from a computer running <strong>SmartSensor</strong> Manager <strong>HD</strong> to a<strong>SmartSensor</strong> <strong>HD</strong> unit (with no modem in between), you should not attempt to connectuntil after the Flow Control setting in the serial connection's Advanced Settingsscreen is set to None. Otherwise you may not be able to successfully connect.Modem ConnectionThe <strong>SmartSensor</strong> <strong>HD</strong> can be connected directly to an external analog modem, to whichyour PC’s modem can then dial up to establish a connection. For example, this could be aregular Plain Old Telephone Service (POTS) analog modem or a wireless modem (GSM,etc.) if service is available in your area.
42 CHAPTER 4 • COMMUNICATIONFigure 4.3 – Modem ConnectionUse the steps below to connect to the <strong>SmartSensor</strong> <strong>HD</strong> using a modem connection (seeFigure 4.3):1 Click on Communication and the Communication window will appear.2 Click on the Modem tab.3 Enter the phone number in the Phone # field.4 Click the Advanced… button for additional modem settings (see Figure 4.4).5 Click Dial to establish the connection.Figure 4.4 – Modem Advanced SettingsAdvanced SettingsThe Advanced Settings screen contains the following fields:˽˽Timeout (ms) – Allows you to set an additional amount of time (in milliseconds) thatSSM<strong>HD</strong> will use when communicating with the sensor. A modem connection mayrequire a longer timeout setting than a serial connection.
CHAPTER 4 • COMMUNICATION 43˽˽˽˽˽˽˽˽˽˽˽˽Buffer (bytes) – Contains the number of bytes used by SSM<strong>HD</strong> to store data receivedfrom the sensor. This field should always be set to 02048 or greater.Flow Control – Is usually only used if you are connecting your computer to an RS-232device that requires hardware handshaking. If you have a slower RS-232 modem thatrequires hardware handshaking, select Hardware from the drop-down menu. You willneed to make sure you have connected the RTS and CTS lines. For information onhow to configure hardware handshaking on the sensor, see HW Handshaking in theAdvanced Tab section of Chapter 5.Initialization String – Allows you to configure the office modem being used to dial thefield modem. If the string field is left blank, the application will use a default string tocommunicate with the modem.Include Commands – Contains numerous modem settings that will automatically setthe initialization string when selected.Speaker – Allows you to adjust the volume of the modem’s speaker.Manual Dial – Allows you to manually dial the modem number.Internet ConnectionThe <strong>SmartSensor</strong> <strong>HD</strong> can be connected to the Internet, allowing access to the sensor fromanywhere with Internet access. Below is a list of three ways to connect the <strong>SmartSensor</strong> tothe Internet:˽˽˽˽˽˽Serial to Ethernet Converter – The <strong>SmartSensor</strong> <strong>HD</strong> can be connected to a local areanetwork (LAN) by using a serial to Ethernet converter. As an option, the <strong>SmartSensor</strong><strong>HD</strong> can be shipped with a Click 301 serial to Ethernet converter that is Internet addressable,which makes it possible to connect to the sensor from anywhere the adapter’saddress is accessible.Serial to 802.11b Wireless – The Click 420 is a serial to 802.11b converter that providesserial devices with an IP address on a wireless 802.11b network. The Click 420has been tested to work over a -34° C to 74° C temperature range.Internet Service Providers – Cellular providers of wireless Internet services maintainnetworks in most metropolitan areas in the United States and coverage continues toexpand. The <strong>SmartSensor</strong> <strong>HD</strong> can be equipped with an optional external modems—for example, CDMA, GMS or GPRS—and assigned an Internet address on thesenetworks.Use the steps below to connect to the <strong>SmartSensor</strong> <strong>HD</strong> using an Internet connection:1 Click on Communication.2 Click the Internet tab and the Internet setting options will appear (see Figure 4.5).3 Enter the IP address or URL of the sensor of interest. The IP address consists of fournumbers ranging from 0–255 separated by dots. Enter the IP address assigned to eitherthe CDMA modem or the Click 301 serial to Ethernet converter.4 Enter the port number assigned to the CDMA modem or the Click 301 serial to Ethernetconverter in the Port field. This will be an integer value in the range of 0–65536.
44 CHAPTER 4 • COMMUNICATIONThe Click 301 port number automatically defaults to 10001.5 Click the Advanced… button for additional settings.6 Click the Connect button to connect to the sensor.Figure 4.5 – Internet Connection (left) and Advanced Settings (right)Advanced SettingsThe Advanced Settings contain the following fields:˽˽˽˽Timeout (ms) – Allows you to set an additional amount of time (in milliseconds) thatSSM<strong>HD</strong> will use when communicating with the sensor.Buffer (bytes) – Contains the number of bytes used by SSM<strong>HD</strong> to store data receivedfrom the sensor. This should always be set to 02048 or greater.Virtual ConnectionA virtual connection allows you to use the SSM<strong>HD</strong> software without being connected toan actual sensor. Making a virtual connection can be useful for the following reasons:˽˽˽˽˽˽˽˽To view a saved sensor setup file.To play back previously logged traffic.To demonstrate functionality for different applications.To review how the software works.Use the following steps to make a virtual connection:1 Click the Communication button.2 Select the Virtual tab (see Figure 4.6).3 Select or create a virtual sensor file (.ss125) by clicking the magnifying glass icon. Clickthe Options… button for more options.4 Click the Connect button.
CHAPTER 4 • COMMUNICATION 45Figure 4.6 – Virtual Connection (left) and Virtual Options (right)Additional SettingsThe Options window contains the following settings:˽˽˽˽Simulator Mode – This section allows you to set a desired traffic pattern for the simulator.<strong>Traffic</strong> – Allows you to set the traffic volume and speed for the simulated traffic.The Save as Default Options radio button saves the changes made to default settings.Virtual Sensor FileSince a virtual connection is not made to an actual sensor, a virtual sensor file (.ss125) isused to save the configuration settings much like an actual sensor’s flash memory. If you aremaking a virtual connection for the first time, you will need to create a virtual sensor file byclicking on the magnifying glass icon and entering a file name.NoteWhen you are connected using a virtual sensor file, changes taht would normally besaved to a sensor's flash memory will automatically be saved to the virtual sensorfile.Backing up a virtual sensor file will change the file to a sensor setup file (.ssc) that can berestored to an actual sensor. To convert a sensor setup file to a virtual sensor file, make a virtualconnection and then use the Restore Sensor Setup tool in the Tools menu. To converta virtual sensor file to a sensor setup file, use the Back-up Sensor Setup tool.
46 CHAPTER 4 • COMMUNICATIONViewing Connection InformationOnce a connection is made to the <strong>SmartSensor</strong> <strong>HD</strong>, the main menu will appear and allconfiguration options will become available (see Figure 4.7).Figure 4.7 – SSM<strong>HD</strong> Main Screen (connected)Once connected, you can view additional information about the connection you have establishedby clicking on the moving arrows icon on the top right of the main menu pageor on the bottom right of the Communication screen. These arrows are only visible whenthere is an established connection.Figure 4.8 – Connection Info ScreenBelow is a list of the information available on the Connection Info screen:˽˽Status – Shows that you are connected.˽˽Device – Shows the subnet and sensor ID.˽˽Speed – Shows the baud rate.
CHAPTER 4 • COMMUNICATION 47˽˽˽˽Duration – Shows how long you have been connected.Failures – Shows the amount of failures during the connection, the percentage rate offailure and a link to the communication error log.Troubleshooting ConnectionsIf you have problems connecting, use the following steps to find the problem:1 Make sure that all power and communication wiring is correct.2 Check the port settings (baud rate, port ID).3 Make sure that the sensor ID is correct.Connection failure can occur for various reasons; if a failure occurs repeatedly, call WavetronixTechnical <strong>Services</strong> at 801-764-0277 for assistance.Communication Protocol TypeOnce the communication parameters are selected, choose the communication protocoltype to be used for the connection.Connecting to an Isolated SensorThis protocol option is recommended when only one sensor exists on the remote end of theconnection (see Figure 4.9).Figure 4.9 – Isolated SensorConnecting to a Sensor in a Multi-drop NetworkConnecting to a sensor in a multi-drop network is recommended when more than onesensor exists on the remote end of a connection. To connect to a sensor on a multi-dropnetwork, either click the radio button next to Automatically detect sensors or select EnterSubnet/ID and enter the multi-drop sensor ID of the sensor you are connecting to (seeFigure 4.10).
48 CHAPTER 4 • COMMUNICATIONFigure 4.10 – Multi-drop NetworkCommunication Screen IconsAt the bottom of the communication screen there is a white bar with icons. This section willexplain the purpose of those icons.Address BookThe Address Book allows you to save device connection settings for future use. Click thebook icon located at the bottom of the Communication page to add new connection settingsto the Address Book (see Figure 4.11).Filters Address BooksDeletes an Address BookImports an Address BookExports an Address BookEdits the Selected DeviceDeletes the Selected DeviceAdds Device to Address BookFigure 4.11 – Address BookPasswordThe key icon allows you to create a password for SSM<strong>HD</strong>. Passwords are associated withthe sensor in order to keep the connection and configuration secure. After clicking the icon,enter the desired password in both text boxes then click OK. This password will now haveto be entered each time you attempt to make a connection (see Figure 4.12).Figure 4.12 – Enter Password Window
CHAPTER 4 • COMMUNICATION 49If you forget the sensor password, use the Click Here link and a new window will openproviding information about how to get a new password.Communication Error LogThe error log contains all errors stored in the sensor’s memory buffer. If you are havingtrouble connecting, using the error log may be helpful in the troubleshooting process. If youcontinue having trouble, save the error log file and contact Wavetronix Technical <strong>Services</strong>.NoteThe error log is cleared every time you close SSM<strong>HD</strong>< so if you need to save the file,do so before shutting the program down.Click the View Error Log link to view the communications error log (see Figure 4.13). Theerror log can also be accessed by clicking on the error log icon at the bottom of the Communicationscreen.Figure 4.13 – Communication Error LogUploading the Sensor’s Embedded SoftwareAfter clicking the Connect button, the software will check to see if your software versionmatches the version of the sensor’s embedded software. If a discrepancy is detected, theVersion Control screen may appear asking you to install firmware upgrades (see Figure4.14). If you think you have reached this screen in error, clicking the Recheck button willhave the software retry and ensure that there has not been a communication issue. Clickingthe Details button will display the current sensor and software information. Click theInstall Upgrade button to upgrade the software.
50 CHAPTER 4 • COMMUNICATIONFigure 4.14 – Version Control (left) and Software Upgrade Details (right)NoteClicking the Close button and continuing configuration may cause problems withfunctionality.The figure below shows how the firmware numbers are interpreted (see Figure 4.15). Themonth number is written in hexadecimal, meaning the months of October, November andDecember will be written as A, B and C respectively.Month(July)Year(2007)Day(5th)Figure 4.15 – Install Upgrade NumbersIf the row marked Digital is highlighted in red, the firmware upgrade may need to be installed.Compare the sensor number with the SSM<strong>HD</strong> number in the digital row of thedetails table. If the SSM<strong>HD</strong> firmware version date is more recent than the sensor firmwareversion date, the firmware upgrade will need to be installed; if the sensor’s firmware date ismore recent than the SSM<strong>HD</strong> firmware version date, a warning will appear notifying youthat the sensor firmware could be downgraded (see Figure 4.16).
CHAPTER 4 • COMMUNICATION 51Figure 4.16 – Downgrading the SensorIf the downgrade message appears, it simply means that the sensor firmware is newer thanthe version of SSM<strong>HD</strong> that was used to connect to the sensor. The newest version ofSSM<strong>HD</strong> can be updated by downloading the software from www.wavetronix.com.Click the INSTALL UPGRADE button to install the firmware embedded in SSM<strong>HD</strong>onto the <strong>SmartSensor</strong> <strong>HD</strong>. The Recheck button will query the sensor to see if the firmwarebundled in SSM<strong>HD</strong> is different from the version running on the sensor.
Sensor Settings 5In this chapter˽˽General Tab˽˽Communication Tab˽˽Advanced Tab5Click the Sensor Settings link on the main menu to change and save settings on the sensor.The Sensor Settings window contains the General, Comm and Advanced tabs.General TabThe General tab contains the following fields (see Figure 5.1):Figure 5.1 – General Tab
54 CHAPTER 5 • SENSOR SETTINGS˽˽˽˽˽˽˽˽˽˽˽˽˽˽Serial Number – Contains the sensor serial number and cannot be edited.Subnet/ID – Allows you to enter the subnet and ID. A subnet can be used to creategroupings of sensors. The subnet default is 000 and the ID default is the last five digitsof the sensor serial number. The ID can be changed, but no two sensors should have thesame ID. The ID must be unique for all sensors on a multi-drop bus.Description – Allows you to enter a description for each sensor. Limited to 32 characters.Location – Allows you to enter the location of the sensor. Limited to 32 characters.Orientation – Allows you to enter the direction the sensor is pointing. This field ispurely for informational purposes and has no effect on performance or the sensor’sphysical mounting.RF Channel – Displays which radio frequency channel the sensor is transmitting on.Using multiple sensors in close proximity will require each sensor to be set to a differentRF channel (see the introduction for more information about mounting sensors inclose proximity).Units – Allows you to display either English (mph/feet) or metric (kph/meters) units.Comm TabThe Comm (communication) tab contains the following settings (see Figure 5.2):Figure 5.2 – Comm Tab˽˽Baud Rate – Allows you to set the baud rate for RS-232, RS-485, Expansion 1 andExpansion 2. A green arrow will indicate the communication link (port) on whichSSM<strong>HD</strong> is connected. The default value is 9600 bps.
CHAPTER 5 • SENSOR SETTINGS 55NoteThe two expansion ports are currently not available for use.˽˽Response Delay – Used to configure how long the sensor will wait before respondingto a message received. This is useful for some communications devices that are unableto quickly change transmission direction. The default value is 10 milliseconds.Advanced TabThe Advanced tab contains the following settings (see Figure 5.3):Figure 5.3 – Advanced Tab˽˽Output Type – Allows you to determine what information is reported. There are twooptions: Antenna reports data as detected by the antenna in the sensor, and Diagnoticreports made-up data for testing and training purposes. Sensors outfitted with extrahardware that allows replay will also have a Replay output type, which is a specialdemonstration mode used for testing and training purposes.NoteIf the sensor is in Diagnostic or Replay mode, it will not detect live traffic.˽˽SS105 Protocol – Allows you to turn SS105 protocol on or off. SS105 protocol must beturned on when being used with Click communication and contact closure devices (itis not necessary if you are only using Click surge and power devices). This does not turn
56 CHAPTER 5 • SENSOR SETTINGS˽˽off native SS<strong>HD</strong> protocol. By default, the SS105 Protocol switch should remain on.RTMS Protocol – Allows you to turn RTMS protocol emulation on or off; only asubset of RTMS data reporting commands are emulated. This does not turn off nativeSS<strong>HD</strong> protocol. By default, the RTMS Protocol should remain off.NoteIf you are using a <strong>SmartSensor</strong> <strong>HD</strong> in an RTMS-based system, there are two waysto collect data from the sensor. If your system is set up to poll the sensor, the RTMSprotocol must be turned on so the sensor can respond to RTMS commands. If yoursystem is simply listening for data pushes from the sensor, the RTMS protocol doesnot need to be turned on. See Chapter 7 for more information on data push.˽˽˽˽RTMS ID – Allows you to enter the RTMS ID number. The RTMS ID field will onlybe editable if the RTMS Protocol switch is turned on.HW Handshaking – Turns hardware handshaking for each communication port on thesensor on or off. If you are connecting your sensor to an RS-232 device (such as somemodems), you may need to turn hardware handshaking on. These devices sometimesrequire flow control handshaking because they cannot keep up with the data rates ofhigher-performance devices like personal computers and <strong>SmartSensor</strong> <strong>HD</strong>. Smart-Sensor Manager <strong>HD</strong> and <strong>SmartSensor</strong> <strong>HD</strong> have built-in support for RS-232 flowcontrol hardware handshaking; this support allows the <strong>SmartSensor</strong> <strong>HD</strong> and Smart-Sensor Manager <strong>HD</strong> to work with these slower modem connections. Table 5.1 gives abrief description of each RS-232 line.LineTXRXRTSCTSTable 5.1 – RS-232 LinesDescriptionTransmit data lineData receive lineRequest to send flow control hardware handshaking lineClear to send flow control hardware handshaking lineFigure 5.4 shows the connections when <strong>SmartSensor</strong> <strong>HD</strong> connects directly to thecomputer running <strong>SmartSensor</strong> Manager <strong>HD</strong>.
CHAPTER 5 • SENSOR SETTINGS 57<strong>SmartSensor</strong>ConnectorPowerWiresTXRXCTSRTSRXTXRTSCTSRS-485WiresNull Modem CableDTE Device (PC)Figure 5.4 – RS-232 Connections˽˽In order to use hardware handshaking, the sensor’s RTS and CTS signals must beproperly connected. If the Flow Control option under the Serial and/or Modem Connectionscreens’ Advanced Settings is set to Hardware, you will not be able to connectif the sensor’s HW handshaking setting has been previously turned off. The reason youcannot connect is that the sensor’s RTS line is not asserted; as that line is connectedto the computer’s CTS line, the computer will not forward data messages it is given by<strong>SmartSensor</strong> Manager <strong>HD</strong>. To successfully connect, simply change the Flow Controlsetting in the Advanced Settings menu to None.Termination – Electronically turns communication bus termination on or off. This terminationapplies only to RS-485 ports. Only the end devices on a RS-485 bus shouldbe terminated. In general, the termination can be left in the default on position until amulti-drop bus becomes overloaded.
Lane Setup 6In this chapter˽˽1. Sensor Alignment˽˽2. Lane Configuration – Automatic˽˽2. Lane Configuration – Manual˽˽3. Lane Verification6Click the Lane Setup link on the main menu to align and configure the sensor, and toverify functionality (see Figure 6.1).˽˽˽˽˽˽Sensor Alignment – Allows you to verify and adjust the sensor’s side-to-side alignmentto the roadway.Lane Configuration – Allows you to automatically configure the sensor, manually adjustthe lanes (if needed) and edit and save the configuration.Lane Verification – Allows you to verify that the sensor is detecting accurately and tomodify individual lane performance.
60 CHAPTER 6 • LANE SETUPFigure 6.1 – Lane Setup Screen1. Sensor AlignmentThe sensor should be properly aligned before beginning lane configuration, so SSM<strong>HD</strong>includes an alignment feature that gives visual and audio confirmation when the perpendicularalignment of a sensor is correct. Follow the steps below to access the sensor alignmentfeature:1 Click on the Lane Setup link on the main menu.2 Click on the Sensor Alignment button.Adjust the sensor according to the sensor displayed in the Sensor Alignment window. Agreen arrow means the sensor is correctly positioned for optimal performance (see Figure6.2); a yellow or red arrow means the sensor is NOT correctly aligned with the roadway.For audio verification, check the Sound box.Figure 6.2 – Sensor Alignment
CHAPTER 6 • LANE SETUP 61NoteIn order for the sensor alignment tool to function properly, traffic must be flowingfreely. Also, if the sensor is not already aligned close to perpendicular to the flow oftraffic, the sensor alignment tool will display a message indicating that the sensor istoo far out of alignment for the tool to function properly. Realign the sensor manuallyan then fine-tune the alignment with the tool. After each adjustment of the sensor,several vehicles must pass before the alignment tool's output is valid.It may be difficult to align the sensor if there are non-parallel lanes of traffic. In this case,mark the non-parallel lanes as Inactive or Excluded in the lane configuration screen, andthe sensor alignment tool will ignore vehicles traveling in these lanes.NoteIn cases where traffic lanes are not exactly parallel, the percentage of vehicles withreported speeds may decrease in the lanes that are skewed.2. Lane Configuration – AutomaticThe Lane Configuration screen can be used to automatically or manually configure theroadway, manipulate lanes, and control how you see the information onscreen. To reach thescreen, click the Lane Configuration button.One of the advantages of the <strong>SmartSensor</strong> <strong>HD</strong> is the fast and simple lane auto-configurationfunction, where the sensor automatically configures the roadway and sets up the lanesbased on passing traffic (see Figure 6.3).
62 CHAPTER 6 • LANE SETUPTools MenuSidebarTools IconFigure 6.3 – Buttons Used in Automatic Lane ConfigurationFollow the steps below to automatically configure the <strong>SmartSensor</strong> <strong>HD</strong>:1 Once the Lane Configuration window appears, click the Tools icon and select ClearEdit Area.2 Click the Tools icon again and then click Restart Auto Cfg.NoteYou may need to click on the magnifying glass icon and select Show Auto Lanes forthe automatically discovered lanes to appear.Depending on where the sensor is mounted and on the amount of traffic, the configurationprocess could take a few minutes. Once the <strong>SmartSensor</strong> <strong>HD</strong> has detected vehicles andcreated the appropriate lanes, click OK and a window will appear asking you to save thechanges to the configuration. Click Yes and the configuration will be saved.Follow the steps below if only a portion of the automatically defined lanes are desired:1 Click anywhere in the Lane Configuration screen.2 Check the Hide Auto-Lanes box and the automatically configured lanes will disappear.3 Click on the desired automatic lane in sidebar (when the sidebar is set to 1) and theAutomatic Lane window will appear (see Figure 6.4). This window allows you to selectthe lanes you want to appear in the roadway. To have all lanes appear in the roadway,click the Copy Sidebar button; to have individual lanes appear in the roadway, clickthe Copy Lane button. You can also copy the entire sidebar and then delete the unwantedlanes by clicking on them and selecting Delete.
CHAPTER 6 • LANE SETUP 63Figure 6.4 – Automatic Lane Window2. Lane Configuration – ManualThe Lane Configuration screen can also be used to manually configure and adjust lanes(see Figure 6.5). The following functions and tools are available on the Lane Configurationscreen.Deletes the Selected DeviceDeletes the Selected DeviceSidebarDeletes the Selected DeviceSidebar ButtonVehicle Display Tools MagnifyingGlassFigure 6.5 – Lane Configuration ScreenSidebarsThe sidebar buttons on either side of the Lane Configuration window control the sidebardisplay. Click and hold the button to see a list of the following different display modes (seeFigure 6.6):
64 CHAPTER 6 • LANE SETUPFigure 6.6 – Lane Configuration Sidebar Options˽˽˽˽˽˽˽˽˽˽Auto Cfg – Shows the lanes that are automatically configured by the sensor.Saved Cfg – Shows the lanes that are saved on the sensor.Scale – Shows the distance from the <strong>SmartSensor</strong> <strong>HD</strong> to each lane.Centers – Shows the relative occurrence of events. Larger arrows indicate a greaternumber of vehicles at a given range.Tracks – Shows a track for each detected vehicle; a line is drawn at the center of eachvehicle that passes. This sidebar is very useful for manually adding lanes. Click on thetracks sidebar to clear all tracks and start again.Vehicle DisplayThe Vehicle Display button opens a menu that allows you to configure how vehicles aredrawn and what information is displayed on them.In range mode, vehicles are drawn at the correct range regardless of lane definitions. In lanemode, only vehicles detected in configured lanes will be displayed.SSM<strong>HD</strong> is able to display the detected speed, length, length-based class (see Bin Definitionsin Chapter 7) or no information for each vehicle (see Figure 6.7). To choose to showno information for the vehicle, click again on the option that is currently checked to deselectall options.Figure 6.7 – Vehicle Display OptionsToolsThe Tools button opens a menu that allows you to automatically configure the sensor, saveand load configurations to files and reboot the sensor (see Figure 6.8). Saving or loading the
CHAPTER 6 • LANE SETUP 65configuration only saves or loads lane configuration information (see the Tools section onthe main menu to save all sensor configuration parameters).Figure 6.8 – Tools OptionsMagnifying GlassThe Magnifying Glass button opens a menu that allows you to show or hide automaticallyconfigured lanes, lane names and vehicle direction; you can also view a compass (see Figure6.9). Many of these options can also be turned on or off simply by clicking on them in theedit area.Figure 6.9 – Show/Hide LanesNoteThe orientation of the compass is based on the orientation chosen under Sensor Settings(see Chapter 5). Changes to the orientation there will result in the compassin the Lane Configuration screen changing to match; conversely, changing the orientationof the compass on the Lane Configuration screen (done by clicking on it)will change the orientation setting under Sensor Settings. The orientation does notaffect the alignment or operation of the sensor and is simply for your information.Shoulder AreaClick in the shoulder and the Shoulder Area window will appear, allowing you to add orexclude the shoulder you just clicked on (see Figure 6.10). This is useful when aligning
66 CHAPTER 6 • LANE SETUPthe sensor when there are non-parallel lanes in its field of view. Alternatively, it can alsostop events from being generated in any non-lane areas. In the Lane Verification screen,and when the sensor is reporting data, any vehicles in non-lane defined areas will not beshown regardless of whether the area is excluded or not. Click in an excluded area and theExcluded Area window will appear, allowing you to include the area again.Figure 6.10 – Edit Area WindowLane WindowClick anywhere on a lane and the Lane window will appear, allowing you to changethe name, direction and activity of a lane (see Figure 6.11). SSM<strong>HD</strong> uses “LANE_xx”as the default lane name where “xx” is the number of the lane in range, beginning with“LANE_01.” When a new lane is added, all lanes with the default lane name format willautomatically be renamed to indicate their increasing number in range. If this is not desired,the lane names can be changed in any way; lane names are case and symbol sensitiveand are limited to eight characters.For RTMS and Z4 data push types, the mapping of the lanes may be changed using thenotation #xx (e.g. #08), where 08 is a lane number between 1 and 99. In this case, ALLlanes in the configuration must be assigned a lane number using the #xx notation in orderfor the new lane mapping to take effect.Figure 6.11 – Lane Adjustment WindowThe direction button allows you to set the direction for the lane—Left, Right or Bidirectional.The direction chosen determines what data is shown: if Right is the set direction fora lane, only traffic going to the right will be detected; and if Left is the set direction for alane, only traffic going to the left will be detected (when Direction Protection is on). If thelane is set to Bidirectional, data will be reported for traffic going both directions. This isuseful for lanes that change direction depending on the time of day. Selecting Bidirectionalis essentially the same as turning off Direction Protection for that lane (see the Lane Ad-
CHAPTER 6 • LANE SETUP 67justments section in Chapter 6 for more information on Direction Protection).NoteAll detected vehicles are shown on the Lane Configuration screen, regardless of direction.Click the Exclude button to exclude a lane (the lane will turn red once it has been excluded)or click the Delete button to delete a lane. Excluded lanes will not be configuredand SSM<strong>HD</strong> will stop showing events in those particular lanes. Click the excluded laneand click the Include Area button to include the lane.The Lane window also allows you to set a lane as active or inactive. Inactive lanes are usefulwhen a lane has been correctly configured and tuned, but data reporting for the lane is notdesired. By making the lane inactive instead of deleting it, the lane may be turned on at anytime and will retain the proper configuration and tuning.Saving the ConfigurationFollow the steps below to save the configuration to a file:1 Click on the Tools button on the bottom right of the Lane Configuration screen.2 Select Save to File.Undoing Manual ChangesTo undo changes you have made to the configuration, click on the Tools button in theLane Configuration screen and select Undo Last Edit from the choices displayed. To undoall changes made to the configuration, click the Tools button and then select Clear EditArea.3. Lane VerificationTo verify that the lanes were configured properly, close the Lane Configuration screen andselect Lane Verification from the Lane Setup menu.The Lane Verification screen allows you to monitor lane detection accuracy and to adjustthe lane properties for better detection.SidebarsClick and hold the sidebar buttons on either side of the Lane Verification window to viewthe following options (see Figure 6.12):
68 CHAPTER 6 • LANE SETUP˽˽˽˽˽˽˽˽Presence – Displays buttons to the side of each lane that will light up while the vehicleis being detected.Volume – Displays the number of events in each lane.Speed – Shows the average speed of each individual lane.Classes 1–8 – Show count for each length-based class, which can be created using theClass Definitions feature. The number of class bins that appear in this window will bethe same number of class bins that were created (see Bin Definitions in Chapter 7).Figure 6.12 – Lane Verification Sidebars with Four ClassesVehicle DisplayThe Vehicle Display button in the Lane Verification window opens a menu that allowsyou to view associated speed, length, length-based class or no additional data. To switchthe display, click on the Vehicle Display button and choose which method to display (seeFigure 6.13).Figure 6.13 – Vehicle Display WindowPlay/Pause/Stop ButtonsThe Play, Pause and Stop buttons allow you to control the data display. When Pause isselected, vehicles traveling on the screen will not be included in the presence, volume, speedor class sidebars. Click the Play button to add new vehicles to the running totals for allsidebars; click the Stop button to reset all volume, speed and class numbers to zero.Lane AdjustmentLane performance can be adjusted by clicking anywhere inside a lane and using the Lane
CHAPTER 6 • LANE SETUP 69Adjustment tool (see Figure 6.14). The drop-down list allows you to adjust lane volume,detection, speed, length, extension time or direction protection. To return to default settings,select Set Defaults from the drop-down list and click the OK button. Each laneadjustment is independent of other lanes; setting one lane back to defaults using the SetDefaults option will not affect the other lanes.Figure 6.14 – Lane Adjustment Window˽˽˽˽Volume – This setting should be adjusted first when a problem with count accuracy isobserved. The default is 100%. This setting adjusts the aggressiveness of traffic radarspecificalgorithms and is not an arbitrary scale factor. By increasing the percentage by10% to 15%, you are likely to begin to increase the number of detection, and by decreasingthe percentage by 10% to 15%, you are likely to begin to decrease the numberof detections. Small adjustments of only 1% or 2% may actually have no impact on thedetection performance. Practical values for this setting are typically between 20% and190%. If the volume lane adjustment is below 20%, many detections in that lane willprobably be missed; if it is set greater than 190%, many false detections will probablyoccur.Detection – Raises or lowers the threshold for detecting vehicles. The sensor automaticallydetermines where the threshold will be placed, and then adds in this tuningparameter. Entering a larger number will result in fewer detections; entering a smallnumber will result in more detections. The default is 0 dB.NoteChanging the detection tuning parameter can drastically effect vehicle detection.˽˽˽˽˽˽Speed – Raises or lowers the speed calculated for all vehicles in each lane. The sensorcalculates the speed, and then multiplies the speed by this factor. The default is 100%.Length – Increases or decreases the length for all vehicles in each lane. The sensorcalculates the length and then adds the length factor. The default is 0 (feet or metersdepending on sensor units used).Extension Time – Changes the extension time, which the sensor uses to prevent vehicleswith trailers from being broken into multiple detections. A longer extensiontime will prevent this, but can lead to multiple vehicles being merged into a single
70 CHAPTER 6 • LANE SETUPdetection. The sensor automatically determines the extension time and then multipliesby this factor. The default value is 100%.NoteThere must be a minimum of 5.5 ft (1.68 m) between vehicles in order for them to bedetected as separate vehicles. This separation requirement may increase as vehiclespeeds increase.˽˽Direction Protection – Allows you to turn Direction Protection on or off. When DirectionProtection is on (default), data will be shown only for vehicles that are goingin the direction set for that lane. For example, if a lane is set for traffic moving north,any traffic in that lane that may be moving south will be ignored. However, if the sensordetermines that most vehicles are going a direction different from the one that wasconfigured (e.g. during hurricane evacuation), the sensor will begin reporting vehiclesgoing all directions. Turning off Direction Protection allows SSM<strong>HD</strong> to always reportdata from vehicles going both directions.NoteIf a lane has been configured to be bidirectional, Direction Protection will be disabled.
Data Setup and Collection 7In this chapter˽˽Interval Data˽˽Per Vehicle Data˽˽Loop Emulation˽˽Data Storage & Download˽˽Bin Definitions˽˽Approaches˽˽Date and Time˽˽Data Push7Click the Data Setup & Collection link to log interval and per vehicle data; change loopsize and spacing; store and download data; set bin definitions; define approaches; synchronizecomputer and sensor times; and push data (see Figure 7.1).
72 CHAPTER 7 • DATA SETUP & COLLECTIONFigure 7.1 – Data Setup & Collection ScreenInterval DataInterval data refers to the data collected about all the vehicles that pass the sensor in a setamount of time. This interval of time should be carefully chosen because the length of itaffects how long the sensor can store data onboard. A shorter interval means the sensor recordsdata more often, which means that the sensor’s onboard memory fills up faster. A longerinterval means you can leave the sensor alone for longer periods of time. Ultimately theinterval size should be selected to meet the requirements of your application. For example,in real-time applications, onboard storage capacity may not be a concern at all and the datamay need to be aggregated over short periods of time (20 seconds) to reduce reporting latency.To access, click the Interval Data button in the top left corner of the Data Collectionscreen (see Figure 7.2). See the Storage Status section in this chapter for more information.Figure 7.2 – Interval Data for Lanes (left) and Approaches (right)
CHAPTER 7 • DATA SETUP AND COLLECTION 73NoteIf the volume in the interval is zero, and the occupancy is less than 20%, the speedin the interval will be the speed of the previous interval. If the volume in the intervalis zero, and the occupancy is more than 20%, the speed in the interval will be zero.The interval data screen displays the following information for each lane or approach, dependingon which tab you’ve selected (to see all columns, use the cursor to click and dragthe screen to the right or left):˽˽Name – Displays the name of each lane or approach. To change the name, go to theLane Configuration screen or the Approaches screen.˽˽Volume – Shows the number of vehicles detected during the interval.˽˽Occupancy – Gives the percentage of time during the interval that the detection zonewas occupied.Occupancy is calculated by summing the durations of all vehicles in the interval and dividingthat quantity by the length of the interval. For example, if the interval length is fiveminutes and 100 vehicles pass the sensor during the interval with a duration of 0.09 secondseach (sum of the durations is 9 seconds), then the occupancy for that interval wouldbe calculated by dividing 9 seconds by 300 seconds, which is 3%.Before summing the vehicle durations, compensation is applied to the durations to removethe width of the antenna beam at the vehicles’ range and to add the loop size. The purposeof this compensation is to make the occupancy measurement consistent over the wholerange of the sensor and to make the occupancy measurement comparable to an occupancymeasurement generated by a loop the size of the loop size setting.The following equation represents the occupancy calculation described above:1Interval Size*∑Vehicle Duration * Vehicle Speed - Antenna Beam Size + Loop SizeAll Vehicles inVehicle Speedthe Interval˽˽Speed – Indicates the average lane speed during the interval. A negative number willbe reported for speed in the following cases: (1) The lane was configured to the leftor right and Direction Protection was on, but traffic was traveling against the configureddirection, indicating that the direction of the lane has switched. This is useful inhurricane evacuation scenarios. (2) The lane was configured to the left or right andDirection Protection was off, but more vehicles were detected traveling against theconfigured direction than were detected traveling with the configured direction for thegiven data interval.Unlike per vehicle data, lanes that are configured as bidirectional will always reportpositive average speeds in the interval data.
74 CHAPTER 7 • DATA SETUP & COLLECTION˽˽˽˽˽˽˽˽85% – Shows the 85th percentile speed. Eighty-five percent of the vehicles in theinterval were going this speed or slower.Headway – Displays the average time separation between vehicles detected during theinterval, measured from front bumper to the front bumper of the following car.Gap – Shows the average time separation between vehicles detected in the interval,measured from the back bumper of the first car to the front bumper of the second.Classes – Refers to length-, speed-, and direction-based bins (see Bin Definitions laterin this chapter). These columns show the number of cars from each length, speed anddirection class that were detected during the interval.To change the interval time, click on the Interval icon at the bottom of the screen; theinterval time can also be changed in the Data Storage & Download screen.NoteThe Interval Data timestamp displays the ending time of the interval.Log FileTo create a log file, click on the folder icon in the Logging section, select the type of datayou want to log and click OK. Begin logging the interval data by clicking the On/Offswitch; logging will be terminated if the Interval Data screen is closed.NoteInterval data is stored onboard the sensor. To access old interval data information,see the Data Storage & Download section of this chapter.Per Vehicle DataPer vehicle data is data that is recorded each time a vehicle is detected. To access, click thePer Vehicle Data button in the Data Collection screen (see Figure 7.3). To begin loggingper vehicle data, turn the logging button on by clicking the On/Off switch. You can alsopause the recording of events by clicking the Pause button in the bottom left corner of thescreen. Logging will be terminated if the Per Vehicle Data screen is closed.
CHAPTER 7 • DATA SETUP AND COLLECTION 75Figure 7.3 – Per Vehicle DataThe Per Vehicle Data screen displays the following information about each vehicle detected:˽˽˽˽˽˽˽˽Lane – States the lane in which the vehicle was detected.Timestamp – Displays the time at which the vehicle was detected.Speed – Shows the speed of the vehicle in miles per hour. A negative number will bereported for speed in the following cases: (1) The lane was configured to the left orright and Direction Protection was on, but traffic was traveling against the configureddirection, indicating that the direction of the lane has switched. This is useful inhurricane evacuation scenarios. (2) The lane was configured to the left or right andDirection Protection was off, but more vehicles were detected traveling against theconfigured direction than were detected traveling with the configured direction forthe given data interval. (3) The lane was configured as bidirectional and the lane istraveling to the left (Vehicles traveling to the right have positive per vehicle speeds inbidirectional lanes).Length – Displays the length of the vehicle in feet.NotePer vehicle data is NOT stored onboard the sensor. To collect per vehicle data, a laptopor handheld computer must be connected to the sensor.Loop EmulationThe <strong>SmartSensor</strong> <strong>HD</strong> can emulate dual loops. The Loop Emulation Setup screen allowsyou to adjust loop size and spacing for this function (see Figure 7.4). The settings changedon this screen will apply to all configured lanes.
76 CHAPTER 7 • DATA SETUP & COLLECTION˽˽˽˽Loop Size – Adjusts the size of the loops.Loop Spacing – Adjusts the loop spacing.Figure 7.4 – Loop EmulationThese settings are read by a Click contact closure device and used so that the contact closurescan be properly timed to emulate a given loop size and spacing. The loop size is alsoused by the sensor in the occupancy calculation. For example, larger loop sizes will resultin higher occupancy numbers in the interval data. However, adjusting these parameterswill not modify the reported vehicle length or speed (see the Lane Adjustment section inChapter 6 of this user guide to accomplish these tasks).Data Storage & DownloadThe Data Storage & Download window contains the following three sections (see Figure7.5):˽˽˽˽˽˽Storage Settings – Allows you to adjust the data interval length and how data is stored.Storage Status – Shows a storage timeline, the storage level and the amount of storagespace remaining.Data Download – Allows you to retrieve the data from the sensor and store it in reportformat to a laptop or handheld computer.
CHAPTER 7 • DATA SETUP AND COLLECTION 77Figure 7.5 – Data Storage and Download1. Storage SettingsClick the Storage Settings button to specify and initialize the storage options (see Figure7.6).Figure 7.6 – Storage Settings˽˽˽˽˽˽Data Interval Length – Specifies the data interval length in hours, minutes and seconds.The data interval must be 10 seconds or greater.Storage Mode – Specifies how the data will be stored and erased once the memory isfull. The First-in, first-out (FIFO) option means that the data that was stored first willbe the first to be deleted once the storage capacity is reached. The Stop when FULLoption means that the sensor will stop storing data once the storage capacity is reached,and consequently all new data will not be saved to memory.Delete Storage – Deletes the data storage. After clicking the eraser icon, you will beprompted to confirm the delete. Once data storage is deleted, it is not recoverable.Before deleting the data, it is recommended that you run the Data Download option
78 CHAPTER 7 • DATA SETUP & COLLECTION˽˽to store a copy of the data on a PC or laptop.ON/OFF Switch – Allows you to turn the sensor’s data storage feature on or off.2. Storage StatusThe Storage Status window shows the timeline, current storage remaining, and storagecapacity of the sensor (see Figure 7.7).Figure 7.7 – Storage Status˽˽˽˽˽˽Timeline – Shows the date and time that the first and last interval data packet wasstored.Current Level – Shows you how much storage is remaining by both a status bar and apercentage.Capacity (mm:dd:hh:mm:ss) – Shows you how long the sensor has been storing dataand how long the sensor will continue to store data before reaching maximum capacity.The capacity is tracked in months, days, hours, minutes and seconds and is based uponthe current sensor configuration. The total number of intervals stored is dependentupon the number of configured lanes, approaches and bin data types. If data is storedwith a different number of lanes, approaches or bin data types from the current sensorconfiguration, the Total field in the Capacity section will be incorrect. In this case, theCurrent Level section is a better indicator of storage capacity. Additionally, using avirtual connection will also cause the information in this screen to be incorrect.
CHAPTER 7 • DATA SETUP AND COLLECTION 79NoteSome of the settings discussed in this chapter can affect the storage capacity ofyour sensor. Changing such data collection settings as the length of the interval forcollecting interval data and the number of bins and approaches configured will affecthow many reports your sensor can store onboard (see Table 7.1 for examples). Alwayscheck back to the Storage Status screen after you have changed all other settings toget the most accurate information on how often your sensor will need to have informationon how often your sensor will need to have information downloaded from it.IntervalLanes &ApproachesClass Bins Speed Bins Onboard StorageCapacity20 sec 4 4 0 17 days20 sec 12 4 0 6 days20 sec 12 4 10 3 days15 min 4 4 0 25 months 29 days15 min 12 4 0 9 months 26 days15 min 12 4 10 5 months 3 days1 hour 4 4 0 103 months 29 days1 hour 12 4 0 39 months 15 days1 hour 12 4 10 20 months 13 daysTable 7.1 – Examples of Onboard Storage Time Based upon Configuration3. Data DownloadThe Data Download window allows you to specify the time for which stored data will retrievedand the location where it will be saved to file (see Figure 7.8).
80 CHAPTER 7 • DATA SETUP & COLLECTIONFigure 7.8 – Data Download˽˽˽˽Filename – Allows you to specify what file the data is going to be sent to. Click themagnifying glass icon to browse possible downloading destinations.Download Type – Allows you to select the desired type of data download. To downloadall data on the <strong>SmartSensor</strong> <strong>HD</strong>, click the ALL data stored aboard sensor radio button.If the same computer is used each time, the New data since previous downloadwill start with the newest data and work back to the previous data download point. TheData from specific time period may also be used to download specific data; enter thebeginning and ending dates and times to do so. SSM<strong>HD</strong> also keeps a record of the lastinterval downloaded from each sensor.The Use bulk download checkbox allows you to download all information from thesensor at one time. This option should only be used with high latency modem connections.The Save in binary format option allows you to download and save the file inbinary format.NoteDownloading all the data may take several hours.Data Formats<strong>SmartSensor</strong> Manager <strong>HD</strong> will download data from the sensor and store it in a tabularASCII format with a new row for each lane or approach at each time step (see Figure 7.9).The data can be analyzed by various software tools or loaded into databases by programmingcustom import routines. Wavetronix Command products can also retrieve intervaldata directly into an SQL database.
CHAPTER 7 • DATA SETUP AND COLLECTION 81Figure 7.9 – Data FormatBin DefinitionsThe term “bins” refers to classifications of vehicles based on their length, speed or direction.Once bins are set, data can be collected for these groupings of vehicles; for instance, thesensor can count for you how many passing vehicles are driving between 90 and 100 mph.Adding more bins causes data records to be larger, meaning that your sensor’s onboardmemory fills up faster and must be downloaded from more often. See the Storage Statussection of this chapter for more information on how to figure out how many days’ worth ofmemory your sensor has based on its current settings.Click the Bin Definitions button in the Data Collection screen to access the Bin Definitionswindow (see Figure 7.10).Figure 7.10 – Bin DefinitionsThere are bins for class, speed and direction. There are up to 8 class bins, 15 speed binsand 2 direction bins; all or none of these bins may be simultaneously configured and thenumber of configured bins will impact the interval storage capacity, as well as interval datadownload time.The direction bins are configured as Right and Wrong. This refers to whether vehicles ina given lane are traveling in the direction the lane is configured (to change lane direction,use the lane window in the Lane Configuration screen). This is most useful in the case of
82 CHAPTER 7 • DATA SETUP & COLLECTIONreversible lanes, where traffic goes different directions in a lane depending on the time ofday. In this case, for part of the day the vehicles would be counted in the Right bin; duringthe other part of the day, the vehicles would be counted in the Wrong bin.The class bins allow you to classify vehicles by ranges of lengths. If you’re not sure whatlengths to use, consult your own agency’s guidelines. If your agency has no set classificationscheme, you can look to the measurements in Table 7.2 as an example; the tables show ascheme called Scheme F, developed by the Maine DOT.4 Classification BinsLengths Scheme F0–10 110–19 2, 319–35 4, 5, 635–256 7-136 Classification BinsLengthsScheme F0–10 110–19 219–24 324–54 4, 5, 6, 754–109 8, 9, 10109–256 11, 12, 13Table 7.2 – Scheme F Length ClassificationsApproachesApproaches are groupings of lanes used in data collection. Using approaches allows you tocollect per vehicle–based statistics that you could not otherwise get, such as the 85th percentilespeed for all northbound lanes, and to store these statistics onboard the sensor. Beaware that adding approaches will increase the size of your data reports, which will affectthe number of these reports your sensor can store in its onboard memory. See the StorageStatus section of this chapter for more information.Click the Approaches button in the Data Collection window to group lanes together infour different approaches (see Figure 7.11).
CHAPTER 7 • DATA SETUP AND COLLECTION 83Figure 7.11 – ApproachesApproaches are used in interval data and will contain the same type of information thateach lane would. An advantage to using approaches rather than post-processing individuallane data is that approaches gather aggregate data. An example of when this would be usefulis in determining speed limits. Using approaches, the sensor could find the 85th percentilespeed for all cars in all lanes going one direction, rather than finding it for each lane.When lanes of differing directions are used, the absolute value of the speed is used to calculateall speed fields. Also, the Right and Wrong direction bins will contain the total numberof vehicles traveling with the user-defined direction of the corresponding lanes in the Rightbin, and all others in the Wrong bin.To create an approach, select the desired lanes and click thebe named to coincide with the purpose of the approach.button. Each approach canDate and TimeClick the Date and Time button on the Data Collection window to access the Date &Time window (see Figure 7.12).
84 CHAPTER 7 • DATA SETUP & COLLECTIONFigure 7.12 – Date & TimeTo sync the sensor date and time with the computer, click thebutton and click OK.The sensor itself stores time in Coordinated Universal Time (UTC), formerly known asGreenwich Mean Time (GMT), and does not account for daylight saving time. SSM<strong>HD</strong>uses the local setting of the computer it is running on to display the date and time in localunits.ExampleIf someone in Pacific Standard Time (PST) connect to a sensor and synchronizes thetime, then when someone in Mountain Standard Time (MST) connects to the samesensor the time will be correctly displayed as MST. If the settings on either PC adjustsfor daylight savings, then this adjustment will also be correctly displayed.Data PushUse the data push function to set your sensor to periodically push data to your computerwithout waiting for a request from SSM<strong>HD</strong>. Click the Data Push button on the DataCollection window to access the Data Push window (see Figure 7.13).When data push is required for use with a Click device, it is automatically configured bythe Click device during its autobaud process. If data push is required for any other use, itmust be manually configured.
CHAPTER 7 • DATA SETUP AND COLLECTION 85Figure 7.13 – Data PushTo enable data push, select the Event, Interval or Presence tab, then select which methodof communication and format you are using and turn the function on.PortThis allows you to select the <strong>SmartSensor</strong> <strong>HD</strong> communications port through which thedata will be pushed. If the sensor is pushing data on a half-duplex communication port, thesensor may not respond to commands due to collisions on the communications bus.Note<strong>SmartSensor</strong> <strong>HD</strong>'s native RS-232 and RS-485 ports are both half duplex.FormatThe following formats are available for all three data types:˽˽˽˽˽˽SS125 Format – This outputs the data in the native SS125 format (see the <strong>SmartSensor</strong><strong>HD</strong> Released Communications Protocols document, available at www.wavetronix.com,for information on this format).SS105 Simple Format – This outputs the data in the SS<strong>HD</strong> SS105 emulation formatwithout a multi-drop header (see the <strong>SmartSensor</strong> <strong>HD</strong> Released Communications Protocolsdocument for information on this format).SS105 Multidrop Format – This outputs the data in the SS<strong>HD</strong> SS105 emulation formatwith a multi-drop header (see the <strong>SmartSensor</strong> <strong>HD</strong> Released Communications Protocolsdocument for information on this format).For Event Data, there are six additional format options. All of them output the data in Z4format. Z4 is a Wavetronix-specific protocol that allows sensors to talk to other Wavetronix
86 CHAPTER 7 • DATA SETUP & COLLECTIONdevices, such as Click contact closure devices. The specific formats are as follows:˽˽Z4 2-Loop – With this format, speed and duration are measured using the loop sizeand space determined on the Loop Emulation page.˽˽Z4 1-Loop – With this single-loop format, only duration can be determined.˽˽Z4 2-Loop Pulsed – With this format, the outputs will be held active for 125 ms foreach vehicle detected, so only speed will be measured.˽˽Z4 1-Loop Pulsed – This format is simply a presence detector (no speed or durationinformation).˽˽Z4 1-Loop Speed – This single-loop format has a set vehicle length of 15 feet, so thefocus is on speed.For Interval Data, there are two additional formats:˽˽˽˽SS125 (legacy) – This format emulates the interval data from older versions of the<strong>SmartSensor</strong> <strong>HD</strong>; it is similar to the current format but lacks speed bins and directionbins and has fewer length-based classes.RTMS Format – This format is only available in the Interval Data push configurationand will output the data in the SS<strong>HD</strong> RTMS emulation format (see the <strong>SmartSensor</strong><strong>HD</strong> Released Communications Protocols document for information on this format).For Presence Data, there is one additional format:˽˽Z4 Presence – This outputs data in the Z4 format.DestinationThis is the address the sensor will push data to and is only valid for SS125 and Z4 formats.For SS125 format, it is the 8-bit subnet / 16-bit ID, and for Z4 format it is a 24-bit address.Any value up to 255/65535 for SS125 format or 16777215 for Z4 format is valid, but makesure that this destination address is unique for the communications bus in use. CheckingBroadcast will push the data to the broadcast address (000/65535 for SS125 and 16777215for Z4). The SS125 communications protocol reserves subnet/ID 000/00000 for softwareapplications. The subnet/ID should be set to 000/00000 if the <strong>SmartSensor</strong> <strong>HD</strong> is pushingdata to a custom software application.
Tools 8In this chapter˽˽Backup/Restore˽˽Licensed Features8The Tools section allows you to backup sensor data and view the sensor's licensed features(see Figure 8.1).Figure 8.1 – ToolsBackup/RestoreAccess Backup/Restore by clicking the Backup/Restore button on the Tools screen (seeFigure 8.2).
88 CHAPTER 8 • TOOLSFigure 8.2 – Backup/RestoreBack-up FileThe backup function allows you to backup the sensor settings you have changed. To createa backup, click on the magnifying glass icon in the Back-up File section. Choose a destination,type in a filename, and hit OK, then click the Back-up Sensor Setup button.NoteThe backup will appear as an .ssc file. While this file can be opened as a text file byusing a program such as Notepad, do not edit the file, as it will change the settingsyou backed up.Restore FileThe restore function allows you to restore a set of sensor settings you have backed up. Torestore, click on the magnifying glass icon in the Restore File section. Select the backup fileyou wish to restore, hit OK, and then click the Restore Sensor Setup button.WarningRestoring sensor settings will cause you to lose the settings you currently have, unlessthey are backed up.
Licensed FeaturesCHAPTER 8 • TOOLS 89The Licensed Features window contains all of the current configuration features that areinherent to the sensor:Figure 8.3 – Licensed Features˽˽˽˽˽˽Serial Number – Shows the serial number of the sensor.License Date – Shows the date the sensor was licensed.Features – Lists features inherent to the sensor and shows the status that has beenlicensed for each feature.NoteFor more information on each feature, see the earlier chapters in this book.˽˽License Upgrade File – In the future this field will be used to upgrade licensed features,but for now it can be ignored.
AppendixIn this chapter˽˽Appendix A - 8-conductor Cable Connector˽˽Appendix B - 9-conductor Cable Connector˽˽Appendix C - Cable Lengths˽˽Appendix D - Direct Serial Connections˽˽Appendix E - Signaling DelaysAppendix A - 8-conductor Cable ConnectorThe 8-conductor cable (used with certain newer <strong>SmartSensor</strong> <strong>HD</strong> installations) is composedof eight conductors plus a drain wire, all surrounded by a shield. See Figure A.1 fora diagram of the 8-conductor cable’s 10-pin socket assignment. The codes listed in thediagram are to be used to solder wires into the back of the plug where the letters representthe individual solder cups.
92 APPENDIX • SMARTSENSOR <strong>HD</strong> USER GUIDEH=7+DCRedA=1-DCBlackBNCG=10232 TXYellowK=11232 RXVioletJ=9232 CTSBrownC=9232 RTSOrangeF=12+485Blue/WhiteE=6-485BlueD=5Drain/shieldFigure A.1 – 8-conductor Cable Plug Connector Socket Assignment (seen from the solder cupside of the connector)Appendix B - 9-conductor Cable ConnectorThe 9-conductor cable (used with many <strong>SmartSensor</strong> <strong>HD</strong> installations) is composed ofthree groups of wires, each containing color-coded wires and a drain wire surrounded by ashield. See Figure B.1 for a diagram of the 9-conductor cable’s 26-pin socket assignment.The codes listed in the diagram are to be used to solder wires into the back of the plugwhere the letters represent the individual solder cups.
APPENDIX • SMARTSENSOR <strong>HD</strong> USER GUIDE 93N=13232 CTSBrownP=14232 RTSOrangea=24NCR=15NCS=16NCA=1+DCRedb=25NCT=17NCB=2-DCBlackU=18NCC=3NCD=4NCM=12232 TDYellowZ=23NC c=26NCV=19NCE=5NCL=11232 RDVioletK=10232 GNDGrayY=22NC X=21NCJ=9NCH=8-485BlueW=20NCG=7485 GND& DrainF=6+485WhiteFigure B.1 – 9-conductor cable Plug Connector Socket Assignment (seen from the solder cupside of the connector)Appendix C - Cable LengthsThe following recommendations allow you to provide reliable power to the <strong>SmartSensor</strong><strong>HD</strong>.NoteThese instructions apply to both the 8-conductor cable and the 9-conductor cable.The <strong>SmartSensor</strong>/8-conductor cables’ DC (red and black) wires are a 20 AWG wire pair.The other wires in the cable are 22 AWG and are used for communication, as detailed inthe earlier appendices.
94 APPENDIX • SMARTSENSOR <strong>HD</strong> USER GUIDECable Gauge 24 Volts 12 Volts20 AWG (SS Cable) 600 ft. (182.9 m) 110 ft. (33.5 m)Additional 22 AWG Add 400 ft. (121.9 m) Add 75 ft. (22.9 m)22 AWG (Old SS Cable) 400 ft. (121.9 m) 75 ft. (22.9 m)Additional 22 AWG Add 400 ft. (121.9 m) Add 75 ft. (22.9 m)14 AWG 2500 ft. (762 m) 450 ft. (137.2 m)12 AWG 3900 ft. (1188.7 m) 700 ft. (213.4 m)10 AWG 6000 ft. (1828.8 m) 1050 ft. (320 m)8 AWG 9900 ft. (3017.5 m) 1750 ft. (533.4 m)6 AWG 14,000 ft. (4267.2 m) 2500 ft. (762 m)Table C.1 – Maximum Cable Length for PowerIf the cable length is longer than 600 ft. (182.9 m) when operating at 24 VDC, it is possibleto increase the maximum cable length by wiring a pair of lines normally used for RS-232communications with the red and black wires.In many cases, if the cable length is 200 ft. (61 m) or greater you cannot reliably use RS-232communications. To add 400 ft. (121.9 m) and achieve a maximum cable length of 1000ft. (304.8 m), connect the orange wire (normally RTS) to the red wire and the brown wire(normally CTS) to the black wire.If your cable run is longer than 1000 ft. (304.8 m), it is possible to sacrifice additionalcommunication pairs to increase the maximum cable length for power. However, you maydesire to communicate to the sensor over two independent channels, in which case you willneed to consider an alternate cable for power. The AWG for wire pairs that achieve a 2000ft. (609.6 m) maximum cable length or greater at 12 and 24 VDC are listed in Table A.1.To achieve reliable wired communications, the selected baud rate must be compatible withthe length of the cable run. Table C.2 below shows the cable length recommendations forwired communications:Baud Rate (bps) RS-232 RS-485115200 40 ft. (12.2 m) 300 ft. (91.4 m)57600 60 ft. (18.3 m) 600 ft. (182.9 m)38400 100 ft. (30.5 m) 800 ft. (243.8)19200 140 ft. (42.7 m) 1000 ft. (304.8 m)9600 200 ft. (61 m) 2000 ft. (609.6 m)Table C.2 – Maximum Cable Length for Wired CommunicationsTo provide two independent communication channels with a homerun cable length over200 ft. (61 m), convert the RS-232 data into RS-485 using a Click 304 in a pole-mountcabinet mounted next to the sensor. In this case, the homerun connection establishes one
APPENDIX • SMARTSENSOR <strong>HD</strong> USER GUIDE 95RS-485 channel over the normal white/blue wire pair and another RS-485 channel overthe yellow/violet wire pair. An additional Click 304 is needed to convert the data sent overthe yellow/violet wire pair back to RS-232 before connecting to surge protection.If you elect to use an alternate cable for power, you may also want to select an alternate cablefor RS-485 communications. For example, the Belden 3105A (Paired – EIA Industrial RS-485 PLTC/CM) is a good alternate for the RS-485.There are many reliable options available for wiring power and communication connections(see Table C.3).Length Cable Comm. Channel 1 Comm. Channel 20–200 ft. (0–61 m) <strong>SmartSensor</strong> or8-conductor Cable200–1000 ft.(61–304.8 m)1000–1400 ft.(304.8–426.7 m)1400–2000 ft.(426.7–609.6 m)Table C.3 – Cable Length Options<strong>SmartSensor</strong> or8-conductor Cable<strong>SmartSensor</strong> or8-conductor CableAlternate power &communications cableNative RS-485Native RS-485Native RS-485Native RS-485Native RS-232Click conversion ofRS-232 to RS-485N/AClick conversion ofRS-485 to RS-232Appendix D - Direct Serial ConnectionsFor most applications, the service end of the <strong>SmartSensor</strong> or 8-conductor cable terminatesin a surge protection device. However, during demonstrations, troubleshooting and certainother situations, it is sometimes convenient to bypass surge protection and connect directlyto a personal computer or communications device such as a modem.The sensor is configured as an RS-232 DTE device. To connect the <strong>SmartSensor</strong> or 8-conductorcable’s RS-232 wires directly to another DTE device (such as a PC), you can use astandard 9-pin D connector and a null modem cable. To connect directly to a DCE device(such as a modem), you will need a straight-through cable. Figure D.1 illustrates both ofthese cases.
96 APPENDIX • SMARTSENSOR <strong>HD</strong> USER GUIDE<strong>SmartSensor</strong>ConnectorPowerWiresRS-485WiresNull Modem CableORDTE Device (PC)Straight-through CableFigure D.1 – Direct Serial ConnectionsDCE Device (Modem)NoteIf you do not have the right type or RS-232 physical connection you will not be ableto connect using the <strong>SmartSensor</strong> Manager software. Since null modem cables andstraight-through cables look similar, you may want to label them. Alternatively, youmay want to use a null modem adapter instead of a null modem cable. If you do,you can turn your straight-through cable into a null modem cable by attaching theadapter on one end.If you wish to connect the 9-conductor cable’s RS-485 wires directly to a PC or modem,this will require that these devices natively support RS-485 communications. Often, modernpersonal computers do not support RS-485 communications and support USB communicationsinstead. If your computer only supports USB communications, you may wantto use a Click serial to USB converter to make a direct connection.Appendix E - Signaling DelaysSignaling delays vary depending on what equipment is used. These delays may affect decisionsabout where to install the sensor in relation to other equipment in cases where timelinessin communication is necessary. The following is information about <strong>SmartSensor</strong> <strong>HD</strong>signaling delays.Total signaling delay from front of vehicle = sensor delay + communications delay + contactclosure delay, where:
APPENDIX • SMARTSENSOR <strong>HD</strong> USER GUIDE 97˽˽˽˽˽˽˽˽Sensor delay = 1 second + (vehicle length in ft)/(vehicle speed in fps)Communications delay = ((10/8) * 34 bytes) / (baud rate in bps)Contact closure delay for Click 512 = essentially zeroContact closure delay for Click 172/174 = detected duration + (effective virtual looplength in ft)/(detected vehicle speed in fps)