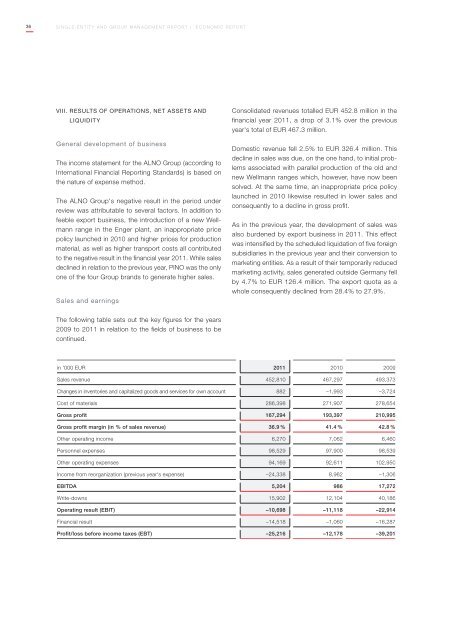
36SINGLE-ENTITY AND GROUP MANAGEMENT REPORT | Economic <strong>report</strong>VIII. Results of operations, net assets andliquidityGeneral development of businessThe income statement for the <strong>ALNO</strong> Group (according toInternational Financial Reporting Standards) is based onthe nature of expense method.The <strong>ALNO</strong> Group's negative result in the period underreview was attributable to several factors. In addition tofeeble export business, the introduction of a new Wellmannrange in the Enger plant, an inappropriate pricepolicy launched in 2010 and higher prices for productionmaterial, as well as higher transport costs all contributedto the negative result in the financial year <strong>2011</strong>. While salesdeclined in relation to the previous year, Pino was the onlyone of the four Group brands to generate higher sales.Sales and earningsConsolidated revenues totalled EUR 452.8 million in thefinancial year <strong>2011</strong>, a drop of 3.1% over the previousyear's total of EUR 467.3 million.Domestic revenue fell 2.5% to EUR 326.4 million. Thisdecline in sales was due, on the one hand, to initial problemsassociated with parallel production of the old andnew Wellmann ranges which, however, have now beensolved. At the same time, an inappropriate price policylaunched in 2010 likewise resulted in lower sales andconsequently to a decline in gross profit.As in the previous year, the development of sales wasalso burdened by export business in <strong>2011</strong>. This effectwas intensified by the scheduled liquidation of five foreignsubsidiaries in the previous year and their conversion tomarketing entities. As a result of their temporarily reducedmarketing activity, sales generated outside Germany fellby 4.7% to EUR 126.4 million. The export quota as awhole consequently declined from 28.4% to 27.9%.The following table sets out the key figures for the years2009 to <strong>2011</strong> in relation to the fields of business to becontinued.in '000 EUR <strong>2011</strong> 2010 2009Sales revenue 452,810 467,297 493,373Changes in inventories and capitalized goods and services for own account 882 –1,993 –3,724Cost of materials 286,398 271,907 278,654Gross profit 167,294 193,397 210,995Gross profit margin (in % of sales revenue) 36.9 % 41.4 % 42.8 %Other operating income 6,270 7,062 6,460Personnel expenses 98,529 97,900 98,539Other operating expenses 94,169 92,611 102,950Income from reorganization (previous year's expense) –24,338 8,962 –1,306EBITDA 5,204 986 17,272Write-downs 15,902 12,104 40,186Operating result (EBIT) –10,698 –11,118 –22,914Financial result –14,518 –1,060 –16,287Profit/loss before income taxes (EBT) –25,216 –12,178 –39,201
SINGLE-ENTITY AND GROUP MANAGEMENT REPORT | Economic <strong>report</strong>37Sales revenue in Germany and abroad developed asfollows:YearGermany Change Abroad Change Export ratio Total'000 EUR in '000 EUR in % '000 EUR in '000 EUR in % in % '000 EUR2009 346,103 147,270 29.8 493,3732010 334,620 –11,483 –3.3 132,677 –14,593 –9.9 28.4 467,297<strong>2011</strong> 326,397 –8,223 –2.5 126,413 –6,264 –4.7 27.9 452,810Foreign sales as a whole developed as follows:YearChangethereof ChangeOther foreign ChangeTotal exports Total EuropeATGcountries'000 EUR '000 EUR in '000 EUR in % '000 EUR in '000 EUR in % '000 EUR in '000 EUR in %2009 147,270 133,512 81,448 13,7582010 132,677 108,089 –25,423 –19.0 27,681 –53,767 –66.0 24,588 10,830 78.7<strong>2011</strong> 126,413 105,456 –2,633 –2.4 25,098 –2,583 –9.3 20,957 –3,631 –14.8Changes in inventories and capitalized goods and servicesfor own account totalled EUR 0.9 million as compared toEUR -2.0 million in the same period in the previous year.Despite the lower sales revenue, the cost of materialsrose from EUR 271.9 million to EUR 286.4 million due tothe higher volume of high-quality ranges sold (especiallyglass), as well as on account of higher prices by suppliers.At 63.1%, the cost of materials in relation to total saleswas consequently well above the previous year's level of58.4%. On a Group basis, gross profit declined from EUR193.4 million to EUR 167.3 million, causing the gross profitmargin to fall from 41.4% to 36.9%. This development wasa combined effect due to different developments in thesubsidiaries. The considerably larger share of the cost ofmaterials for the <strong>ALNO</strong> brand in relation to total sales hada particularly depressing effect here.Other operating income decreased from EUR 7.1 millionto EUR 6.3 million due, above all, to lower proceeds fromthe reversal of specific valuation allowances, as well as tolower income earned in other periods. Personnel expensesrose from EUR 97.9 million in the previous year to EUR 98.5million in <strong>2011</strong> due mainly to the increase in employeesat the Enger plant. The share of personnel expenses inrelation to total sales consequently rose from 21.1% in theprevious year to 21.7%.Other operating expenses increased from EUR 92.6 millionto EUR 94.2 million due to higher transport costs despitethe decline in sales revenue and above all higher salescommissions resulting from the higher volume of contractbusiness by <strong>ALNO</strong> UK.The reorganization profit of EUR 24.3 million was essentiallyattributable to the fact that Comco Holding AG, Nidau,Switzerland, took over trade accounts payable by the <strong>ALNO</strong>Group in the amount of EUR 25.0 million, for which repaymentwas subsequently waived. The reversal of reorganizationprovisions generated further income in the amount ofEUR 2.1 million. This was offset by consulting expensesassociated with the reorganization in the amount of EUR2.7 million. In the previous year, most of the expenses associatedwith reorganization efforts were attributable to thereduction in jobs at the Pfullendorf plant. The remaining EUR1.5 million were accounted for by the elimination of jobsabroad when winding up five of the eight subsidiaries, aswell as by fees for preparing a reorganization assessment.EBITDA rose from EUR 1.0 million in the previous year toEUR 5.2 million due mainly to the profit from reorganization.This made it possible to realize the forecast made inconjunction with the <strong>annual</strong> financial statements 2010 thatGroup EBITDA in <strong>2011</strong> would improve over the previousyear.


