DI8xz
DI8xz
DI8xz
You also want an ePaper? Increase the reach of your titles
YUMPU automatically turns print PDFs into web optimized ePapers that Google loves.
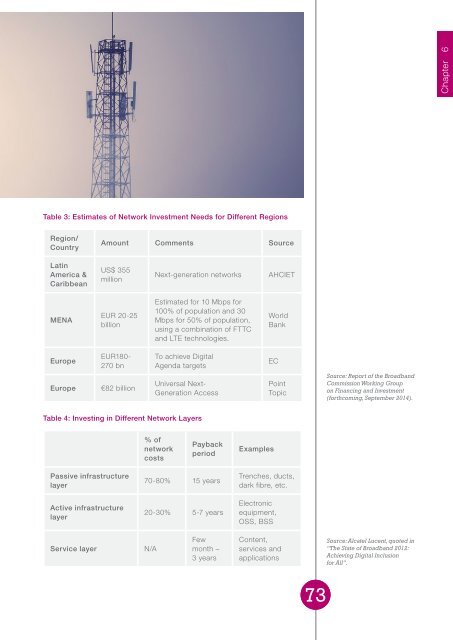
Chapter 6Table 3: Estimates of Network Investment Needs for Different RegionsRegion/CountryAmount Comments SourceLatinAmerica &CaribbeanUS$ 355millionNext-generation networksAHCIETMENAEUR 20-25billionEstimated for 10 Mbps for100% of population and 30Mbps for 50% of population,using a combination of FTTCand LTE technologies.WorldBankEuropeEuropeEUR180-270 bn€82 billionTo achieve DigitalAgenda targetsUniversal Next-Generation AccessECPointTopicSource: Report of the BroadbandCommission Working Groupon Financing and Investment(forthcoming, September 2014).Table 4: Investing in Different Network Layers% ofnetworkcostsPaybackperiodExamplesPassive infrastructurelayerActive infrastructurelayer70-80% 15 years20-30% 5-7 yearsTrenches, ducts,dark fibre, etc.Electronicequipment,OSS, BSSService layerN/AFewmonth –3 yearsContent,services andapplicationsSource: Alcatel Lucent, quoted in“The State of Broadband 2012:Achieving Digital Inclusionfor All”.73


