

9months 2010 Investors' Presentation - Palm Hills Developments
9months 2010 Investors' Presentation - Palm Hills Developments
9months 2010 Investors' Presentation - Palm Hills Developments

You also want an ePaper? Increase the reach of your titles
YUMPU automatically turns print PDFs into web optimized ePapers that Google loves.
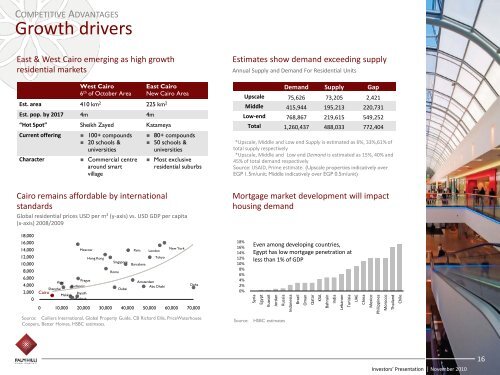
COMPETITIVE ADVANTAGES<br />
Growth drivers<br />
East & West Cairo emerging as high growth<br />
residential markets<br />
Est. area<br />
Est. pop. by 2017<br />
“Hot Spot”<br />
Current offering<br />
Character<br />
18,000<br />
16,000<br />
14,000<br />
12,000<br />
10,000<br />
8,000<br />
6,000<br />
4,000<br />
2,000<br />
0<br />
Moscow<br />
Prague<br />
Kiev<br />
Budapest<br />
Shanghai<br />
Cairo<br />
Riyadh<br />
Makkah<br />
Madinah<br />
West Cairo<br />
6 th of October Area<br />
410 km2 4m<br />
Sheikh Zayed<br />
� 100+ compounds<br />
� 20 schools &<br />
universities<br />
� Commercial centre<br />
around smart<br />
village<br />
Hong Kong<br />
Singapore<br />
Rome<br />
Dubai<br />
Paris<br />
Barcelona<br />
East Cairo<br />
New Cairo Area<br />
225 km2 4m<br />
Katameya<br />
Cairo remains affordable by international<br />
standards<br />
� 80+ compounds<br />
� 50 schools &<br />
universities<br />
� Most exclusive<br />
residential suburbs<br />
Global residential prices USD per m² (y-axis) vs. USD GDP per capita<br />
(x-axis) 2008/2009<br />
London<br />
Tokyo<br />
Amsterdam<br />
Abu Dhabi<br />
New York<br />
0 10,000 20,000 30,000 40,000 50,000 60,000 70,000<br />
Source: Colliers International, Global Property Guide, CB Richard Ellis, PriceWaterhouse<br />
Coopers, Better Homes, HSBC estimates.<br />
Doha<br />
Estimates show demand exceeding supply<br />
Annual Supply and Demand For Residential Units<br />
18%<br />
16%<br />
14%<br />
12%<br />
10%<br />
8%<br />
6%<br />
4%<br />
2%<br />
0%<br />
Even among developing countries,<br />
Egypt has low mortgage penetration at<br />
less than 1% of GDP<br />
Syria<br />
Egypt<br />
Kuwait<br />
Jordan<br />
Russia<br />
Source: HSBC estimates<br />
Demand Supply Gap<br />
Upscale 75,626 73,205 2,421<br />
Middle 415,944 195,213 220,731<br />
Low-end 768,867 219,615 549,252<br />
Total 1,260,437 488,033 772,404<br />
•*Upscale, Middle and Low end Supply is estimated as 6%, 33%,61% of<br />
total supply respectively<br />
•*Upscale, Middle and Low end Demand is estimated as 15%, 40% and<br />
45% of total demand respectively<br />
Source: USAID, Prime estimate. (Upscale properties indicatively over<br />
EGP 1.5m/unit; Middle indicatively over EGP 0.5m/unit)<br />
Mortgage market development will impact<br />
housing demand<br />
Indonesia<br />
Brazil<br />
Oman<br />
Qatar<br />
KSA<br />
Bahrain<br />
India<br />
Lebanon<br />
Tunisia<br />
UAE<br />
China<br />
Mexico<br />
Philippines<br />
Morocco<br />
Thailand<br />
Chile<br />
Investors’ <strong>Presentation</strong> | November <strong>2010</strong><br />
16