Energy and Transport.pdf - Richmond School District No. 38
Energy and Transport.pdf - Richmond School District No. 38
Energy and Transport.pdf - Richmond School District No. 38
- No tags were found...

Create successful ePaper yourself
Turn your PDF publications into a flip-book with our unique Google optimized e-Paper software.
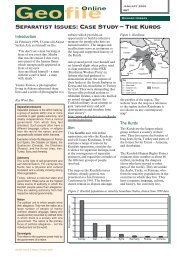
SeriesMillion vehicles400350300250200150100500Light commercial vehicleHeavy commercial vehicleThree-wheelerCar/sports utility vehicleMotorbike2005 2008 2015 2025 2035Figure 2: Vehicle populations forecast in China 7Million tonnes of carbon dioxide40003500300025002000150010005000IndiaChina2005 2008 2015 2025 2035Figure 3: Total carbon dioxide emissions (well to exhaust) from on-roadvehicles: India <strong>and</strong> China 7requires energy for construction <strong>and</strong> maintenance.Furthermore, transport facilitates changes in l<strong>and</strong> use,enabling deforestation <strong>and</strong> thus reducing the earth’sability to absorb carbon dioxide.Although transport emissions are rising faster inlow-income <strong>and</strong> middle-income countries than in thosewith high income, there remain massive globalinequalities in transport energy use both between <strong>and</strong>within countries. In 2003, global average consumption ofpetrol <strong>and</strong> diesel was 283 L per person per year, rangingfrom about 12 L per person per year in Nepal, Bangladesh,<strong>and</strong> Ethiopia to 2135 L per person per year in the USA. 4Walking remains the main mode of transport for thepoor in most countries.Attention is increasingly focused on China, with a fifthof the global population <strong>and</strong> rapid economic growth, <strong>and</strong>where consumption of petrol for transport nearly doubledbetween 1990 <strong>and</strong> 2003. 5 Although still substantiallybelow per-head distances in high-income countries, totalmotorised passenger-km rose six-fold between 1980<strong>and</strong> 2003, <strong>and</strong> freight distance increased nearly five-fold. 6Rapid urbanisation <strong>and</strong> motorisation have seen roadspace for cycling curtailed. The number of cars <strong>and</strong>sports-utility vehicles in China could increase 15-foldover the next 30 years to over 190 million, with carbondioxide emissions from transport increasing more thanthree-fold (figure 2 <strong>and</strong> figure 3), 7 a situation that wouldbe environmentally unsustainable. However, expectinglower-income countries to change trajectory whiletransport emissions in rich countries continue to risefrom much higher levels is unreasonable.Aviation is increasing <strong>and</strong> has a large effect on climatechange. In 2001, the Intergovernmental Panel on ClimateChange (IPCC) estimated that aviation caused 3·5% ofhuman-induced global warming, which could rise to 15%by 2050. In 2003 there were 1·6 billion trips by passengersworldwide <strong>and</strong>, by 2010, this figure could exceed2·3 billion. The UK has the highest air travel per head inEurope, with a fifth of international flights passingthrough UK airports. According to the UK Civil AviationAuthority, passenger numbers at UK airports have beengrowing at about 6% per year since the mid-1970s—morethan twice the rate of economic growth—<strong>and</strong> show nosign of slowing. The UK Department of <strong>Transport</strong>estimates that aviation contributes about 5·5% of UKcarbon-dioxide emissions, but about 11% of the UK’stotal effect on climate change. The UK’s share iscalculated by allocating emissions from half the flights to<strong>and</strong> from UK airports to the UK, but more than half ofthese flights are by UK citizens. Therefore, at thehousehold level, the contribution of flying is higher <strong>and</strong>could be greater than from driving. 8,9 Recent studiesestimate that by 2030 UK total aviation emissions ofcarbon dioxide will rise from 32 million tonnes in 2000 to65–85 million tonnes. 10 These predictions includeprobable gains in efficiency.Most of the increase in UK flights has come fromwealthier individuals flying more. Trips by those in thelower-income b<strong>and</strong>s fell between 2000 <strong>and</strong> 2004. 10 Evenwith cheap flights, foreign holidays remain too expensivefor those on low incomes. The average household incomeof UK leisure passengers travelling through Stanstedairport was £51 000 in 2005, according to the CivilAviation Authority’s 2005 Passenger Survey Report, 11compared with an average household income of £31 000.A survey of emissions in the UK, including all transportmodes, found that the top 10% of emitters producedalmost 43% of emissions whereas the bottom10% produced only 0·1%. 9Aviation is believed to have a greater effect on climatechange than its carbon emissions alone. Additionalcontributors include nitrogen oxides, soot, sulphateparticulates, <strong>and</strong> water vapour, which lead to theformation of contrails <strong>and</strong> cirrus clouds at altitude. Cirruscloud formation is difficult to predict <strong>and</strong> model. Theeffects of nitrogen oxides <strong>and</strong> water vapour vary by2 www.thelancet.com Published online September 13, 2007 DOI:10.1016/S0140-6736(07)61254-9