Energy and Transport.pdf - Richmond School District No. 38
Energy and Transport.pdf - Richmond School District No. 38
Energy and Transport.pdf - Richmond School District No. 38
- No tags were found...

You also want an ePaper? Increase the reach of your titles
YUMPU automatically turns print PDFs into web optimized ePapers that Google loves.
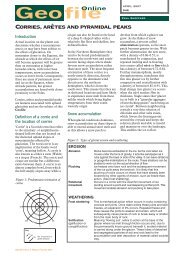
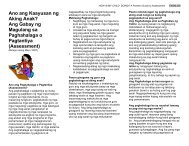
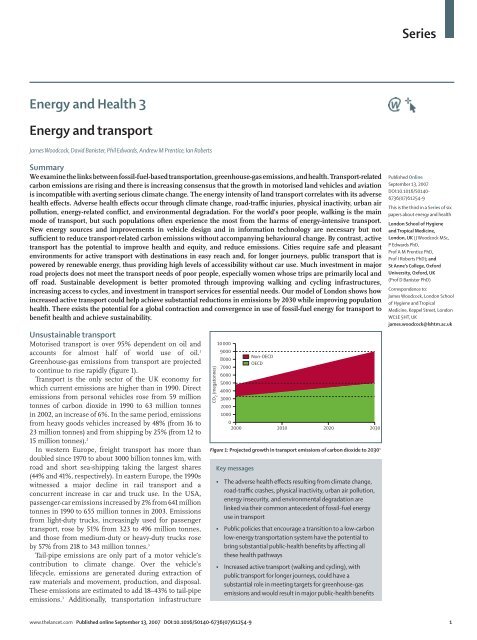
Series<strong>Energy</strong> <strong>and</strong> Health 3<strong>Energy</strong> <strong>and</strong> transportJames Woodcock, David Banister, Phil Edwards, Andrew M Prentice, Ian RobertsSummaryWe examine the links between fossil-fuel-based transportation, greenhouse-gas emissions, <strong>and</strong> health. <strong>Transport</strong>-relatedcarbon emissions are rising <strong>and</strong> there is increasing consensus that the growth in motorised l<strong>and</strong> vehicles <strong>and</strong> aviationis incompatible with averting serious climate change. The energy intensity of l<strong>and</strong> transport correlates with its adversehealth effects. Adverse health effects occur through climate change, road-traffic injuries, physical inactivity, urban airpollution, energy-related conflict, <strong>and</strong> environmental degradation. For the world’s poor people, walking is the mainmode of transport, but such populations often experience the most from the harms of energy-intensive transport.New energy sources <strong>and</strong> improvements in vehicle design <strong>and</strong> in information technology are necessary but notsufficient to reduce transport-related carbon emissions without accompanying behavioural change. By contrast, activetransport has the potential to improve health <strong>and</strong> equity, <strong>and</strong> reduce emissions. Cities require safe <strong>and</strong> pleasantenvironments for active transport with destinations in easy reach <strong>and</strong>, for longer journeys, public transport that ispowered by renewable energy, thus providing high levels of accessibility without car use. Much investment in majorroad projects does not meet the transport needs of poor people, especially women whose trips are primarily local <strong>and</strong>off road. Sustainable development is better promoted through improving walking <strong>and</strong> cycling infrastructures,increasing access to cycles, <strong>and</strong> investment in transport services for essential needs. Our model of London shows howincreased active transport could help achieve substantial reductions in emissions by 2030 while improving populationhealth. There exists the potential for a global contraction <strong>and</strong> convergence in use of fossil-fuel energy for transport tobenefit health <strong>and</strong> achieve sustainability.Unsustainable transportMotorised transport is over 95% dependent on oil <strong>and</strong>accounts for almost half of world use of oil. 1Greenhouse-gas emissions from transport are projectedto continue to rise rapidly (figure 1).<strong>Transport</strong> is the only sector of the UK economy forwhich current emissions are higher than in 1990. Directemissions from personal vehicles rose from 59 milliontonnes of carbon dioxide in 1990 to 63 million tonnesin 2002, an increase of 6%. In the same period, emissionsfrom heavy goods vehicles increased by 48% (from 16 to23 million tonnes) <strong>and</strong> from shipping by 25% (from 12 to15 million tonnes). 2In western Europe, freight transport has more th<strong>and</strong>oubled since 1970 to about 3000 billion tonnes km, withroad <strong>and</strong> short sea-shipping taking the largest shares(44% <strong>and</strong> 41%, respectively). In eastern Europe, the 1990switnessed a major decline in rail transport <strong>and</strong> aconcurrent increase in car <strong>and</strong> truck use. In the USA,passenger-car emissions increased by 2% from 641 milliontonnes in 1990 to 655 million tonnes in 2003. Emissionsfrom light-duty trucks, increasingly used for passengertransport, rose by 51% from 323 to 496 million tonnes,<strong>and</strong> those from medium-duty or heavy-duty trucks roseby 57% from 218 to 343 million tonnes. 3Tail-pipe emissions are only part of a motor vehicle’scontribution to climate change. Over the vehicle’slifecycle, emissions are generated during extraction ofraw materials <strong>and</strong> movement, production, <strong>and</strong> disposal.These emissions are estimated to add 18–43% to tail-pipeemissions. 3 Additionally, transportation infrastructureCO 2 (megatonnes)1000090008000700060005000400030002000100002000<strong>No</strong>n-OECDOECD2010 2020 2030Figure 1: Projected growth in transport emissions of carbon dioxide to 2030 1Key messages• The adverse health effects resulting from climate change,road-traffic crashes, physical inactivity, urban air pollution,energy insecurity, <strong>and</strong> environmental degradation arelinked via their common antecedent of fossil-fuel energyuse in transport• Public policies that encourage a transition to a low-carbonlow-energy transportation system have the potential tobring substantial public-health benefits by affecting allthese health pathways• Increased active transport (walking <strong>and</strong> cycling), withpublic transport for longer journeys, could have asubstantial role in meeting targets for greenhouse-gasemissions <strong>and</strong> would result in major public-health benefitsPublished OnlineSeptember 13, 2007DOI:10.1016/S0140-6736(07)61254-9This is the third in a Series of sixpapers about energy <strong>and</strong> healthLondon <strong>School</strong> of Hygiene<strong>and</strong> Tropical Medicine,London, UK (J Woodcock MSc,P Edwards PhD,Prof A M Prentice PhD,Prof I Roberts PhD); <strong>and</strong>St Anne’s College, OxfordUniversity, Oxford, UK(Prof D Banister PhD)Correspondence to:James Woodcock, London <strong>School</strong>of Hygiene <strong>and</strong> TropicalMedicine, Keppel Street, LondonWC1E 5HT, UKjames.woodcock@lshtm.ac.ukwww.thelancet.com Published online September 13, 2007 DOI:10.1016/S0140-6736(07)61254-9 1
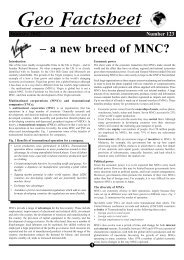
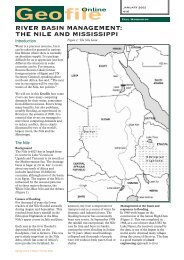
SeriesMillion vehicles400350300250200150100500Light commercial vehicleHeavy commercial vehicleThree-wheelerCar/sports utility vehicleMotorbike2005 2008 2015 2025 2035Figure 2: Vehicle populations forecast in China 7Million tonnes of carbon dioxide40003500300025002000150010005000IndiaChina2005 2008 2015 2025 2035Figure 3: Total carbon dioxide emissions (well to exhaust) from on-roadvehicles: India <strong>and</strong> China 7requires energy for construction <strong>and</strong> maintenance.Furthermore, transport facilitates changes in l<strong>and</strong> use,enabling deforestation <strong>and</strong> thus reducing the earth’sability to absorb carbon dioxide.Although transport emissions are rising faster inlow-income <strong>and</strong> middle-income countries than in thosewith high income, there remain massive globalinequalities in transport energy use both between <strong>and</strong>within countries. In 2003, global average consumption ofpetrol <strong>and</strong> diesel was 283 L per person per year, rangingfrom about 12 L per person per year in Nepal, Bangladesh,<strong>and</strong> Ethiopia to 2135 L per person per year in the USA. 4Walking remains the main mode of transport for thepoor in most countries.Attention is increasingly focused on China, with a fifthof the global population <strong>and</strong> rapid economic growth, <strong>and</strong>where consumption of petrol for transport nearly doubledbetween 1990 <strong>and</strong> 2003. 5 Although still substantiallybelow per-head distances in high-income countries, totalmotorised passenger-km rose six-fold between 1980<strong>and</strong> 2003, <strong>and</strong> freight distance increased nearly five-fold. 6Rapid urbanisation <strong>and</strong> motorisation have seen roadspace for cycling curtailed. The number of cars <strong>and</strong>sports-utility vehicles in China could increase 15-foldover the next 30 years to over 190 million, with carbondioxide emissions from transport increasing more thanthree-fold (figure 2 <strong>and</strong> figure 3), 7 a situation that wouldbe environmentally unsustainable. However, expectinglower-income countries to change trajectory whiletransport emissions in rich countries continue to risefrom much higher levels is unreasonable.Aviation is increasing <strong>and</strong> has a large effect on climatechange. In 2001, the Intergovernmental Panel on ClimateChange (IPCC) estimated that aviation caused 3·5% ofhuman-induced global warming, which could rise to 15%by 2050. In 2003 there were 1·6 billion trips by passengersworldwide <strong>and</strong>, by 2010, this figure could exceed2·3 billion. The UK has the highest air travel per head inEurope, with a fifth of international flights passingthrough UK airports. According to the UK Civil AviationAuthority, passenger numbers at UK airports have beengrowing at about 6% per year since the mid-1970s—morethan twice the rate of economic growth—<strong>and</strong> show nosign of slowing. The UK Department of <strong>Transport</strong>estimates that aviation contributes about 5·5% of UKcarbon-dioxide emissions, but about 11% of the UK’stotal effect on climate change. The UK’s share iscalculated by allocating emissions from half the flights to<strong>and</strong> from UK airports to the UK, but more than half ofthese flights are by UK citizens. Therefore, at thehousehold level, the contribution of flying is higher <strong>and</strong>could be greater than from driving. 8,9 Recent studiesestimate that by 2030 UK total aviation emissions ofcarbon dioxide will rise from 32 million tonnes in 2000 to65–85 million tonnes. 10 These predictions includeprobable gains in efficiency.Most of the increase in UK flights has come fromwealthier individuals flying more. Trips by those in thelower-income b<strong>and</strong>s fell between 2000 <strong>and</strong> 2004. 10 Evenwith cheap flights, foreign holidays remain too expensivefor those on low incomes. The average household incomeof UK leisure passengers travelling through Stanstedairport was £51 000 in 2005, according to the CivilAviation Authority’s 2005 Passenger Survey Report, 11compared with an average household income of £31 000.A survey of emissions in the UK, including all transportmodes, found that the top 10% of emitters producedalmost 43% of emissions whereas the bottom10% produced only 0·1%. 9Aviation is believed to have a greater effect on climatechange than its carbon emissions alone. Additionalcontributors include nitrogen oxides, soot, sulphateparticulates, <strong>and</strong> water vapour, which lead to theformation of contrails <strong>and</strong> cirrus clouds at altitude. Cirruscloud formation is difficult to predict <strong>and</strong> model. Theeffects of nitrogen oxides <strong>and</strong> water vapour vary by2 www.thelancet.com Published online September 13, 2007 DOI:10.1016/S0140-6736(07)61254-9
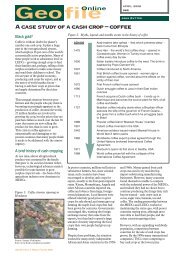
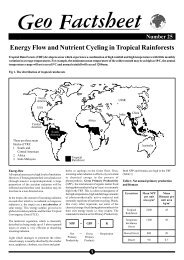
Seriesaltitude <strong>and</strong> weather conditions. Nitrogen oxides haveconflicting effects, both destroying ambient methane,but producing ozone, with a changing balance betweenthe two effects with time.Recent estimates suggest that the effect of aviation onclimate change is 1·9 times greater than that whichwould be due to its carbon emissions alone. 12 However,there is still considerable uncertainty about the size ofthis effect, <strong>and</strong> care must be taken in its application.First, cirrus cloud changes are excluded as too uncertainto estimate. Second, other activities produce non-carbongreenhouse-gas emissions. Third, this estimate is basedon the historical effect of emissions on climate change<strong>and</strong> not the effect of current or future emissions onclimate. 10 <strong>No</strong>n-carbon-dioxide emissions have ashorter-term effect than does carbon dioxide, whichremains in the atmosphere for 100 years or more. Thusin 1 year the climate-forcing effect of a flight could be36 times the carbon emissions but this would fall to3·7 times over 20 years.Because the effect of aviation is greatest in the shortterm, controlling aviation becomes increasinglyimportant as climatic thresholds are reached. Moreover,just as the need for car travel is now built into the fabricof cities <strong>and</strong> into the economic <strong>and</strong> social lives of citizens,so increasingly is aviation, with airport expansion <strong>and</strong>the purchasing of second homes overseas by the richerresidents of affluent countries.<strong>Transport</strong>, energy, <strong>and</strong> healthSome of the links for l<strong>and</strong> transport are shown infigure 4.InjuriesThe energy intensity of road vehicles is reflected intheir effects on health. Because of the growth in traffic,many people are exposed to levels of kinetic energy thatcan <strong>and</strong> do result in serious injury. The WHO WorldReport on Road Traffic Injury Prevention estimated that1·2 million people were killed <strong>and</strong> 50 million peopleinjured in road-traffic crashes in 2002; 13 these figurescontinue to rise. Still a neglected epidemic, injuries areamong the leading causes of disease burden indeveloping countries, with the highest regionalroad-death rates in Africa (28 per 100 000 per year), <strong>and</strong>the highest national rates in El Salvador (42 per100 000 per year) <strong>and</strong> the Dominican Republic (41 per100 000 per year). In addition to physical injury, mentalhealth can be affected by post-traumatic stressdisorder.Per kilometre travelled, heavy goods vehicles are twiceas likely to be involved in fatal crashes than are cars. Inmost settings, those at greatest risk are people on lowincomes who do not have the option of car travel <strong>and</strong>often have to walk long distances on roads carryinghigh-speed vehicles. Public transport systems can beextremely safe; however, in many low-income countriessuch services are underdeveloped <strong>and</strong> poorly runinformal servises pose a high risk to passengers <strong>and</strong>other road users. 13,1434% of deaths of children due to injury in the EuropeanUnion (EU) are caused by road crashes <strong>and</strong> the distributionof these injuries varies greatly by country. Death rates fromroad collisions in Portugal, Lithuania, Estonia, <strong>and</strong> Latviaare almost six times greater than those in Malta, Sweden,Increases outcomeReduces outcome<strong>Energy</strong>intensivetransportResourceuseKineticenergy/dangerEmissionsL<strong>and</strong> usechangesEconomicdevelopmentGlobalecologicalstressOpportunitycostOilconsumptionCommunityseveranceDeaths<strong>and</strong>injuriesPhysicalinactivityLocal <strong>and</strong>regionalpollutionClimatechangeSocialcapitalHealth gainsofdevelopmentSeveralhealthpathwaysHealthpromotingexpenditureDutchdisease/conflictPosttraumaticstressColon <strong>and</strong>breastcancerDiabetesmellitusCardiopulmonarydiseaseAllergicillnessRespiratorydiseaseFigure 4: Selected pathways between transport <strong>and</strong> healthwww.thelancet.com Published online September 13, 2007 DOI:10.1016/S0140-6736(07)61254-9 3
Seriescardiovascular risk. 36 Aviation produces noise <strong>and</strong> airpollution. Night flights have the greatest effect on localresidents <strong>and</strong> there are high concentrations of nitrogenoxides around airports, although most is from associatedcar traffic rather than directly from aviation. 33Shipping emissions contribute an estimated 10–20% tothe overall concentration of particles measuring 10 μm orless for most coastal areas in western Europe. 33 Emissionsfrom international trading ships in the seas aroundEurope were estimated at 2·6 million tonnes of sulphuroxides <strong>and</strong> 3·6 million tonnes of nitrogen oxides a yearin 2000. The main ports of southern California, USA, areresponsible for daily emissions of about 116 tonnes ofnitrogen oxides, compared with about 92 tonnes fromthe 6 million cars in the region. 37Access <strong>and</strong> community severanceAchieving high levels of accessibility to shops, markets,employment, education, health services, <strong>and</strong> social <strong>and</strong>community networks is essential for health, quality oflife, <strong>and</strong> social inclusion. However, transport policy oftenfocuses on mobility rather than access. The 2006 EUmid-term review of transport strategy states that mobilityis the quintessential purpose of transport policy. <strong>38</strong>Increasing use of cars improves access for thoseindividuals who are newly motorised but reduces accessfor others through danger <strong>and</strong> congestion. Danger fromhigh volumes of traffic can make reaching even nearbydestinations difficult, which can reduce access to services,employment, <strong>and</strong> social support networks. These effectsare known as community severance, <strong>and</strong> can affect healthin several ways. Particularly hard hit are people who areelderly or disabled, parents or carers pushing prams, <strong>and</strong>children. 39,40 In the longer term, urban sprawl can reducesocial capital <strong>and</strong> increase social segregation. 41,42 Ecologicalstudies show worse self-reported health in people livingin sprawled cities. 43Harms are created through too much mobility <strong>and</strong> toolittle access. A Dutch study, including freight <strong>and</strong>passenger transport, found that strategies to achievesubstantial reductions in emission would reduceinequalities in the costs <strong>and</strong> benefits of transport, travelbehaviour, <strong>and</strong> accessibility of economic <strong>and</strong> socialopportunities. 44Disability <strong>and</strong> impairment<strong>Transport</strong> is a direct cause of impairments, throughroad-traffic injuries, <strong>and</strong> an indirect determinant, throughphysical inactivity. Obesity can be considered animpairment. Moreover, transport affects the quality oflife of people with impairments by the creation ofenabling or disabling environments. Traffic dangerincreases the requirements for social participationthrough the need to judge speeds, see over traffic, <strong>and</strong>cross roads quickly. The social model of disability viewscertain environments as creating disabilities in peoplewith impairments. Applying the social model ofdisabilities to transport can help us underst<strong>and</strong> howcar-dominated transport systems create disabilitiesbeyond those conventionally categorised as having adisability. 45 Training, tricycles, h<strong>and</strong> cycles, <strong>and</strong> t<strong>and</strong>emscan increase the take-up of active transport among peoplewith impairments. Small electric scooters with speedssimilar to pedestrians or cyclists are a less active but stilllow energy alternative.Other effectsEnvironment <strong>and</strong> economyInvestment in motorised road transport is directly <strong>and</strong>indirectly resource-intensive. This use of resources isclosely related to energy use, <strong>and</strong> raises questions ofenvironmental sustainability beyond climate change.Furthermore, such transport imposes considerableexternal indirect costs on society. However, transportsupports millions of jobs <strong>and</strong> businesses worldwide <strong>and</strong>is widely seen as having a special role in economicdevelopment.<strong>Transport</strong> resource use can be considered as having ahealth-related opportunity cost. That cost is the lostopportunity to use these resources in ways with a morebenign health profile. Although usually st<strong>and</strong>ardised inmonetary units, the cost can be thought of as specificscarce resources. The opportunity cost can be measuredfrom an individual or societal perspective. Lower-incomegroups spend a higher proportion of their income ontransport than do richer populations. Expenditure ontransport is not then available for health care, food, oreducation. 46 There is little analysis of the health effects ofthese costs.From a lifecycle <strong>and</strong> systems perspective, transportresource includes vehicle production, use, <strong>and</strong> disposal,together with dependent industries such as construction,oil, steel, rubber, insurance, advertising, <strong>and</strong> finance. 47,48Car production uses nearly half the world’s annual outputof rubber, 25% of its glass, <strong>and</strong> 15% of its steel. 49 Mostmotor vehicles are privately owned but road networks areusually led <strong>and</strong> financed by the state, with high costs.The widening of the M1 motorway in the UK is predictedto cost £5·1 billion, around £21 million a mile. Investmentin transport infrastructure mainly benefits those who canafford to take advantage of it. Decisions on transportinfrastructure determine the transport options availableto individuals <strong>and</strong> firms, <strong>and</strong> can act as a substantialsubsidy.The energy use of cars is closely related to their l<strong>and</strong>requirements. These requirements limit l<strong>and</strong> availabilityfor other uses, including agriculture. Estimates suggestthat increased transport infrastructure in China willoccupy an additional 270 000 km² between 2004 <strong>and</strong> 2020,dispossessing 3·7 million farmers. 5Although car <strong>and</strong> truck use bring substantial economicbenefits, the harms impose costs on society not in themain borne by the vehicle user or business. This marketfailure acts to both encourage further use <strong>and</strong> discouragewww.thelancet.com Published online September 13, 2007 DOI:10.1016/S0140-6736(07)61254-9 5
SeriesSee Online for webappendix 1active transport. The economic cost of congestion is over3% of gross domestic product (GDP) in many cities, withmotor-vehicle speeds often slower than those by bike. 50Road-traffic crashes cost developing countries about1–2% of GDP each year. The victims of road-trafficcrashes are often young adults whose families depend ontheir earnings. In some cities, air pollution imposesmajor costs in lost productivity <strong>and</strong> health-careexpenditure. The consequences of physical inactivity aremajor burdens on health-care resources, with the cost ofobesity in the USA estimated at around US$139 billionper year. 51Transfer payments from states <strong>and</strong> internationalinstitutions to automobile manufacturers <strong>and</strong> fossil-fuelcorporations are not a resource use but a transfer thatcould limit the resources available for health expenditure.Subsidies paid to car manufacturers to keep or attractjobs are common—eg, in January, 2007, the state ofMichigan paid Ford $155 million. According to theSustainable <strong>Energy</strong> <strong>and</strong> Economy Network, the WorldBank approved payments, guarantees, <strong>and</strong> loans worth$10·7 billion to extraction projects for oil, coal, <strong>and</strong> gasbetween 1992 <strong>and</strong> 2004. 52Environmental sustainabilityEnsuring environmental sustainability is the seventhMillennium Development Goal (MDG; webappendix 1).Sustainability has been defined as meeting the needs ofthe present generation without compromising the abilityof future generations to meet their own needs. Thisdefinition is interpreted in two main ways. Proponents ofthe weaker version argue that manufactured capital cantake the place of natural capital, so it is the combinedtotal capital stock of both that needs to be maintained orenhanced. The stronger interpretation recognises thatthe functions of natural systems cannot be substituted bymanufactured goods <strong>and</strong> so natural systems themselvesneed to be maintained or enhanced.Climate change is occurring in the context of increasedanthropogenic stress across a range of natural systems,including stratospheric ozone depletion, loss ofbiodiversity, spread of invasive species, exhaustion ofwild fisheries, <strong>and</strong> the depletion of freshwater supplies. 53In addition to its own resource use, transport facilitatesthe exploitation of other resources. From a climate-changeperspective the most important effect is opening up areasto deforestation. Through increasing the dem<strong>and</strong>s onour environment’s carrying capacity—a capacity notknown in advance—energy-intensive transport reducesits human-carrying capacity.Oil <strong>and</strong> energy securityOil dominates transport energy use; ensuring supply is adriver of international policy. The potential for increasingsupply is a hotly debated issue. As conventional oilsupplies run down, lower-grade oil supplies with highercost <strong>and</strong> greater effect on the environment will becomefinancially viable. This would mean rising prices <strong>and</strong>could put transport in conflict with production of plastics,fertilisers <strong>and</strong> drugs, <strong>and</strong> other energy dem<strong>and</strong>s, hittingthose least able to pay. However, the greatest health effectof oil dependency is in countries highly dependent on oilexports. On average these countries have worse healthoutcomes than other countries at similar levels ofeconomic development, 54 an event known as Dutchdisease, <strong>and</strong> are at greater risk of armed conflict. 55Economic growth <strong>and</strong> social developmentAccording to the IPCC, reducing transport emissions isdifficult because of the role that passenger <strong>and</strong> freighttravel have in social <strong>and</strong> economic development, <strong>and</strong>because emission-reduction strategies often challengethe interests of the many transport stakeholders. Inwebappendix 1 we investigate the role of transport inachieving the MDGs.<strong>Transport</strong> allows for a global division of labour <strong>and</strong>some believe transport investment has a privileged rolein economic growth. Although higher per-head GDP isassociated with better health in low-income <strong>and</strong>middle-income countries, there is little correlation inwealthy countries. 56 Air travel is the most energy-intensiveform of freight transport, followed by road, then rail <strong>and</strong>sea. Freight transport is growing faster than economicgrowth. The falling cost of transport by sea, air, <strong>and</strong> l<strong>and</strong>combined with just-in-time production systems haveencouraged development of global supply chains that seeproducts transported many times between raw materials<strong>and</strong> final disposal. A 2001 European White Paperdescribes transport networks as the lifeblood ofcompetitiveness. 57 However, the UK Advisory Committeeon Trunk Road Assessment found that transportcost-reduction had only a small contribution to economicgrowth <strong>and</strong> productivity, <strong>and</strong> countries belonging to theOrganisation for Economic Cooperation <strong>and</strong> Developmenthave large variability in their transport-resource use. 58Moreover, recent research has highlighted how poorhealth can restrict economic growth. 59It is important to consider the developmental effects oftransport expenditure separately from the resourcestransport itself consumes. Choice of transportationsystem offers different pathways to social development.The achievement of sustainable transport will requiredecoupling social development <strong>and</strong> transport energy <strong>and</strong>resource use.Freight <strong>and</strong> food milesAlthough attention on the effect of climate change onagriculture has focused on food miles, the totalcontribution of bovine emissions of methane issubstantially greater. Passenger travel is related to freightbecause most air freight is carried in the hold of passengeraeroplanes. Popular debate often singles out food freight.However, there is greater natural basis for regionalspecialisation with food than manufacturing. Moreover,6 www.thelancet.com Published online September 13, 2007 DOI:10.1016/S0140-6736(07)61254-9
Seriesgrowing vegetables in heated greenhouses can consumemore energy than transporting them from warmercountries. Locally grown seasonal vegetables are the mostenergy efficient. The role of providing an increased rangeof non-seasonal vegetables <strong>and</strong> fruit in the reduction inthe rates of cardiovascular disease in developed countriesis an area for further research <strong>and</strong> could indicate a healthbenefit from some food miles. However, attention has tobe given to the local effects of export crops on incomes,the nutrient cycle, water supplies, food prices, <strong>and</strong> l<strong>and</strong>use.Transmission of infectious diseasesThe movement of populations <strong>and</strong> livestock shapes thepatterns <strong>and</strong> distribution of infectious diseases. 60,61Reducing the spread of HIV <strong>and</strong> malaria is one of theMDGs. One method of transmission that has receivedattention is the role of truck drivers in HIV transmission(webappendix 1). African on-road settlements have anincreased risk of injuries <strong>and</strong> greater risk of HIVcompared with off-road settlements. 62 People on lowincomes who live on these corridors have strong incentiveto engage in unsafe sexual activity. Climate change isexpected to increase the range <strong>and</strong> seasons for malaria.Aviation also facilitates the rapid spread of infectiousdiseases, especially for emerging infections. 60AviationApart from its climate forcing, aviation is not associatedwith as large direct co-harms as road transport. However,airports are usually out of town <strong>and</strong> can increase roadtraffic, with its associated harms. Furthermore, claims ofthe importance of aviation to economic growth <strong>and</strong>employment are often overstated. There is considerableinternational variation in flights per head at similarincome levels, with the UK well above the Europeantrend line. The effect of investment in aviation is oftennot compared with the opportunity lost to invest in otherareas, which could provide greater employment <strong>and</strong>similar economic returns. 10 Another argument raised insupport of aviation is the economic dependence ontourism in developing countries. However, three-quartersof all UK passenger flights are within Europe, 10 with onlya small proportion to developing countries. Althoughthere will be beneficial effects in some areas, these arenot likely to be large compared with the unequal effectsof climate change.Benefits from energy intensive transportAccording to the Stern report on the economics of climatechange, commissioned by the UK Government, thewelfare costs of reducing dem<strong>and</strong> for transport is high. 64However, travel behaviour might be more amenable tochange than most models assume. A systematic reviewof case studies found that closing roads to car traffic didnot cause a corresponding increase on alternative routes. 65These models often assume that a given destinationprovides a set welfare benefit to the traveller <strong>and</strong> the timeto get there is a cost. However, over time, changes intransport infrastructure alter the nature <strong>and</strong> perceivedbenefits of destinations. Furthermore, vehicle ownership<strong>and</strong> distant holidays often function as status symbols,reducing any net benefit. 66There are areas in which motor vehicles <strong>and</strong> aviationprovide health benefits. For example, in many settingsmotor vehicles are central to the operation of health care.However, these modes are able to provide greatest benefitto society if allocated more sparingly <strong>and</strong> wisely.There are strong links between the use of fossil fuelsfor energy <strong>and</strong> physical inactivity, air pollution, <strong>and</strong>injuries. These health problems account for a substantialglobal disease burden <strong>and</strong> contribute to healthinequalities. An integrated assessment of the health <strong>and</strong>environmental effects of alternative transport is needed.Low carbon <strong>and</strong> healthy transportThere are four main strategies for moving to low-carbontransport while at the same time improving access <strong>and</strong>equity: avoiding trips; increasing energy efficiency <strong>and</strong>alternative energy sources; shortening trip distances; <strong>and</strong>changing travel modes. We look at the effect of thesestrategies on greenhouse-gas emissions <strong>and</strong> health inLondon in webappendices 2 <strong>and</strong> 3.Avoiding vehicle tripsInformation <strong>and</strong> communication technologies—eg,teleconferencing—can replace trips with electroniccommunication. The rapid development <strong>and</strong> proliferationof these technologies have transformed societies. Mobilephones offer a low-energy means of communication, <strong>and</strong>video-conferencing, email, <strong>and</strong> the internet have a largepotential for replacing physical energy-intensivemovement. Within health care there have been calls touse information technology to reduce flights by doctors. 67For freight, internet-based systems can match up sparevehicle capacity <strong>and</strong> freight needs. 68 However, the effectof such measures is complex <strong>and</strong> recent research 69 foundthat information <strong>and</strong> communication technologies areunlikely to have large effects on their own. Althoughsome trips will be substituted, others will be generated orreplaced by fewer longer distance trips. Unless theassociation between economic growth <strong>and</strong>energy-intensive mobility is altered, high-energytransport will continue to increase. Other means forreducing vehicle trips include increasing vehicleoccupancy <strong>and</strong> trip chaining, where one round tripreplaces several trips.Increasing energy efficiency <strong>and</strong> alternative energysourcesImproved engine design <strong>and</strong> changes in fuel source areimportant for reducing emissions. However, althoughtechnological solutions are attractive, their development<strong>and</strong> widespread adoption is problematic, particularly forSee Online for webappendices 2<strong>and</strong> 3www.thelancet.com Published online September 13, 2007 DOI:10.1016/S0140-6736(07)61254-9 7
SeriesConclusionsThe health effects of transport are intimately related totransportation energy-use. Car <strong>and</strong> truck travel haveco-harms, whereas active transport has co-benefits.Achieving the MDGs requires investment in transportationthat meets the needs of poor people (webappendix 1).Levels of car use <strong>and</strong> air travel currently enjoyed byhigh-income groups are not sustainable or generalisable.These modes do not provide equity in access <strong>and</strong> aresocially divisive. The growth in these modes will adverselyaffect the welfare of future generations.Rapid reductions in emissions require changes inbehaviour, technology, <strong>and</strong> l<strong>and</strong> use (see webappendices 2<strong>and</strong> 3 for a case study). There exists the potential of amodal shift from oil-based car transport to food-basedactive transport, to yield important health benefits for carusers <strong>and</strong> wider society, through reductions in airpollution, physical inactivity, <strong>and</strong> opportunity costs.Future research should quantify these effects underalternative scenarios. The greatest potential for healthgain is by improving the walking environment <strong>and</strong>supporting the most energy efficient form oftransport—the bicycle. The necessary changes areachievable <strong>and</strong> affordable <strong>and</strong> essential for sustainabledevelopment across settings. Levels of cycling can be usedas a measure of progress towards a healthier sustainablefuture in both the developed <strong>and</strong> the developing world.The main obstacles to progress are not technological butpolitical, in particular the financial interests ofstakeholders.References1 Fulton L. Reducing oil consumption in transport. Combiningthree approaches. http://www.iea.org/textbase/papers/2004/transport.<strong>pdf</strong> (accessed July 23, 2007).2 Department of <strong>Transport</strong>. Greenhouse gas emissions fromtransport. http://www.statistics.gov.uk/downloads/theme_environment/transport_report.<strong>pdf</strong> (accessed July 23, 2007).3 Anon. Greenhouse gas emissions from the US transportationsector 1990–2003, 2006. http://www.epa.gov/otaq/climate/420r06003.<strong>pdf</strong> (accessed July 30, 2007).4 EarthTrends. <strong>Energy</strong> consumption by source: oil <strong>and</strong> petroleumproducts. http://earthtrends.wri.org/searchable_db/index.php?theme=6&variable_ID=273&action=select_countries(accessed July 23, 2007).5 Yulin J, Liguang F. <strong>Transport</strong>-related resource <strong>and</strong> environmentalissues in China. World <strong>Transport</strong> Policy <strong>and</strong> Practice 2006; 12: 17–28.6 Zhou W, Szyliowicz J. The development <strong>and</strong> current status ofChina’s transportation system. World <strong>Transport</strong> Policy <strong>and</strong> Practice2006; 12: 10–16.7 Asian Development Bank. <strong>Energy</strong> efficiency <strong>and</strong> climate changeconsiderations for on-road transport in Asia, 2006. http://www.adb.org/Documents/Reports/<strong>Energy</strong>-Efficiency-<strong>Transport</strong>/energyefficiency.<strong>pdf</strong>(accessed July 23, 2007).8 Hillman M, Fawcett T. How we can save the planet. London:Penguin, 2005.9 Br<strong>and</strong> C, Preston JM, Boardman B. Integrated travel emissionsprofiles: final research report to the ESRC. Oxford: TSU,University of Oxford, 2006.10 Cairns S, Newson C. Predict <strong>and</strong> decide: aviation, climate change<strong>and</strong> UK policy. Oxford: Environmental Change Institute,University of Oxford, 2006.11 Civil Aviation Authority. CAA publishes air passenger survey.http://www.caa.co.uk/application.aspx?catid=14&pagetype=65&appid=7&newstype=n&mode=detail&nid=1362 (accessed July 23, 2007).12 Sausen R, Isaksen I, Grewe V, et al. Aviation radiative forcing in2000: An update on IPCC (1999). Meteorologische Zeitschrift 2005; 14:555–61.13 Peden M, Scurfield R, Sleet D, et al. World report on road trafficinjury prevention. Geneva: World Health Organization, 2004.14 Odero W, Khayesi M, Heda P. Road traffic injuries in Kenya:magnitude, causes <strong>and</strong> status of intervention.Injury Control <strong>and</strong> Safety Promotion 2003; 10: 53–61.15 Zimmermann N, Bauer R. Injuries in the European Union:summary 2002-2004. http://www.actiononinjuries.org/csi/eurosafe2006.nsf/wwwVwContent/l3reports-1.htm?OpenDocument(accessed July 23, 2007).16 Jacobsen PL. Safety in numbers: more walkers <strong>and</strong> bicyclists, saferwalking <strong>and</strong> bicycling. Inj Prev 2003; 9: 205–09.17 Bull F, Armstrong T, Dixon T, Ham S, Neiman A, Pratt M. Physicalinactivity. In: Ezzati M, Lopez A, Rodgers A, Murray CJL, eds.Comparative quantification of health risks. Geneva: World HealthOrganization, 2004.18 Srinath Reddy K, Shah B, Varghese C, Ramadoss A. Respondingto the threat of chronic diseases in India. Lancet 2005; 366:1744–49.19 Anderson GF, Chu E. Exp<strong>and</strong>ing priorities—confronting chronicdisease in countries with low income. N Engl J Med 2007; 356:209–11.20 WHO. Chapter 6: neglected global epidemics: three growingthreats. World health report 2003: shaping the future. Geneva:World Health Organization, 2003.21 Frank LD, Andresen MA, Schmid TL. Obesity relationships withcommunity design, physical activity, <strong>and</strong> time spent in cars.Am J Prev Med 2004; 27: 87–96.22 James W, Jackson-Leach R, Mhurchu C, et al. Overweight <strong>and</strong>obesity (high body mass index). In: Ezzati M, Lopez A, Rodgers A,Murray C, eds. Comparative quantification of health risks. Geneva:World Health Organization, 2004.23 Prentice A, Jebb S. <strong>Energy</strong> intake/physical activity interactions inthe homeostasis of body weight regulation. Nutr Rev 2004; 62:S98–104.24 Wilkinson P, Smith KR, Joffe M, Haines A. A global perspective onenergy: health effects <strong>and</strong> injustices. Lancet 2007; published onlineSept 13. DOI:10.1016/S0140-6736(07)61252-5.25 Haines A, Smith KR, Anderson D, et al. Policies for acceleratingaccess to clean energy, improving health, advancing development,<strong>and</strong> mitigating climate change. Lancet 2007; published onlineSept 13. DOI:10.1016/S0140-6736(07)61254-9.26 Prüss-Üstün A, Fewtrell L, L<strong>and</strong>rigan P, Ayuso-Mateos J. Leadexposure. In: Ezzati M, Lopez A, Rodgers A, Murray C, eds.Comparative quantification of health risks. Geneva: World HealthOrganization, 2004.27 Heinrich J, Schwarze PE, Stilianakis N, et al. Studies on healtheffects of transport-related air pollution. In: Krzyzanowski M,Kuna-Dibbert B, Schneider J, eds. Health effects of transport-relatedair pollution. Geneva: World Health Organization, 2005.28 O’Neill MS, Veves A, Zanobetti A, et al. Diabetes enhancesvulnerability to particulate air pollution-associated impairment invascular reactivity <strong>and</strong> endothelial function. Circulation 2005; 111:2913–20.29 Patz J, Kovats S. Hotspots in climate change <strong>and</strong> human health.BMJ 2002; 325: 1094–97.30 Changhong C, Bingyan W, Qingyan F, Green C, Streets D.Reductions in emissions of local air pollutants <strong>and</strong> co-benefits ofChinese energy policy: a Shanghai case study. <strong>Energy</strong> Policy 2006;34: 754–62.31 Lipfert F. Air pollution <strong>and</strong> poverty: does the sword cut both ways?J Epidemiol Community Health 2004; 58: 2–3.32 Krzyzanowski M, Kuna-Dibbert B, Schneider J, eds. Health effectsof transport-related air pollution. Geneva: World HealthOrganization, 2005.33 Keuken M, S<strong>and</strong>erson E, Aalst Rv, Borken J, Schneider J.Contribution of traffic to levels of ambient air pollution in Europe.In: Krzyzanowski M, Kuna-Dibbert B, Schneider J, eds. Healtheffects of transport-related air pollution. Geneva: World HealthOrganization, 2005.34 Mitchell G, Dorling D. An environmental justice analysis of Britishair quality Environment <strong>and</strong> Planning A 2003; 35: 909–29.10 www.thelancet.com Published online September 13, 2007 DOI:10.1016/S0140-6736(07)61254-9
Series35 Dora C, Racioppi F. Including health in transport policy agendas: therole of the health impact assessment analyses <strong>and</strong> procedures in theEuropean experience. Bull World Health Organ 2003; 81: 399–403.36 Watkiss P, Br<strong>and</strong> C, Hurley F, et al. Informing transport healthimpact assessment in London. London: NHS Executive, 2000.37 Sharma DC. Ports in a storm. Environ Health Perspect 2006; 114:A222–31.<strong>38</strong> European Commission. Keep Europe moving—sustainable mobilityfor our continent. http://ec.europa.eu/transport/transport_policy_review/doc/2006_3167_brochure_en.<strong>pdf</strong> (accessed Aug 21, 2007).39 Saelens BE, Sallis JF, Black JB, Chen D. Neighborhood-baseddifferences in physical activity: an environment scale evaluation.Am J Public Health 2003; 93: 1552–58.40 Hillman M, Adams J, Whitelegg J. One false move... a study ofchildren’s independent mobility. London: Policy Studies Institute,1990.41 Frumkin H, Frank L, Jackson R. Urban sprawl <strong>and</strong> public health:designing, planning <strong>and</strong> building for healthy communities.Washington, DC: Isl<strong>and</strong> Press, 2004.42 Islam MK, Merlo J, Kawachi I, Lindstrom M, Gerdtham UG. Socialcapital <strong>and</strong> health: does egalitarianism matter? A literature review.Int J Equity Health 2006; 5: 3.43 Strum R, Cohen D. Suburban sprawl <strong>and</strong> physical <strong>and</strong> mentalhealth. Public Health 2004; 118: 488–96.44 Geurs K, van Wee B. Backcasting as a tool for sustainable transportpolicy making: the environmentally sustainable transport study inthe Netherl<strong>and</strong>s. European Journal of <strong>Transport</strong> <strong>and</strong> Infrastructure2004; 4: 47–69.45 Freund P. Bodies, disability <strong>and</strong> spaces: the social model <strong>and</strong>disabling spatial organisations. Disability & Society 2001; 16: 689–706.46 Banister D, Wright L. The role of transport in supporting subnationalgrowth. London: Department for InternationalDevelopment, 2005.47 Banister D. Unsustainable transport: city transport in the newcentury. Hove: Routledge, 2005.48 Whitelegg J, Haq G. The global transport problem: same issues buta different place. In: Whitelegg J, Haq G, eds. The earthscan readeron: world transport policy <strong>and</strong> practice. Earthscan 2003: 3–23.49 Carson I. Perpetual motion. Economist Sept 2, 2004.50 EarthTrends. Sustainable transport in the developing world.Monthly update. http://earthtrends.wri.org/updates/node/135(accessed July 23, 2007).51 Finkelstein EA, Ruhm CJ, Kosa KM. Economic causes <strong>and</strong>consequences of obesity. Annu Rev Public Health 2005; 26: 239–57.52 Vallette J, Kretzmann S. The energy tug of war: the winners <strong>and</strong>losers of World Bank fossil fuel finance. http://www.seen.org/PDFs/Tug_of_war.<strong>pdf</strong> (accessed July 23, 2007).53 McMichael A. Population, environment, disease, <strong>and</strong> survival: pastpatterns, uncertain futures. Lancet 2002; 359: 1145–48.54 Sachs J, Warner A. Natural resources <strong>and</strong> economic development: thecurse of natural resources. European Econ Review 2001; 45: 827–<strong>38</strong>.55 ChristianAid. Fuelling poverty: oil, war <strong>and</strong> corruption. Why the oilindustry is bad for poor countries. London: Christian Aid, 2003.56 Marmot M, Wilkinson RG. Psychosocial <strong>and</strong> material pathways inthe relation between income <strong>and</strong> health. BMJ 2001; 322: 1233–36.57 Anon. European transport policy 2010: time to decide. http://ec.europa.eu/transport/white_paper/index_en.htm (accessed July23, 2007).58 St<strong>and</strong>ing Advisory Committee for Trunk Road Assessment.<strong>Transport</strong> <strong>and</strong> the economy: full report. http://www.dft.gov.uk/pgr/economics/sactra/transport<strong>and</strong>theeconomyfullre3148 (accessed July23, 2007).59 Lopez-Casanovas G, Rivera B, Currais L, eds. Health <strong>and</strong> economicgrowth. Cambridge, MA: MIT Press, 2005.60 Hufnagel L, Brockmann D, Geisel T. Forecast <strong>and</strong> control ofepidemics in a globalized world. Proc Natl Acad Sci USA 2004; 101:15 124–29.61 Wilson ME. The traveller <strong>and</strong> emerging infections: sentinel, courier,transmitter. J Appl Microbiol 2003; 94 (suppl): 1–11.62 Mashiri M, Odero KK. <strong>Transport</strong> sector joins fight against HIV/AIDS. http://www4.worldbank.org/afr/ssatp/Resources/HTML/Gender-RG/Source%20%20documents/Issue%20<strong>and</strong>%20Strategy%20Papers/HIV/ISHIV2%20<strong>Transport</strong>%20<strong>and</strong>%20HIV%20AIDS%20IFRTD%2004.<strong>pdf</strong> (accessed July 23, 2007)..63 Pucher J, Dijkstra L. Promoting safe walking <strong>and</strong> cycling to improvepublic health: lessons from the Netherl<strong>and</strong>s <strong>and</strong> Germany.Am J Public Health 2003; 93: 1509–16.64 Stern N. Stern review on the economics of climate change. http://www.hm-treasury.gov.uk/independent_reviews/stern_review_economics_climate_change/sternreview_index.cfm (accessed July 2,2007).65 Cairns S, Atkins S, Goodwin P. Disappearing traffic? The story sofar. Proceedings of the Royal Institution of Civil Engineers 2002; 13–22.66 Litman T. Mobility as a positional good implications for transportpolicy <strong>and</strong> planning. Autoconsequences: automobilization <strong>and</strong> itssocial implications. October 6, 2006, Vancouver, Canada.67 Roberts I, Godlee F. Reducing the carbon footprint of medicalconferences. BMJ 2007; 334: 324–25.68 Banister D, Hickman R. Visioning <strong>and</strong> backcasting for UKtransport policy (VIBAT). http://www.ucl.ac.uk/~ucft696/vibat2.html (accessed July 23, 2007).69 Banister D, Stead D. Impact of information <strong>and</strong> communicationstechnology on transport. <strong>Transport</strong> Reviews 2004; 24: 611–32.70 Banister D, Hickman R. CO2 minus 60% by 2030—the impossiblechallenge for transport. Planning Research Conference; London;April, 2006.71 Schade B, Schade W. Evaluating economic feasibility <strong>and</strong> technicalprogress of environmentally sustainable transport scenarios by abackcasting approach with ESCOT. <strong>Transport</strong> Reviews 2005; 25:647–68.72 UN <strong>Energy</strong>. Sustainable bioenergy: a framework for decisionmakers. http://esa.un.org/un-energy/<strong>pdf</strong>/susdev.Biofuels.FAO.<strong>pdf</strong>(accessed July 23, 2007).73 Wright L, Fulton L. Climate change mitigation <strong>and</strong> transport indeveloping countries. <strong>Transport</strong> Reviews 2005; 25: 691–717.74 Mohan D. Work trips <strong>and</strong> safety of bicyclists. Ind J <strong>Transport</strong>Management 2002; 26: 225–33.75 Royal Commission on Environmental Pollution. The environmentaleffects of civil aircraft in flight. London: Royal Commission onEnvironmental Pollution, 2002.76 Badami M. The urban transport challenge in India. Considerations,implications <strong>and</strong> strategies. International Development PlanningReview 2005; 27: 169–94.77 Tiwari G. Returning streets to the people. BMJ 2002; 324: 1164.78 Howe J. The headloading <strong>and</strong> footpath economy—walking in Sub-Saharan Africa. World <strong>Transport</strong> Policy <strong>and</strong> Practice 2001; 7: 8–12.79 Heath GW, Brownson RC, Kruger J, et al. The effectiveness ofurban design <strong>and</strong> l<strong>and</strong> use <strong>and</strong> transport policies <strong>and</strong> practices toincrease physical activity: a systematic review.Journal of Physical Activity <strong>and</strong> Health 2006; 3: S55–S76.80 Killoran A, Doyle N, Waller S, Wohlgemuth C, Crombie H.<strong>Transport</strong> interventions promoting safe cycling <strong>and</strong> walking.London: NICE, 2006.81 Ogilvie D, Egan M, Hamilton V, Petticrew M. Promoting walking<strong>and</strong> cycling as an alternative to using cars: systematic review. BMJ2004; 329: 763.www.thelancet.com Published online September 13, 2007 DOI:10.1016/S0140-6736(07)61254-9 11