GoB-UN POP 2010-2014 - UNFPA Botswana
GoB-UN POP 2010-2014 - UNFPA Botswana
GoB-UN POP 2010-2014 - UNFPA Botswana
- No tags were found...

Create successful ePaper yourself
Turn your PDF publications into a flip-book with our unique Google optimized e-Paper software.
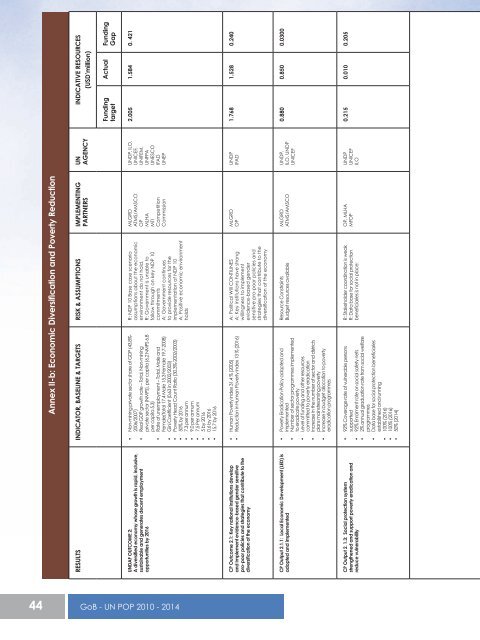
Annex II-b: Economic Diversification and Poverty ReductionRESULTS INDICATOR, BASELINE & TARGETS RISK & ASSUMPTIONS IMPLEMENTINGPARTNERS<strong>UN</strong>DAF OUTCOME 2:A diversified economy whose growth is rapid, inclusive,sustainable and generates decent employmentopportunities by 2016• Non-mining private sector share of GDP (43.8%-2006/2007)• Real GDP growth rate – Total, Non-miningprivate sector (NMPS), per capita (6.2 NMPS 6.8per capita 5.3)• Rate of unemployment – Total, Male andFemale(Total 17.4 Male 15.3 Female 19.7-2008)• Gini Coefficient (0.63 in 2002/2003)• Poverty Head Count Ratio (30.3%-2002/2003)• 50% by 2016• 7.3 per annum• 9.0 per annum• 7.5 Per annum• 5 by 2016• 0.6 by 2016• 15.7 by 2016R: NDP 10 Base case scenarioassumptions about the economicenvironment do not hold.R: Government is unable tofollow through on key NDP 10commitmentsA: Government continuesto provide resources for theimplementation of NDP 10A: Positive economic environmentholdsMLGRDATMS/AMSCOOPMLHAMTICompetitionCommissionCP Outcome 2.1: Key national institutions developand implement evidence-based gender sensitivepro-poor policies and strategies that contribute to thediversification of the economy• Human Poverty Index 31.4 % (2005)• Reduction in Human Poverty Index 13 % (2016)A: Political Will CONTI<strong>UN</strong>ESA: Key institutions have strongwillingness to implementevidence-based gendersensitive pro-poor policies andstrategies that contribute to thediversification of the economyMLGRDOPCP Output 2.1.1: Local Economic Development (LED) isadopted and implemented• Poverty Eradication Policy adopted andimplemented• Number of sector programmes implementedto eradicate poverty• Level of funding and other resourcescommitted to poverty eradication• Increase in the number of sector and districtsplans mainstreaming poverty• Increase in budget allocation to povertyeradication programmesResource ConstraintsBudget resources availableMLGRDATMS/AMSCOCP Output 2. 1.3: Social protection systemstrengthened and support poverty eradication andreduce vulnerability• 92% Coverage rate of vulnerable personssupported• 92% Enrolment rate on social safety nets• 2% annual graduation rate from social welfareprogrammes• Data base for social protection beneficiariesestablished and running• 100% (2016)• 100% (2016)• 50% (<strong>2014</strong>)R: Stakeholder coordination is weakR: Data base for social protectionbeneficiaries is not in place:OP, MLHAMFDP<strong>UN</strong>AGENCY<strong>UN</strong>DP, ILO,<strong>UN</strong>ICEF,<strong>UN</strong>IFEM,<strong>UN</strong>FPA<strong>UN</strong>ESCOIFAD<strong>UN</strong>EP<strong>UN</strong>DPIFAD<strong>UN</strong>DP,ILO, <strong>UN</strong>DP<strong>UN</strong>ICEF<strong>UN</strong>DP<strong>UN</strong>ICEFILOINDICATIVE RESOURCES(USD’million)FundingtargetActual FundingGap2.005 1.584 0. 4211.768 1.528 0.2400.880 0.850 0.03000.215 0.010 0.20544 <strong>GoB</strong> - <strong>UN</strong> <strong>POP</strong> <strong>2010</strong> - <strong>2014</strong>