Third Benchmarking Report on Quality of Electricity Supply
Third Benchmarking Report on Quality of Electricity Supply
Third Benchmarking Report on Quality of Electricity Supply
- No tags were found...

You also want an ePaper? Increase the reach of your titles
YUMPU automatically turns print PDFs into web optimized ePapers that Google loves.
Council <strong>of</strong>EuropeanEnergyRegulatorsTHIRD BENCHMARKING REPORTON QUALITY OF ELECTRICITY SUPPLY2005
Issued byCouncil <strong>of</strong> European Energy Regulators ASBL28 rue le Titien, 1000 BruxellesArr<strong>on</strong>dissement judiciaire de BruxellesRPM 0861.035.445
Council <strong>of</strong>EuropeanEnergyRegulators<strong>Electricity</strong> Working Group<strong>Quality</strong> <strong>of</strong> <strong>Supply</strong> Task ForceTHIRD BENCHMARKING REPORTON QUALITY OF ELECTRICITY SUPPLY2005Ref: C05-QOS-01-03Final Versi<strong>on</strong>: 6-December-2005
INDEXINTRODUCTIONVCHAPTER 1C<strong>on</strong>tinuity <strong>of</strong> <strong>Supply</strong>1CHAPTER 2The use <strong>of</strong> Standards and Incentives in <strong>Quality</strong> Regulati<strong>on</strong>29CHAPTER 3Standards in Commercial <strong>Quality</strong> Regulati<strong>on</strong>65CHAPTER 4Voltage <strong>Quality</strong>93ANNEXES111VII<str<strong>on</strong>g>Third</str<strong>on</strong>g> <str<strong>on</strong>g>Benchmarking</str<strong>on</strong>g> <str<strong>on</strong>g>Report</str<strong>on</strong>g> <strong>on</strong> <strong>Quality</strong> <strong>of</strong> <strong>Electricity</strong> <strong>Supply</strong> – 2005 · Index
CHAPTER 1 – C<strong>on</strong>tinuity <strong>of</strong> <strong>Supply</strong>CONTENT1.1 What is C<strong>on</strong>tinuity <strong>of</strong> <strong>Supply</strong>? 31.2 Main C<strong>on</strong>clusi<strong>on</strong>s <strong>on</strong> C<strong>on</strong>tinuity <strong>of</strong> <strong>Supply</strong> Regulati<strong>on</strong> –Drawn from CEER’s First and Sec<strong>on</strong>d <str<strong>on</strong>g>Benchmarking</str<strong>on</strong>g> <str<strong>on</strong>g>Report</str<strong>on</strong>g>s 41.3 Main C<strong>on</strong>clusi<strong>on</strong>s <strong>on</strong> C<strong>on</strong>tinuity <strong>of</strong> <strong>Supply</strong> Regulati<strong>on</strong> –Drawn from CEER’s <str<strong>on</strong>g>Third</str<strong>on</strong>g> <str<strong>on</strong>g>Benchmarking</str<strong>on</strong>g> <str<strong>on</strong>g>Report</str<strong>on</strong>g> 51.4 C<strong>on</strong>tinuity <strong>of</strong> <strong>Supply</strong> Questi<strong>on</strong>naire 51.4.1 C<strong>on</strong>tinuity Indicators used 51.4.2 Data availability 61.5 Assumpti<strong>on</strong>s for benchmarking <strong>of</strong> actual levels 71.5.1 Interrupti<strong>on</strong> m<strong>on</strong>itoring and communicati<strong>on</strong> 71.6 Background Informati<strong>on</strong> <strong>on</strong> C<strong>on</strong>tinuity Indicators 91.6.1 Weighting methods used for c<strong>on</strong>tinuity indicators 101.6.2 Rules for recording l<strong>on</strong>g interrupti<strong>on</strong>s 131.6.3 Rules for recording short interrupti<strong>on</strong>s 161.6.4 Audits <strong>on</strong> Data Collected 171.7 Analysis 191.7.1 Unplanned SAIDI not attributable to excepti<strong>on</strong>al events 201.7.2 Unplanned SAIDI 201.7.3 Planned SAIDI 211.7.4 Unplanned SAIFI not attributable to excepti<strong>on</strong>al events 221.7.5 Unplanned SAIFI 221.7.6 Planned SAIFI 231.7.7 Unplanned MAIFI not attributable to excepti<strong>on</strong>al events 241.7.8 <strong>Electricity</strong> Not Supplied (ENS) 251.7.9 AIT (Transmissi<strong>on</strong>) 261.8 Further analysis <strong>of</strong> interrupti<strong>on</strong>s set out in Annex (1) 261.9 C<strong>on</strong>clusi<strong>on</strong>s: recommendati<strong>on</strong>s for future work <strong>on</strong> C<strong>on</strong>tinuity Indicators 27Annex to Chapter 1 1111<str<strong>on</strong>g>Third</str<strong>on</strong>g> <str<strong>on</strong>g>Benchmarking</str<strong>on</strong>g> <str<strong>on</strong>g>Report</str<strong>on</strong>g> <strong>on</strong> <strong>Quality</strong> <strong>of</strong> <strong>Electricity</strong> <strong>Supply</strong> – 2005 · Chapter 1
CONTINUITY OF SUPPLY1.1 What is C<strong>on</strong>tinuity <strong>of</strong> <strong>Supply</strong>?C<strong>on</strong>tinuity <strong>of</strong> supply is characterized by the number and durati<strong>on</strong> <strong>of</strong> supply interrupti<strong>on</strong>s. It iswidely accepted that it is neither technically nor ec<strong>on</strong>omically feasible for a power system toensure that electricity is c<strong>on</strong>tinuously available <strong>on</strong> demand. Instead, the basic functi<strong>on</strong> <strong>of</strong> a powersystem is to supply power that satisfies the system load and energy requirement ec<strong>on</strong>omicallyand also at acceptable levels <strong>of</strong> c<strong>on</strong>tinuity and quality. “<strong>Quality</strong> <strong>of</strong> supply” is usually measured interms <strong>of</strong> acceptable values <strong>of</strong> voltage and frequency, while “c<strong>on</strong>tinuity <strong>of</strong> supply” refers to uninterruptedelectricity service 1 . Reliability refers to the ability <strong>of</strong> a power system to provide an adequate2 and secure supply <strong>of</strong> electrical energy at any point in time 3 . <strong>Supply</strong> interrupti<strong>on</strong>s regardless<strong>of</strong> their cause, mean a reducti<strong>on</strong> in reliability.C<strong>on</strong>tinuity <strong>of</strong> supply matters to all types <strong>of</strong> customers and for numerous reas<strong>on</strong>s. For large industrialusers interrupti<strong>on</strong>s <strong>of</strong> even a relatively short durati<strong>on</strong> can lead to substantial financial losses, whilstfor domestic users interrupti<strong>on</strong>s can leave people without heating, lighting and cooking facilities. Themain things that customers expect to see in respect <strong>of</strong> electricity networks are:·· Reliability;Quick restorati<strong>on</strong>; andTimely reliable informati<strong>on</strong> when there is a problem.·Chapter 2 <strong>of</strong> this report deals with the incentive regulati<strong>on</strong>s in place in many European countries,whilst chapter 3 looks at commercial quality and the standards <strong>of</strong> service in force throughoutEurope. This chapter focuses <strong>on</strong> the key measures <strong>of</strong> c<strong>on</strong>tinuity <strong>of</strong> supply that are comm<strong>on</strong>lyused in Europe. A supporting Annex provides additi<strong>on</strong>al tables and analysis <strong>of</strong> the wealth <strong>of</strong> informati<strong>on</strong>that was submitted.The four main features <strong>of</strong> c<strong>on</strong>tinuity <strong>of</strong> supply can be summarised as follows:· The type <strong>of</strong> interrupti<strong>on</strong>: planned or unplanned interrupti<strong>on</strong>s. Planned interrupti<strong>on</strong>s arescheduled, for instance, to carry out necessary maintenance <strong>of</strong> the network. Planned interrupti<strong>on</strong>swhich are not notified to customers should be recorded as unplanned interrupti<strong>on</strong>s.· The durati<strong>on</strong> <strong>of</strong> each interrupti<strong>on</strong>: transient, short or l<strong>on</strong>g interrupti<strong>on</strong>s. In accordancewith European technical standards EN50160, interrupti<strong>on</strong>s that last more than 3 minutes aredefined as “l<strong>on</strong>g interrupti<strong>on</strong>s”, interrupti<strong>on</strong>s that last more than 1 sec<strong>on</strong>d and less than 3 min-1Billint<strong>on</strong>, R. and Allan, R.N., « Reliability evaluati<strong>on</strong> <strong>of</strong> power systems » (Plenum Press, 1984)2Adequacy is the ability <strong>of</strong> a power system to supply the aggregate electrical demand and energy requirements <strong>of</strong> the customersat all times, taking into account scheduled and unscheduled outages <strong>of</strong> system facilities (definiti<strong>on</strong> from NARUC, the US Nati<strong>on</strong>alAssociati<strong>on</strong> <strong>of</strong> Regulatory Utility Commissi<strong>on</strong>ers). Adequacy problems are not addressed in this report.3Billint<strong>on</strong>, R. and Allan, R.N., « Reliability Assessment <strong>of</strong> large power systems » (Kluwer Press, 1988)3<str<strong>on</strong>g>Third</str<strong>on</strong>g> <str<strong>on</strong>g>Benchmarking</str<strong>on</strong>g> <str<strong>on</strong>g>Report</str<strong>on</strong>g> <strong>on</strong> <strong>Quality</strong> <strong>of</strong> <strong>Electricity</strong> <strong>Supply</strong> – 2005 · Chapter 1
··utes are defined as “short interrupti<strong>on</strong>s”, and interrupti<strong>on</strong>s that last less than 1 sec<strong>on</strong>d as“transient interrupti<strong>on</strong>s”.The voltage levels <strong>of</strong> faults and other causes <strong>of</strong> interrupti<strong>on</strong>s: an interrupti<strong>on</strong> <strong>of</strong> supply t<strong>of</strong>inal customers can originate at any voltage level, low/medium/high voltage, in the system. Athigh voltage and extra high voltage levels there is typically greater security and most faults willnot lead to customers being interrupted.The type <strong>of</strong> c<strong>on</strong>tinuity indicators: number or durati<strong>on</strong> <strong>of</strong> outages. The number <strong>of</strong> outagesper customer in a year, termed Customer Interrupti<strong>on</strong> (CI) or System Average Interrupti<strong>on</strong>Frequency Index (SAIFI), indicates how many times in a year, energy is not supplied. Thecumulative yearly durati<strong>on</strong> <strong>of</strong> interrupti<strong>on</strong>s per customer, generally referred as CustomerMinutes Lost (CML) or System Average Interrupti<strong>on</strong> Durati<strong>on</strong> Index (SAIDI), indicates howl<strong>on</strong>g, in a given year, energy is not supplied 4 (average per customer). A small number <strong>of</strong> countriesmake use <strong>of</strong> the following c<strong>on</strong>tinuity indicators; the time <strong>of</strong> equivalent interrupti<strong>on</strong> perpower installed (TIEPI) and the number <strong>of</strong> equivalent interrupti<strong>on</strong>s per power installed (NIEPI).These indices (<strong>of</strong> frequency and durati<strong>on</strong>) provide useful informati<strong>on</strong> to regulatory authorities<strong>on</strong> the performance <strong>of</strong> the network in terms <strong>of</strong> security and availability respectively.1.2 Main C<strong>on</strong>clusi<strong>on</strong>s <strong>on</strong> C<strong>on</strong>tinuity <strong>of</strong> <strong>Supply</strong> Regulati<strong>on</strong> – Drawn from the CEER’sFirst and Sec<strong>on</strong>d <str<strong>on</strong>g>Benchmarking</str<strong>on</strong>g> <str<strong>on</strong>g>Report</str<strong>on</strong>g>sThe main features <strong>of</strong> c<strong>on</strong>tinuity <strong>of</strong> supply, across several surveyed countries, are described in theFirst (April 2001) and the Sec<strong>on</strong>d (September 2003) <str<strong>on</strong>g>Benchmarking</str<strong>on</strong>g> <str<strong>on</strong>g>Report</str<strong>on</strong>g>s, hereafter referred toas “First <str<strong>on</strong>g>Report</str<strong>on</strong>g>” and “Sec<strong>on</strong>d <str<strong>on</strong>g>Report</str<strong>on</strong>g>”.In brief, the First <str<strong>on</strong>g>Report</str<strong>on</strong>g> identified the two main features <strong>of</strong> c<strong>on</strong>tinuity <strong>of</strong> supply regulati<strong>on</strong> as (1)guaranteeing that each user can be provided with at least a minimum level <strong>of</strong> quality and (2) promotingquality improvement across the system. The comparative analysis <strong>of</strong> available measurementand c<strong>on</strong>tinuity <strong>of</strong> supply regulati<strong>on</strong> in the First <str<strong>on</strong>g>Report</str<strong>on</strong>g> shows that regulators have generallyapproached c<strong>on</strong>tinuity issues starting from l<strong>on</strong>g interrupti<strong>on</strong>s affecting LV customers, treatingplanned and unplanned interrupti<strong>on</strong>s separately. In several countries both the number and thedurati<strong>on</strong> <strong>of</strong> outages are available for each indicator, but the choice <strong>of</strong> the indicator used varies bycountry and in many countries short interrupti<strong>on</strong>s (and sometimes, transient <strong>on</strong>es) are or will berecorded as well. Different approaches to c<strong>on</strong>tinuity <strong>of</strong> supply regulati<strong>on</strong>, and in particular the differentc<strong>on</strong>tinuity indicators and standards adopted, recording methodologies used, combined withdifferent geographical, meteorological and network characteristics, makes benchmarking <strong>of</strong> actuallevels <strong>of</strong> c<strong>on</strong>tinuity <strong>of</strong> supply difficult.Since publicati<strong>on</strong> <strong>of</strong> the First <str<strong>on</strong>g>Report</str<strong>on</strong>g> <strong>of</strong> the working group, there have been a number <strong>of</strong> improvementsin comparis<strong>on</strong>s <strong>of</strong> c<strong>on</strong>tinuity <strong>of</strong> supply. This <str<strong>on</strong>g>Third</str<strong>on</strong>g> <str<strong>on</strong>g>Report</str<strong>on</strong>g> now includes informati<strong>on</strong> from 204Energy Not Supplied (ENS) is linked to CML and is more sophisticated indicator because it takes into account the disc<strong>on</strong>nectedpower.4Council <strong>of</strong> European Energy Regulators – Ref: C05-QOS-01-03
countries compared with 6 in the First <str<strong>on</strong>g>Report</str<strong>on</strong>g>. Comparis<strong>on</strong>s <strong>of</strong> performance are made forunplanned and planned outages, outages <strong>of</strong> short durati<strong>on</strong> and an attempt has been made toinvestigate unplanned performance excluding excepti<strong>on</strong>al events. As in the previous two reportsdata limitati<strong>on</strong>s have meant that detailed comparis<strong>on</strong>s could not be carried out for all countries.1.3 Main C<strong>on</strong>clusi<strong>on</strong>s <strong>on</strong> C<strong>on</strong>tinuity <strong>of</strong> <strong>Supply</strong> Regulati<strong>on</strong> – Drawn from the CEER’s<str<strong>on</strong>g>Third</str<strong>on</strong>g> <str<strong>on</strong>g>Benchmarking</str<strong>on</strong>g> <str<strong>on</strong>g>Report</str<strong>on</strong>g>A number <strong>of</strong> encouraging trends have been observed in carrying out work <strong>on</strong> the <str<strong>on</strong>g>Third</str<strong>on</strong>g> <str<strong>on</strong>g>Report</str<strong>on</strong>g>:· The durati<strong>on</strong> <strong>of</strong> unplanned interrupti<strong>on</strong>s shows (for most countries) a significant downwardtrend;· The number <strong>of</strong> unplanned interrupti<strong>on</strong>s shows (for most countries) a downward trend;· Excluding excepti<strong>on</strong>al events from unplanned performance figures highlights the significantimprovements being made by many European countries in terms <strong>of</strong> both the durati<strong>on</strong> andnumber <strong>of</strong> interrupti<strong>on</strong>s;· Countries with previously low levels for durati<strong>on</strong> and number <strong>of</strong> interrupti<strong>on</strong>s have been ableto make further improvements; and· Short interrupti<strong>on</strong>s have generally not been rising despite an increased move to automati<strong>on</strong>and remote c<strong>on</strong>trol techniques.1.4 C<strong>on</strong>tinuity <strong>of</strong> <strong>Supply</strong> Questi<strong>on</strong>naire1.4.1 C<strong>on</strong>tinuity Indicators UsedThe c<strong>on</strong>tinuity indicators which form the basis <strong>of</strong> the c<strong>on</strong>tinuity analysis in this report 5 are:· “System Average Interrupti<strong>on</strong> Durati<strong>on</strong> Index” (SAIDI), in some countries referred to as“Customer Minutes Lost per customer per year” (CMLs)· “System Average Interrupti<strong>on</strong> Frequency Index” (SAIFI), in some countries also referredas “Customer Interrupti<strong>on</strong>s per 100 customers per year” (CIs)· “Momentary Average Interrupti<strong>on</strong> Frequency Index” (MAIFI).· “Energy Not Supplied” (ENS)6· “Average Interrupti<strong>on</strong> Time” (AIT)7 .SAIDI measures the average durati<strong>on</strong> <strong>of</strong> outages for a power system. SAIFI and MAIFI measurethe average frequency <strong>of</strong> outages for the power system, respectively for l<strong>on</strong>g and for short interrupti<strong>on</strong>s.ENS is generally based <strong>on</strong> l<strong>on</strong>g interrupti<strong>on</strong>s, as the energy not supplied during short5For a comprehensive review <strong>of</strong> c<strong>on</strong>tinuity indicators, please see the document : IEEE Standard 1366-2003. IEEE Guide forElectric Power Distributi<strong>on</strong> Reliability Indices. IEEE, New York, NY, May 20046Norway uses ENS for all voltage levels greater than 1 kV.7For some countries such as Italy (until 2004), the informati<strong>on</strong> relating to AIT and ENS includes outages occurring at distributi<strong>on</strong>high voltage and may therefore result in higher values than those countries reporting solely outages <strong>on</strong> the transmissi<strong>on</strong> network.5<str<strong>on</strong>g>Third</str<strong>on</strong>g> <str<strong>on</strong>g>Benchmarking</str<strong>on</strong>g> <str<strong>on</strong>g>Report</str<strong>on</strong>g> <strong>on</strong> <strong>Quality</strong> <strong>of</strong> <strong>Electricity</strong> <strong>Supply</strong> – 2005 · Chapter 1
interrupti<strong>on</strong>s is very small. AIT is normally used <strong>on</strong>ly for transmissi<strong>on</strong> networks, whilst the other 4performance indicators are used both for transmissi<strong>on</strong> and distributi<strong>on</strong>. These five performanceindicators are typically reported annually in most countries and the first three are <strong>of</strong>ten split intoplanned (scheduled) and unplanned (unscheduled) interrupti<strong>on</strong>s.1.4.2 Data availabilityThe analysis in this chapter is based <strong>on</strong> the informati<strong>on</strong> obtained from the following twenty 8 countriesas set out in the table below.TABLE 1.1AVAILABLE DATA COUNTRY BY COUNTRYData for Data for Data for Data for Data for SystemCountries trend resp<strong>on</strong>sibility density regi<strong>on</strong>al worst-served dataanalysis and voltage analysis analysis analysis customers analysisAustria ✓ ✓ ✓Belgium_nat ✓ ✓Belgium_wall ✓ ✓Czech Republic ✓ ✓ ✓Est<strong>on</strong>ia ✓ ✓ ✓Finland ✓ ✓France ✓ ✓ ✓ ✓Great Britain ✓ ✓ ✓ ✓Greece ✓ ✓ ✓ ✓Hungary ✓ ✓ ✓ ✓ ✓Ireland ✓ ✓ ✓Italy ✓ ✓ ✓ ✓ ✓ ✓Latvia ✓ ✓ ✓Lithuania ✓ ✓ ✓ ✓ ✓Netherlands ✓ ✓Norway ✓ ✓ ✓ ✓ ✓ ✓Poland ✓ ✓Portugal ✓ ✓ ✓ ✓ ✓Slovenia✓Spain ✓ ✓ ✓Sweden ✓ ✓ ✓ ✓✓ = availableblank = not available8Two sets <strong>of</strong> data were received for Belgium, <strong>on</strong>e set c<strong>on</strong>tained Federal informati<strong>on</strong> and the other c<strong>on</strong>tained informati<strong>on</strong> for theWall<strong>on</strong>ia regi<strong>on</strong>. Due to differences in methodology and availability <strong>of</strong> data the analysis makes use <strong>of</strong> both Federal and Wall<strong>on</strong>iainformati<strong>on</strong>.6Council <strong>of</strong> European Energy Regulators – Ref: C05-QOS-01-03
1.5 Assumpti<strong>on</strong>s for benchmarking <strong>of</strong> actual levels <strong>of</strong> c<strong>on</strong>tinuity <strong>of</strong> supplyBecause <strong>of</strong> different measurement practices in European countries, available data <strong>on</strong> actual levels<strong>of</strong> c<strong>on</strong>tinuity <strong>of</strong> supply are not always comparable. It is important to c<strong>on</strong>sider the country specificc<strong>on</strong>diti<strong>on</strong>s detailed in the Annex to this chapter. In particular the following should be noted:· First, whilst the scope <strong>of</strong> benchmarking interrupti<strong>on</strong>s has been extended to include short interrupti<strong>on</strong>sas well as l<strong>on</strong>g interrupti<strong>on</strong>s, not all countries separate their interrupti<strong>on</strong>s data intothese two categories.· Sec<strong>on</strong>d, there are different ways <strong>of</strong> measuring supply interrupti<strong>on</strong>s. C<strong>on</strong>tinuity data may becollected at all voltage levels or may exclude some voltage levels, this will be identified laterin the report. Furthermore, c<strong>on</strong>tinuity indicators may refer to all customers or be split betweencustomers at different voltage levels.· The final and perhaps most important factor to take into c<strong>on</strong>siderati<strong>on</strong> is that c<strong>on</strong>tinuity indicatorsare not always defined in a comparable way. C<strong>on</strong>tinuity indicators can be weighted bythree different methods; by customer, transformer or c<strong>on</strong>tracted power. This can give rise todifferences depending <strong>on</strong> which weighting method is used.Measurement practices have an important role in the definiti<strong>on</strong> <strong>of</strong> standards and in the design <strong>of</strong>incentive/penalty regimes. The relati<strong>on</strong>ship between c<strong>on</strong>tinuity measurement systems and standardsand/or incentive/penalty regimes will be discussed in depth.This secti<strong>on</strong> c<strong>on</strong>tains comparative informati<strong>on</strong> about: the type <strong>of</strong> interrupti<strong>on</strong>s m<strong>on</strong>itored, the statisticalindicators calculated, the guidance rules for recording interrupti<strong>on</strong>s and the technologyinvolved, as well as the audit procedures.1.5.1 Interrupti<strong>on</strong> m<strong>on</strong>itoring and communicati<strong>on</strong>With very few excepti<strong>on</strong>s, all the surveyed regulators m<strong>on</strong>itor l<strong>on</strong>g (>3’) planned and unplanned interrupti<strong>on</strong>s arisingfrom distributi<strong>on</strong>. Interrupti<strong>on</strong>s at the distributi<strong>on</strong> level are not currently m<strong>on</strong>itored in Poland. In Slovenia some dataare available, however, the recording is not yet systematic. In Latvia no distincti<strong>on</strong> is made between planned andunplanned interrupti<strong>on</strong>s. In Ireland no distincti<strong>on</strong> is made between short and l<strong>on</strong>g interrupti<strong>on</strong>s (all interrupti<strong>on</strong>s l<strong>on</strong>gerthan 1 minute are registered).It is clear from the survey that significant differences exist with regard to accuracy, as well as completeness in themeasurement and registrati<strong>on</strong> <strong>of</strong> the data. In additi<strong>on</strong>, m<strong>on</strong>itoring <strong>of</strong> c<strong>on</strong>tinuity data by the regulators is a fairly recentactivity for numerous countries. Robust data would require at least three years <strong>of</strong> historical measurements, c<strong>on</strong>sistentwith unambiguous recording rules. C<strong>on</strong>sequently, even if most <strong>of</strong> the regulators indicated in the questi<strong>on</strong>naire thatthey register l<strong>on</strong>g interrupti<strong>on</strong>s, fewer countries met the requirements chosen for inclusi<strong>on</strong> in the data comparis<strong>on</strong>.Only a restricted number <strong>of</strong> countries register interrupti<strong>on</strong>s originating from all voltage levels, HV (high voltage), MV(medium voltage), and LV (low voltage) 9 (Czech Republic, Finland, France, Greece, Great Britain, Hungary, Italy,Lithuania, Norway, Portugal, and Sweden). In most cases recording is limited to HV and/or HV and MV (Austria,Est<strong>on</strong>ia, Ireland, Latvia, Slovenia, and Spain). In this case, the number and durati<strong>on</strong> <strong>of</strong> interrupti<strong>on</strong>s actuallyexperienced by c<strong>on</strong>sumers will be higher than indicated (interrupti<strong>on</strong>s with origin <strong>on</strong> the LV network are not registered).In Belgium (Wall<strong>on</strong>ia) interrupti<strong>on</strong> data are divided between HV and LV, but LV interrupti<strong>on</strong>s are recorded <strong>on</strong>lyif l<strong>on</strong>ger than 15 minutes. A number <strong>of</strong> m<strong>on</strong>itoring systems are under development.9Generally LV means below 1 kV, MV means between 1 and 35 (or 60) kV and for this report HV includes those voltages thatare generally referred to as EHV. Voltage levels are not the same in all EU countries.7<str<strong>on</strong>g>Third</str<strong>on</strong>g> <str<strong>on</strong>g>Benchmarking</str<strong>on</strong>g> <str<strong>on</strong>g>Report</str<strong>on</strong>g> <strong>on</strong> <strong>Quality</strong> <strong>of</strong> <strong>Electricity</strong> <strong>Supply</strong> – 2005 · Chapter 1
Interrupti<strong>on</strong>s shorter than three minutes are (separately) measured in <strong>on</strong>ly a few countries (Finland,France, Hungary, Great Britain, Italy). A group <strong>of</strong> countries is preparing to measure short interrupti<strong>on</strong>s,for instance Lithuania and Czech Republic. From 2005 Norway will also require companies to recordshort interrupti<strong>on</strong>s, albeit at a less detailed level than for l<strong>on</strong>g interrupti<strong>on</strong>s. From 2006 companies inNorway will be required to record and report short interrupti<strong>on</strong>s in the same scheme as l<strong>on</strong>g interrupti<strong>on</strong>s.It should be noted that as customers make increasing use <strong>of</strong> computers and other electr<strong>on</strong>icequipment they are increasingly c<strong>on</strong>cerned about short interrupti<strong>on</strong>s. For this reas<strong>on</strong>, both l<strong>on</strong>g andshort interrupti<strong>on</strong>s should be measured.C<strong>on</strong>cerning the spatial scope <strong>of</strong> m<strong>on</strong>itoring, large differences were found across countries. Est<strong>on</strong>ia,Ireland, Latvia, and Slovenia collect data at country-level (note that in Ireland and Latvia there is<strong>on</strong>ly <strong>on</strong>e distributi<strong>on</strong> company). In all other countries c<strong>on</strong>tinuity is m<strong>on</strong>itored at a more detailedlevel: by distributi<strong>on</strong> company, in Austria, Belgium (Wall<strong>on</strong>ia), Czech Republic, Great Britain,Hungary, and Norway; by administrative regi<strong>on</strong> (and in the future by c<strong>on</strong>cessi<strong>on</strong>) in France by c<strong>on</strong>cessi<strong>on</strong>in Sweden. A good number <strong>of</strong> the countries use a classificati<strong>on</strong> <strong>of</strong> territorial areas in orderto distinguish at least am<strong>on</strong>g urban and rural (and thus set differentiated standards). Such distincti<strong>on</strong>sare meant to capture technical differences am<strong>on</strong>g networks (overhead lines vs. undergroundcable, and so <strong>on</strong>). The criteria used for territorial classificati<strong>on</strong> vary from <strong>on</strong>e country to another:· Per number <strong>of</strong> inhabitants, at municipality level (Italy and Lithuania) or at locality level (France);· Per number <strong>of</strong> customers, at municipality level (Spain and Latvia) or at locality level (Portugal);· Other criteria: Greece (based <strong>on</strong> the distance from the nearest service centre), Finland (based<strong>on</strong> the percentage <strong>of</strong> cable – 5 categories); Ireland (by network c<strong>on</strong>figurati<strong>on</strong>); Sweden (<strong>on</strong> thebasis <strong>of</strong> meters <strong>of</strong> line per customer).ADDITIONAL INFORMATION 1.1 – COMPARING PERFORMANCE ACROSS COMPANIESIn Great Britain there is no territorial classificati<strong>on</strong>, but the regulator developed a methodology forbenchmarking company performance that is used also to set targets for the interrupti<strong>on</strong> incentivescheme.Ofgem collects physical characteristics and performance informati<strong>on</strong> for each MV circuit for eachdistributi<strong>on</strong> company. These circuits are then divided into 22 circuit groups with physically similarcharacteristics. The groups are defined so that differences in the percentage <strong>of</strong> overhead line, circuitlength and number <strong>of</strong> c<strong>on</strong>nected customers are minimised and that no group is dominated bya single company. Performance is compared and benchmarked within each circuit group. Ofgemthen establishes an overall benchmark for each company based <strong>on</strong> its mix <strong>of</strong> circuits and comparesactual performance with these benchmarks.The vast majority <strong>of</strong> regulators require companies to submit informati<strong>on</strong> <strong>on</strong> c<strong>on</strong>tinuity data <strong>on</strong> ayearly basis, with the excepti<strong>on</strong> <strong>of</strong> Portugal and Lithuania where data are collected quarterly, andSlovenia where they are collected at the request <strong>of</strong> the regulator. Usually regulators publish annualreports that include data <strong>on</strong> c<strong>on</strong>tinuity (not in Belgium, Wall<strong>on</strong>ia). Other forms <strong>of</strong> communicati<strong>on</strong>s<strong>of</strong> these data include publicati<strong>on</strong> from Ministries and <strong>on</strong> the websites <strong>of</strong> the regulator or <strong>of</strong>the companies.8Council <strong>of</strong> European Energy Regulators – Ref: C05-QOS-01-03
1.6 Background Informati<strong>on</strong> <strong>on</strong> C<strong>on</strong>tinuity Indicators····Where possible countries should seek to measure c<strong>on</strong>tinuity indicators, especially unplannedSAIDI and unplanned SAIFI.Weighting by user is the most comm<strong>on</strong> method for calculating c<strong>on</strong>tinuity indicators. Thereforecountries planning to introduce c<strong>on</strong>tinuity indicators are recommended to adopt this method.Comparative analysis is facilitated where countries use the same method for calculating c<strong>on</strong>tinuityindicators at all voltages.Excepti<strong>on</strong>al events can significantly affect annual performance figures and countries shouldattempt to provide <strong>on</strong>e set <strong>of</strong> figures including all interrupti<strong>on</strong>s and <strong>on</strong>e set excluding suchatypical events.As far as the distributi<strong>on</strong> network is c<strong>on</strong>cerned, c<strong>on</strong>tinuity indicators <strong>on</strong> durati<strong>on</strong> and frequency <strong>of</strong>unplanned interrupti<strong>on</strong>s are available from the majority <strong>of</strong> the surveyed countries. The level <strong>of</strong> c<strong>on</strong>fidencein these indicators reflect the c<strong>on</strong>fidence <strong>on</strong> the data measured, as explained in Subsecti<strong>on</strong> 1.Indicators are more comm<strong>on</strong>ly weighted <strong>on</strong> the number <strong>of</strong> customers served (SAIDI, SAIFI for l<strong>on</strong>ginterrupti<strong>on</strong>s and MAIFI for short interrupti<strong>on</strong>s), but they can be weighted also <strong>on</strong> the c<strong>on</strong>tractedpower (in Portugal both methods are adopted). Table 1.2 summarises the situati<strong>on</strong>, noting thedifferences in voltage levels that are m<strong>on</strong>itored.TABLE 1.2CONTINUITY INDICATORS FOR DISTRIBUTION:unplanned interrupti<strong>on</strong>sSAIDI, SAIFI and MAIFI per voltage level(H, M, L)SAIDI and SAIFI per voltage level (H, M, L)SAIDI and SAIFI per voltage level (H, M)SAIDI and SAIFI all voltagesAverage durati<strong>on</strong> (D) and frequency (F) perc<strong>on</strong>tracted power or otherOther/No indicatorsGB, HU, IT, NO (from 2006)CZ, GR, PT, FR, LT, NO (from 2006)SI (some data <strong>on</strong>ly), BE_Wall<strong>on</strong>iaSE, EE, IE (SAIFI from 2006)AT (average D and F weighted <strong>on</strong> MV power affected,MV/MV, MV/LV),ES (average D and F weighted <strong>on</strong> MV power affected:TIEPI, NIEPI)FI (Average D and F weighted <strong>on</strong> yearly energyc<strong>on</strong>sumpti<strong>on</strong>)FI (Interrupti<strong>on</strong>s are weighted by the yearly energyc<strong>on</strong>sumpti<strong>on</strong> <strong>of</strong> the distributi<strong>on</strong> area that <strong>on</strong>edistributi<strong>on</strong> transformer feeds).PT (TIEPI, ENS, excluding LV)NO (ENS, excluding LV: _ 1kV)LV (number <strong>of</strong> interrupti<strong>on</strong>s), PL (no indicators)9<str<strong>on</strong>g>Third</str<strong>on</strong>g> <str<strong>on</strong>g>Benchmarking</str<strong>on</strong>g> <str<strong>on</strong>g>Report</str<strong>on</strong>g> <strong>on</strong> <strong>Quality</strong> <strong>of</strong> <strong>Electricity</strong> <strong>Supply</strong> – 2005 · Chapter 1
1.6.1 Weighting methods used for c<strong>on</strong>tinuity indicatorsThere are a number <strong>of</strong> ways <strong>of</strong> calculating c<strong>on</strong>tinuity indicators, Table 1.3 shows which countriesuse which method.TABLE 1.3WEIGHTING METHODS USED FOR CONTINUITY INDICATORSUSERBelgium-Wall<strong>on</strong>ia, Czech Republic (from January 2007) Est<strong>on</strong>ia, France (LV andT networks), Great Britain, Hungary, Ireland, Italy, Lithuania, Portugal, Sweden,TRANSFORMERPOWERN<strong>on</strong>e used/no answerFinland 10 , NorwayAustria (MV-networks, MV/MV, MV/LV), Czech Republic (until January 2007),France (MV networks), SpainBelgium, Greece, Latvia, Netherlands, Slovenia, PolandAs can be seen from the table, user is the most comm<strong>on</strong> method for weighting c<strong>on</strong>tinuity indicators.Each method has its merits and drawbacks some <strong>of</strong> which are illustrated in Table 1.4:TABLE 1.4MERITS AND DRAWBACKS OF ALTERNATIVE WEIGHTINGMETHODSMethod Merits DrawbacksUserTransformerPowerPlaces greater emphasis <strong>on</strong> domesticcustomers, who are less likely to beable to protect themselvesSimpler to useMore robust, as there is not the needto make assumpti<strong>on</strong>s about demandfrom different groups <strong>of</strong> customersSimplifies the reporting scheme and iscompatible with the financial incentiveregulati<strong>on</strong> in place.Takes into account the costs <strong>of</strong> largerusers. Network operators in a positi<strong>on</strong>to take such risks <strong>on</strong> board whenmaking their investment decisi<strong>on</strong>s.Does not take into account the costs <strong>of</strong>larger users, therefore more <strong>of</strong> the riskmay fall <strong>on</strong> larger customers ratherthan <strong>on</strong> network operators. Networkoperators do not take such risks <strong>on</strong>board when making their investmentdecisi<strong>on</strong>s.Does not describe the power qualityvery well and does not take account <strong>of</strong>the fact that transformer districts can bedifferent (by energy c<strong>on</strong>sumpti<strong>on</strong> and bythe number <strong>of</strong> customers c<strong>on</strong>nected).Domestic customers carry a smallerweight and may therefore be exposedto more risk. Assumpti<strong>on</strong>s regarding thedemand <strong>of</strong> different customer groupsare required.In some cases the regulator collects informati<strong>on</strong> about not <strong>on</strong>ly average values but also thedistributi<strong>on</strong> <strong>of</strong> customers per number <strong>of</strong> interrupti<strong>on</strong>s (see additi<strong>on</strong>al informati<strong>on</strong> 1.2.).10In Finland the indicator is based <strong>on</strong> transformer district and is not weighted in any way.10Council <strong>of</strong> European Energy Regulators – Ref: C05-QOS-01-03
ADDITIONAL INFORMATION 1.2 – DATA ON SHORT INTERRUPTIONSThe frequency <strong>of</strong> short interrupti<strong>on</strong>s (between 1” and 3’) is not available to the French regulator fordistributi<strong>on</strong> networks. However, other data are available. The distributi<strong>on</strong> company reports howmany customers (in percentage) had between 0 and 5 short interrupti<strong>on</strong>s during the year, howmany customers had between 6 and 10 short interrupti<strong>on</strong>s during the year, how many between 11and 15, 16 and 20, 21 and 25, 26 and 30, and more than 30 short interrupti<strong>on</strong>s during the year.This informati<strong>on</strong> is collected for both MV and LV customers. Italy adopts a similar approach, as distributi<strong>on</strong>companies are required to give the Regulator, each year, data <strong>on</strong> the worst-served customersin the following format (the thresholds for number <strong>of</strong> l<strong>on</strong>g and short interrupti<strong>on</strong>s varyaccording to the type <strong>of</strong> territory; the example refers to urban districts).Example <strong>of</strong> format for worst-served analysis used in Italy (urban districts)Up to 1 l<strong>on</strong>ginterr/year2 l<strong>on</strong>ginterr/year3 l<strong>on</strong>ginterr/year4 l<strong>on</strong>ginterr/year5 or more l<strong>on</strong>ginterr/yearTotalUp to 1 shortinterr/year2 or 3 shortinterr/year4 or 5 shortinterr/year6 or more shortinterr/yearTotalC<strong>on</strong>tinuity indicators regarding planned interrupti<strong>on</strong>s (annual frequency and durati<strong>on</strong> per customer) are available frommost <strong>of</strong> the countries surveyed, with the excepti<strong>on</strong> <strong>of</strong> Poland and Latvia. Indicators for the Czech Republic will beavailable beginning in 2007. In Est<strong>on</strong>ia, although planned interrupti<strong>on</strong>s are recorded, indicators <strong>of</strong> averagefrequency and durati<strong>on</strong> are not available. France has <strong>on</strong>ly an indicator <strong>of</strong> average durati<strong>on</strong> per c<strong>on</strong>sumer, in Norwaythe informati<strong>on</strong> is <strong>on</strong> the ENS per MV transformer, and Spain uses TIEPI as an indicator for planned interrupti<strong>on</strong>s.The regulators have established rules for the timing <strong>of</strong> the advance notice to be given for a planned interrupti<strong>on</strong> <strong>on</strong>ly inapproximately half <strong>of</strong> the countries surveyed (Austria, Belgium (Wall<strong>on</strong>ia), Czech Republic, Est<strong>on</strong>ia, Hungary, Ireland,Italy, Portugal, Spain and Great Britain) (as set out in Annex 2, planned interrupti<strong>on</strong>s rules). This varies between 1 day(in Italy and Spain) and 15 days (in Czech Republic). In most <strong>of</strong> these countries the procedure for notificati<strong>on</strong> is notindicated: in Ireland the notificati<strong>on</strong> must be by mail, and in Spain by any verifiable means to customers above 1 kV,and by advertising posters placed in visible spots with regard to all other c<strong>on</strong>sumers and by means <strong>of</strong> two <strong>of</strong> the mostwidely circulated printed media in the province; in all other countries the procedure is <strong>on</strong>ly indicative or left to thecompanies (newspaper, websites, newsletters are all acceptable means <strong>of</strong> communicati<strong>on</strong>).In the other half <strong>of</strong> the surveyed countries different situati<strong>on</strong>s are found: in Finland, Norway and Sweden the <strong>on</strong>ly ruleis to give an advance warning that enable c<strong>on</strong>sumers to be prepared; in France the matter is regulated in detail byc<strong>on</strong>tractual agreements; in Hungary the regulator approves the procedures established by the companies; in Lithuaniathe matter is regulated by the Ministry <strong>of</strong> Ec<strong>on</strong>omy; in Greece, Latvia, and Slovenia the regulators have not addressedthe subject yet.11<str<strong>on</strong>g>Third</str<strong>on</strong>g> <str<strong>on</strong>g>Benchmarking</str<strong>on</strong>g> <str<strong>on</strong>g>Report</str<strong>on</strong>g> <strong>on</strong> <strong>Quality</strong> <strong>of</strong> <strong>Electricity</strong> <strong>Supply</strong> – 2005 · Chapter 1
ADDITIONAL INFORMATION 1.3 – NOTICE TO CONSUMERSIn Italy the minimum time for notice is 24 hours in advance, otherwise the interrupti<strong>on</strong>s must bec<strong>on</strong>sidered as unplanned. Should the planned interrupti<strong>on</strong> start before the notified timetable (morethan 5 minutes in advance), it must be c<strong>on</strong>sidered as unplanned. Should the planned interrupti<strong>on</strong>last l<strong>on</strong>ger than notified, the extra durati<strong>on</strong> must be c<strong>on</strong>sidered as unplanned.In Portugal the Commercial Relati<strong>on</strong>s Code, published by ERSE, establishes rules about the noticeto the customer according to the reas<strong>on</strong>s <strong>of</strong> interrupti<strong>on</strong>:· Interrupti<strong>on</strong>s for reas<strong>on</strong>s <strong>of</strong> public interest: the entity resp<strong>on</strong>sible for the network must inform,whenever possible, and with a minimum prior notice <strong>of</strong> thirty-six hours, the customers which maybe affected by the interrupti<strong>on</strong>.· Interrupti<strong>on</strong>s for service reas<strong>on</strong>s: the entity resp<strong>on</strong>sible for the network has the duty to minimisethe impact <strong>of</strong> the interrupti<strong>on</strong>s am<strong>on</strong>g customers. For this purpose, distributors may agree withthe clients that will be affected the best moment for the interrupti<strong>on</strong>. If the agreement is not possible,the interrupti<strong>on</strong>s must occur, preferentially, <strong>on</strong> Sundays, between 05:00 hours and 15:00hours, with a maximum durati<strong>on</strong> <strong>of</strong> eight hours per interrupti<strong>on</strong> and five Sundays per year, percustomer affected. The entity resp<strong>on</strong>sible for the network must inform with a minimum priornotice <strong>of</strong> thirty-six hours.· Interrupti<strong>on</strong>s due to customer resp<strong>on</strong>sibility: The supply interrupti<strong>on</strong> may <strong>on</strong>ly take place following8 days’ noticeNote that in Great Britain an interrupti<strong>on</strong> is treated as planned provided that the start <strong>of</strong> the interrupti<strong>on</strong>is within the period <strong>of</strong> interrupti<strong>on</strong> stated <strong>on</strong> the notice to the customers.Most <strong>of</strong> the countries collect c<strong>on</strong>tinuity indicators for the transmissi<strong>on</strong> system, with the excepti<strong>on</strong><strong>of</strong> Austria, Est<strong>on</strong>ia, Greece, Latvia, and Slovenia. The most comm<strong>on</strong> indicators used for transmissi<strong>on</strong>are listed in Table 1.5.TABLE 1.5CONTINUITY INDICATORS FOR TRANSMISSIONEnergy not supplied (ENS)Average interr. time (AIT)SAIDI at T-levelSAIFI at T-levelOther indicatorsN<strong>on</strong>eFI, FR, HU, IE, IT, LT (from 2006), PL, PT, ES, SE, GB, NOBE, FR, IT, LT (from 2006), PL, PT, ES, SECZ, FR, PT, NO (from 2006)CZ, FR, PT, IT, NO (from 2006)total time <strong>of</strong> interrupti<strong>on</strong>: CZ, HUMAIFI: FR, IToutage rate: HUnumb. <strong>of</strong> incidents: IE, HU, SE, GBAT, EE, GR, LV, SI12Council <strong>of</strong> European Energy Regulators – Ref: C05-QOS-01-03
1.6.2 Rules for recording l<strong>on</strong>g interrupti<strong>on</strong>sIt clearly emerges from the survey that the majority <strong>of</strong> the regulators have not established orapproved rules for recording interrupti<strong>on</strong>s. There are <strong>on</strong>ly eight countries out <strong>of</strong> 20 surveyedwhere recording protocols are in place (Italy, Czech Republic, Norway, Portugal, Spain, Hungary,Great Britain, Sweden). These protocols address issues such as identificati<strong>on</strong> <strong>of</strong> interrupti<strong>on</strong>s,technology employed, assessment <strong>of</strong> the number <strong>of</strong> c<strong>on</strong>sumers affected, and definiti<strong>on</strong> <strong>of</strong> interrupti<strong>on</strong>causes (in general including that <strong>of</strong> force majeure). In Italy, Spain, Great Britain, Hungary,and Portugal the recording protocol was set by the regulator. In Norway the protocol (FASIT) wasdeveloped by a branch organizati<strong>on</strong> and is referred to by the regulator. Sweden has guidelines forthe calculati<strong>on</strong> <strong>of</strong> SAIDI and SAIFI.It is relevant to note that all the eight countries cited above have introduced standards and/or incentive/penaltiesregimes linked to the number and/or the durati<strong>on</strong> <strong>of</strong> l<strong>on</strong>g interrupti<strong>on</strong>s and/or energynot supplied. The rules for recording l<strong>on</strong>g interrupti<strong>on</strong>s are, in fact, the basis <strong>of</strong> these regulatory provisi<strong>on</strong>s:they ensure that all interrupti<strong>on</strong>s are recorded, and that the recording methodology is homogeneousacross the country. This enables a fair and correct implementati<strong>on</strong> <strong>of</strong> the financial incentiveschemes. Hence, it is <strong>of</strong> c<strong>on</strong>cern that Ireland, having adopted an incentive and penalty regimestates that no recording protocol has been implemented.Recording rules establish an obligati<strong>on</strong> for all (or at least all the major) companies to register c<strong>on</strong>tinuitydata. Sec<strong>on</strong>dly, they indicate which data are required for a correct identificati<strong>on</strong> <strong>of</strong> an incident.Usually these include the time interval <strong>of</strong> the supply interrupti<strong>on</strong>, its cause, the network device whereit originated, the affected installati<strong>on</strong>s and the number <strong>of</strong> c<strong>on</strong>sumers involved.One <strong>of</strong> the most relevant issues is the logging <strong>of</strong> incidents. Depending <strong>on</strong> the available technology<strong>on</strong> the network an incident is logged when i) a customer (or other pers<strong>on</strong>) first c<strong>on</strong>tacts thecompany to advise <strong>of</strong> no-supply, an abnormality or suspected abnormality; ii) there is an alarm <strong>on</strong>SCADA indicating a loss <strong>of</strong> supply, abnormality or suspected abnormality; or iii) an employee oragent identified the existence <strong>of</strong> a loss <strong>of</strong> supply, abnormality or suspected abnormality. There isusually no obligati<strong>on</strong> <strong>of</strong> automatic logging <strong>of</strong> the incidents, but, for instance, regulators in Italy andPortugal explicitly require companies to remotely c<strong>on</strong>trol the whole HV and MV distributi<strong>on</strong> networks(for each HV and MV feeder).A sec<strong>on</strong>d issue is the identificati<strong>on</strong> <strong>of</strong> the c<strong>on</strong>sumers affected by the interrupti<strong>on</strong>. Norway Portugaland Great Britain (see Additi<strong>on</strong>al Informati<strong>on</strong> 1.4) require companies to integrate the customerinformati<strong>on</strong> database with the topology <strong>of</strong> the network (c<strong>on</strong>nectivity model). At the present time Italy(see Additi<strong>on</strong>al Informati<strong>on</strong> 1.5) and Spain have rules for estimating the number <strong>of</strong> LV c<strong>on</strong>sumersinvolved in an interrupti<strong>on</strong>; however, both countries are requiring companies to be able to identifysingle customers in a few years time (in Spain the process is expected to be completed by 200611In Norway data recordings are referred to delivery points. A delivery point is a medium or high-voltage end-user or a distributi<strong>on</strong>transformer. In total 121 600 points.13<str<strong>on</strong>g>Third</str<strong>on</strong>g> <str<strong>on</strong>g>Benchmarking</str<strong>on</strong>g> <str<strong>on</strong>g>Report</str<strong>on</strong>g> <strong>on</strong> <strong>Quality</strong> <strong>of</strong> <strong>Electricity</strong> <strong>Supply</strong> – 2005 · Chapter 1
and in Italy the integrati<strong>on</strong> <strong>of</strong> the network informati<strong>on</strong> and the commercial systems has to be completedby the end <strong>of</strong> 2007). Sweden is also investigating the possibility <strong>of</strong> having companies reportinterrupti<strong>on</strong>s at the single customer-level in a few years time.The real possibility to achieve full phase c<strong>on</strong>nectivity (so it will be possible to identify exactly whichcustomers have been interrupted for say a single phase fault) by these dates relies <strong>on</strong> matchingadvanced metering informati<strong>on</strong> with network fault informati<strong>on</strong>.ADDITIONAL INFORMATION 1.4 – CONNECTIVITY MODELAll distributi<strong>on</strong> companies in GB were required to put in place a c<strong>on</strong>nectivity model associating customersto the outgoing LV feeder from the distributi<strong>on</strong> substati<strong>on</strong> from 1 April 2002. Companies arenot required to have phase c<strong>on</strong>nectivity. The number <strong>of</strong> customers affected will therefore be based<strong>on</strong> actual customer numbers for MV faults and faults that affect all LV phases. The number <strong>of</strong> customersinterrupted for single-phase and two-phase LV incidents is calculated <strong>on</strong> a pro rata basis,i.e. 1/3 or 2/3 <strong>of</strong> the total number <strong>of</strong> customers c<strong>on</strong>nected to the LV circuit, or part <strong>of</strong> circuit, affected.Customers with a three-phase LV supply (where these can be identified) are c<strong>on</strong>sidered to beinterrupted when supply is interrupted to <strong>on</strong>e or more <strong>of</strong> the three phases.ADDITIONAL INFORMATION 1.5 – ESTIMATE THE NUMBER OF LV CONSUMERSIn Italy remote c<strong>on</strong>trol device for automatic logging <strong>of</strong> interrupti<strong>on</strong>s (SCADA) is requested <strong>on</strong> everyHV and MV line. Distributi<strong>on</strong> companies must know and record the actual network c<strong>on</strong>figurati<strong>on</strong> atthe time <strong>of</strong> each l<strong>on</strong>g interrupti<strong>on</strong>. This allows companies and the regulator to know the exact list<strong>of</strong> MV customers and MV/LV transformers affected by each l<strong>on</strong>g interrupti<strong>on</strong>.Only a few distributi<strong>on</strong> companies are able to know exactly the LV customers affected by eachinterrupti<strong>on</strong>. In order to estimate <strong>of</strong> the number <strong>of</strong> LV users affected in each interrupti<strong>on</strong>, until 2007an averaging method is permitted: a) for interrupti<strong>on</strong>s with origin in the HV or MV network: number<strong>of</strong> LV users affected = number <strong>of</strong> MV/LV transformer affected multiplied by the ratio LV users perMV/LV transformer (calculated at municipality level, taking account <strong>of</strong> different areas); b) For interrupti<strong>on</strong>swith origin in the LV network: number <strong>of</strong> LV users affected = number <strong>of</strong> LV lines affectedmultiplied by the ratio LV users per LV line (calculated at municipality level, taking account <strong>of</strong> differentareas). The same rule is used by distributi<strong>on</strong> companies in the Czech Republic.Finally, with regard to the causes <strong>of</strong> interrupti<strong>on</strong>s three main approaches were found. In Swedeninterrupti<strong>on</strong>s are not classified by cause and all incidents are included in the incentive/penaltyregime (in Norway causes <strong>of</strong> interrupti<strong>on</strong>s are identified, but all incidents are included in the incentivepenalty/regime). In Italy, Portugal, and Spain, the rules for classificati<strong>on</strong> aim to identify thoseinterrupti<strong>on</strong>s that are not attributable to the distributor and to exclude them from theincentive/penalty regime. Exclusi<strong>on</strong>s typically include interrupti<strong>on</strong>s caused by the generati<strong>on</strong> andtransmissi<strong>on</strong> systems, by other distributors, by third parties, as well as interrupti<strong>on</strong>s due to forcemajeure (see Annex 2 – Force majeure). In Great Britain, interrupti<strong>on</strong>s are not separated by14Council <strong>of</strong> European Energy Regulators – Ref: C05-QOS-01-03
cause, however, Ofgem has defined a mechanism which allows companies to ask for the impact<strong>of</strong> a small number <strong>of</strong> excepti<strong>on</strong>al events to be excluded from their performance (see Additi<strong>on</strong>alInformati<strong>on</strong> 1.6). Similarly, in Hungary and in the Czech Republic excepti<strong>on</strong>al events can be recognizedby a public authority.ADDITIONAL INFORMATION 1.6 – IDENTIFYING EXCEPTIONAL EVENTSIn Great Britain distributi<strong>on</strong> companies must make a claim within 14 days <strong>of</strong> the end <strong>of</strong> an excepti<strong>on</strong>alevent. For event to be eligible it must satisfy certain thresholds.1.1 Severe weather c<strong>on</strong>diti<strong>on</strong>sA weather event is classed as excepti<strong>on</strong>al if it causes 8 or more times the daily mean number <strong>of</strong>faults at higher voltage (i.e. at MV and above) in a 24 hour period. The full audited impact <strong>of</strong> theevent is then excluded under the interrupti<strong>on</strong> incentive scheme.The restorati<strong>on</strong> performance is then separately incentivised under the guaranteed standard forsupply restorati<strong>on</strong> in severe weather.1.2 Other eventsOther types <strong>of</strong> event will <strong>on</strong>ly be eligible for adjustment if they are outside the companies’ c<strong>on</strong>troland caused by some external factor. For example, this includes third-party damage such as vandalismor terrorism but would not include a failure <strong>of</strong> protecti<strong>on</strong> equipment or a fire at a substati<strong>on</strong>.Only interrupti<strong>on</strong>s above the following absolute thresholds are excluded from the performance:· 25,000 customers affected (approx 1.5 CI for an average company)2 milli<strong>on</strong> customer minutes lost (approx 1 CML)·For other events Ofgem’s auditors will review the extent to which the company has taken appropriatemitigating acti<strong>on</strong>s. If the company has performed appropriately the full impact above thethreshold will be removed. Otherwise a reduced adjustment will be applied.In additi<strong>on</strong> to the eight countries menti<strong>on</strong>ed above that have full recording protocols, there isanother group <strong>of</strong> five countries (Belgium-Wall<strong>on</strong>ia, Est<strong>on</strong>ia, Finland, France, and Lithuania) wherea definiti<strong>on</strong> is given in the regulati<strong>on</strong>s, <strong>of</strong> circumstances where the company is not c<strong>on</strong>sideredresp<strong>on</strong>sible for the interrupti<strong>on</strong> (see Annex 2 – Force Majeure). It is important to note that thesecountries have all introduced c<strong>on</strong>tinuity standards (at single customer level) and therefore needexclusi<strong>on</strong>s where an event is outside the company’s c<strong>on</strong>trol.Finally it should be noted that in Belgium-Wall<strong>on</strong>ia, Finland, Lithuania, and France interrupti<strong>on</strong>s arerecorded with an indicati<strong>on</strong> <strong>of</strong> causes. In Lithuania, where the regulator had already planned, whendefining the causes <strong>of</strong> interrupti<strong>on</strong>, to introduce an incentive/penalty scheme in the near future, theattributi<strong>on</strong> <strong>of</strong> resp<strong>on</strong>sibility is taken into account; in the other countries <strong>of</strong> this latter group the list <strong>of</strong>causes is mostly technical and does not necessarily identify the resp<strong>on</strong>sible party.15<str<strong>on</strong>g>Third</str<strong>on</strong>g> <str<strong>on</strong>g>Benchmarking</str<strong>on</strong>g> <str<strong>on</strong>g>Report</str<strong>on</strong>g> <strong>on</strong> <strong>Quality</strong> <strong>of</strong> <strong>Electricity</strong> <strong>Supply</strong> – 2005 · Chapter 1
1.6.3 Rules for recording short interrupti<strong>on</strong>sAs menti<strong>on</strong>ed above, Finland, France, Great Britain, Hungary, Italy and Norway (since 2005)m<strong>on</strong>itor short interrupti<strong>on</strong>s. Am<strong>on</strong>g them, <strong>on</strong>ly Hungary and Italy count separately transient andshort interrupti<strong>on</strong>s and in France transients are not recorded.Short interrupti<strong>on</strong>s derive from the presence <strong>on</strong> the network <strong>of</strong> reclosers, that generally are remotelyc<strong>on</strong>trolled. A recloser attempts to clear a fault in a short time, or it is remotely activated by pers<strong>on</strong>nel.Hence, the number <strong>of</strong> short interrupti<strong>on</strong>s is calculated, where possible, from SCADA informati<strong>on</strong>.Where this is not available companies may use counter readings <strong>on</strong> reclosing devices. Inthe case <strong>of</strong> multi-shot reclosing schemes, <strong>on</strong>ly <strong>on</strong>e short interrupti<strong>on</strong> is counted where the successfulrestorati<strong>on</strong> is achieved by a sequence <strong>of</strong> multiple operati<strong>on</strong>s in less than three minutes.France, Great Britain, and Italy addressed an important matter in the questi<strong>on</strong>naire: how the number<strong>of</strong> users affected by this type <strong>of</strong> interrupti<strong>on</strong>s is assessed. In France, for MV networks, shortinterrupti<strong>on</strong>s are automatically measured for each customer with remote c<strong>on</strong>trol systems. For LVnetworks, operators estimate the number <strong>of</strong> users affected by measuring short interrupti<strong>on</strong>s at everyinterface between MV and LV networks (LV substati<strong>on</strong>). When an interrupti<strong>on</strong> occurs at a certainLV substati<strong>on</strong>, every customer c<strong>on</strong>nected to this substati<strong>on</strong> may be affected. In Great Britain thenumber <strong>of</strong> customers interrupted is identified in the same way as for l<strong>on</strong>g interrupti<strong>on</strong>s (seeAdditi<strong>on</strong>al Informati<strong>on</strong> 1.4). If a company uses periodic counts <strong>of</strong> recloser operati<strong>on</strong>s to calculatethe number <strong>of</strong> short interrupti<strong>on</strong>s, the number <strong>of</strong> customers interrupted will be based <strong>on</strong> an estimate<strong>of</strong> those customers who would have been interrupted if the circuit was c<strong>on</strong>figured normally. InItaly, distributi<strong>on</strong> companies are required (by 2006) to know the exact list <strong>of</strong> MV users affected byeach short interrupti<strong>on</strong> using the actual network c<strong>on</strong>figurati<strong>on</strong> at the time <strong>of</strong> the interrupti<strong>on</strong>.Such measurements are particularly important in France, the <strong>on</strong>ly country where a standard forthe maximum yearly number <strong>of</strong> short unplanned interrupti<strong>on</strong>s applies (to MV c<strong>on</strong>sumers <strong>on</strong>ly).ADDITIONAL INFORMATION 1.7 – RULES FOR SEQUENCES OF INTERRUPTIONSMeaningful attenti<strong>on</strong> must be paid to interrupti<strong>on</strong> sequences, as different rules are used inEU countries. As regards short interrupti<strong>on</strong>s, for instance:· in Great Britain it is required to record short interrupti<strong>on</strong>s which follow l<strong>on</strong>g interrupti<strong>on</strong>s <strong>on</strong>ly ifthe time between the end <strong>of</strong> the l<strong>on</strong>g interrupti<strong>on</strong> and the start <strong>of</strong> the short interrupti<strong>on</strong> lasts morethan three hours; short interrupti<strong>on</strong>s occurring for some customers during a l<strong>on</strong>g interrupti<strong>on</strong> forother customers <strong>on</strong> the same circuit are not counted. Short interrupti<strong>on</strong>s which precede l<strong>on</strong>ginterrupti<strong>on</strong>s must be recorded as separate interrupti<strong>on</strong>s,· In Italy short interrupti<strong>on</strong>s are always recorded, if there are more than three minutes from theprevious interrupti<strong>on</strong> (short or l<strong>on</strong>g). Interrupti<strong>on</strong>s occurring to different customers <strong>on</strong> the samecircuit can have different durati<strong>on</strong> and are classified as l<strong>on</strong>g or short using each single customerviewpoint.16Council <strong>of</strong> European Energy Regulators – Ref: C05-QOS-01-03
·In France short interrupti<strong>on</strong>s occurring due to rec<strong>on</strong>figurati<strong>on</strong> manoeuvres within 1 hour from thebeginning <strong>of</strong> a l<strong>on</strong>g interrupti<strong>on</strong> are not counted; moreover, short interrupti<strong>on</strong>s resulting fromprotecti<strong>on</strong>s and automatic mechanisms and preceding at maximum 2 minutes a l<strong>on</strong>g or shortinterrupti<strong>on</strong> are not counted.It’s evident that these rules do hinder a real comparis<strong>on</strong> am<strong>on</strong>g EU countries as regardsshort interrupti<strong>on</strong>s.1.6.4 Audits <strong>on</strong> data collectedThe survey shows that fewer than half <strong>of</strong> the surveyed countries regularly c<strong>on</strong>duct audits <strong>on</strong> c<strong>on</strong>tinuitydata provided by the companies (Italy, Hungary, Norway, Great Britain, Portugal, Spain,and France). It is worth noticing that countries where standards and/or incentive/penalty regimesare in place usually carry out audits <strong>on</strong> informati<strong>on</strong> provided by the companies (the <strong>on</strong>ly excepti<strong>on</strong>sbeing Ireland and Sweden). France is the sole country where auditing <strong>of</strong> c<strong>on</strong>tinuity data hasbeen implemented even if there is no incentive/penalty regime.As is shown in Table 1.3, a number <strong>of</strong> countries seem interested in implementing audit procedures(am<strong>on</strong>g them Belgium-Wall<strong>on</strong>ia, Lithuania, and Poland).Audits can be c<strong>on</strong>ducted by different authorities: by the regulator (Italy, Hungary, and Norway), byc<strong>on</strong>sultants <strong>on</strong> behalf <strong>of</strong> the regulator (Great Britain), by companies <strong>on</strong> the basis <strong>of</strong> an obligati<strong>on</strong>set by the regulator (Portugal and Spain – but eventually the regulator himself can c<strong>on</strong>ductaudits), by owners <strong>of</strong> the c<strong>on</strong>cessi<strong>on</strong> (France). Implementati<strong>on</strong> <strong>of</strong> the audits can vary significantlyacross these countries (see Additi<strong>on</strong>al Informati<strong>on</strong> 1.8).TABLE 1.3By regulatorAUDITS ON DISTRIBUTION CONTINUITY DATAIT, HU, NOBy c<strong>on</strong>sultants <strong>on</strong> behalf <strong>of</strong> the regulatorBy companiesBy c<strong>on</strong>sultants <strong>on</strong> behalf <strong>of</strong> the companiesBy other subjectsInterested in implementing auditingNo auditsGBPTES (could also be examined by the regulator)FR (owners <strong>of</strong> the c<strong>on</strong>cessi<strong>on</strong>)BE, LT, POAT, CZ, EE, FI, GR, IE, LV, SI, SE17<str<strong>on</strong>g>Third</str<strong>on</strong>g> <str<strong>on</strong>g>Benchmarking</str<strong>on</strong>g> <str<strong>on</strong>g>Report</str<strong>on</strong>g> <strong>on</strong> <strong>Quality</strong> <strong>of</strong> <strong>Electricity</strong> <strong>Supply</strong> – 2005 · Chapter 1
ADDITIONAL INFORMATION 1.8 – AUDITS ON CONTINUITY DATAIn Italy the regulator determines the measurement rules and checks measurement procedures bymeans <strong>of</strong> randomly selected inspecti<strong>on</strong>s <strong>of</strong> interrupti<strong>on</strong>s (the sites to inspect are strategicallyselected). Audit results are used to validate data provided by the distributors. In case <strong>of</strong> inadequaterecording <strong>of</strong> interrupti<strong>on</strong>s, c<strong>on</strong>tinuity data are re-calculated and so are penalties and incentives; inparticular, incentives, where still due, are halved. Administrative financial sancti<strong>on</strong>s are foreseen fordistributors that provide false data. All regulated companies are inspected at least <strong>on</strong>ce every fouryears. For Enel, that distributes to the 85% <strong>of</strong> final customers, c<strong>on</strong>trols are d<strong>on</strong>e separately foreach <strong>of</strong> the 29 SCADA operating centres in the country.In Hungary the regulator has defined a procedure for sampling data for audits and has been auditingthe 6 distributi<strong>on</strong> companies at least twice per year.In Norway the regulator c<strong>on</strong>trols a sample <strong>of</strong> the data and the recording procedures. When errorsare found in either <strong>of</strong> the two, companies are given a deadline by which the data must be correctedand if they fail to meet the deadline they pay a daily fee until they make the required correcti<strong>on</strong>s.In Portugal the regulator can c<strong>on</strong>duct audits whenever he c<strong>on</strong>siders it necessary. In parallel, the<strong>Quality</strong> <strong>of</strong> Service Code requires companies to audit their procedures related to the analysis <strong>of</strong>quality <strong>of</strong> service every two years (the main distributi<strong>on</strong> company has carried out two audits, s<strong>of</strong>ar). The procedure is not standardised and penalties are not applied (however, results <strong>of</strong> theaudits are published).In Spain the procedure for audits has been developed and obliges all companies to have their dataaudited by specialized firms before submissi<strong>on</strong> to the relevant authority. As <strong>of</strong> now the regulatorrequires the company to design the process <strong>of</strong> measurement, transfer, analysis, and storage <strong>of</strong>c<strong>on</strong>tinuity data in such a way that will enable the verificati<strong>on</strong> <strong>of</strong> the entire procedure by a third party.In particular, the Spanish regulator is c<strong>on</strong>cerned about the preservati<strong>on</strong> <strong>of</strong> c<strong>on</strong>fidentiality, integrityand availability <strong>of</strong> the c<strong>on</strong>tinuity data.In Great Britain the regulator has introduced regulatory definiti<strong>on</strong>s and guidance for reporting interrupti<strong>on</strong>sand other quality <strong>of</strong> service data, including minimum levels <strong>of</strong> accuracy companies arerequired to achieve. Audits <strong>on</strong> companies are carried out by c<strong>on</strong>sultants <strong>on</strong> an annual basis tom<strong>on</strong>itor whether the 14 distributi<strong>on</strong> companies are applying the definiti<strong>on</strong>s and whether the accuracylevels have been met. For the procedure see Annex 2 (in progress). If companies fail to meetthe accuracy levels Ofgem adjusts the data to correct for inaccuracy. Ofgem may also carry out aninvestigati<strong>on</strong> and may impose financial penalties taking into account the circumstances and thenature <strong>of</strong> the breach.In France the city, as owner <strong>of</strong> the c<strong>on</strong>cessi<strong>on</strong>, is entitled to carry out audits <strong>on</strong> company data,eventually employing c<strong>on</strong>sultants. There are no procedures set by the regulators <strong>on</strong> the matter, nordata available <strong>on</strong> the number <strong>of</strong> c<strong>on</strong>cessi<strong>on</strong>s audited nor <strong>on</strong> the results <strong>of</strong> the procedures.Sweden is planning to c<strong>on</strong>duct audits <strong>on</strong> c<strong>on</strong>tinuity data provided by the companies in the nearfuture.18Council <strong>of</strong> European Energy Regulators – Ref: C05-QOS-01-03
1.7 AnalysisThe number <strong>of</strong> countries providing informati<strong>on</strong> for the different measures varied from 15 to 4depending <strong>on</strong> the measure in questi<strong>on</strong>. In order to provide for meaningful comparis<strong>on</strong>s a rule <strong>of</strong>thumb was used whereby countries providing 2 or fewer years’ worth <strong>of</strong> data were not included inthe analysis in this chapter but are instead shown in the Annex to this chapter.Care must be taken when comparing countries’ figures not <strong>on</strong>ly because there are a number <strong>of</strong>methods employed for calculating the c<strong>on</strong>tinuity indicators, but also because <strong>of</strong> differences in thescope <strong>of</strong> interrupti<strong>on</strong>s covered, the rules determining how interrupti<strong>on</strong>s are counted and therobustness <strong>of</strong> the data itself. The legends in the charts in this secti<strong>on</strong> attempt to spell out the voltagelevels captured and the informati<strong>on</strong> in Table 1.3 sets out the different weighting methodsemployed by the respective countries.Even where countries employ the same weighting method and their interrupti<strong>on</strong>s data covers thesame voltage levels, differences can still occur. For instance, the Netherlands make no distincti<strong>on</strong>between planned and unplanned interrupti<strong>on</strong>s, therefore when comparing their figures in charts1.2 and 1.5 the reader should take this into account. In Ireland l<strong>on</strong>g interrupti<strong>on</strong>s are all interrupti<strong>on</strong>sgreater than 1 minute, whereas most other countries have adopted the standard practice <strong>of</strong>classifying l<strong>on</strong>g interrupti<strong>on</strong>s as those being 3 minutes or l<strong>on</strong>ger.The remainder <strong>of</strong> this chapter is set out as follows:SAIDIUnplanned not attributable to excepti<strong>on</strong>al eventsUnplannedPlannedSAIFIUnplanned not attributable to excepti<strong>on</strong>al eventsUnplannedPlannedMAIFIEnergy Not SuppliedAverage Interrupti<strong>on</strong> TimeParagraph1.7.11.7.21.7.31.7.41.7.51.7.61.7.71.7.81.7.9Table(s) in Annex3.13.23.33.43.53.63.73.8, 3.9, 3.103.1119<str<strong>on</strong>g>Third</str<strong>on</strong>g> <str<strong>on</strong>g>Benchmarking</str<strong>on</strong>g> <str<strong>on</strong>g>Report</str<strong>on</strong>g> <strong>on</strong> <strong>Quality</strong> <strong>of</strong> <strong>Electricity</strong> <strong>Supply</strong> – 2005 · Chapter 1
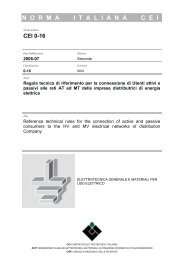
SAIDI1.7.1 Unplanned SAIDI not attributable to excepti<strong>on</strong>al eventsSignificant care needs to be taken when comparing these figures as each country appears tohave its own methodology for determining what c<strong>on</strong>stitutes an excepti<strong>on</strong>al event. The data fromGreat Britain is relatively flat potentially indicating that the exclusi<strong>on</strong> mechanism employed takesout nearly all the volatility from excepti<strong>on</strong>al events, although the British data including excepti<strong>on</strong>alevents was far more stable to begin with. Overall the data indicates there have been very largeimprovements in the durati<strong>on</strong> <strong>of</strong> interrupti<strong>on</strong>s. It appears that m<strong>on</strong>itoring and incentivising interrupti<strong>on</strong>sperformance is having a positive impact <strong>on</strong> performance across Europe, particularly <strong>on</strong>durati<strong>on</strong> but also <strong>on</strong> the number <strong>of</strong> interrupti<strong>on</strong>s.FIG 1.1 UNPLANNED INTERRUPTIONS EXCLUDING EXCEPTIONAL EVENTSMinutes lost per customer per year (1999–2004)450Minutes lost per customer40035030025020015010050Austria HV, MVFrance LVGreat Britain HV, MV, LVItaly HV, MV, LVIreland HV, MV, LVPortugal HV, MV, LVSpain HV, MV, LV01999 2000 2001 2002 2003 2004Year1.7.2 Unplanned SAIDIThe durati<strong>on</strong> <strong>of</strong> interrupti<strong>on</strong>s during the year is a key indicator <strong>of</strong> the quality <strong>of</strong> service that electricitycustomers receive. The length <strong>of</strong> an interrupti<strong>on</strong> can be influenced by a variety <strong>of</strong> factorssuch as, the level <strong>of</strong> interc<strong>on</strong>nectivity <strong>on</strong> the network, the voltage at which the interrupti<strong>on</strong>occurred, the distance to the fault, the accessibility <strong>of</strong> the fault etc. Most countries calculate thismeasure based <strong>on</strong> users and the graph below shows performance from 1999 to 2004. For mostcountries there is a downward trend in the durati<strong>on</strong> <strong>of</strong> interrupti<strong>on</strong>s. However for a small number<strong>of</strong> countries the data is too volatile to identify any clear trends. One potential reas<strong>on</strong> for the significantvolatility is the impact <strong>of</strong> excepti<strong>on</strong>al events <strong>on</strong> performance.20Council <strong>of</strong> European Energy Regulators – Ref: C05-QOS-01-03
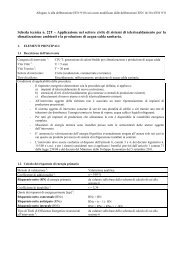
the planned durati<strong>on</strong> and interrupti<strong>on</strong> figures, as many network operators now employ techniqueswhich enable them to work <strong>on</strong> networks whilst they are still live, therefore avoiding interrupti<strong>on</strong>sand minutes lost.FIG 1.6 PLANNED INTERRUPTIONS Interrupti<strong>on</strong>s per customer per year (1999 – 2004)1.81.6Austria HV, MVFinland HV, MV, LVInterrupti<strong>on</strong>s per customer1.41.21.00.80.60.40.201999 2000 2001 2002 2003 2004YearFrance LVGreat Britain HV, MV, LVHungary HV, MVItaly HV, MV, LVIreland HV, MV, LVPortugal HV, MV, LVSpain HV, MV, LVSweden HV, MV, LV1.7.7 Unplanned MAIFISome countries make no distincti<strong>on</strong> between l<strong>on</strong>g and short interrupti<strong>on</strong>s and others do not collectany informati<strong>on</strong> <strong>on</strong> interrupti<strong>on</strong>s lasting less than 3 minutes. Additi<strong>on</strong>ally, not all countries differentiatebetween interrupti<strong>on</strong>s lasting less than <strong>on</strong>e sec<strong>on</strong>d, known as transient interrupti<strong>on</strong>s,and those lasting l<strong>on</strong>ger than 1 sec<strong>on</strong>d and less than 3 minutes. The number <strong>of</strong> short interrupti<strong>on</strong>scan in certain instances give network operators advanced warning <strong>of</strong> developing problems whichthey can then address before they turn into l<strong>on</strong>g interrupti<strong>on</strong>s. As network operators invest in moreautomati<strong>on</strong> and remote c<strong>on</strong>trol it is likely that the number <strong>of</strong> short interrupti<strong>on</strong>s will increase. Itmay be that in the future customers demand limits <strong>on</strong> the number <strong>of</strong> repeat short interrupti<strong>on</strong>s anda number <strong>of</strong> countries feel it is useful to keep track <strong>of</strong> this informati<strong>on</strong> at this time.Hungarian data for 2003 and 2004 is shown in Table 3.7 in the Annex and this shows the totalnumber <strong>of</strong> short interrupti<strong>on</strong>s per customer excluding excepti<strong>on</strong>al events. Hungary splits shortinterrupti<strong>on</strong>s into transients (less than 1 sec<strong>on</strong>d) and all other short interrupti<strong>on</strong>s (1 sec<strong>on</strong>d to lessthan 3 minutes) but has found the data to be unreliable and has begun a project to ensure c<strong>on</strong>sistentshort interrupti<strong>on</strong>s data from 2006.As explained in additi<strong>on</strong>al informati<strong>on</strong> 1.7, the different rules for the sequences <strong>of</strong> interrupti<strong>on</strong>sused in the countries that report short interrupti<strong>on</strong>s make the comparis<strong>on</strong> <strong>of</strong> such data hard to bemeaningful.24Council <strong>of</strong> European Energy Regulators – Ref: C05-QOS-01-03
FIG 1.7 UNPLANNED INTERRUPTIONS Short interrupti<strong>on</strong>s per customer per year (1999 – 2004)7Short interrupti<strong>on</strong>s per customer654321Finland HV, MV, LVFrance LVGreat Britain HV, MV, LVItaly HV, MV, LV01999 2000 2001 2002 2003 2004Year1.7.8 <strong>Electricity</strong> Not Supplied (ENS)The level <strong>of</strong> electricity not supplied gives an indicati<strong>on</strong> <strong>of</strong> the overall robustness <strong>of</strong> a country’selectricity networks. For most countries the informati<strong>on</strong> relates to transmissi<strong>on</strong> networks <strong>on</strong>ly,although there are some countries such as Italy, where the ENS and AIT informati<strong>on</strong> includes datafrom interrupti<strong>on</strong>s at distributi<strong>on</strong> high voltage. Given that all other things being equal, a larger systemwould tend to record more energy not supplied than a smaller system, the informati<strong>on</strong> <strong>on</strong>ENS is presented as energy not supplied as a percentage <strong>of</strong> the total energy supplied by that systemin a given year.FIG 1.8 ENS AS A PERCENTAGE OF DISTRIBUTED ENERGY (1999 – 2004)0.010%Percentage <strong>of</strong> energy not distributed0.009%0.008%0.007%0.006%0.005%0.004%0.003%0.002%0.001%01999 2000 2001 2002 2003 2004YearFinlandFranceGreat BritainHungaryItalyNorwayPortugalSpainSweden25<str<strong>on</strong>g>Third</str<strong>on</strong>g> <str<strong>on</strong>g>Benchmarking</str<strong>on</strong>g> <str<strong>on</strong>g>Report</str<strong>on</strong>g> <strong>on</strong> <strong>Quality</strong> <strong>of</strong> <strong>Electricity</strong> <strong>Supply</strong> – 2005 · Chapter 1
1.7.9 AIT (Transmissi<strong>on</strong>)Transmissi<strong>on</strong> networks are generally designed to higher standards than distributi<strong>on</strong> networks andas a result faults taking customers <strong>of</strong>f supply are relatively infrequent. However, when there areinterrupti<strong>on</strong>s <strong>on</strong> the transmissi<strong>on</strong> they tend to result in large numbers <strong>of</strong> customers being <strong>of</strong>f supplyand high values for energy not supplied. Figs 1.6 and 1.7 illustrate this clearly, with most countriesshowing average AIT below 10 minutes lost per year but a number <strong>of</strong> countries experiencingpeaks two, three or even five times this level. Such peaks <strong>of</strong>ten make headline news internati<strong>on</strong>allyas well as nati<strong>on</strong>ally, as was the case in the transmissi<strong>on</strong> outages in L<strong>on</strong>d<strong>on</strong> and Birminghamin Great Britain in 2003, the blackouts and load shedding in Italy in 2003 and the transmissi<strong>on</strong> outagein southern Sweden in 2003. The peaks in AIT are generally mirrored by those in ENS,although the percentage change generated in Portugal for AIT in 2000 was higher than that forENS, whilst in Spain the percentage ENS in 2001 was greater than the percentage change in AIT.FIG 1.9 AIT (1999 – 2004)AIT – Minutes lost per year – Transmissi<strong>on</strong> network – all interrupti<strong>on</strong>s50Minutes lost per customer4540353025201510501999 2000 2001 2002 2003 2004YearBelgium_natFinlandFranceGreat BritainHungaryItalyPortugalSpainSweden1.8 Further analysis <strong>of</strong> interrupti<strong>on</strong>s set out in the Annex to this chapterA range <strong>of</strong> additi<strong>on</strong>al analysis has been carried out studying the relati<strong>on</strong>ship between the numberand durati<strong>on</strong> <strong>of</strong> interrupti<strong>on</strong>s and network and customer characteristics. The additi<strong>on</strong>al analysis isset out in the Annex to this chapter. The key findings are set out below:··Excluding excepti<strong>on</strong>al events from short interrupti<strong>on</strong>s data is not a comm<strong>on</strong> practice acrossEurope;As would be expected there is a str<strong>on</strong>g positive correlati<strong>on</strong> between the number <strong>of</strong> interrupti<strong>on</strong>sand the durati<strong>on</strong> <strong>of</strong> interrupti<strong>on</strong>s;26Council <strong>of</strong> European Energy Regulators – Ref: C05-QOS-01-03
···There is some evidence to support the view that denser networks (having a higher ratio customer/km)have fewer interrupti<strong>on</strong>s and fewer minutes lost per customer per year than lessdense networks (although the R 2 values were very low);Urban, suburban and rural data supports this view, with performance in urban areas being farbetter than that in rural areas; andFor most countries the majority <strong>of</strong> interrupti<strong>on</strong>s and customer minutes lost are as a result <strong>of</strong>faults <strong>on</strong> MV networks.1.9 C<strong>on</strong>clusi<strong>on</strong>s: recommendati<strong>on</strong>s for future work <strong>on</strong> C<strong>on</strong>tinuity Indicators1. Comm<strong>on</strong> c<strong>on</strong>tinuity indicators: As interrupti<strong>on</strong>s occur at all voltage levels it is beneficial to usecomm<strong>on</strong> c<strong>on</strong>tinuity indicators across all voltage levels, in order to provide customers and companieswith a complete and readily understandable picture <strong>of</strong> the quality <strong>of</strong> service delivered.2. Standard basis for c<strong>on</strong>tinuity indicators: The separati<strong>on</strong> <strong>of</strong> short interrupti<strong>on</strong>s and l<strong>on</strong>g interrupti<strong>on</strong>sprovides useful informati<strong>on</strong> to customers, companies and regulators and countriesshould attempt where possible to split their data in this way.3. C<strong>on</strong>tinuity indicators for planned and unplanned interrupti<strong>on</strong>s: Splitting interrupti<strong>on</strong>s databetween planned and unplanned interrupti<strong>on</strong>s can allow regulators to apply lower weighting toplanned interrupti<strong>on</strong>s given that customers can make prior arrangements. Having a clear splitcan also give public visibility to programmes undertaken to improve l<strong>on</strong>g-term quality <strong>of</strong> service,but which may result in short-term decreases in quality <strong>of</strong> service. It also allows comparis<strong>on</strong>sbetween volumes and types <strong>of</strong> planned work and the impact <strong>on</strong> customers.4. Publicati<strong>on</strong> <strong>of</strong> c<strong>on</strong>tinuity data: Making informati<strong>on</strong> <strong>on</strong> c<strong>on</strong>tinuity performance public is a keyway <strong>of</strong> ensuring that companies keep their focus <strong>on</strong> quality <strong>of</strong> service and also <strong>of</strong> encouragingcustomers to understand the performance they receive and it is recommended that countriesmake such informati<strong>on</strong> readily available in as timely and user friendly manner as possible.5. Weighting method: The majority <strong>of</strong> countries included in this chapter base their weighting <strong>of</strong>c<strong>on</strong>tinuity indicators <strong>on</strong> the number <strong>of</strong> customers, weighting by “user”. It is recommended thatthose countries seeking to introduce c<strong>on</strong>tinuity indicators should give str<strong>on</strong>g c<strong>on</strong>siderati<strong>on</strong> toweighting by user.6. Force majeure: It is str<strong>on</strong>gly recommended that countries develop a set <strong>of</strong> rules regardingevents which are outside <strong>of</strong> the c<strong>on</strong>trol <strong>of</strong> the distributi<strong>on</strong> companies and which can then beexcluded from annual performance, be it as part <strong>of</strong> an incentive scheme or purely for comparativepurposes. The ability to identify, m<strong>on</strong>itor and possibly incentivise underlying performance isgreatly aided by stripping out large scale events outside <strong>of</strong> the c<strong>on</strong>trol <strong>of</strong> distributi<strong>on</strong> companies.27<str<strong>on</strong>g>Third</str<strong>on</strong>g> <str<strong>on</strong>g>Benchmarking</str<strong>on</strong>g> <str<strong>on</strong>g>Report</str<strong>on</strong>g> <strong>on</strong> <strong>Quality</strong> <strong>of</strong> <strong>Electricity</strong> <strong>Supply</strong> – 2005 · Chapter 1
CHAPTER 2 – The Use <strong>of</strong> Standards and Incentives in<strong>Quality</strong> Regulati<strong>on</strong>CONTENT2.1 Introducti<strong>on</strong>: What is <strong>Quality</strong> Regulati<strong>on</strong> and why is it needed? 312.2 <strong>Quality</strong> measurement: a prerequisite for standards and incentives 322.2.1 C<strong>on</strong>tinuity measurement systems 332.2.2 Customer surveys 352.2.3 Findings I: <strong>Quality</strong> measurement as a prerequisite forstandards and incentives 372.3 C<strong>on</strong>tinuity standards at system-level and incentive/penalty regimes 372.3.1 Incentive/penalty schemes adopted in European countries and motivati<strong>on</strong>s 392.3.2 Indicators used for incentive/penalty schemes 412.3.3 Standards used for incentive/penalty schemes 432.3.4 Ec<strong>on</strong>omic effects 452.3.5 Improvement effects and periodical review effects 472.3.6 Findings II: C<strong>on</strong>tinuity standards at system-level andincentive/penalty regimes 522.4 C<strong>on</strong>tinuity standards at single-customer level and customer compensati<strong>on</strong>s 532.4.1 Very l<strong>on</strong>g interrupti<strong>on</strong> standards 532.4.2 Multiple interrupti<strong>on</strong> standards 572.4.3 Single-customer standards related to planned interrupti<strong>on</strong>s 592.4.4 Single-customer standards for the transmissi<strong>on</strong> network 592.4.5 Findings III: single-customer c<strong>on</strong>tinuity standards 612.5 C<strong>on</strong>clusi<strong>on</strong>s: recommendati<strong>on</strong>s for the future work <strong>on</strong> <strong>Quality</strong> Incentive Regulati<strong>on</strong> 62Annex to Chapter 2 12729<str<strong>on</strong>g>Third</str<strong>on</strong>g> <str<strong>on</strong>g>Benchmarking</str<strong>on</strong>g> <str<strong>on</strong>g>Report</str<strong>on</strong>g> <strong>on</strong> <strong>Quality</strong> <strong>of</strong> <strong>Electricity</strong> <strong>Supply</strong> – 2005 · Chapter 2
THE USE OF STANDARDS AND INCENTIVES IN QUALITYREGULATION2.1 Introducti<strong>on</strong>: what is quality regulati<strong>on</strong> and why is it needed?In recent years, a growing number <strong>of</strong> countries have adopted price-cap as the form <strong>of</strong> regulati<strong>on</strong>for electricity distributi<strong>on</strong>, and sometimes also transmissi<strong>on</strong>, services. Price-cap regulati<strong>on</strong> withoutany quality standards or incentive/penalty regimes for quality may provide unintended andmisleading incentives to reduce quality levels. Incentive regulati<strong>on</strong> for quality can ensure that costcuts required by price-cap regimes are not achieved at the expense <strong>of</strong> quality.The increased attenti<strong>on</strong> to quality incentive regulati<strong>on</strong> is rooted not <strong>on</strong>ly in the risk <strong>of</strong> deterioratingquality deriving from the pressure to reduce costs under price-cap, but also in the increasingdemand for higher quality services <strong>on</strong> the part <strong>of</strong> c<strong>on</strong>sumers. For these reas<strong>on</strong>s, a growing number<strong>of</strong> European regulators have adopted some form <strong>of</strong> quality incentive regulati<strong>on</strong> over the lastfew years. Moreover, quality is multidimensi<strong>on</strong>al and some aspects <strong>of</strong> quality have a l<strong>on</strong>g recoverytime after deteriorati<strong>on</strong>. Hence, quality <strong>of</strong> service is usually regulated over more than <strong>on</strong>e regulatoryperiod to address numerous issues, including c<strong>on</strong>tinuous m<strong>on</strong>itoring <strong>of</strong> actual levels <strong>of</strong>performance.The objective <strong>of</strong> this chapter is to provide relevant and comparable informati<strong>on</strong> <strong>on</strong> the regulati<strong>on</strong> <strong>of</strong>quality in the electricity distributi<strong>on</strong> and transmissi<strong>on</strong> services, as enforced in CEER-member countries.This chapter deals with standards and incentive/penalty regimes related to c<strong>on</strong>tinuity <strong>of</strong> supply12 . It is the first time that the CEER’s <strong>Quality</strong> <strong>of</strong> <strong>Electricity</strong> <strong>Supply</strong> <str<strong>on</strong>g>Benchmarking</str<strong>on</strong>g> report reviewsexisting incentive regulati<strong>on</strong>s for quality. Therefore, this chapter should be regarded as a first andgeneral-purpose comparis<strong>on</strong>, while more focused comparis<strong>on</strong>s could be developed in future.Incentive Regulati<strong>on</strong> (IR) for quality comprises essentially three aspects:· measuring actual and perceived levels <strong>of</strong> quality – a necessary and preliminary step, sincesetting c<strong>on</strong>tinuity standards and/or incentive/penalty regimes requires robust and reliable data<strong>on</strong> the service actually provided and <strong>on</strong> customers’ percepti<strong>on</strong>. The subject <strong>of</strong> c<strong>on</strong>tinuitymeasurement was extensively discussed in Chapter 1 and is <strong>on</strong>ly briefly summarized inSecti<strong>on</strong> 2.2; the same secti<strong>on</strong> describes customer surveys, through which regulators can collectadditi<strong>on</strong>al informati<strong>on</strong> <strong>on</strong> quality as perceived by customers, which is extremely valuablefor regulatory decisi<strong>on</strong>-making;· promoting c<strong>on</strong>tinuity improvement, which means giving utilities signals and incentives toevaluate their investment and management decisi<strong>on</strong>s not <strong>on</strong>ly in light <strong>of</strong> their costs but alsotaking into account the effects <strong>on</strong> actual quality levels. Regulators can promote c<strong>on</strong>tinuityimprovement especially by introducing incentive/penalty schemes, generally based <strong>on</strong> system-levelquality standards that refer to the average quality level in a geographical area.Secti<strong>on</strong> 2.3 describes such incentive/penalty regimes and, whenever possible, their effects;12For commercial quality standards, please refer to Chapter 3. For voltage quality, please refer to Chapter 4.31<str<strong>on</strong>g>Third</str<strong>on</strong>g> <str<strong>on</strong>g>Benchmarking</str<strong>on</strong>g> <str<strong>on</strong>g>Report</str<strong>on</strong>g> <strong>on</strong> <strong>Quality</strong> <strong>of</strong> <strong>Electricity</strong> <strong>Supply</strong> – 2005 · Chapter 2
·ensuring good c<strong>on</strong>tinuity levels to c<strong>on</strong>sumers, especially worst-served <strong>on</strong>es; regulatorscan do this through guaranteed standards that refer to the quality level experienced by eachsingle customer c<strong>on</strong>nected to the network. Single-customer guaranteed standards are associatedwith the payment <strong>of</strong> compensati<strong>on</strong>s to the affected customers where the company fails tomeet the standard. Secti<strong>on</strong> 2.4 deals with c<strong>on</strong>tinuity standards at single-customer level andcustomer compensati<strong>on</strong>s.At the end <strong>of</strong> each secti<strong>on</strong>, a number <strong>of</strong> findings identified from the comparis<strong>on</strong> are summarised.Some recommendati<strong>on</strong>s for future work, from the surveyed experience, are given as c<strong>on</strong>clusi<strong>on</strong>s<strong>of</strong> the chapter. The findings and recommendati<strong>on</strong>s, together with this introducti<strong>on</strong>, can be read asan executive summary <strong>of</strong> the chapter. Furthermore, space has been devoted to the more detaileddescripti<strong>on</strong> <strong>of</strong> some regulatory experiences <strong>of</strong> special interest, through boxes c<strong>on</strong>taining additi<strong>on</strong>alinformati<strong>on</strong>. There are also some comparative tables that analyse the most substantive issues.The survey is based <strong>on</strong> data provided by 19 countries: Austria (AT), Belgium (BE) 13 , CzechRepublic (CZ), Est<strong>on</strong>ia (EE), Finland (FI), France (FR), Great Britain (GB), Greece (GR), Hungary(HU), Ireland (IE) Italy (IT), Latvia (LV), Lithuania (LT), Norway (NO), Poland (PL), Portugal (PT),Slovenia (SI), Spain (ES) and Sweden (SE).Note that quality standards and incentive/penalty regimes might be issued by legal bodies differentfrom regulatory authorities. In some countries regulators do not have the legal power to setquality standards, however, generally they can at least make proposals <strong>on</strong> the subject to the competentinstituti<strong>on</strong>. More detailed informati<strong>on</strong> can be found in Annex 2 (Competencies <strong>of</strong> regulatorswith regard to quality regulati<strong>on</strong>).The data were collected through a questi<strong>on</strong>naire c<strong>on</strong>taining about <strong>on</strong>e hundred open-answerquesti<strong>on</strong>s and through a series <strong>of</strong> clarificati<strong>on</strong>s made by the single countries at the request <strong>of</strong> theauthors <strong>of</strong> this chapter. The findings and final recommendati<strong>on</strong>s have been discussed and agreedby the CEER Member Authorities.2.2 <strong>Quality</strong> measurement: a prerequisite for standards and incentivesSetting c<strong>on</strong>tinuity standards and incentive/penalty regimes requires firstly robust and reliable dataand sec<strong>on</strong>dly that the outputs to be regulated are relevant and important for c<strong>on</strong>sumers. Thismeans that there are two main prerequisites for setting standards and incentives:· c<strong>on</strong>tinuity measurement systems;· customer surveys <strong>on</strong> satisfacti<strong>on</strong>, expectati<strong>on</strong>s and willingness to pay.In the two following paragraphs these prerequisite are briefly illustrated; for a more comprehensivediscussi<strong>on</strong> <strong>of</strong> c<strong>on</strong>tinuity measurement systems, see Chapter 1. A summary <strong>of</strong> the most relevantissues c<strong>on</strong>cludes the secti<strong>on</strong> (Findings I).13Belgium has a federal organizati<strong>on</strong> for regulati<strong>on</strong> activities. The nati<strong>on</strong>al regulator (CREG) is <strong>on</strong>ly c<strong>on</strong>cerned with the nati<strong>on</strong>altransmissi<strong>on</strong> network, while 3 regi<strong>on</strong>al regulators are c<strong>on</strong>cerned with local transmissi<strong>on</strong> and distributi<strong>on</strong> networks. Only regi<strong>on</strong>aldata from the regi<strong>on</strong>s Wall<strong>on</strong>ia and Flanders are available and included in this report.32Council <strong>of</strong> European Energy Regulators – Ref: C05-QOS-01-03
2.2.1 C<strong>on</strong>tinuity measurement systemsAs described in Chapter 1, there is a widespread commitment by regulators to regularly m<strong>on</strong>itoractual levels <strong>of</strong> c<strong>on</strong>tinuity <strong>of</strong> supply, by collecting data from distributi<strong>on</strong> and transmissi<strong>on</strong> companies,and to publish the data for benchmarking (Table 2.1). The most comm<strong>on</strong> indicators areSAIDI and SAIFI for l<strong>on</strong>g interrupti<strong>on</strong>s (durati<strong>on</strong> > 3 minutes) for distributi<strong>on</strong> and ENS and AIT fortransmissi<strong>on</strong>. Usually both planned and unplanned interrupti<strong>on</strong>s are m<strong>on</strong>itored separately.C<strong>on</strong>cern for planned interrupti<strong>on</strong>s <strong>on</strong> the part <strong>of</strong> the regulator is motivated by the fact that evenplanned interrupti<strong>on</strong>s have a cost for c<strong>on</strong>sumers. As l<strong>on</strong>g as they are informed in advance, however,they will be able to reduce their outage costs and inc<strong>on</strong>venience.At present, very few regulators have data <strong>on</strong> the number <strong>of</strong> short interrupti<strong>on</strong>s (durati<strong>on</strong> < 3 minutes).However, it is clear that regulators are increasingly c<strong>on</strong>cerned about short interrupti<strong>on</strong>s asthey become increasingly relevant to business customers. M<strong>on</strong>itoring short interrupti<strong>on</strong>s requiresattenti<strong>on</strong> to technical details and is, naturally, the prerequisite for setting regulatory standards.It was rather clear from the survey that significant differences exist with regard to accuracy andcompleteness in the measurement and registrati<strong>on</strong> <strong>of</strong> the data. This diversity makes it difficult,even today, to fairly compare numerical values. One example for all is the measurement <strong>of</strong> interrupti<strong>on</strong>soriginated <strong>on</strong> LV circuits. Where these are not measured (more than half <strong>of</strong> the countriessurveyed), the number and durati<strong>on</strong> <strong>of</strong> interrupti<strong>on</strong>s actually experienced by c<strong>on</strong>sumers will beworse than indicated in the reported data.TABLE 2.1MONITORING AND COMMUNICATION OF CONTINUITY INDICATORSMeasure l<strong>on</strong>g Measure Measure separately Voltage level Informati<strong>on</strong> to Publicati<strong>on</strong>interrupti<strong>on</strong>s short int's planned/unplanned regulatorAT ✓ ✓ HV, MV Yearly ✓BE ✓(>15' in LV) ✓ HV, LV YearlyCZ ✓ ✓ HV, MV, LV Yearly ✓EE ✓ ✓ HV, MV Yearly ✓ES ✓ ✓ HV, MV Yearly ✓FI ✓ ✓ ✓ HV, MV, LV Yearly ✓FR ✓ ✓ ✓ HV, MV, LV Yearly ✓GB ✓ ✓ ✓ HV, MV, LV Yearly ✓GR ✓ ✓ HV, MV, LV Yearly ✓HU ✓ ✓ ✓ HV, MV, LV Yearly ✓IE ✓(>1') ✓(>1') ✓ HV, MV Yearly ✓IT ✓ ✓ ✓ HV, MV, LV Yearly ✓LT ✓ ✓ HV, MV, LV Quarterly ✓LV ✓ HV, MV Yearly ✓NO ✓ ✓ HV, MV Yearly ✓POPT ✓ ✓ HV, MV, LV Quarterly ✓SI some data available some data available some data available HV, MV up<strong>on</strong> request ✓SE ✓ ✓ HV, MV Yearly ✓33<str<strong>on</strong>g>Third</str<strong>on</strong>g> <str<strong>on</strong>g>Benchmarking</str<strong>on</strong>g> <str<strong>on</strong>g>Report</str<strong>on</strong>g> <strong>on</strong> <strong>Quality</strong> <strong>of</strong> <strong>Electricity</strong> <strong>Supply</strong> – 2005 · Chapter 2
Comparis<strong>on</strong> <strong>of</strong> data across countries is made inherently difficult by the fact that performancesvary substantially even am<strong>on</strong>g companies and within the same company. As suggested by Ofgem,factors that influence performance can be grouped into three classes:· Inherent factors such as weather c<strong>on</strong>diti<strong>on</strong>s, geography and populati<strong>on</strong> density <strong>of</strong> a particular area;· Inherited factors such as the design <strong>of</strong> the network at the starting moment <strong>of</strong> incentive regulati<strong>on</strong>and/or privatisati<strong>on</strong> (e.g. some companies or areas may have l<strong>on</strong>g, predominantly overheadcircuits, whilst others may have more underground lines). It takes a l<strong>on</strong>g time and significantcapital expenditure to fundamentally alter network design;· Incurred factors such as managerial performance, how well assets are maintained, and howeffectively resources are used.Reliable and robust data is crucial for incentive regulati<strong>on</strong> <strong>on</strong> c<strong>on</strong>tinuity. On the <strong>on</strong>e side, it clearlyemerged from the survey that the majority <strong>of</strong> regulators have not established or approved rulesfor recording interrupti<strong>on</strong>s (see Table 2.2). On the other hand, measurement protocols are generallyfound in almost all <strong>of</strong> the eight countries where an incentive/penalty regime is implemented(not in all countries that have set c<strong>on</strong>tinuity standards at system- or customer-level). These protocolsrequire companies to measure and analyse data in a manner that is c<strong>on</strong>sistent with regulatorypurposes, enable the regulator to c<strong>on</strong>trol the registrati<strong>on</strong> process, and give credibility and fairnessto financial incentive regimes. The most critical issues in measurement protocols that affectthe implementati<strong>on</strong> <strong>of</strong> incentive/penalty regimes are classificati<strong>on</strong> <strong>of</strong> causes (in particular forcemajeure: this is defined in the great majority <strong>of</strong> countries, see Annex 2.1), and identificati<strong>on</strong> <strong>of</strong> thenumber <strong>of</strong> c<strong>on</strong>sumers affected by the interrupti<strong>on</strong>s (or its estimate).TABLE 2.2RECORDING, AUDITS, AND QUALITY REGULATIONRules for recordingl<strong>on</strong>g interrupti<strong>on</strong>sClassify interrupti<strong>on</strong>swith causesDefiniti<strong>on</strong> <strong>of</strong> ForceMajeureAuditsC<strong>on</strong>tinuitystandards*Incentive/penaltyregimeAT ✓ ✓ ✓BE ✓ ✓ ✓CZ ✓ ✓ ✓ ✓EE ✓ ✓ ✓ES ✓ ✓ ✓ ✓ ✓FI ✓ ✓FR ✓ ✓ ✓ ✓GB ✓ ✓ ✓ ✓ ✓GRHU ✓ ✓ ✓ ✓ ✓ ✓IE Not regularly ✓ ✓IT ✓ ✓ ✓ ✓ ✓ ✓LT ✓ ✓ ✓LVNO ✓ ✓ Proposal ✓POPT ✓ ✓ ✓ ✓ ✓ ✓SI✓SE ✓ ✓ ✓34* any type <strong>of</strong> standards, at system level or at single-customer level.Council <strong>of</strong> European Energy Regulators – Ref: C05-QOS-01-03
Almost all countries having adopted incentive/penalty schemes regularly audit data provided bycompanies. The variety <strong>of</strong> auditing systems (audits can be carried out by regulators themselves, byc<strong>on</strong>sultants, or even by the companies according to procedures set by the regulator) should facilitatethe diffusi<strong>on</strong> <strong>of</strong> such important measures in other countries, especially those interested in implementinga financial incentive scheme. It is important that audits be carried out more frequently whenthe incentive/penalty regime is first introduced. Frequency <strong>of</strong> audits can then be relaxed over time.2.2.2 Customer surveysCustomer surveys are an additi<strong>on</strong>al, important form <strong>of</strong> “measuring” quality, complementary toc<strong>on</strong>tinuity measurement systems. Even if customer surveys are not widely used by regulators,customer research can provide useful informati<strong>on</strong> <strong>on</strong> customer satisfacti<strong>on</strong>, expectati<strong>on</strong>s andWillingness To Pay (WTP) for quality. This informati<strong>on</strong> is useful in regulatory decisi<strong>on</strong>s regardingthe choice <strong>of</strong> quality factors and services to be m<strong>on</strong>itored and given the presence <strong>of</strong> incentives.For this reas<strong>on</strong>, regulators who do carry out customer research usually find them extremelyimportant and use the results in various matters <strong>of</strong> regulati<strong>on</strong>.The most frequent issues explored through customer research are (see Table 2.3):· Customer satisfacti<strong>on</strong>: this is the typical subject <strong>of</strong> customer research, either occasi<strong>on</strong>ally(like in Portugal) or periodically (like in Hungary, Italy, Great Britain); acccording to the separati<strong>on</strong>between network operator and energy supplier, the comm<strong>on</strong> quality factors <strong>on</strong> whichcustomers are requested to express their satisfacti<strong>on</strong> are:· regarding the network operator: c<strong>on</strong>tinuity <strong>of</strong> supply, troubleshooting, voltage fluctuati<strong>on</strong>,staff behaviour, informati<strong>on</strong> provided;· regarding the supplier: punctuality <strong>of</strong> bills, details <strong>of</strong> bills, complaints handling, informati<strong>on</strong>provided, billing adjustments in case <strong>of</strong> errors.· Customer expectati<strong>on</strong>s and importance <strong>of</strong> quality factors: this is a more sophisticatedmatter that can provide regulators with useful informati<strong>on</strong> for standard setting and for identifyingnew areas <strong>of</strong> regulatory interventi<strong>on</strong>. Often, c<strong>on</strong>tinuity <strong>of</strong> supply is felt as the most importantquality factor (for instance in Portugal and in Italy), but more focused research can uncovernew areas <strong>of</strong> great interest to c<strong>on</strong>sumers. For instance, Ofgem’s latest study, published <strong>on</strong>Ofgem’s website in June 2004, suggests that British customers’ main priorities are:· improving restorati<strong>on</strong> times following storms;· receiving accurate informati<strong>on</strong> during power cuts;· reducing the number and frequency <strong>of</strong> power cuts;· carrying out some degree <strong>of</strong> undergrounding in nati<strong>on</strong>al parks and areas <strong>of</strong> outstandingnatural beauty.· Customer willingness to pay: this type <strong>of</strong> quantitative research is d<strong>on</strong>e by many <strong>of</strong> the regulatorsthat introduced incentive regulati<strong>on</strong> for c<strong>on</strong>tinuity <strong>of</strong> supply and is used by them,together with cost and performance informati<strong>on</strong>, to get informati<strong>on</strong> <strong>on</strong> incentive rates and costallowances <strong>of</strong> the incentive schemes. This kind <strong>of</strong> research is based <strong>on</strong> “c<strong>on</strong>tingent valuati<strong>on</strong>”:this means that, in order to quantify the valuati<strong>on</strong> <strong>of</strong> ec<strong>on</strong>omic damage ensuing from interrupti<strong>on</strong>s,generally <strong>on</strong>e or more “interrupti<strong>on</strong> scenarios” are proposed to the interviewee. WTP35<str<strong>on</strong>g>Third</str<strong>on</strong>g> <str<strong>on</strong>g>Benchmarking</str<strong>on</strong>g> <str<strong>on</strong>g>Report</str<strong>on</strong>g> <strong>on</strong> <strong>Quality</strong> <strong>of</strong> <strong>Electricity</strong> <strong>Supply</strong> – 2005 · Chapter 2
esearch is the most difficult to carry out and can lead to results that are hard to interpret; forinstance, both in Italy and in Great Britain, WTP studies have shown higher than expected willingnessto pay, even if the vast majority <strong>of</strong> both household and business c<strong>on</strong>sumers feel thatthe price they pay to electricity suppliers is c<strong>on</strong>sistent with the value they receive (e.g., inHungary 84.4 % <strong>of</strong> household customers and 77.8 % <strong>of</strong> business customers declare that theprice they pay to electricity suppliers is perfect, mostly or fairly in harm<strong>on</strong>y with its value).TABLE 2.3CUSTOMER SURVEYS CONDUCTED BY REGULATORSOther specific mattersCustomer surveys <strong>on</strong> willingness to pay (WTP)Customer surveys <strong>on</strong> expectati<strong>on</strong>s and importance<strong>of</strong> quality factorsCustomer surveys <strong>on</strong> satisfacti<strong>on</strong>Customer surveys under preparati<strong>on</strong>N<strong>on</strong>eGB (quality <strong>of</strong> teleph<strong>on</strong>e resp<strong>on</strong>se, m<strong>on</strong>thly)NO (2001), IT (2003), GB (2004), SE (2003)HU (annually), IT (1998)HU (annually), IT (annually), GB (every 5 years),PT (occasi<strong>on</strong>ally)GRAT, BE, CZ, EE, ES, FI, FR, IE, LV, LT, PL, SIADDITIONAL INFORMATION 2.1 – INCENTIVES FOR QUALITY OF TELEPHONE RESPONSE THROUGHCUSTOMER SURVEYS IN GREAT BRITAINThe case <strong>of</strong> Great Britain is probably the most innovative as regards the use <strong>of</strong> customer surveys.Results from customer satisfacti<strong>on</strong> become, in fact, an indicator in the incentive/penalty regime,even if with a weight that is largely lower than the c<strong>on</strong>tinuity-based indicators. The regulator(Ofgem) carries out m<strong>on</strong>thly surveys <strong>of</strong> the quality <strong>of</strong> teleph<strong>on</strong>e resp<strong>on</strong>se. The regulator commissi<strong>on</strong>smarket research c<strong>on</strong>sultants to call back customers who have c<strong>on</strong>tacted their distributi<strong>on</strong>business in relati<strong>on</strong> to an emergency or power cut. The customers are asked to rank the companyfrom 1 to 5 where 1 is very dissatisfied and 5 is satisfied in four key areas:politeness <strong>of</strong> staff;willingness <strong>of</strong> staff to help;accuracy <strong>of</strong> informati<strong>on</strong> provided;· usefulness <strong>of</strong> informati<strong>on</strong> provided.Nine hundred customers are interviewed each year for each distributi<strong>on</strong> company. Companies arethen incentivised <strong>on</strong> the basis <strong>of</strong> their annual mean score. Companies are subject to a sliding-scalepenalty if their annual mean performance deteriorates below 4.1. If their annual mean scores fall below3.6, companies will be liable for the full penalty <strong>of</strong> 0.25 per cent <strong>of</strong> revenue. There will be a smallreward <strong>of</strong> 0.05 per cent <strong>of</strong> revenue for those companies with annual mean scores greater than 4.5.36Council <strong>of</strong> European Energy Regulators – Ref: C05-QOS-01-03
2.2.3 Findings I: <strong>Quality</strong> measurement as a prerequisite for standards andincentivesIR#1: <strong>Quality</strong> performance depends <strong>on</strong> some country-specific c<strong>on</strong>diti<strong>on</strong>s, related to inherent factors(such as geography and weather c<strong>on</strong>diti<strong>on</strong>s), inherited factors (which can be changed <strong>on</strong>ly over al<strong>on</strong>g period <strong>of</strong> time, such as network c<strong>on</strong>figurati<strong>on</strong>s) and incurred factors. Moreover, each regulatorhas different powers in quality standard-setting and in fixing customer compensati<strong>on</strong>.IR#2: Reliable and robust data is crucial for setting standards and introducing incentive regulati<strong>on</strong> <strong>on</strong>c<strong>on</strong>tinuity. Measurement protocols are generally found in almost all countries where anincentive/penalty regime is implemented. These protocols require companies to measure and analysedata in a manner that is c<strong>on</strong>sistent with regulatory purposes, enable the regulator to c<strong>on</strong>trol the registrati<strong>on</strong>process, and give credibility and fairness to financial incentive regimes. Almost all countriesthat have adopted incentive/penalty schemes regularly audit data provided by companies.IR#3: Customer satisfacti<strong>on</strong> is the most frequent subject <strong>of</strong> market surveys; in some cases, regulatorssurvey other issues that are relevant for their decisi<strong>on</strong> making, like willingness-to-pay and customerexpectati<strong>on</strong>s for service levels (see Table 2.3). In a few cases, regulators make focused surveys, regardingsatisfacti<strong>on</strong> with specific services (e.g. quality <strong>of</strong> teleph<strong>on</strong>e resp<strong>on</strong>se, see additi<strong>on</strong>al informati<strong>on</strong> 2.1 ).2.3 C<strong>on</strong>tinuity standards at system-level and incentive/penalty regimesIn the past five years regulators have developed incentive/penalty regimes for c<strong>on</strong>tinuity that arelinked to c<strong>on</strong>tinuity standards at the system level. As far as the distributi<strong>on</strong> service is c<strong>on</strong>cerned,incentive/penalty regimes are in place in eight countries out <strong>of</strong> 19 surveyed: Italy (from 2000),Norway and Ireland (from 2001), Great Britain (from 2002), Hungary and Portugal (from 2003),Sweden (from 2004), and Est<strong>on</strong>ia (from 2005). Note that in Est<strong>on</strong>ia the incentive/penalty regime,introduced <strong>on</strong> both distributi<strong>on</strong> and transmissi<strong>on</strong>, is too recent to be described in the presentreport. Other countries expressed interest in introducing an incentive scheme in the future:Finland (from 2008), France, Lithuania (from 2008), Poland, Spain, and Slovenia (see Table 2.4).TABLE 2.4SYSTEM-LEVEL STANDARDS OF CONTINUITY: DISTRIBUTIONSystem-level c<strong>on</strong>tinuitystandardsSpecial plansIncentive/penalty regimeInterest or intenti<strong>on</strong>GB (SAIDI, SAIFI), HU (Outage rate, faults/km, average repair time (MV), averagenumber <strong>of</strong> grouped faults (LV), SAIDI, SAIFI, Percentage <strong>of</strong> interr. restored within3 and 24 hrs). IE (SAIDI and losses until 2005; SAIDI, SAIFI and losses from2006), IT (SAIDI), NO (ENS), PT (ENS), SE (SAIDI, SAIFI), ES (TIEPI-MV,NIEPI-MV, 80 percentile TIEPI-MV), EE (not available)ES, PT, SEEE, GB, HU, IE, IT, NO, PT, SEES, FI, FR, LT, PL, SI37<str<strong>on</strong>g>Third</str<strong>on</strong>g> <str<strong>on</strong>g>Benchmarking</str<strong>on</strong>g> <str<strong>on</strong>g>Report</str<strong>on</strong>g> <strong>on</strong> <strong>Quality</strong> <strong>of</strong> <strong>Electricity</strong> <strong>Supply</strong> – 2005 · Chapter 2
As for transmissi<strong>on</strong> systems, system-level c<strong>on</strong>tinuity standards are not very comm<strong>on</strong> (see Table2.5). They are set <strong>on</strong>ly by the regulators in Great Britain, Italy (from the end <strong>of</strong> 2005), and Hungary.Incentive/penalty regimes are applied in Great Britain, Hungary and Norway and will be applied inIreland starting in 2006 (Italy, France and Spain are moving in this directi<strong>on</strong>).TABLE 2.5SYSTEM-LEVEL STANDARDS OF CONTINUITY: TRANSMISSIONSystem level c<strong>on</strong>tinuity standardsIncentive/penalty regimesInterest/intenti<strong>on</strong> in incentive regimeGB (ENS), HU (network availability, outage rate), IT (expected at theend <strong>of</strong> 2005), EE (not available)GB [incentives and penalties in form <strong>of</strong> increase (1% max)/decrease(1.5% max) in allowed revenues], HU (<strong>on</strong>ly penalties in form <strong>of</strong> fines),IE (System Minutes Lost, at risk 0,4% <strong>of</strong> c<strong>on</strong>trollable costs from 2006),NO (same regime as for distributi<strong>on</strong>), EE (not available)ES, FR, ITThis secti<strong>on</strong> illustrates the regulatory mechanisms adopted in the surveyed countries. The incentiveschemes implemented are all based <strong>on</strong> the same principle: the revenues <strong>of</strong> the company are modifiedupward or downward depending <strong>on</strong> its performance in terms <strong>of</strong> c<strong>on</strong>tinuity <strong>of</strong> supply, measured asthe distance between actual system-level c<strong>on</strong>tinuity standards and a predefined target. Although theprinciple is the same, the mechanisms adopted in European countries are quite different in numerousrespects, as will be explained below. In order to facilitate understanding <strong>of</strong> the comparis<strong>on</strong> thePortuguese mechanism, chosen for its simplicity, is described in detail (Additi<strong>on</strong>al Informati<strong>on</strong> 2.2).ADDITIONAL INFORMATION 2.2 – PORTUGAL: INCENTIVE/PENALTY REGIMEThe Tariff Code, published by the Portuguese regulator (ERSE) establishes an incentive schemeto improve c<strong>on</strong>tinuity <strong>of</strong> service. The financial measures affect the annual adjustment <strong>of</strong> the allowedrevenues for the activity <strong>of</strong> electricity distributi<strong>on</strong> in MV and results in a penalty or a reward,depending <strong>on</strong> the results <strong>of</strong> c<strong>on</strong>tinuity <strong>of</strong> service performance.The c<strong>on</strong>tinuity indicators c<strong>on</strong>sidered in the incentive scheme is the Energy Not Supplied (ENS).The incentive scheme is represented in Figure 2.1.FIGURE 2.1 PORTUGUESE INCENTIVE SCHEMERQS (€)RQS máxIncentiveENS Ref-VSlope=V ENSENS (khw)ENS RefENS Ref+VPenaltyRQS míx38Council <strong>of</strong> European Energy Regulators – Ref: C05-QOS-01-03
The incentive is symmetric and related to a reference value (target) <strong>of</strong> the Energy Not Supplied(ENS Ref). A dead band applies.· If the value <strong>of</strong> ENS in a given year is less than ENS -V, which means that the network hadRefa good performance, the distributors’ revenues are increased by an amount RQS (revenuesfor quality <strong>of</strong> supply), expressed in €. RQS is computed using a per-unit-value <strong>of</strong> the ENS,V ENS, and is proporti<strong>on</strong>al to the difference between the actual ENS in the year and the targetENS Ref-V:RQS= V ENSx[(ENS Ref-V) - ENS]· If the value <strong>of</strong> ENS in a given year is greater than ENS +DV, which means that the networkRefhad a bad performance, the distributors’ revenues are decreased by an amount RQS, in €.RQS is computed using a per-unit-value <strong>of</strong> the ENS, V ENS, and is proporti<strong>on</strong>al to the differencebetween the actual ENS in the year and the target ENS Ref-V:RQS= V ENSx[ENS-(ENS Ref+V)]· If the value <strong>of</strong> ENS in a given year is near the ENS value, the distributor’s revenues are notRefaffected (if ENS Ref-V ENS ENS Ref±V, then RQS=0).··The parameters used in 2005 are the following:· The reward and the penalty have the same maximum value: |RQS |= |RQS | =min max5 000 000 €· Target: ENS = 0,0004 x ES (ES=energy supplied in the year)Ref· Dead band: ± V = 0,12 x ENS Ref· Value <strong>of</strong> ENS: V = 1,5 €/kWhENSThis incentive scheme is applied with a two-year delay: in 2005 for performance in 2003.Incentive/penalty regimes are compared <strong>on</strong> the basis <strong>of</strong> a number <strong>of</strong> characteristics. Am<strong>on</strong>g theseare the indicators included in the scheme, the baseline for standards, the form <strong>of</strong> financial incentives/penalties,the effectiveness <strong>of</strong> the scheme and the expected changes over time. A summary<strong>of</strong> the most relevant issues c<strong>on</strong>cludes the secti<strong>on</strong> (Findings II).2.3.1 Incentive/penalty schemes adopted in European countriesIncentive/penalty schemes have been implemented in European countries with the general objective<strong>of</strong> improving/maintaining c<strong>on</strong>tinuity levels at a socio-ec<strong>on</strong>omically acceptable level, in particularunder price- or revenue-cap types <strong>of</strong> regulati<strong>on</strong>. In <strong>on</strong>e case <strong>on</strong>ly (Italy) has the regulator designedthe mechanism specifically around a country-specific objective: the c<strong>on</strong>vergence <strong>of</strong> c<strong>on</strong>tinuity levelstowards unique targets (for districts having the same territorial characteristics). Prior assessment <strong>of</strong>current c<strong>on</strong>tinuity levels can, in fact, show the need to address specific issues (Table 2.6).39<str<strong>on</strong>g>Third</str<strong>on</strong>g> <str<strong>on</strong>g>Benchmarking</str<strong>on</strong>g> <str<strong>on</strong>g>Report</str<strong>on</strong>g> <strong>on</strong> <strong>Quality</strong> <strong>of</strong> <strong>Electricity</strong> <strong>Supply</strong> – 2005 · Chapter 2
TABLE 2.6TYPE OF INCENTIVE/PENALTY REGIMES ADOPTED IN EUROPEAN COUNTRIESObjectivesIncentive and/orpenaltyOther schemesDurati<strong>on</strong>GBImprove c<strong>on</strong>tinuity levelsbothGuaranteed Standards (GS) <strong>on</strong>maximum restorati<strong>on</strong> time: GS <strong>on</strong>maximum yearly number <strong>of</strong> l<strong>on</strong>gunplanned interrupti<strong>on</strong>s5 years (as price c<strong>on</strong>trol period)HUImprove c<strong>on</strong>tinuity levelsCompensate drawbacks <strong>of</strong> pricecap regulati<strong>on</strong>bothGS <strong>on</strong> maximum restorati<strong>on</strong> timeNo predetermined durati<strong>on</strong>. From 1January 2006 a new regime will beintroduced for 3 years. No correlati<strong>on</strong>with the price c<strong>on</strong>trol period (4 years).IEImprove c<strong>on</strong>tinuity levelsbothGS <strong>on</strong> maximum restorati<strong>on</strong> time5 years (as price c<strong>on</strong>trol period)ITImprove c<strong>on</strong>tinuity levels andreduce regi<strong>on</strong>al gaps inc<strong>on</strong>tinuity through a"c<strong>on</strong>vergence" mechanismbothGS <strong>on</strong> maximum yearly number <strong>of</strong>l<strong>on</strong>g unplanned interrupti<strong>on</strong>s per HVand MV customer GS <strong>on</strong> maximumrestorati<strong>on</strong> time under c<strong>on</strong>sultati<strong>on</strong>4 years (as price c<strong>on</strong>trol period)NOAchieve a socio- ec<strong>on</strong>omicallyacceptable level <strong>of</strong> c<strong>on</strong>tinuity(rather than to improve it)bothN<strong>on</strong>eNo predetermined durati<strong>on</strong> until now.From 2007 there will be some smallchanges in the scheme.PTImprove c<strong>on</strong>tinuity <strong>of</strong> servicelevelsbothGS <strong>on</strong> Maximum yearly cumulativedurati<strong>on</strong> <strong>of</strong> unplanned interrupti<strong>on</strong> (allvoltage levels), GS <strong>on</strong> Maximum yearlynumber <strong>of</strong> l<strong>on</strong>g unplanned interrupti<strong>on</strong>s(all voltage levels), SpecialPlans for improving <strong>Quality</strong> <strong>of</strong> <strong>Supply</strong>No predetermined durati<strong>on</strong>SEAchieve a socio-ec<strong>on</strong>omicallyacceptable level <strong>of</strong> c<strong>on</strong>tinuitybothGS <strong>on</strong> maximum restorati<strong>on</strong> timeunder evaluati<strong>on</strong>Observati<strong>on</strong> <strong>of</strong> theworst performing areasNo predetermined durati<strong>on</strong> (ex-postregulati<strong>on</strong>, year by year)In all cases surveyed, the scheme includes both penalties and rewards and, since it is designedto address system-average c<strong>on</strong>tinuity levels, is or will be complemented by some form <strong>of</strong> protecti<strong>on</strong>for the worst-served c<strong>on</strong>sumers. In general this is d<strong>on</strong>e by introducing Guaranteed Standards(GS) <strong>on</strong> durati<strong>on</strong> and number <strong>of</strong> l<strong>on</strong>g interrupti<strong>on</strong>s (maximum restorati<strong>on</strong> time being the mostcomm<strong>on</strong>, see secti<strong>on</strong> 2.4). Sometimes this assumes the form <strong>of</strong> observati<strong>on</strong> <strong>of</strong> the worst-performingareas (Sweden) or, as in Portugal and Spain, <strong>of</strong> a quality improvement plan financedthrough tariffs (See Additi<strong>on</strong>al informati<strong>on</strong> 2.3).ADDITIONAL INFORMATION 2.3 – WORST PERFORMING AREASIn Portugal, a distributor experiencing difficulties in meeting quality standards can submit a temporaryacti<strong>on</strong> program aimed at improving its performance in a specific locati<strong>on</strong>. The program, with amaximum durati<strong>on</strong> <strong>of</strong> 2 years, must be approved by the Ministry after c<strong>on</strong>sultati<strong>on</strong> with the regulator.Special plans are financed through tariffs.40Council <strong>of</strong> European Energy Regulators – Ref: C05-QOS-01-03
In Sweden, a quality <strong>of</strong> supply index is calculated for every company using a network performanceassessment model (see Additi<strong>on</strong>al Informati<strong>on</strong> 2.4). The regulator observes the change in thisindex from year to year and investigates any companies that present a persistently low quality <strong>of</strong>supply over a period <strong>of</strong> few years. Companies below the lower quality boundary can be checkedfor quality issues, regardless <strong>of</strong> the company’s performance from a tariff regulati<strong>on</strong> point <strong>of</strong> view.Spain does not have an incentive/penalty regime yet, but it has set system-level c<strong>on</strong>tinuity standards,which are not <strong>on</strong>ly evaluated as average levels in a given territory but aimed at identifyingworst-served areas in that regi<strong>on</strong>. Standards are set <strong>on</strong> TIEPI, 80th percentile TIEPI, and NIEPI,and differentiated by density areas. Distributi<strong>on</strong> companies experiencing difficulties in maintainingthe quality required in certain areas are given the opportunity to submit, to the competent administrati<strong>on</strong>,a temporary acti<strong>on</strong> programme describing the problems that need to be corrected. Thoseprogrammes will be included in a quality improvement plan financed through the tariff. Specialplans have been implemented since 2004 and the amount <strong>of</strong> expenses recovered through thismechanism has been quite large so far: for 2004 special plans received a budget <strong>of</strong> 50 milli<strong>on</strong>,increased to 80 milli<strong>on</strong> for 2005.Incentive/penalty schemes have in most cases the same durati<strong>on</strong> as the price c<strong>on</strong>trol period (4 or5 years) and in a few cases have no predetermined durati<strong>on</strong>. All schemes are periodicallyreviewed: in the first case, with the same frequency as the tariff, in the sec<strong>on</strong>d at the regulator’sdiscreti<strong>on</strong>. When the review is performed at the same time as the tariff adjustment it should beeasier to separate the expected level <strong>of</strong> c<strong>on</strong>tinuity (remunerated via the base tariff) from theimprovements, financed via the incentive scheme.2.3.2 Indicators used for incentive/penalty regimesThe indicators included in the incentive schemes are usually <strong>on</strong>e or two (in some cases SAIDI<strong>on</strong>ly; in other cases both SAIDI and SAIFI; occasi<strong>on</strong>ally ENS, Energy Not Supplied) and c<strong>on</strong>cernl<strong>on</strong>g interrupti<strong>on</strong>s. Until 2005, Hungary m<strong>on</strong>itored several indicators, but it is planning to use <strong>on</strong>lythree starting in 2006 (Table 2.7).In some cases the indicator includes <strong>on</strong>ly unplanned interrupti<strong>on</strong>s, in others also planned <strong>on</strong>es.In the latter case, planned interrupti<strong>on</strong>s are usually not given the same weight as unplanned <strong>on</strong>es.In Great Britain, where the regulator found evidence from a customer survey that their impact isabout half that <strong>of</strong> unplanned interrupti<strong>on</strong>s, they have been counted with a 0.5 discount factorsince 2005. In Norway their reduced impact <strong>on</strong> c<strong>on</strong>sumers is taken into account in the incentiverate, which is lower than the incentive rate for unplanned outages (but more than half <strong>of</strong> it).Planned interrupti<strong>on</strong>s in Norway were evaluated using data from a customer survey (i.e. in thesame manner as unplanned interrupti<strong>on</strong>s, see paragraph 2.3.4). In any case is important to beaware <strong>of</strong> the fact that a scheme that allows companies to gain higher revenues by reducingplanned interrupti<strong>on</strong>s, <strong>on</strong> the <strong>on</strong>e hand, can induce companies to adopt a more efficient maintenanceprogram or, <strong>on</strong> the other hand, may create a l<strong>on</strong>g term risk due to insufficient maintenance<strong>of</strong> the network. This may be especially true if the company is close to its target halfway or threequarters<strong>of</strong> the way through the year: the company may choose to defer planned work.41<str<strong>on</strong>g>Third</str<strong>on</strong>g> <str<strong>on</strong>g>Benchmarking</str<strong>on</strong>g> <str<strong>on</strong>g>Report</str<strong>on</strong>g> <strong>on</strong> <strong>Quality</strong> <strong>of</strong> <strong>Electricity</strong> <strong>Supply</strong> – 2005 · Chapter 2
TABLE 2.7INDICATORS USED FOR INCENTIVE/PENALTY SCHEMESIndicatorsPlannedExclusi<strong>on</strong>sRolling averageGBCIs: number <strong>of</strong> customers interruptedper 100 customers,CML: average number <strong>of</strong> customerminutes lost per customerIncluded in CML and CIs with 50%weighting from 2005excepti<strong>on</strong>al events; separateregulatory mechanism(see Additi<strong>on</strong>al informati<strong>on</strong> 2.6)NoHUNetwork Security (NS) indicators:Outage rate, Number <strong>of</strong> MV faults pergrid length, Average repair time <strong>of</strong> MVnetwork, Average number <strong>of</strong> LVgrouped faults. C<strong>on</strong>tinuity <strong>of</strong> <strong>Supply</strong>(CS) indicators, SAIDI, SAIFI,Percentage <strong>of</strong> interrupti<strong>on</strong>s restoredwithin 3 and within 24 hrsExcludedNS: noCS: yesYes: threeyear rollingaverageIESAIDI and Losses (SAIFI being addedfrom 2006)Includeddays with daily SAIDI with deviati<strong>on</strong>larger than twice the standarddeviati<strong>on</strong> from the meanNoITSAIDIExcludedforce majeure and externalcauses; Statistical methodYes: two yearrolling averageNOENS Energy Not SuppliedIncluded in the incentive regulati<strong>on</strong>(evaluated separately)Yes (excepti<strong>on</strong>al events can beevaluated up<strong>on</strong> request by thecompany)NoPTENS Energy Not Supplied, which isdetermined <strong>on</strong> the basis <strong>of</strong> TIEPI(indicator <strong>of</strong> frequency <strong>of</strong> interrupti<strong>on</strong>weighted with the installed power in MV)Excludedforce majeure, public interest,service reas<strong>on</strong>s, safety reas<strong>on</strong>s,agreements with the customer,facts attributable to the customer.NoSESAIDI, SAIFIIncluded in the incentive(evaluated separately)Force majeureNoAs far as exclusi<strong>on</strong>s are c<strong>on</strong>cerned, all countries have a criteri<strong>on</strong> for excluding events due to“force majeure”, or excepti<strong>on</strong>al events however defined. In Sweden the regulator used to includethe events caused by faults <strong>on</strong> the transmissi<strong>on</strong> system. The interrupti<strong>on</strong>s due to the Swedishblackout <strong>of</strong> 2003 were removed <strong>on</strong> an excepti<strong>on</strong>al basis. A law is currently under discussi<strong>on</strong> thatwould eventually lead to exclusi<strong>on</strong> <strong>of</strong> events due to the transmissi<strong>on</strong> system. In Norway, NVE may(based <strong>on</strong> applicati<strong>on</strong>s from the network companies) find acceptable reas<strong>on</strong>s for exempti<strong>on</strong>s fromthe incentive regime (for instance, extremely bad weather), but this has not happened in the period2001-2005. In Italy and Portugal, c<strong>on</strong>sumers’ damages are excluded from the company’s liability(although, in Italy, from 2005 distributi<strong>on</strong> companies are free to choose to include them in theregulati<strong>on</strong> and in this case targets are reviewed accordingly). It should be clear that all approachesare acceptable as l<strong>on</strong>g as the causes <strong>of</strong> interrupti<strong>on</strong>s that are included in the regulated indicatorare included also in the calculati<strong>on</strong> <strong>of</strong> the target chosen for the incentive scheme, otherwisethere is a risk <strong>of</strong> misjudging the difference between actual quality levels and quality standards.42Council <strong>of</strong> European Energy Regulators – Ref: C05-QOS-01-03
Regulators’ c<strong>on</strong>cern with the volatility in company performance from <strong>on</strong>e year to the next resultedin the cases <strong>of</strong> Italy and Hungary in the adopti<strong>on</strong> <strong>of</strong> a two- or three-year rolling average valueas a measure <strong>of</strong> the company’s actual performance. This is not the case for the other countries,where the c<strong>on</strong>tinuity indicators are used as actual values for the specific year. The use <strong>of</strong> a rollingaverage can reduce volatility, but <strong>on</strong> the other hand it can dilute incentives/penalties by the number<strong>of</strong> years c<strong>on</strong>sidered in the rolling average.2.3.3 Standards used for the incentive/penalty schemeFive out <strong>of</strong> eight regulators require distributi<strong>on</strong> companies to improve their performance over time.In other words, they set c<strong>on</strong>tinuity targets that decrease with time (Table 2.8). In Sweden the c<strong>on</strong>tinuitytarget can theoretically vary from year to year. Is important to notice that Sweden <strong>of</strong>fers animplicit incentive to improve quality, since the benchmark used in the performance assessmentmodel is based <strong>on</strong> 100% underground cables at LV and MV levels (see Additi<strong>on</strong>al Informati<strong>on</strong>2.4). In Norway no improvement is required by the regulator, whose aim is to achieve a socio-ec<strong>on</strong>omicallyacceptable level <strong>of</strong> c<strong>on</strong>tinuity and not necessarily to improve it. The Norwegian regula-TABLE 2.8STANDARDS USED FOR INCENTIVE/PENALTY SCHEMEBaseline Scope (number <strong>of</strong> companies) Dead bandGBFlat or minimum level <strong>of</strong> improvement.C<strong>on</strong>vergence mechanism.Per distributi<strong>on</strong> company (14 ex-PES), excludingthe new smaller <strong>on</strong>esNoHUSAIDI decreases yearly. All other indicators arec<strong>on</strong>stant. C<strong>on</strong>vergence mechanism.Per distributi<strong>on</strong> company (6)Yes: 5% for penalties;10% for incentivesIEYearly decreasingPer distributi<strong>on</strong> company (1)NoITYearly improvement required.C<strong>on</strong>vergence mechanisms.Per territorial district (more than 300). Eachdistrict is formed by all the municipalities <strong>of</strong> thesame province with the same density(inhabitants) and served by the same distributi<strong>on</strong>company (24 major companies).Yes: ±5% from targetNOTarget can vary from year to year.Per distributi<strong>on</strong> company (137); the sameincentive regime is applied to the transmissi<strong>on</strong>company.No dead band but until2006 regulator requirescompanies to adjust tariffchanges <strong>on</strong>ly if l<strong>on</strong>g-lastingchanges in c<strong>on</strong>tinuityhave been achievedPTOnly <strong>on</strong>e target, ENSRef = 0,0004 x ES (Energysupplied in the year), has been published by theregulator so far. The target can be recalculatedevery yearPer distributi<strong>on</strong> company, <strong>on</strong>ly in MV (1)Yes: ± 12% from targetSETarget can vary from year to year. Implicitlydecreasing.Per distributi<strong>on</strong> company (193)No43<str<strong>on</strong>g>Third</str<strong>on</strong>g> <str<strong>on</strong>g>Benchmarking</str<strong>on</strong>g> <str<strong>on</strong>g>Report</str<strong>on</strong>g> <strong>on</strong> <strong>Quality</strong> <strong>of</strong> <strong>Electricity</strong> <strong>Supply</strong> – 2005 · Chapter 2
tor calculates a benchmark for company performance using a regressi<strong>on</strong> model: this benchmarkis adjusted in order to give companies incentives to provide a socio-ec<strong>on</strong>omically optimal level <strong>of</strong>reliability; to this end, utilities are forced to internalise c<strong>on</strong>sumer interrupti<strong>on</strong> costs.In Italy, Great Britain, and Hungary the worst performing companies have larger improvements tomake: this choice enables a c<strong>on</strong>vergence <strong>of</strong> c<strong>on</strong>tinuity levels for the entire country. C<strong>on</strong>tinuity targetsare set in all cases by company. The <strong>on</strong>ly excepti<strong>on</strong> is Italy, where targets are given by territorialdistrict. Historical performance and structural differences in network layouts must be takeninto account when setting the standards, in order to set targets that are achievable for the companyand valuable for c<strong>on</strong>sumers. Differentiating targets by density area, as in Italy, or by company,as in other countries, does just that.Some regulators try to avoid tariff changes for performances that are “close enough” to the target.This reduces the administrative burden <strong>of</strong> regulati<strong>on</strong>. To this end, Italy Hungary, and Portugalhave defined dead bands around the target. The width <strong>of</strong> the dead band varies from a minimum<strong>of</strong> +/- 5% to a maximum <strong>of</strong> +/- 12%. Note that there is a risk <strong>of</strong> diluting incentives if the band is toowide. In Norway there is no dead band, but the regulator requires companies not to introducechanges in the tariff unless l<strong>on</strong>g-lasting changes in c<strong>on</strong>tinuity have been achieved.ADDITIONAL INFORMATION 2.4 – NETWORK PERFORMANCE ASSESSMENTNetwork performance assessment methodologies enable regulators to compare company performancein a objective and fair manner, taking into account differences in structural variablesacross distributi<strong>on</strong> companies.The Swedish regulator employs a network tariff regulati<strong>on</strong> model, theso-called Network PerformanceAssessment Model (“PAM”). L<strong>on</strong>g planned and unplanned SAIDI and SAIFI reported for a wholeyear by the companies, for every network c<strong>on</strong>cessi<strong>on</strong>, are c<strong>on</strong>verted to a total cost <strong>of</strong> interrupti<strong>on</strong>sfor that particular c<strong>on</strong>cessi<strong>on</strong>. The calculati<strong>on</strong> is based <strong>on</strong> a study <strong>of</strong> customers’ estimated interrupti<strong>on</strong>costs c<strong>on</strong>ducted by Swedenergy (the branch organizati<strong>on</strong>) in 1994 and updated in 2003, whereboth planned and unplanned interrupti<strong>on</strong>s were c<strong>on</strong>sidered.This amount, called the “reported total interrupti<strong>on</strong> cost”, is compared for every c<strong>on</strong>cessi<strong>on</strong> with the“expected total interrupti<strong>on</strong> cost” calculated from the PAM. If the company’s reported total interrupti<strong>on</strong>cost is higher than the calculated <strong>on</strong>e, the difference between the reported and expected interrupti<strong>on</strong>cost will corresp<strong>on</strong>d to the penalty due to poor quality <strong>of</strong> supply for that c<strong>on</strong>cessi<strong>on</strong>.Therefore, there is a target level <strong>of</strong> c<strong>on</strong>tinuity that is defined, in terms <strong>of</strong> cost <strong>of</strong> interrupti<strong>on</strong>, by the“expected normal interrupti<strong>on</strong> cost” calculated by the PAM. There is also an implicit incentive toimprove quality as costs computed from the performance assessment model are based <strong>on</strong> 100%underground cables at LV and MV levels.The effect <strong>of</strong> quality performance <strong>on</strong> the tariff is limited by upper and lower “boundaries”. The upperboundary is the limit for over-quality and the lower boundary corresp<strong>on</strong>ds to the performance froma pure radial network.In Norway a regressi<strong>on</strong> model is used to calculate “expected total interrupti<strong>on</strong> costs” for each companyusing historical data and various structural variables (energy supplied, network extensi<strong>on</strong>,number <strong>of</strong> transformers, wind, geographical dummies).44Council <strong>of</strong> European Energy Regulators – Ref: C05-QOS-01-03
In Great Britain the regulator (Ofgem) collects physical characteristics and performance informati<strong>on</strong>for each MV circuit for each distributi<strong>on</strong> company. These circuits are then divided into 22 circuitgroups with physically similar characteristics. The groups are defined so that differences in thepercentage <strong>of</strong> overhead line, circuit length and number <strong>of</strong> c<strong>on</strong>nected customers are minimised andthat no group is dominated by a single company. Ofgem compares and benchmarks performancewithin each circuit group. A benchmark is then built for each company based <strong>on</strong> its mix <strong>of</strong> circuits.2.3.4 Ec<strong>on</strong>omic effectsIncentive/penalty schemes, in <strong>on</strong>e form or another, affect revenues earned by distributi<strong>on</strong> companies.With the excepti<strong>on</strong> <strong>of</strong> Hungary (and Great Britain from 2002 to 2004), such ec<strong>on</strong>omiceffects are directly proporti<strong>on</strong>al to the difference between the actual value <strong>of</strong> the regulated indicator(s)and the target and symmetry. Symmetry means that for the same deviati<strong>on</strong> in absolutevalue (positive or negative) from the target there is the same amount <strong>of</strong> incentive (for positivedeviati<strong>on</strong>, i.e. actual quality better than standard) or penalty (for negative deviati<strong>on</strong>, i.e. actualquality worse than standard). Indeed, the degree <strong>of</strong> symmetry <strong>of</strong> the whole incentive/penaltyregime should be regarded not <strong>on</strong>ly in the light <strong>of</strong> the proporti<strong>on</strong>ality between deviati<strong>on</strong> from thestandard and ec<strong>on</strong>omic effects, but also looking at the standard setting system, and in particularat the existence <strong>of</strong> a required minimum improvement (see Table 2.9).Rewards are ultimately paid by c<strong>on</strong>sumers in all cases. In Great Britain, as well as in other countries,these costs are shared <strong>on</strong>ly am<strong>on</strong>g c<strong>on</strong>sumers <strong>of</strong> the company that earned incentives.Differentiating the distributi<strong>on</strong> tariff across different areas <strong>of</strong> the same country can be an issue insome countries, where a higher-level principle prevents such tariff differentiati<strong>on</strong>. In Italy, forinstance, the c<strong>on</strong>straint <strong>of</strong> the single distributi<strong>on</strong> tariff across the nati<strong>on</strong>al territory requires that allc<strong>on</strong>sumers in the country share the costs <strong>of</strong> quality improvements above the target: it is the singlenati<strong>on</strong>al tariff that increases. The problem does not apply to countries where there is <strong>on</strong>ly <strong>on</strong>edistributor (for example Ireland and Portugal).The most interesting aspects are the following:· In the case <strong>of</strong> Great Britain and Ireland, respectively ±3% and ±2% <strong>of</strong> price c<strong>on</strong>trol revenue isexposed to the c<strong>on</strong>tinuity incentives (note that the amount <strong>of</strong> revenues exposed to the schemeis boundaried). In Ireland the percentage <strong>of</strong> revenues exposed will be increased to ±2.5% in2006 and ±4% from 2007. There are four incentives, 3 <strong>of</strong> which refer to quality <strong>of</strong> supply andnetwork performance (SAIDI, SAIFI and losses). In Great Britain 1.2% <strong>of</strong> this relates to SAIFIand 1.8% relates to SAIDI. Rewards (penalties) are proporti<strong>on</strong>al to the difference between theactual performance level and the target. Such difference is valued using a fixed incentive rate.· In the case <strong>of</strong> Norway and Sweden the difference between expected interrupti<strong>on</strong> costs andactual interrupti<strong>on</strong> costs (using respectively actual ENS and actual SAIDI and SAIFI), is calculatedannually for each company and added to the company’s revenue cap if positive orsubtracted if negative. In Sweden the tariff for each company is adjusted accordingly (networktariff and quality are evaluated ex post through a reference network model). Upper and lowerboundaries are used, respectively corresp<strong>on</strong>ding to the quality <strong>of</strong> a totally undergrounded net-45<str<strong>on</strong>g>Third</str<strong>on</strong>g> <str<strong>on</strong>g>Benchmarking</str<strong>on</strong>g> <str<strong>on</strong>g>Report</str<strong>on</strong>g> <strong>on</strong> <strong>Quality</strong> <strong>of</strong> <strong>Electricity</strong> <strong>Supply</strong> – 2005 · Chapter 2
·work and a pure radial network. In Norway, so far the tariff is changed <strong>on</strong>ly if the company’sexpectati<strong>on</strong>s <strong>of</strong> future interrupti<strong>on</strong> costs deviates from the target (due to investments, changesin operati<strong>on</strong> <strong>of</strong> the system and so <strong>on</strong>). From 2007 companies shall adjust tariffs according tothe incentive/penalty result each year.TABLE 2.9ECONOMIC EFFECTSIncentive/penalty Incentive rate SymmetryGB±3% <strong>of</strong> price c<strong>on</strong>trol revenue is exposed to thec<strong>on</strong>tinuity incentivesAverage value <strong>of</strong> energy not supplied implicitlyused in the scheme: 4.18 €/kWh not servedYes (but minimumimprovement required)HUTariff-related incentives and penalties apply to 3indices out <strong>of</strong> NS & CS: outage rate; SAIDI, andSAIFI; Fines apply to all NS and CS indicatorsNot applicableNoIE±2% <strong>of</strong> price c<strong>on</strong>trol revenue is exposed to theincentives (2001-2005)±4% <strong>of</strong> price c<strong>on</strong>trolrevenue is exposed to the incentives (2006-2010)Average value <strong>of</strong> energy not supplied used in thescheme: 7.2 €/kWh-not-supplied (year 2000)Yes (but minimumimprovement required)ITThe price-cap formula c<strong>on</strong>tains a Q factor thatfunds the net difference between incentives andpenalties.Differentiated according to type <strong>of</strong> c<strong>on</strong>sumers(domestic and business); respectively 10.8 and21.6 €/kWh-not-suppliedYes (but minimumimprovement required)NOThe difference between expected interrupti<strong>on</strong>costs and actual interrupti<strong>on</strong> costs (using actualENS) is calculated annually for each company andadded to the company's revenue cap if positiveand subtracted if negative. From 2007 companieswill have to adjust tariffs yearly <strong>on</strong> the basis <strong>of</strong> theincentive/penalty effectCosts <strong>of</strong> energy not supplied, differentiatedaccording to type <strong>of</strong> c<strong>on</strong>sumers (unplanned -planned in €/kWh-not-supplied); Industrial: 7.90 -5.51; Trade/Service: 11.86 - 8.14; Agricultural:1.80 -1.20; Residential: 0.96 - 0.84;Public service 1.56 - 1.20; Wood processing/energy intensive industry: 1.56 - 1.32YesPTRewards (penalties) are proporti<strong>on</strong>al to the differencebetween the actual performance level andthe target (excluding the dead band)Fixed incentive rate for any deviati<strong>on</strong> from thetargetValue <strong>of</strong> energy not supplied used in thescheme: 1.5 €/kWh-not-supplied.YesSEThe difference between "expected interrupti<strong>on</strong>costs" and actual interrupti<strong>on</strong> costs(using reported SAIDI and SAIFI) is calculatedannually for each company. The tariff for thecompany is adjusted accordingly. An upperboundary (totally underground network) and alower boundary (quality <strong>of</strong> a pure radial network)are used.Costs <strong>of</strong> energy not supplied and cost <strong>of</strong> powerinterrupted, differentiated according to density <strong>of</strong>line, i.e., meter line per number <strong>of</strong> customers.€/kWh-not-supplied (unplanned/planned)Urban: 12 / 8.6; Suburban: 8.8 /6.3;Rural: 7.4 /5.2; €/kW-interrupted (unplanned/planned); Urban 2.5 /0.4 Suburban 1.9 /0.3;Rural 1.6 / 0.2Yes·In Italy, distributors that do not reach (that exceed) their assigned target in each district andeach year pay a penalty (gain a financial incentive) proporti<strong>on</strong>al to the difference between theactual level and the target. Due to the single nati<strong>on</strong>al tariff, adjustments in the tariff are moreindirect than in the previous cases: the price cap formula is adjusted via a Q factor that fundsthe net difference between incentives and penalties. In other words, penalties are used to fundthe incentives and the rest is funded through tariffs (Q factor). The improvement targets arec<strong>on</strong>sidered within the base tariff: incentives are limited to extra improvements over the targets.46Council <strong>of</strong> European Energy Regulators – Ref: C05-QOS-01-03
··A regime to avoid overquality is enforced through “reference levels” that are c<strong>on</strong>sidered the“optimal” c<strong>on</strong>tinuity levels for each type <strong>of</strong> territory.Hungary al<strong>on</strong>e has adopted a totally asymmetric incentive regime. The scheme includes tariff-relatedincentives and penalties as well as sancti<strong>on</strong>s. Incentives are in the form <strong>of</strong> a pr<strong>of</strong>itincrease for the company. They apply to 3 indices out <strong>of</strong> Network Security (NS) and C<strong>on</strong>tinuity<strong>of</strong> <strong>Supply</strong> (CS) indicators (Table II.4): outage rate, SAIDI, and SAIFI. In case <strong>of</strong> improvement<strong>of</strong> any <strong>of</strong> these indices by more than 10% above target, and if both the others are above target,company pr<strong>of</strong>its can be increased by 10%. Tariff-related penalties apply to the same 3indices. In case <strong>of</strong> underperformance in the 5-10% range, the distributi<strong>on</strong> tariff decreases by0.5% per indicator below target (maximum penalty: 1.5% decrease in tariff). In case <strong>of</strong> underperformanceabove 10%, the distributi<strong>on</strong> tariff decreases by 1% per indicator below target(maximum penalty: 3% decrease in tariff). Sancti<strong>on</strong>s apply to all NS and CS indicators: if theperformance is worse than standard the company pays a fine to the regulator: a lower fineapplies if the performance is worse than the standard by 0-5%, a higher fine applies if the performanceis 5-10% worse than the target.The case <strong>of</strong> Portugal is illustrated in Additi<strong>on</strong>al Informati<strong>on</strong> 2.2. The incentive was determinedfor the first time for 2003 performance. The incentive value to be applied in 2005 was zero (thevalue <strong>of</strong> ENS in 2003 was within the “dead band”) and in 2006 will be the maximum value,RQS max(the value <strong>of</strong> ENS in 2004 was lower than ENS ref-V-RQS max/V ENS).Financial incentives, in the simpler form <strong>of</strong> sancti<strong>on</strong>s, or in the more complex form <strong>of</strong> adjustmentsin tariffs (or revenues), pose the questi<strong>on</strong> <strong>of</strong> choosing the amount to be paid. In particular, definingthe incentive rate (amount paid per unit deviati<strong>on</strong> from the target) is a challenge for the regulator.In Norway, Great Britain, Sweden and Italy the choice <strong>of</strong> the incentive rate was guided bycustomer valuati<strong>on</strong> <strong>of</strong> the energy not supplied c<strong>on</strong>ducted through a WTP survey (the incentiverate is differentiated per c<strong>on</strong>sumer type).2.3.5 Improvement effects and periodical review effectsIn Great Britain, Italy, Ireland, Hungary and Norway, incentives schemes have been in place l<strong>on</strong>genough to observe their effects <strong>on</strong> c<strong>on</strong>tinuity levels. In all countries such results are quite remarkablein terms <strong>of</strong> improvements <strong>of</strong> the regulated indicators, and sometimes also <strong>of</strong> the unregulated <strong>on</strong>es.Effects <strong>of</strong> the incentive schemes include also a str<strong>on</strong>ger focus <strong>on</strong> quality <strong>of</strong> service, both in terms <strong>of</strong>day to day management <strong>of</strong> the network and in l<strong>on</strong>ger-term investment decisi<strong>on</strong>s. In greater detail:· In Great Britain the initial incentive scheme applied from 1 April 2002 to 31 March 2005. It wasintroduced partway through the price c<strong>on</strong>trol period to allow for initial work <strong>on</strong> improving the accuracy<strong>of</strong> reporting. The main results <strong>of</strong> the first implementati<strong>on</strong> period include a 15% improvementin CIs (SAIFI*100) and a 19% improvement in CML (SAIDI), between 2001/2 and 2004/5, as illustratedin Figure 2.2 (excluding the impact <strong>of</strong> excepti<strong>on</strong>al events). It should be noted that <strong>on</strong>ly twocompanies per year paid penalties (for years 2002-2004 the UK had a penalty-<strong>on</strong>ly scheme).Note that the penalties were calculated annually but <strong>on</strong>ly applied as adjustments to revenue at theend <strong>of</strong> the price c<strong>on</strong>trol period. In additi<strong>on</strong>, quality <strong>of</strong> service regulati<strong>on</strong> become widely accepted47<str<strong>on</strong>g>Third</str<strong>on</strong>g> <str<strong>on</strong>g>Benchmarking</str<strong>on</strong>g> <str<strong>on</strong>g>Report</str<strong>on</strong>g> <strong>on</strong> <strong>Quality</strong> <strong>of</strong> <strong>Electricity</strong> <strong>Supply</strong> – 2005 · Chapter 2
····by companies – senior management now has a str<strong>on</strong>ger focus <strong>on</strong> quality <strong>of</strong> service, both in terms<strong>of</strong> day to day management <strong>of</strong> the network and also in l<strong>on</strong>ger-term investment decisi<strong>on</strong>s.In Hungary, the incentive scheme has applied since 1 January 2003. Remarkable improvementsin terms <strong>of</strong> c<strong>on</strong>tinuity indicators have been achieved: SAIDI in 1999: 411, in 2004: 137min/c<strong>on</strong>sumer (Figure 2.3). It was found that, as a side effect, in a few cases planned interrupti<strong>on</strong>sincreased.In Ireland the incentive scheme has applied since 2001. C<strong>on</strong>tinuity has improved by an average<strong>of</strong> 5% per year.In Italy, an incentive scheme applied for a first regulatory period during the years 2000-2003.The main results include a significant reducti<strong>on</strong> in the gap between the c<strong>on</strong>tinuity level in Italyand best performing countries in Europe, and a dramatic reducti<strong>on</strong> in regi<strong>on</strong>al gaps, especiallybetween North and South <strong>of</strong> the country, while maintaining c<strong>on</strong>tinuity levels achieved insome areas <strong>of</strong> outstanding service. The total SAIDI went down from 192 minutes lost in 1999to 91 minutes lost in 2004 with an improvement rate <strong>of</strong> 53% in 5 years (Figure 2.4). Theimprovement in the total durati<strong>on</strong> <strong>of</strong> interrupti<strong>on</strong>s per customer also led to a partial benefit interms <strong>of</strong> reducti<strong>on</strong> in the number <strong>of</strong> l<strong>on</strong>g interrupti<strong>on</strong>s per customer (SAIFI: -34% in 5 years).Short interrupti<strong>on</strong>s have also g<strong>on</strong>e down slightly (MAIFI: 15% in 3 years). Finally, a generalc<strong>on</strong>sensus <strong>on</strong> c<strong>on</strong>tinuity regulati<strong>on</strong> was achieved: according to an evaluati<strong>on</strong> study c<strong>on</strong>ductedthrough interviews with network managers, the incentive scheme “polarized” investments indistributi<strong>on</strong> companies towards the acknowledged goal <strong>of</strong> c<strong>on</strong>tinuity improvement and territorialc<strong>on</strong>vergence, according to objectives set by the Authority.In Norway, the incentive scheme has applied since 2001. The main results include a reducti<strong>on</strong>in ENS from 27000 MWh in 2000 to 16000 MWh in 2004 and a positive effect <strong>on</strong> operati<strong>on</strong>,maintenance and investments in the system (Figure 2.5). Regarding planned interrupti<strong>on</strong>s:companies have changed their routines (work with power <strong>on</strong>, smaller areas are affected bymaintenance work because <strong>of</strong> more precise disc<strong>on</strong>necti<strong>on</strong>s, better planning <strong>of</strong> maintenance,etc.) and have reduced ENS with the same level <strong>of</strong> maintenance.Great Britain, Italy, and Norway have entered a sec<strong>on</strong>d regulatory period (Ireland is about to, in2006, with new incentives now in place). Regulators carried out, also with the help <strong>of</strong> c<strong>on</strong>sultants,an evaluati<strong>on</strong> <strong>of</strong> the incentive scheme in place and introduced some changes, including an update<strong>of</strong> the incentive rates. The beginning <strong>of</strong> a new regulatory period was taken as an opportunity forexpanding the scope <strong>of</strong> the regulati<strong>on</strong>, to introduce simplificati<strong>on</strong>, and to eliminate redundancies.In particular:· In Great Britain, the new incentive scheme applies for the full price c<strong>on</strong>trol period from 1 April2005 to 31 March 2010. The main changes are the following: financial exposure to c<strong>on</strong>tinuitywent from 2% to 3%; higher incentive rates were applied; the incentive scheme, which waspartially symmetric (due to uncertainties about the targets), become fully symmetric; plannedinterrupti<strong>on</strong>s were given a 50% weighting, instead <strong>of</strong> 100%; and the excepti<strong>on</strong>al events mechanismwas simplified.· In Italy, the renewed incentive scheme applies for the current regulatory period (2004-2007). Themain changes are the following: introducti<strong>on</strong> <strong>of</strong> a GS <strong>on</strong> the number <strong>of</strong> interrupti<strong>on</strong>s; targetsreviewed for SAIDI; introducti<strong>on</strong> <strong>of</strong> a new method for calculating “tendential improvement tar-48Council <strong>of</strong> European Energy Regulators – Ref: C05-QOS-01-03
··gets”; introducti<strong>on</strong> <strong>of</strong> an upper boundary for both incentives and penalties; updating <strong>of</strong> the incentiverate differentiatiati<strong>on</strong> according to final use <strong>of</strong> energy (domestic or n<strong>on</strong>-domestic uses).In Norway, the incentive rates related to energy not supplied were changed in 2003 (based <strong>on</strong>a new customer survey). Also the differentiati<strong>on</strong> changed from 2 customer groups to 6.In Ireland, global financial exposure was increased from 2% to 4% (with 2.5% in 2006 as aninterim step). Each individual incentive is capped at 1.5%. The value <strong>of</strong> the incentive wasupdated to reflect the value <strong>of</strong> benefit based <strong>on</strong> actual informati<strong>on</strong> (e.g. value <strong>of</strong> lost load, enduserunit costs).ADDITIONAL INFORMATION 2.5 – EVALUATION OF COSTS AND BENEFITSOfgem carried out an impact assessment <strong>of</strong> the new incentive scheme as part <strong>of</strong> the November2004 final proposals for the price c<strong>on</strong>trol review.The total costs that have been allowed to fund improvements in c<strong>on</strong>tinuity <strong>of</strong> supply in the period2005/6 to 2009/10 have been estimated at £225 milli<strong>on</strong> (excluding allowances for excepti<strong>on</strong>alevents). This amounts to an increase in charges <strong>of</strong> approximately £1.20 per annum per customerallowing for the fact that capital expenditure will be funded over the depreciati<strong>on</strong> life <strong>of</strong> the assets.The revised targets for quality <strong>of</strong> service assume that improvements in the nati<strong>on</strong>al average performance<strong>of</strong> around 3 customer interrupti<strong>on</strong>s for every 100 customers and 10 minutes lost shouldbe achievable over the next price c<strong>on</strong>trol period.The valuati<strong>on</strong> <strong>of</strong> benefits <strong>of</strong> reducing interrupti<strong>on</strong>s depends <strong>on</strong> the weightings between domestic customersand different types <strong>of</strong> business customers and the form <strong>of</strong> analysis used. However, taking areas<strong>on</strong>ably c<strong>on</strong>servative estimate <strong>of</strong> £10 for the weighted average cost <strong>of</strong> a <strong>on</strong>e-hour interrupti<strong>on</strong>across customer groups would imply average benefits to customers <strong>of</strong> approximately £47m perannum or approximately £1.70 per customer across the price c<strong>on</strong>trol period from distributi<strong>on</strong> companiesmeeting the new targets. This suggests that it is worthwhile to tighten quality <strong>of</strong> service targets.FIG 2.2 IMPROVEMENT EFFECTS OF THE INCENTIVE/PENALTY REGIME INGREAT BRITAINCI and CML 2001/2 to 2004/5 (incentive penalty/regime started in 2002)100.0090.00CI & CML80.0070.00CICML60.0050.002001/02 2002/03Year2003/04 2004/05Note: CML=SAIDI; CI=SAIFI*10049<str<strong>on</strong>g>Third</str<strong>on</strong>g> <str<strong>on</strong>g>Benchmarking</str<strong>on</strong>g> <str<strong>on</strong>g>Report</str<strong>on</strong>g> <strong>on</strong> <strong>Quality</strong> <strong>of</strong> <strong>Electricity</strong> <strong>Supply</strong> – 2005 · Chapter 2
FIG 2.3 IMPROVEMENT EFFECTS OF THE INCENTIVE/PENALTY REGIME IN HUNGARYSAIFI 2004 TO 2004 (incentive penalty/regime started in 2003)2,42,292,12,132,032,051,901.991,81,51,220002001 2002 2003 2004 2002/04 avg.FIG 2.3 IMPROVEMENT EFFECTS OF THE INCENTIVE/PENALTY REGIME IN HUNGARYSAIDI (expressed in hours) 2000 TO 2004 (incentive penalty/regime started in 2003)5,04,04,02 4,173,283,02,592,292,722,01,020002001 2002 2003 2004 2002/04 avg.FIG 2.4/a IMPROVEMENT EFFECTS OF THE INCENTIVE/PENALTY REGIME IN ITALYSAIDI 1998 TO 2003 (Incentive/penalty regime started in 2000)200Costumers minutes lost (all interrupti<strong>on</strong>s)1501005001998reducti<strong>on</strong> in 4 years: 46%(1999-2003)1999 2000 2001 2002 2003■ Before regulati<strong>on</strong> ■ Low voltage network ■ Medium voltage network ■ Not attributable to DNOsExcluded 28-Sept blackoutand 26-June rollingload shedding50Council <strong>of</strong> European Energy Regulators – Ref: C05-QOS-01-03
FIG 2.4/b CONVERGENCE EFFECT OF THE INCENTIVE/PENALTY REGIME IN ITALYSAIDI-NET 1998 TO 2003 (Incentive/penalty regime started in 2000)CML due to interrupti<strong>on</strong>sascribed to DNOsresp<strong>on</strong>sibilitiesLegenda300250max value20090 percentile150Average10 percentilemin value10050019981999 2000 2001 2002 2003(84 districts) (89 districts) (91 districts) (91 districts) (91 districts) (91 districts)Urban districtsFIG 2.5 IMPROVEMENT EFFECTS OF THE INCENTIVE/PENALTY REGIME IN NORWAYENS/ENERGY 1996 TO 2004 (Incentive penalty regime started in 2001)0,040%0,035%0,030%0,025%0,020%0,015%0,010%0,005%0,000 %1996 1997 1998 1999 2000 2001 2002 2003 2004■ Total ■ Due to notified ■ Due to n<strong>on</strong> notified51<str<strong>on</strong>g>Third</str<strong>on</strong>g> <str<strong>on</strong>g>Benchmarking</str<strong>on</strong>g> <str<strong>on</strong>g>Report</str<strong>on</strong>g> <strong>on</strong> <strong>Quality</strong> <strong>of</strong> <strong>Electricity</strong> <strong>Supply</strong> – 2005 · Chapter 2
2.3.6 Findings II: C<strong>on</strong>tinuity standards at system-level andincentive/penalty regimesIR#4: The introducti<strong>on</strong> <strong>of</strong> incentive/penalty regimes normally aims to improve c<strong>on</strong>tinuity levels andavoid perverse incentives from price cap regulati<strong>on</strong> that may lead to deteriorati<strong>on</strong>s in quality. Wherean assessment <strong>of</strong> the current situati<strong>on</strong> highlights country or regi<strong>on</strong>al weaknesses, specific objectivesshould be c<strong>on</strong>sidered with at least the same attenti<strong>on</strong> as for general objectives (like special investmentplans, reducti<strong>on</strong> <strong>of</strong> regi<strong>on</strong>al gaps, and so <strong>on</strong>). In any case, it’s extremely important to assure anoverall c<strong>on</strong>sistency <strong>of</strong> the objectives with the allowed revenues <strong>of</strong> the companies.IR#5: The first element in the design <strong>of</strong> an incentive/penalty scheme is the selecti<strong>on</strong> <strong>of</strong> the c<strong>on</strong>tinuityindicators. The current practice shows that an efficient incentive scheme can include <strong>on</strong>e (typicallydurati<strong>on</strong> <strong>of</strong> interrupti<strong>on</strong> per customer or energy not supplied), two (typically durati<strong>on</strong> and number <strong>of</strong>interrupti<strong>on</strong>s per customer) or more indicators. Periodic revisi<strong>on</strong>s <strong>of</strong> the incentive scheme allows theregulator to modify over time the number <strong>of</strong> indicators and fine-tune regulati<strong>on</strong> to its objectives.Mechanisms to smooth volatility and to cope with excepti<strong>on</strong>al events (exclusi<strong>on</strong> <strong>of</strong> specific types <strong>of</strong>interrupti<strong>on</strong>s and/or use <strong>of</strong> rolling averages for the c<strong>on</strong>tinuity indicators) have an impact <strong>on</strong> the financialresults <strong>of</strong> the distributi<strong>on</strong> companies; for this reas<strong>on</strong> they should always be carefully c<strong>on</strong>sidered.IR#6: The sec<strong>on</strong>d element is the definiti<strong>on</strong> <strong>of</strong> targets. Empirical evidence shows that both c<strong>on</strong>stantand decreasing baselines are used. A decisi<strong>on</strong> <strong>on</strong> the baseline can <strong>on</strong>ly be taken c<strong>on</strong>sidering thecurrent as well as the historical c<strong>on</strong>tinuity level <strong>of</strong> the companies, observing such results in comparis<strong>on</strong>with those <strong>of</strong> similar territories and network layouts, and after c<strong>on</strong>sultati<strong>on</strong> with stakeholders.Targets are normally given for a set number <strong>of</strong> years in advance, usually for the durati<strong>on</strong> <strong>of</strong> theregulatory period; in <strong>on</strong>e case <strong>on</strong>ly the target is fixed year by year.IR#7: Foreseeing ec<strong>on</strong>omic effects is the third element in designing the incentive/penalty regulatoryscheme. In general, schemes are symmetric around the baseline and financial incentives and penaltiesare proporti<strong>on</strong>al to the difference between the actual performance and the target; apart from this,incentive rates, amount <strong>of</strong> revenues exposed to the scheme, and upper and lower boundaries aresignificantly different am<strong>on</strong>g the surveyed countries (see Table 2.9). There is no simple soluti<strong>on</strong> to thetask <strong>of</strong> setting financial incentives. It is advisable to take a decisi<strong>on</strong> after wide c<strong>on</strong>sultati<strong>on</strong> and bearingin mind regulatory objectives. It was observed that in a number <strong>of</strong> countries incentive rates (thatc<strong>on</strong>vert the difference between target and actual level into financial amounts) have been establishedafter having surveyed the willingness-to-pay (or to accept compensati<strong>on</strong>s) <strong>of</strong> final customers.IR#8: Regulators review incentive/penalty regimes at regular intervals, as it is usually d<strong>on</strong>e for thetariff. Periodical reviews allow regulators to introduce modificati<strong>on</strong>s, enlarge the scope <strong>of</strong> the regulati<strong>on</strong>and even remove it in case market mechanisms seem to work efficiently for the same purpose.C<strong>on</strong>tinuous m<strong>on</strong>itoring <strong>of</strong> all measured indicators are also extremely useful for observing the effects<strong>of</strong> the regime <strong>on</strong> those indicators that are not subject to financial incentives.52Council <strong>of</strong> European Energy Regulators – Ref: C05-QOS-01-03
2.4 C<strong>on</strong>tinuity standards at single-customer level and customer compensati<strong>on</strong>sSingle-customer c<strong>on</strong>tinuity standards are thresholds applied to c<strong>on</strong>tinuity indicators that have to berespected for every single customer c<strong>on</strong>nected to the network. Single-customer c<strong>on</strong>tinuity standardsare generally expressed as the maximum number <strong>of</strong> interrupti<strong>on</strong>s and/or a maximum durati<strong>on</strong><strong>of</strong> interrupti<strong>on</strong>s, but can also c<strong>on</strong>cern other c<strong>on</strong>tinuity indicators.They can differ depending <strong>on</strong> the type <strong>of</strong> customer (for instance a domestic or a n<strong>on</strong>-domestic customerwill not always have the same standard), but also depending <strong>on</strong> the voltage level <strong>of</strong> the network.Customers who do not receive the level <strong>of</strong> service set out in the standard are entitled toreceive compensati<strong>on</strong> payments from the operator; the compensati<strong>on</strong> payment can be either automaticor up<strong>on</strong> request by the affected customer, and can vary according to the type (or size) <strong>of</strong> customerand, in some cases, according to the difference between the actual level <strong>of</strong> the indicator andthe standard. Setting single-customer standards means it is necessary to have measurement systemsat the single-customer level or for the customers themselves to claim compensati<strong>on</strong>.This secti<strong>on</strong> surveys different standards adopted by regulators, or imposed by laws, at the singlecustomerlevel, and the compensati<strong>on</strong> payments to customers in case the operator fails to meetthe single-customer standard. A summary <strong>of</strong> the most relevant issues c<strong>on</strong>cludes the secti<strong>on</strong>.2.4.1 Very l<strong>on</strong>g interrupti<strong>on</strong> standardsThere are fundamentally two groups <strong>of</strong> standards related to the maximum durati<strong>on</strong> <strong>of</strong> interrupti<strong>on</strong>sper single customer (see Table 2.10):· Maximum durati<strong>on</strong> for each unplanned interrupti<strong>on</strong>: this kind <strong>of</strong> standard is enforced in a significantnumber <strong>of</strong> countries (and in two further countries the regulators have proposals underc<strong>on</strong>siderati<strong>on</strong>), even if each country has its own definiti<strong>on</strong> and c<strong>on</strong>diti<strong>on</strong>s for enforcement;· Maximum yearly durati<strong>on</strong> <strong>of</strong> unplanned interrupti<strong>on</strong>s for the same c<strong>on</strong>necti<strong>on</strong> point: this kind<strong>of</strong> standard is applied in <strong>on</strong>ly a few countries.TABLE 2.10VERY LONG INTERRUPTION STANDARDS FOR SINGLE CUSTOMERSStandards <strong>on</strong> maximum durati<strong>on</strong> <strong>of</strong> each unplannedinterrupti<strong>on</strong>Standards <strong>on</strong> maximum yearly durati<strong>on</strong> <strong>of</strong> unplannedinterrupti<strong>on</strong> for the same c<strong>on</strong>necti<strong>on</strong> pointProposal stageN<strong>on</strong>eBE, CZ, EE, FI, FR, GB, HU, LTES, PL, PTIT, SEAT, GR, IE, LV53<str<strong>on</strong>g>Third</str<strong>on</strong>g> <str<strong>on</strong>g>Benchmarking</str<strong>on</strong>g> <str<strong>on</strong>g>Report</str<strong>on</strong>g> <strong>on</strong> <strong>Quality</strong> <strong>of</strong> <strong>Electricity</strong> <strong>Supply</strong> – 2005 · Chapter 2
Both types <strong>of</strong> single-customer standards related to maximum durati<strong>on</strong> <strong>of</strong> unplanned interrupti<strong>on</strong>sare generally linked to ec<strong>on</strong>omic compensati<strong>on</strong> for the affected customers, subject to some c<strong>on</strong>diti<strong>on</strong>s.Tables 2.11 and 2.12 compare the different single-customer standards related to maximumdurati<strong>on</strong> <strong>of</strong> unplanned interrupti<strong>on</strong>s.TABLE 2.11CONTINUITY SINGLE-CUSTOMER STANDARDS:maximum durati<strong>on</strong> <strong>of</strong> each unplanned interrupti<strong>on</strong>CountryStandardC<strong>on</strong>diti<strong>on</strong>sCompensati<strong>on</strong>AmountBE(Wall.)4 hoursExcepti<strong>on</strong>al events(force majeure) excludedEc<strong>on</strong>omic compensati<strong>on</strong> <strong>on</strong>request. After 4 hoursprovisi<strong>on</strong>al producti<strong>on</strong> has tobe installed.Damages <strong>on</strong>ly if interrupti<strong>on</strong>s aredistributor's faultCZLV cust: 18 hrsHV cust: 12 hrsExcepti<strong>on</strong>al events(force majeure) excludedOn request; must be claimedby the customer within5 working days10% from yearly payments fordistributi<strong>on</strong>, max. €150 for LV and€300 for HVEE20 hours (in the summertime)24 hours (in the wintertime);stricter standards will applyfrom 2008Excepti<strong>on</strong>al events(force majeure) excludedAutomatic for the three biggestdistributi<strong>on</strong> companies; <strong>on</strong>request for the othercompaniesLV
Observati<strong>on</strong> suggests that there is great disparity am<strong>on</strong>g single-customer standards related to themaximum durati<strong>on</strong> <strong>of</strong> unplanned interrupti<strong>on</strong>s. However, this disparity is not surprising, as manyfactors have to be c<strong>on</strong>sidered:· the compensati<strong>on</strong> amounts are <strong>of</strong>ten linked to the “excess time”, that is the difference betweenthe actual durati<strong>on</strong> <strong>of</strong> the interrupti<strong>on</strong> and the standard; thus, for instance, if there is large differencebetween the French standard (6 hours) and the British <strong>on</strong>e (18 hours for normalweather events), <strong>on</strong>e should also take into account the difference in the compensati<strong>on</strong>: inFrance, it is 2% <strong>of</strong> the power-dependent part <strong>of</strong> the tariff – a few euros for a domestic customer– and around 36 in Great Britain for the same type <strong>of</strong> customer;· in some countries the standards are differentiated according to voltage levels (Czech Republic,Spain and Portugal), type <strong>of</strong> territory (Spain and Portugal), seas<strong>on</strong> <strong>of</strong> the year (Est<strong>on</strong>ia) andtype <strong>of</strong> incident (Hungary); this hinders a simple comparis<strong>on</strong>, but it must be c<strong>on</strong>sidered that allthese differentiati<strong>on</strong>s are reas<strong>on</strong>able and have been introduced c<strong>on</strong>sidering a balancebetween simplificati<strong>on</strong> and a sense <strong>of</strong> reality;· for approximately half <strong>of</strong> the countries, compensati<strong>on</strong> is automatic; in the other half it is given at thecustomer’s request. This is a difference that has a great impact <strong>on</strong> the effectiveness <strong>of</strong> this kind <strong>of</strong>regulati<strong>on</strong>. In this regard <strong>on</strong>e should c<strong>on</strong>sider the case <strong>of</strong> Great Britain where the regulator(Ofgem), as part <strong>of</strong> the new price c<strong>on</strong>trol system starting 1 April 2005, has introduced a mechanismto encourage companies to be pro-active in making payments. The penalty to distributi<strong>on</strong> companies,where there is a failure under the normal, severe weather standard or the Highlands andIslands standard, is the same whether or not the customer claims. Where a company does notmake a payment to the customer, it will face an equivalent reducti<strong>on</strong> in its price c<strong>on</strong>trol revenue.TABLE 2.12CONTINUITY SINGLE-CUSTOMER STANDARDS:maximum yearly durati<strong>on</strong> <strong>of</strong> unplanned interrupti<strong>on</strong>sCountryStandardC<strong>on</strong>diti<strong>on</strong>sCompensati<strong>on</strong>AmountESMV CUST.: Urban: 4h/year;Suburban: 8h/yr; C<strong>on</strong>c. rural:12h/yr; Scat. rural: 16h/yr;LV CUST.: Urban: 6h/yearSuburban: 10h/yr; C<strong>on</strong>c. rural:15h/yr; Scat. rural: 20h/yrHV (>36KV) CUST.: 6h/yrExcepti<strong>on</strong>al events excluded(see list in Annex 1)AutomaticDiscount=PW*DH*5*P PW = billedannual average power DH = differencebetween the number <strong>of</strong>c<strong>on</strong>sumer interrupti<strong>on</strong> hours andthe hours fixed in the requiredstandards; P = kWh price for n<strong>on</strong>eligible customers, or P = poolkWh annual average hourly finalprice for eligiblesPLLV customers: 60 hours/yearOnly applicable to interrupti<strong>on</strong>sdue to the transmissi<strong>on</strong>service; Excepti<strong>on</strong>al eventsexcluded (see list in Annex 1)On customer's requestFor each undelivered unit <strong>of</strong> electricenergy, the customer shall beentitled to a discount equal to fivetimes the electric energy price forthe period <strong>of</strong> the interrupti<strong>on</strong>PTMV CUST.: Urban: 4h/year;Suburban: 8h/yr; Rural: 16h/yr;LV CUST.: Urban: 6h/year;Suburban: 10h/yr; Rural: 20h/yrHV (>36KV) CUST.: 4h/yrExcluding all interrupti<strong>on</strong> dueto fortuitous reas<strong>on</strong>s or forcemajeure, public interest,service reas<strong>on</strong>s, safety reas<strong>on</strong>s,agreements with thecustomer and circumstancesattributable to the customer.AutomaticCompensati<strong>on</strong> depends <strong>on</strong> thestandard, the actual durati<strong>on</strong> <strong>of</strong>the interrupti<strong>on</strong>s registered foreach costumer, the voltage leveland the c<strong>on</strong>tracted power55<str<strong>on</strong>g>Third</str<strong>on</strong>g> <str<strong>on</strong>g>Benchmarking</str<strong>on</strong>g> <str<strong>on</strong>g>Report</str<strong>on</strong>g> <strong>on</strong> <strong>Quality</strong> <strong>of</strong> <strong>Electricity</strong> <strong>Supply</strong> – 2005 · Chapter 2
As shown in Tables 2.11 and 2.12, in all but <strong>on</strong>e case standards related to the maximum durati<strong>on</strong><strong>of</strong> interrupti<strong>on</strong> are <strong>on</strong>ly applicable outside force majeure c<strong>on</strong>diti<strong>on</strong>s. The <strong>on</strong>ly <strong>on</strong>e case where asingle-customer c<strong>on</strong>tinuity standard applies even in case <strong>of</strong> excepti<strong>on</strong>al events is Great Britain, asindicated in Additi<strong>on</strong>al informati<strong>on</strong> 2.6.ADDITIONAL INFORMATION 2.6 – SEVERE WEATHER STANDARDS IN GREAT BRITAINOfgem has set different standards for the maximum durati<strong>on</strong> <strong>of</strong> unplanned interrupti<strong>on</strong>s. These arerelated to normal and severe weather c<strong>on</strong>diti<strong>on</strong>s respectively and apply to the whole <strong>of</strong> GB exceptfor the Highlands and Islands <strong>of</strong> Scotland. These areas <strong>of</strong> Scotland are covered by a separatestandard, which includes an exempti<strong>on</strong> for paying compensati<strong>on</strong> for severe weather, but customersmay request a review if they feel that compensati<strong>on</strong> was withheld unreas<strong>on</strong>ably. To get a compensati<strong>on</strong>,customers must claim compensati<strong>on</strong> under each <strong>of</strong> these standards.The following table explains how the excepti<strong>on</strong>al events are classified and the different levels <strong>of</strong> standards.For very large events the standard depends up<strong>on</strong> the actual number <strong>of</strong> customers affected.Category <strong>of</strong> weather Definiti<strong>on</strong> StandardNormal weatherCategory 1(medium events)Category 2 (large events)< 8 times daily mean faults at higher voltage.Lightning events ( 8 times daily mean faults athigher voltage and less than 35% <strong>of</strong> exposedcustomers affected)N<strong>on</strong>-lightning events ( 8 times and < 13 dailymean faults at higher voltage and less than35% <strong>of</strong> exposed customers affected)N<strong>on</strong>-lightning events ( 13 times daily meanfaults at higher voltage and less than 35% <strong>of</strong>exposed customers affected)<strong>Supply</strong> must be restored within 18 hours,subject to certain exempti<strong>on</strong>s, otherwisea payment must be made<strong>Supply</strong> must be restored within 24 hours, subjectto certain exempti<strong>on</strong>s, otherwise a paymentmust be made<strong>Supply</strong> must be restored within 48 hours,subject to certain exempti<strong>on</strong>s, otherwise apayment must be madeCategory 3 (very largeevents)Any severe weather events whereexposed customers are affected35% <strong>of</strong><strong>Supply</strong> must be restored within the periodcalculated using the following formula:2total number <strong>of</strong> customers interrupted48 x( category 3 threshold number <strong>of</strong> customers )Certain exempti<strong>on</strong>s apply to these Guaranteed Standards. For example, all distributi<strong>on</strong> operatorsaffected by a category 3 (very large) severe weather event will be exempt from paying customerscompensati<strong>on</strong> for that event if any <strong>of</strong> the Distributi<strong>on</strong> Network Operators (DNOs) affected by theevent have more than 60 per cent <strong>of</strong> exposed customers <strong>of</strong>f supply. Exposed customers are definedas customers supplied by mixed or overhead higher voltage circuits (i.e. those customers who maybe affected by a severe weather event.) There are also a number <strong>of</strong> more general exempti<strong>on</strong>s. Forexample, an exempti<strong>on</strong> applies if the government has invoked emergency powers.The importance <strong>of</strong> the subject <strong>of</strong> customer protecti<strong>on</strong> in case <strong>of</strong> very l<strong>on</strong>g interrupti<strong>on</strong>s is witnessedalso by the fact that in both countries where regulators have recently submitted proposals(Italy and Sweden), the proposal is focused precisely <strong>on</strong> excepti<strong>on</strong>al events.56Council <strong>of</strong> European Energy Regulators – Ref: C05-QOS-01-03
2.4.2 Multiple interrupti<strong>on</strong> standardsThere are fundamentally three groups <strong>of</strong> standards related to the maximum number <strong>of</strong> unplannedinterrupti<strong>on</strong>s per single customer:· Maximum yearly number <strong>of</strong> l<strong>on</strong>g interrupti<strong>on</strong>s per single customer;· Maximum yearly number <strong>of</strong> short interrupti<strong>on</strong>s per single customer;Maximum yearly number <strong>of</strong> interrupti<strong>on</strong>s (l<strong>on</strong>g+short) per single customer.·The “multiple interrupti<strong>on</strong> standards” require a great effort for c<strong>on</strong>tinuity measurement at the individuallevel, as the distributor must know for each customer the actual number <strong>of</strong> interrupti<strong>on</strong>s inorder to verify the standard at the end <strong>of</strong> the year. This explains why not many countries have introducedthis kind <strong>of</strong> standard and also why in some countries this type <strong>of</strong> standard is not applicableto LV customers, due to difficulties in precisely identifying affected customers at a low voltage level.Moreover, standards for short interrupti<strong>on</strong>s are still very rare, although the subject <strong>of</strong> short interrupti<strong>on</strong>sis <strong>of</strong> growing interest to regulators. So far, there are standards for short interrupti<strong>on</strong>s <strong>on</strong>lyin France. These multiple short interrupti<strong>on</strong> standards have not been set by the regulator but arec<strong>on</strong>tained in c<strong>on</strong>tracts between the distributi<strong>on</strong> and transmissi<strong>on</strong> operators and their customers.As is the case for “very l<strong>on</strong>g interrupti<strong>on</strong> standards” (see the previous paragraph), the “multipleinterrupti<strong>on</strong> standards” show a great variety both in terms <strong>of</strong> thresholds and compensati<strong>on</strong>; in allcases, there are restricti<strong>on</strong>s <strong>on</strong> applicability. The most frequent restricti<strong>on</strong>s are exclusi<strong>on</strong> <strong>of</strong> interrupti<strong>on</strong>sdue to force majeure and to the transmissi<strong>on</strong> network and special treatment for re-interrupti<strong>on</strong>s,i.e. interrupti<strong>on</strong>s that occur within a short time lag from the previous outage (generallydue to acti<strong>on</strong>s <strong>on</strong> the network for restoring the first interrupti<strong>on</strong>).Multiple interrupti<strong>on</strong> standard thresholds are in most cases differentiated according to the type <strong>of</strong> territory(urban/suburban/rural). On the <strong>on</strong>e hand, this is rati<strong>on</strong>al as the number <strong>of</strong> yearly interrupti<strong>on</strong>sthat affect a single customer depends a lot <strong>on</strong> the structure <strong>of</strong> the circuits to which the customer isc<strong>on</strong>nected, and therefore depends highly <strong>on</strong> the type <strong>of</strong> territory and the density <strong>of</strong> load. On the otherhand, the different groups used to classify territories hinder a simple comparis<strong>on</strong> (see Table 2.13).The comparis<strong>on</strong> shows large differences am<strong>on</strong>g the thresholds, ranging from 2 to 8 l<strong>on</strong>g interrupti<strong>on</strong>sper year for customers in urban c<strong>on</strong>texts, and from 5 to more than 20 l<strong>on</strong>g interrupti<strong>on</strong>sper year for customers in rural c<strong>on</strong>texts. The large differences am<strong>on</strong>g EU countries even for territories<strong>of</strong> relatively homogeneous density can be <strong>on</strong>ly partly explained by differences in the networkstructure, and are probably due to different regulatory approaches in setting standards. Apossible approach for regulators setting multiple interrupti<strong>on</strong> standards could involve looking at agiven percentage <strong>of</strong> worst-served customers: in Italy, for instance, multiple interrupti<strong>on</strong> standardshave been set in c<strong>on</strong>siderati<strong>on</strong> <strong>of</strong> customers above the 90 th percentile in terms <strong>of</strong> number <strong>of</strong> l<strong>on</strong>gunplanned interrupti<strong>on</strong>s during the year.There is a wide range <strong>of</strong> possibilities for compensati<strong>on</strong> in case multiple interrupti<strong>on</strong> standards arenot met. Not <strong>on</strong>ly can compensati<strong>on</strong> be either at the customer’s request or automatic, but also thestructure and amount <strong>of</strong> compensati<strong>on</strong> varies a lot from <strong>on</strong>e country to another.57<str<strong>on</strong>g>Third</str<strong>on</strong>g> <str<strong>on</strong>g>Benchmarking</str<strong>on</strong>g> <str<strong>on</strong>g>Report</str<strong>on</strong>g> <strong>on</strong> <strong>Quality</strong> <strong>of</strong> <strong>Electricity</strong> <strong>Supply</strong> – 2005 · Chapter 2
In France, the customer claims for damages and the compensati<strong>on</strong> can cover the actual damagesincurred, subject to technical verificati<strong>on</strong>. In all other countries, except Great Britain, compensati<strong>on</strong>depends <strong>on</strong> the applicable standard, the actual number <strong>of</strong> interrupti<strong>on</strong>s and the c<strong>on</strong>tracted power.From <strong>on</strong>e country to the next, the unit value for interrupted kW is quite varied. In Great Britain thecompensati<strong>on</strong> is fixed, due to the fact that the regulator introduced the multiple interrupti<strong>on</strong> standardprincipally aiming at protecting domestic customers and smaller business customers, sincelarge business customers have other means to limit the impact <strong>of</strong> single or multiple power cuts. InItaly, the right to compensati<strong>on</strong> depends <strong>on</strong> the customer’s compliance with technical requirementsset by the regulator, which focus <strong>on</strong> the protecti<strong>on</strong> <strong>of</strong> customers’ equipment in order to avoid faultsleading to network interrupti<strong>on</strong>s that will affect other customers c<strong>on</strong>nected to the line.TABLE 2.13MULTIPLE INTERRUPTION STANDARDSCountryStandard (interr/year)C<strong>on</strong>diti<strong>on</strong>sCompensati<strong>on</strong>AmountESL<strong>on</strong>g interrupti<strong>on</strong>s:MV CUST.: urban: 8; Suburban: 12;C<strong>on</strong>centrated rural: 15; Scatterdrural: 20; LV CUST: urban: 12;Suburban: 15; C<strong>on</strong>c. rural: 18;Scat. rural: 24; HV (>36kV): 8Excepti<strong>on</strong>al events excludedAutomaticDiscount=PW*H*P*DN/8;H = number <strong>of</strong> interrupti<strong>on</strong> hours;DN= difference between the actualnumber <strong>of</strong> interrupti<strong>on</strong>s and theapplicable standard; PW: c<strong>on</strong>tractualpower; P: see table.2.12FRL<strong>on</strong>g interrupti<strong>on</strong>s:MV CUST: urban: 2; suburban: 3;rural: 3; rural scattered: 6;LV CUST: no standardShort interrupti<strong>on</strong>s: MV CUST.:urban: 2; suburban: 3; rural: 10;rural scattered: 30; LV CUST.: nostandard; L<strong>on</strong>g+short interrupti<strong>on</strong>s:MV CUST.: <strong>on</strong> request,customised standardExcepti<strong>on</strong>al events excludedOn request and <strong>on</strong>ly if thereare damagesAmount <strong>of</strong> claimed damagesGBInterrupti<strong>on</strong>s l<strong>on</strong>ger than 3 hoursAll customers: 3Excepti<strong>on</strong>al events excluded;interrupti<strong>on</strong>s with morethan 0,5 Mill.; customersinterrupted; transmissi<strong>on</strong>interr. excludedOn request£50 (not differentiated)ITL<strong>on</strong>g interrupti<strong>on</strong>s; HV CUST.: 1 Excepti<strong>on</strong>al events excluded;reinterrupti<strong>on</strong>swithin 1interr./yr; MV CUST.: high density: 3;medium density 4; low density 5; hour excluded; transmissi<strong>on</strong>LV CUST.: no standardinterr. excludedAutomatic, subject to c<strong>on</strong>diti<strong>on</strong>s(technical requirementsfor selectivity <strong>of</strong>customer's protecti<strong>on</strong>s)Compensati<strong>on</strong> =0,7*PW*DN*Vp;PW c<strong>on</strong>tractualpower, DN difference betweenactual number <strong>of</strong> interrupti<strong>on</strong>s andstandard; Vp= 2,5€/kW for MV upto 500 kW; 2€/kW over 500 kWPTL<strong>on</strong>g interrupti<strong>on</strong>s; HV CUST.: 8;MV CUST.: z<strong>on</strong>e A: 8; z<strong>on</strong>e B: 18;z<strong>on</strong>e C: 30; LV CUST.: z<strong>on</strong>e A: 12;z<strong>on</strong>e B: 23; z<strong>on</strong>e C: 36Same exclusi<strong>on</strong> as formaximum yearly durati<strong>on</strong> <strong>of</strong>unplanned interrupti<strong>on</strong>s(see table 2.12).AutomaticCompensati<strong>on</strong> depends <strong>on</strong> applicablestandard, actual number <strong>of</strong>interrupti<strong>on</strong>s and c<strong>on</strong>tractedpower(*) L<strong>on</strong>g interrupti<strong>on</strong>s: interrupti<strong>on</strong>s l<strong>on</strong>ger than 3 minutes. Short interrupti<strong>on</strong>s: interrupti<strong>on</strong>s l<strong>on</strong>ger than 1 sec<strong>on</strong>d andless than 3 minutes.58Council <strong>of</strong> European Energy Regulators – Ref: C05-QOS-01-03
2.4.3 Single-customer standards related to planned interrupti<strong>on</strong>sIn some countries there are single-customer standards associated with planned interrupti<strong>on</strong>s.These take two basic forms:· Single-customer standards related to number and/or durati<strong>on</strong> <strong>of</strong> planned interrupti<strong>on</strong>s;Single-customer standards related to advance notice for planned interrupti<strong>on</strong>s.·The most interesting cases are the following:· In France, MV customers must not suffer more than 2 planned interrupti<strong>on</strong>s per year and eachplanned interrupti<strong>on</strong> cannot last more than 4 hours; both MV customers and LV customerswith c<strong>on</strong>tracts for more than 36 kVA must receive, for each planned interrupti<strong>on</strong>, a notice atleast 10 days in advance (with date, time and durati<strong>on</strong> <strong>of</strong> works); for LV customers the maximumdurati<strong>on</strong> <strong>of</strong> planned interrupti<strong>on</strong>s is 10 hours/interrupti<strong>on</strong>. As for multiple interrupti<strong>on</strong>standards, if the company fails to meet the standard, compensati<strong>on</strong> is paid up<strong>on</strong> request but<strong>on</strong>ly in the amount <strong>of</strong> actual damages incurred.· In Great Britain, customers must be given at least 2 days notice; a compensati<strong>on</strong> payment <strong>of</strong>£20 for domestic customers or £40 for n<strong>on</strong>-domestic is foreseen in case this standard is notfulfilled (<strong>on</strong> customer’s request).· In Poland, in the event <strong>of</strong> a failure to individually notify customers supplied from a grid with anominal voltage higher than 1 kV, in writing, by teleph<strong>on</strong>e or via other means <strong>of</strong> telecommunicati<strong>on</strong>,at least five days in advance, <strong>of</strong> the dates and durati<strong>on</strong> <strong>of</strong> the planned interrupti<strong>on</strong>s inthe supply <strong>of</strong> electricity, the charge will amount to 151,83 zlotys (around €38).· In Belgium (Wallo<strong>on</strong>) if the planned interrupti<strong>on</strong> lasts more than 4 hours, the distributor mustprovide temporary generati<strong>on</strong>.In some countries (like for instance Est<strong>on</strong>ia), there are some overall standard <strong>on</strong> planned interrupti<strong>on</strong>sbut no compensati<strong>on</strong>s are foreseen in case <strong>of</strong> standard breaching.2.4.4 Single-customer standards for the transmissi<strong>on</strong> networkThere are <strong>on</strong>ly a few countries with single-customer standards for transmissi<strong>on</strong> users (i.e. distributors,customers directly c<strong>on</strong>nected to the transmissi<strong>on</strong> grid and producti<strong>on</strong> plants):· In France, the transmissi<strong>on</strong> operator sets standards for both short and l<strong>on</strong>g interrupti<strong>on</strong>s for eachtransmissi<strong>on</strong> user; the standards are based <strong>on</strong> historic performances, taking into account theactual performance in the last 4 years for each customer (see additi<strong>on</strong>al informati<strong>on</strong> 2.7 below);· In Est<strong>on</strong>ia, the yearly durati<strong>on</strong> <strong>of</strong> unplanned interrupti<strong>on</strong>s per c<strong>on</strong>necti<strong>on</strong> point to the transmissi<strong>on</strong>grid cannot exceed to 240 hours; this standard will be reduced to 200 hours from2008 and to 150 hours from 2011. Furthermore, each interrupti<strong>on</strong> in the transmissi<strong>on</strong> gridmust be eliminated within 12 hours (within 10 hours from 2008 and 8 hours from 2011). If theinterrupti<strong>on</strong> time exceeds the standards, the network tariff will be reduced through a compensati<strong>on</strong><strong>of</strong> around 2,5 €/kW multiplied the greatest hourly power in the c<strong>on</strong>necti<strong>on</strong> point in theprevious year.59<str<strong>on</strong>g>Third</str<strong>on</strong>g> <str<strong>on</strong>g>Benchmarking</str<strong>on</strong>g> <str<strong>on</strong>g>Report</str<strong>on</strong>g> <strong>on</strong> <strong>Quality</strong> <strong>of</strong> <strong>Electricity</strong> <strong>Supply</strong> – 2005 · Chapter 2
·In Portugal, for each client c<strong>on</strong>nected to the EHV grid (nominal voltage equal or higher than230 kV), the yearly durati<strong>on</strong> <strong>of</strong> unplanned interrupti<strong>on</strong>s is 45 minutes and the yearly number<strong>of</strong> interrupti<strong>on</strong>s is 3. The standard c<strong>on</strong>siders l<strong>on</strong>g interrupti<strong>on</strong>s and excludes interrupti<strong>on</strong>s dueto fortuitous reas<strong>on</strong>s or force majoure, public interest, service reas<strong>on</strong>s, safety reas<strong>on</strong>s, agreementswith the customer and facts attributable to the customer.ADDITIONAL INFORMATION 2.7 – TRANSMISSION CONTRACTUAL LEVELS IN FRANCEIn France, the transmissi<strong>on</strong> operator RTE calculates the c<strong>on</strong>tinuity c<strong>on</strong>tractual level for each transmissi<strong>on</strong>user both for l<strong>on</strong>g and short interrupti<strong>on</strong>s; the maximum yearly number <strong>of</strong> both l<strong>on</strong>g andshort unplanned interrupti<strong>on</strong>s depends <strong>on</strong> the historical performance <strong>of</strong> the site (over the 4 previousyears) and is calculated as described below:First, RTE calculates, for l<strong>on</strong>g interrupti<strong>on</strong>s, a value E LI:(MaxLI over 4 years)+(RealisedLI year n-1)+(RealisedLI year n-2)E LI=3where:· (MaxLI over 4 years) is the maximum number <strong>of</strong> l<strong>on</strong>g interrupti<strong>on</strong>s (LI) recorded during the last4 years;· (RealisedLI year n-1) and (RealisedLI year n-2) are the numbers <strong>of</strong> l<strong>on</strong>g interrupti<strong>on</strong>s recordedrespectively during the previous year and 2 years ago.Depending <strong>on</strong> the value <strong>of</strong> ELI, RTE determines the c<strong>on</strong>tractual standard, which is the maximumnumber <strong>of</strong> l<strong>on</strong>g interrupti<strong>on</strong>s, as shown in the following table:E LIStandard for l<strong>on</strong>g interrupti<strong>on</strong>sE LI= 0E LI= 0,33E LI0,661 l<strong>on</strong>g interrupti<strong>on</strong> over 3 years2 l<strong>on</strong>g interrupti<strong>on</strong>s over 3 years1 l<strong>on</strong>g interrupti<strong>on</strong> per yearThe maximum yearly number <strong>of</strong> short unplanned interrupti<strong>on</strong>s depends <strong>on</strong> the historical performance<strong>of</strong> the site (over the 4 previous years) in a similar way, according to the parameter E SI:(MaxSI over 4 years)+(RealisedSI year n-1)+(RealisedSI year n-2)E SI=3Depending <strong>on</strong> the value <strong>of</strong> ESI, RTE determines the c<strong>on</strong>tractual standard, which is the maximumnumber <strong>of</strong> short interrupti<strong>on</strong>s, as shown in the following table:60Council <strong>of</strong> European Energy Regulators – Ref: C05-QOS-01-03
E SIStandard for l<strong>on</strong>g interrupti<strong>on</strong>sE SI= 0E SI= 0,33E SI= 0,661 E SI1,662 E SI2,663 E SI3,66E SI41 short interrupti<strong>on</strong> over 3 years2 short interrupti<strong>on</strong>s over 3 years1 short interrupti<strong>on</strong> per year2 short interrupti<strong>on</strong>s per year3 short interrupti<strong>on</strong>s per year4 short interrupti<strong>on</strong>s per year5 short interrupti<strong>on</strong>s per yearIf the previous rule (based <strong>on</strong> historical performance and giving the maximum number <strong>of</strong> l<strong>on</strong>g andshort interrupti<strong>on</strong>s) gives the result <strong>of</strong> 1 l<strong>on</strong>g interrupti<strong>on</strong> over 3 years and 1 short interrupti<strong>on</strong> over3 years, the c<strong>on</strong>tractual standard becomes 2 interrupti<strong>on</strong>s (l<strong>on</strong>g and/or short) over 3 years.The customer can also ask RTE for an arrangement <strong>on</strong> short+l<strong>on</strong>g interrupti<strong>on</strong>s or other customizedarrangements. This calculati<strong>on</strong> method is the normal arrangement for transmissi<strong>on</strong> c<strong>on</strong>tracts;a customized arrangement is used for distributi<strong>on</strong> c<strong>on</strong>tracts.2.4.5 Findings III: single-customer c<strong>on</strong>tinuity standardsIR#9: A significant number <strong>of</strong> countries have introduced (or are going to introduce) c<strong>on</strong>tinuitystandards for the maximum durati<strong>on</strong> <strong>of</strong> interrupti<strong>on</strong>s (see Table 2.10, 2.11 and 2.12) . This is animportant form <strong>of</strong> customer protecti<strong>on</strong>, especially if there are automatic compensati<strong>on</strong> paymentswhen companies fail to meet standards.IR#10: In some countries there are quality standards related to the maximum yearly number <strong>of</strong>unplanned interrupti<strong>on</strong>s per single customer (see Table 2.13). The standards have various c<strong>on</strong>diti<strong>on</strong>sand some exclusi<strong>on</strong>s apply; moreover, in some countries this type <strong>of</strong> standard is not applicable to LVcustomers, due to difficulties in precisely identifying affected customers at low voltage levels.IR#11: Although customer research suggests that the impact <strong>of</strong> interrupti<strong>on</strong>s where customers hadbeen given advance notice is less than unplanned interrupti<strong>on</strong>s, standards regarding plannedinterrupti<strong>on</strong>s can be useful to compel distributi<strong>on</strong> network operators to plan their maintenance workin a way that inc<strong>on</strong>veniences c<strong>on</strong>sumers as little as possible.IR#12: Transmissi<strong>on</strong> regulati<strong>on</strong> is still at a very early stage <strong>of</strong> development. There are <strong>on</strong>ly c<strong>on</strong>tractualc<strong>on</strong>tinuity standards for the transmissi<strong>on</strong> network’s customers in <strong>on</strong>e country (see Additi<strong>on</strong>al informati<strong>on</strong>2.7). This should not be regarded as a priority area for regulators approaching quality regulati<strong>on</strong>issues for the first time, as protecti<strong>on</strong> <strong>of</strong> c<strong>on</strong>sumers c<strong>on</strong>nected to distributi<strong>on</strong> networks is a higherpriority. In any case, the regulati<strong>on</strong> <strong>of</strong> quality for transmissi<strong>on</strong> must be c<strong>on</strong>sistent with the transmissi<strong>on</strong>tariff system (in some cases transmissi<strong>on</strong> tariffs are not at all or not entirely subject to price caps).61<str<strong>on</strong>g>Third</str<strong>on</strong>g> <str<strong>on</strong>g>Benchmarking</str<strong>on</strong>g> <str<strong>on</strong>g>Report</str<strong>on</strong>g> <strong>on</strong> <strong>Quality</strong> <strong>of</strong> <strong>Electricity</strong> <strong>Supply</strong> – 2005 · Chapter 2
2.5 C<strong>on</strong>clusi<strong>on</strong>s: recommendati<strong>on</strong>s for future work <strong>on</strong> <strong>Quality</strong> Regulati<strong>on</strong>The following recommendati<strong>on</strong>s are made to regulators who want to introduce quality regulati<strong>on</strong>with an incentive/penalty mechanism. It is important to c<strong>on</strong>sider that setting such a mechanism fordistributi<strong>on</strong> or transmissi<strong>on</strong> companies is delicate, for ec<strong>on</strong>omic, technical and political reas<strong>on</strong>s.This advice comes from experienced countries which already have set up an incentive system forquality regulati<strong>on</strong> and which know the c<strong>on</strong>sequences, advantages and disadvantages <strong>of</strong> such amechanism. The following recommendati<strong>on</strong>s also take into account the different regulators’ points<strong>of</strong> views toward electricity service quality, what they expect for the future and how they want tomanage it, as collected through questi<strong>on</strong>naires.Although this advice is important to follow in order to prevent unintended effects, the quality regulati<strong>on</strong>system adopted in <strong>on</strong>e specific country might not be applicable in others, because <strong>of</strong> manydifferent c<strong>on</strong>diti<strong>on</strong>s (electricity network features, meteorological c<strong>on</strong>diti<strong>on</strong>s, ec<strong>on</strong>omic situati<strong>on</strong>,degree <strong>of</strong> companies’ privatisati<strong>on</strong>, customers’ willingness to pay for better quality, customer satisfacti<strong>on</strong>,and so <strong>on</strong>). Indeed, a quality regulati<strong>on</strong> system needs to be set up by the country itself,c<strong>on</strong>sidering all its country-specific factors.1. C<strong>on</strong>tinuity measurement rules: It is absolutely necessary to collect reliable and robust datafor due time before introducing any type <strong>of</strong> c<strong>on</strong>tinuity standards or incentive regime. It is str<strong>on</strong>glyrecommended to set measurement rules that can assess separately the different types <strong>of</strong>interrupti<strong>on</strong>s, m<strong>on</strong>itoring at least planned and unplanned interrupti<strong>on</strong>s, the latter at least dividedbetween l<strong>on</strong>g and short <strong>on</strong>es. It is also highly recommended that regulators define their ownguidelines for recording interrupti<strong>on</strong>s, or approve the procedures <strong>of</strong> the regulated companies, atleast with respect to the definiti<strong>on</strong> <strong>of</strong> force majeure and the assessment <strong>of</strong> customers affectedby each interrupti<strong>on</strong>. It is known that <strong>on</strong>ce recording protocols are introduced, the indicators canworsen due to the fact that all interrupti<strong>on</strong>s are taken into account.2. Audits <strong>on</strong> c<strong>on</strong>tinuity data: The guidance for recording interrupti<strong>on</strong>s should be regarded as apreliminary step towards more diffuse regulatory auditing <strong>on</strong> the c<strong>on</strong>tinuity data provided by distributi<strong>on</strong>and transmissi<strong>on</strong> companies. Measurement rules and audit procedures become moreimportant when some kind <strong>of</strong> ec<strong>on</strong>omic incentive or disincentive is used to promote c<strong>on</strong>tinuity<strong>of</strong> supply enhancement. It is str<strong>on</strong>gly recommended that regulators who introduceincentive/penalty regimes and/or guaranteed standards <strong>on</strong> c<strong>on</strong>tinuity <strong>of</strong> supply set obligati<strong>on</strong>sfor auditing and actually do audits in order to check that all interrupti<strong>on</strong>s are taken into accountin c<strong>on</strong>tinuity indicators and that there is no abuse <strong>of</strong> exclusi<strong>on</strong>s.3. Complete c<strong>on</strong>tinuity indicators: As interrupti<strong>on</strong>s can originate at all voltage levels, <strong>on</strong>ly c<strong>on</strong>tinuityindicators that c<strong>on</strong>tain all voltage levels wholly represent the situati<strong>on</strong> from the customerviewpoint. Regulators are advised to move towards c<strong>on</strong>tinuity indicators where all voltage levelsare included. In order to introduce incentives, it is necessary to include at least medium andhigher voltage levels, even if LV interrupti<strong>on</strong>s can be a major issue in urban areas. In order to62Council <strong>of</strong> European Energy Regulators – Ref: C05-QOS-01-03
introduce single-customer standards, it’s str<strong>on</strong>gly recommended to measure c<strong>on</strong>tinuity <strong>of</strong> supplyaccording to the customer’s viewpoint, which means that interrupti<strong>on</strong>s at every voltage levelshould be recorded.4. Incentive/penalty regimes for c<strong>on</strong>tinuity: Regulators have a str<strong>on</strong>g interest in introducingincentive/penalty regimes that counterbalance the cost cutting trend <strong>of</strong> price-cap regulati<strong>on</strong> inorder to avoid unintended effects <strong>on</strong> quality <strong>of</strong> service, especially c<strong>on</strong>tinuity <strong>of</strong> supply. Theexamples <strong>of</strong> incentive/penalty regimes already enforced for several years show that extremelygood results can be obtained. It is recommended that each country develop its own incentive/penaltyregime taking into account its specific c<strong>on</strong>diti<strong>on</strong>s as regards, for instance, networkdevelopment, investment levels, regi<strong>on</strong>al differences and automati<strong>on</strong> projects. It is highly advisablefor incentive/penalty regimes to be subject to regular periodic review and for results to beevaluated in light <strong>of</strong> the benefits and costs for final c<strong>on</strong>sumers.5. Customer research: The introducti<strong>on</strong> <strong>of</strong> incentive/penalty regimes will require more customerresearch, especially <strong>on</strong> the customers’ willingness to pay for c<strong>on</strong>tinuity improvement. Countryspecificissues are very relevant to customer research, but it would be best to follow comm<strong>on</strong>research methodologies or at least share ideas about how such research can be improved.6. Multiple interrupti<strong>on</strong> standards: Standards related to the maximum yearly number <strong>of</strong>unplanned interrupti<strong>on</strong>s can be seen as a very useful regulatory signal for structural investment<strong>on</strong> the distributi<strong>on</strong> networks, and can also have potential benefits for LV customers even if thestandards apply <strong>on</strong>ly to MV customers, as the MV network is generally resp<strong>on</strong>sible for mostinterrupti<strong>on</strong>s per customer. This type <strong>of</strong> standard requires a measurement system with indicatorsevaluated for each customer subject to the standards; it is therefore advisable to adopt agradual approach, for instance starting with HV and MV customers.7. Very l<strong>on</strong>g interrupti<strong>on</strong> standards and severe weather c<strong>on</strong>diti<strong>on</strong>s: As most <strong>of</strong> the “veryl<strong>on</strong>g” interrupti<strong>on</strong>s are due to the impact <strong>of</strong> atmospheric phenomena <strong>on</strong> overhead circuits, it isstr<strong>on</strong>gly recommended that regulators establish a precise definiti<strong>on</strong> <strong>of</strong> “force majeure” or set upmechanisms (like the British <strong>on</strong>e) for differentiating maximum durati<strong>on</strong> standards according tothe severity <strong>of</strong> weather c<strong>on</strong>diti<strong>on</strong>s. It is worth menti<strong>on</strong>ing that, due the different objectives <strong>of</strong> thetwo regulatory regimes, different approaches can be used for treating excepti<strong>on</strong>al events forthe incentive/penalty regimes and for Guaranteed Standards.63<str<strong>on</strong>g>Third</str<strong>on</strong>g> <str<strong>on</strong>g>Benchmarking</str<strong>on</strong>g> <str<strong>on</strong>g>Report</str<strong>on</strong>g> <strong>on</strong> <strong>Quality</strong> <strong>of</strong> <strong>Electricity</strong> <strong>Supply</strong> – 2005 · Chapter 2
CHAPTER 3 – Standards in Commercial <strong>Quality</strong> Regulati<strong>on</strong>CONTENT3.1. What is Commercial <strong>Quality</strong>? Why regulate Commercial <strong>Quality</strong>? 673.2. Commercial <strong>Quality</strong> Questi<strong>on</strong>naire 693.2.1 Scope <strong>of</strong> the Questi<strong>on</strong>naire regarding Commercial <strong>Quality</strong> 693.2.2 Data Availability 703.2.3 Answers to Questi<strong>on</strong>naire 703.2.4 Analysis 723.2.5 Kinds <strong>of</strong> Standards <strong>of</strong> Commercial <strong>Quality</strong> 743.2.6 Layout methodology 743.3. Standards (expectati<strong>on</strong>s) and actual levels <strong>of</strong> Commercial <strong>Quality</strong> 753.3.1 C<strong>on</strong>necti<strong>on</strong> <strong>of</strong> the customer to the network 753.3.2 Restorati<strong>on</strong>/disc<strong>on</strong>necti<strong>on</strong> <strong>of</strong> supply 783.3.3 Problems associated with voltage and metering 793.3.4 Customer c<strong>on</strong>tact in writing 803.3.5 Customer c<strong>on</strong>tact in pers<strong>on</strong> 823.3.6 Customer c<strong>on</strong>tact by ph<strong>on</strong>e 843.3.7 Customer complaints 853.3.8 Meter reading, billing 863.4 Standards (expectati<strong>on</strong>s) and actual levels <strong>of</strong> Commercial <strong>Quality</strong>related to transmissi<strong>on</strong> 883.4.1. Applied standards 883.4.2 Facts <strong>of</strong> the commercial quality indicators 893.5. C<strong>on</strong>clusi<strong>on</strong>s and recommendati<strong>on</strong>s 89Annex to Chapter 3A 129Annex to Chapter 3B 13565<str<strong>on</strong>g>Third</str<strong>on</strong>g> <str<strong>on</strong>g>Benchmarking</str<strong>on</strong>g> <str<strong>on</strong>g>Report</str<strong>on</strong>g> <strong>on</strong> <strong>Quality</strong> <strong>of</strong> <strong>Electricity</strong> <strong>Supply</strong> – 2005 · Chapter 3
STANDARDS IN COMMERCIAL QUALITY REGULATION3.1 What is Commercial <strong>Quality</strong>? Why regulate Commercial <strong>Quality</strong>?Commercial quality relates to the nature and quality <strong>of</strong> customer service provided to electricitycustomers. In a liberalized electricity market this is more complex by the fact that supply and distributi<strong>on</strong>are separated (the customer may not be served by a single integrated electricity utilitybut rather by separate distributi<strong>on</strong> and supply companies). This is a distincti<strong>on</strong> which is not alwaysclear from the customers’ perspective. This separati<strong>on</strong> <strong>of</strong> activities will be more and more comm<strong>on</strong>with the applicati<strong>on</strong> <strong>of</strong> the unbundling rules as the customer shall c<strong>on</strong>clude either a singlec<strong>on</strong>tract with the supplier or separate c<strong>on</strong>tracts with the supplier and the DSO. In both relati<strong>on</strong>scommercial quality is an important issue.Commercial quality is directly associated with transacti<strong>on</strong>s between electricity companies (bothDSOs and Suppliers) and customers. The transacti<strong>on</strong>s include not <strong>on</strong>ly the distributi<strong>on</strong>/transmissi<strong>on</strong>and sale <strong>of</strong> electricity, but also the c<strong>on</strong>tacts established between electricity companies andcustomers. Before the beginning <strong>of</strong> supply several transacti<strong>on</strong>s occur between a potential customerand the DSO, such as c<strong>on</strong>necti<strong>on</strong> and meter installati<strong>on</strong>. These and later transacti<strong>on</strong>s duringthe c<strong>on</strong>tract can be made subject to a set <strong>of</strong> relevant quality factors which determine a network-and/or supplier company’s commercial quality performance.Commercial transacti<strong>on</strong>s between an electricity company and a customer may be classified asfollows:··Transacti<strong>on</strong>s related to c<strong>on</strong>diti<strong>on</strong>s <strong>of</strong> distributi<strong>on</strong> and supply for new c<strong>on</strong>necti<strong>on</strong> such asinformati<strong>on</strong> <strong>on</strong> c<strong>on</strong>necti<strong>on</strong> to the network and prices associated with the supply. These transacti<strong>on</strong>soccur before the supply c<strong>on</strong>tract comes into force and incorporate transacti<strong>on</strong>s bothwith the DSO and the supplier. Generally, customer rights with regard to transacti<strong>on</strong>s relatedto these c<strong>on</strong>diti<strong>on</strong>s are set out in Codes (such as C<strong>on</strong>necti<strong>on</strong> Agreements and the GeneralC<strong>on</strong>diti<strong>on</strong>s <strong>of</strong> <strong>Supply</strong> C<strong>on</strong>tracts) approved by the regulatory authority and /or other governmentalauthorities.Transacti<strong>on</strong>s during the period <strong>of</strong> the c<strong>on</strong>tract, such as billing, payment arrangements andresp<strong>on</strong>ses to customers’ queries, complaints and claims. These transacti<strong>on</strong>s are regular oroccasi<strong>on</strong>al transacti<strong>on</strong>s. Regular transacti<strong>on</strong>s refer to those like billing and regular meterreadings. Some transacti<strong>on</strong>s between the electricity company and the customer are necessary<strong>on</strong>ly occasi<strong>on</strong>ally, when the customer c<strong>on</strong>tacts the company with a query or a complaint.The quality <strong>of</strong> these transacti<strong>on</strong>s can be measured for example by the time span the compa-67<str<strong>on</strong>g>Third</str<strong>on</strong>g> <str<strong>on</strong>g>Benchmarking</str<strong>on</strong>g> <str<strong>on</strong>g>Report</str<strong>on</strong>g> <strong>on</strong> <strong>Quality</strong> <strong>of</strong> <strong>Electricity</strong> <strong>Supply</strong> – 2005 · Chapter 3
ny resp<strong>on</strong>ds. These transacti<strong>on</strong>s could relate to the DSO and the supplier respectively andcould be quality regulated according to the regulatory framework <strong>of</strong> the particular country.Given the wide range <strong>of</strong> transacti<strong>on</strong>s between a supplier/DSO and a customer, the reality is thatcompanies have substantial discreti<strong>on</strong> over the services they provide and the way they providethem as well. It is <strong>of</strong>ten asked why is it necessary to measure performance, set incentives, regulateand prepare quality requirements for the electricity companies in a liberalised market wherecompetiti<strong>on</strong> should force the companies to perform at or above a certain minimum level. The realityis not that simple. There are for example some fields where the DSOs have exclusive rightsand do not compete with other participants. Regulati<strong>on</strong> can introduce competiti<strong>on</strong> in c<strong>on</strong>testableareas <strong>of</strong> network operati<strong>on</strong> (e.g. metering), but this practice is not fully adopted across CEERmembers. Further at the beginning <strong>of</strong> this process competiti<strong>on</strong> is limited. Frequently there is competiti<strong>on</strong>in supply/trading activities with the possibility for new firms to enter the market, but <strong>of</strong>tenthis does not involve all groups <strong>of</strong> c<strong>on</strong>sumers (e.g. household customers) and in the absence <strong>of</strong>efficient retail competiti<strong>on</strong> it does not give a good incentive to keep the commercial quality abovea certain level or to raise it. It is therefore important to have in place elements <strong>of</strong> quality regulati<strong>on</strong>for incumbent electricity companies.Another aspect which is generally valid for all elements <strong>of</strong> quality regulati<strong>on</strong> relates to the incentiveregulati<strong>on</strong> regarding network charges. This price-regulati<strong>on</strong> method (price cap/price formula/pricingperiod) encourages network companies to reduce costs (and thus increase efficiency)during pricing period. The c<strong>on</strong>sequence <strong>of</strong> the reducti<strong>on</strong> <strong>of</strong> operati<strong>on</strong>al expenditure may be thatactual levels <strong>of</strong> network quality <strong>of</strong> service decline or do not improve in line with customers’ expectati<strong>on</strong>s.This may easily be the case in countries, where the incentive regulati<strong>on</strong> principle in networkprice regulati<strong>on</strong> (price cap) is being developed and could be adopted in near future, whilestipulati<strong>on</strong>s <strong>on</strong> service quality standards could be targeted later <strong>on</strong>ly. There is a questi<strong>on</strong> whetherit is appropriate to keep some minimum standards even where the competiti<strong>on</strong> is fully developedso that there would be a minimum standard with regard to supply and companies may compete inproviding standards which exceed these. On the other hand, some commercial quality aspects(for instance times for c<strong>on</strong>necti<strong>on</strong>s) are related to distributi<strong>on</strong> networks and therefore given them<strong>on</strong>opoly element they should be regulated.Important factors in analysing how a company interacts with and resp<strong>on</strong>ds to the needs <strong>of</strong> customersinclude the presence or absence <strong>of</strong> a complaints procedure, how the matter was handledand if it was settled satisfactorily as well as the informati<strong>on</strong> the company itself collects regardingcustomer service. One <strong>of</strong> the most direct ways that quality regulati<strong>on</strong> works to ensure good customerservice is through commercial quality standards or requirements. The most importantissues and the comm<strong>on</strong>ly used commercial quality indicators and standards are explained in thesubchapter 3.3. A complete list <strong>of</strong> existing standards in each country is given in Annex 3A. It isnecessary, in general terms, to identify which standards relate to distributi<strong>on</strong> functi<strong>on</strong>s and whichrelate to supply functi<strong>on</strong>s because commercial quality is related to unbundled activities.68Council <strong>of</strong> European Energy Regulators – Ref: C05-QOS-01-03
Commercial quality regulati<strong>on</strong> attempts to ensure there is an appropriate level <strong>of</strong> commercialquality. This is achieved, to different extents in each country, through the use <strong>of</strong> regulati<strong>on</strong>s orcodes, performance standards, the disseminati<strong>on</strong> <strong>of</strong> informati<strong>on</strong> to promote quality <strong>of</strong> service aswell as through strategies to encourage customer participati<strong>on</strong>. The involvement <strong>of</strong> the customersand their representatives can make an important c<strong>on</strong>tributi<strong>on</strong> to quality regulati<strong>on</strong> because <strong>on</strong> the<strong>on</strong>e hand customer surveys show the customers’ own expectati<strong>on</strong>s (and not <strong>on</strong>ly those expectedby the regulators), <strong>on</strong> the other hand the customers are the <strong>on</strong>es affected by inadequate service.The level <strong>of</strong> customer satisfacti<strong>on</strong> when they c<strong>on</strong>tact a company is most important in this respect(e.g. call centres, costumer c<strong>on</strong>tact centres). Higher customer expectati<strong>on</strong>s and their effect <strong>on</strong>regulated network prices require a regulatory strategy which includes the customer perspective.3.2 Commercial <strong>Quality</strong> Questi<strong>on</strong>naireAlthough not explicitly stated, the questi<strong>on</strong>naire targeted LV household and small industry c<strong>on</strong>sumers(up to the large c<strong>on</strong>sumer limit, which limit varies from country to country). Where datarefer to MV or HV customers it is marked accordingly.3.2.1 Scope <strong>of</strong> the Questi<strong>on</strong>naire regarding Commercial <strong>Quality</strong>The CEER QoS TF designed the questi<strong>on</strong>naire to examine:1. Actual levels <strong>of</strong> commercial quality;2. Standards (guaranteed and overall) in commercial quality;3. Compensati<strong>on</strong>s if guaranteed standards are not met.Country regulators were asked to answer seventeen questi<strong>on</strong>s <strong>on</strong> actual levels and a furthertwenty-four questi<strong>on</strong>s <strong>on</strong> standards <strong>of</strong> commercial quality. In additi<strong>on</strong>, each country was requestedto define in more detail the indicators <strong>of</strong> commercial quality in their country in order to aid theharm<strong>on</strong>isati<strong>on</strong> <strong>of</strong> informati<strong>on</strong> received <strong>on</strong> actual levels <strong>of</strong> service. Informati<strong>on</strong> gathered <strong>on</strong> theactual service levels and the standards that are in place can be found in Annex 3.Informati<strong>on</strong> was collected <strong>on</strong> the standards required from supply and distributi<strong>on</strong> companies and<strong>on</strong> the penalty payments that are imposed in the event that companies fail to meet the requiredperformance (where appropriate). A further approach that could be adopted is identifying the characteristics<strong>of</strong> commercial quality that are important to the customer. This survey did not researchc<strong>on</strong>sumer protecti<strong>on</strong> policies and procedures across countries. Neither did it examine the customers’views <strong>on</strong> the characteristics <strong>on</strong> good service or attempt to measure customer attitudesand satisfacti<strong>on</strong>.69<str<strong>on</strong>g>Third</str<strong>on</strong>g> <str<strong>on</strong>g>Benchmarking</str<strong>on</strong>g> <str<strong>on</strong>g>Report</str<strong>on</strong>g> <strong>on</strong> <strong>Quality</strong> <strong>of</strong> <strong>Electricity</strong> <strong>Supply</strong> – 2005 · Chapter 3
3.2.2 Data AvailabilityThe analysis in this <str<strong>on</strong>g>Report</str<strong>on</strong>g> is based <strong>on</strong> the informati<strong>on</strong> obtained from all (or some, as appropriate)<strong>of</strong> the following (nineteen) countries: Austria, Belgium, the Czech Republic, Est<strong>on</strong>ia, Finland,France, Great Britain, Greece, Hungary, Italy, Ireland, Latvia, Lithuania, Norway, Poland, Portugal,Slovenia, Spain and Sweden.It has to be remarked that without analysis <strong>of</strong> the detailed definiti<strong>on</strong>s <strong>of</strong> the respective commercialquality indicators <strong>on</strong>e has to be very cautious when comparing data. The general experience <strong>of</strong>quality regulati<strong>on</strong> can be used for analysis <strong>of</strong> existing trends and expectati<strong>on</strong>s.Where the data in days referred to working days as distinct from calendar days, answers specifiedin working days have been c<strong>on</strong>verted into calendar days (5 working days = 7 calendar days,7 working days = 9 calendar days, etc).3.2.3 Answers to Questi<strong>on</strong>naireAnswers were received from 19 <strong>of</strong> the 26 CEER member authorities (See Table 3.1). Fifteen providedansweres to the questi<strong>on</strong>s c<strong>on</strong>cerning the actual levels <strong>of</strong> commercial quality (Questi<strong>on</strong>naireref. No 1.1 and 1.2).Finland has not given reas<strong>on</strong>s for not supplying data. Austria and Germany do not have fully fledgedexperiences in the area <strong>of</strong> the regulati<strong>on</strong> <strong>of</strong> commercial quality and this was the reas<strong>on</strong> for not supplyingdata. Particularily in Germany, no incentive regulati<strong>on</strong> principle in network price regulati<strong>on</strong> hasbeen adopted so far. An incentive based regulatory scheme is currently being developed. In theCzech Republic the amendment <strong>of</strong> the current regulati<strong>on</strong> is expected by the end <strong>of</strong> 2005, thus them<strong>on</strong>itoring <strong>of</strong> the quality standards will start from January 1, 2006. The new Energy Law <strong>of</strong> Polandbecame effective <strong>on</strong> March 3, 2005. The Polish regulator does not yet have informati<strong>on</strong> <strong>on</strong> the currentperformance levels <strong>of</strong> the commercial quality, but this is rather comm<strong>on</strong> situati<strong>on</strong> even am<strong>on</strong>gregulators that have set some commercial quality standards For instance, Great Britain has <strong>on</strong>lysupplied data for “The average speed <strong>of</strong> teleph<strong>on</strong>e resp<strong>on</strong>se for distributi<strong>on</strong> call centers” (Secti<strong>on</strong>1.1.3 <strong>of</strong> the Questi<strong>on</strong>naire) because in general OFGEM does not collect data <strong>on</strong> actual levels <strong>of</strong>commercial quality but rather measures performance against the standards with the percentages <strong>of</strong>cases in which standards are met. Finland provided comments solely <strong>on</strong> Questi<strong>on</strong>naire secti<strong>on</strong>s1.1.8 and 1.1.9. Sweden stated, that the general practice and the ec<strong>on</strong>omic and market c<strong>on</strong>diti<strong>on</strong>shave not made regulati<strong>on</strong> <strong>of</strong> the commercial quality a necessity. The companies themselves areexpected to provide standards in order to satisfy the expectati<strong>on</strong>s <strong>of</strong> their customers. Beside that,the Swedish C<strong>on</strong>sumer <strong>Electricity</strong> Advice Bureau provides informati<strong>on</strong>, guidance and assistance toc<strong>on</strong>sumers in various matters c<strong>on</strong>cerning the electricity market. All informati<strong>on</strong> and guidance is free<strong>of</strong> charge. Usually, regi<strong>on</strong>al data are weighted by the number <strong>of</strong> customers in the specific regi<strong>on</strong>except for the Belgian and Slovenian regulators who supplied data <strong>on</strong>ly in relati<strong>on</strong> to two regi<strong>on</strong>s.(Therefore there are two columns in the table under the names <strong>of</strong> these countries.)70Council <strong>of</strong> European Energy Regulators – Ref: C05-QOS-01-03
The evaluati<strong>on</strong> <strong>of</strong> the actual level <strong>of</strong> commercial quality for distributi<strong>on</strong> networks and retail supplywas based <strong>on</strong> data supplied by 12 countries (Belgium, Est<strong>on</strong>ia, France, Greece, Hungary, Ireland,Italy, Latvia, Lithuania, Portugal, Slovenia, Britain), completed Table 1.1 <strong>of</strong> the questi<strong>on</strong>naire. Thedata refer to 2004.TABLE 3.1Commercial quality related answers to the distributed questi<strong>on</strong>ersInvolved regulators <strong>of</strong>countriesCommercial quality at distributi<strong>on</strong>/supply levelActual levels (facts) 1.1. Questi<strong>on</strong>naireStandards 2.1. Questi<strong>on</strong>naireAustriaBelgiumCyprusCzech RepublicDenmarkEst<strong>on</strong>iaFinlandFranceGermanyGreeceHungaryIrelandItalyLatviaLithuaniaLuxembourgMaltaNorwayPolandPortugalSlovakiaSloveniaSpainSwedenThe NetherlandsUK✓✓✓✓✓✓✓✓✓✓✓✓✓✓✓✓✓✓✓✓✓✓✓✓✓✓✓✓✓✓✓✓✓✓✓✓✓✓✓✓✓✓✓✓✓✓✓✓✓✓✓✓✓✓✓✓✓✓✓✓ = An evaluati<strong>on</strong> (reply) in words ✓✓ = Numerical informati<strong>on</strong> rendering ✓ = Partial regi<strong>on</strong>al informati<strong>on</strong> renderingCommercial <strong>Quality</strong> at transmissi<strong>on</strong> levelThe answers to the questi<strong>on</strong>naire 1.2. about the existing/actual levels <strong>of</strong> measured commercial qualityin c<strong>on</strong>necti<strong>on</strong> with transmissi<strong>on</strong> network have returned <strong>on</strong>ly the regulators <strong>of</strong> Belgium, Est<strong>on</strong>ia andFrance. To the questi<strong>on</strong>naire 2.2. about the Commercial <strong>Quality</strong> related standards <strong>of</strong> transmissi<strong>on</strong> networksreplied the regulators <strong>of</strong> the same three countries and Slovenia.71<str<strong>on</strong>g>Third</str<strong>on</strong>g> <str<strong>on</strong>g>Benchmarking</str<strong>on</strong>g> <str<strong>on</strong>g>Report</str<strong>on</strong>g> <strong>on</strong> <strong>Quality</strong> <strong>of</strong> <strong>Electricity</strong> <strong>Supply</strong> – 2005 · Chapter 3
3.2.4 AnalysisThe evaluati<strong>on</strong> <strong>of</strong> standards <strong>of</strong> performance was based <strong>on</strong> Table 2.1 <strong>of</strong> the questi<strong>on</strong>naire. 19 countriesreplying to the questi<strong>on</strong>naire provided detailed informati<strong>on</strong>. The questi<strong>on</strong>naire originally listed24 standards and also allowed countries to specify any additi<strong>on</strong>al standards that are specific tothem. A number <strong>of</strong> countries have made use <strong>of</strong> this opti<strong>on</strong>, therefore informati<strong>on</strong> is available <strong>on</strong> 23additi<strong>on</strong>al standards. This Chapter focuses <strong>on</strong> the most comm<strong>on</strong> standards as it would be impracticalto discuss all <strong>of</strong> the standards due to the large numbers, differing definiti<strong>on</strong>s and interpretati<strong>on</strong>sand circumstances in each <strong>of</strong> the countries. On the basis <strong>of</strong> replies further analyses weremade the results <strong>of</strong> which are shown in Tables 3.2, 3.3 and 3.4 (see in Annex 3B). In Table 3.2data are found <strong>on</strong> the 17 original indicators in questi<strong>on</strong>naire 1.1, Table 3.3 shows the original 24standards <strong>of</strong> the questi<strong>on</strong>naire 2.1 broken down by countries and licensees (distributor or supplier),while Table 3.4 shows how the specific countries apply these standards: as guaranteed standardsor overall <strong>on</strong>es. Each line <strong>of</strong> these latter two tables is repeated at the heading <strong>of</strong> the secti<strong>on</strong> wherethe standard is addressed in detail.It is important to keep in mind that any comparis<strong>on</strong> <strong>of</strong> data supplied may be misleading as the level<strong>of</strong> liberalizati<strong>on</strong> as well as extent <strong>of</strong> competiti<strong>on</strong>, rate <strong>of</strong> unbundling and market experience vary significantlyby countries. One should take these factors into c<strong>on</strong>siderati<strong>on</strong> during making comparis<strong>on</strong>sand drawing c<strong>on</strong>clusi<strong>on</strong>s. It seems generally to be the case that with market opening lessstandards <strong>of</strong> performance are applied <strong>on</strong> Suppliers while more <strong>on</strong>es are applied to address DSOquality <strong>of</strong> service issues. As the efficiency <strong>of</strong> energy markets grows there is less <strong>of</strong> a need for supply-relatedcommercial quality indicators and for regulatory interventi<strong>on</strong>. However, it is important tomaintain commercial quality regulati<strong>on</strong> in the initial phases <strong>of</strong> market opening, particularly wherecustomers have difficulty switching supplier or changing tariffs with their existing supplier. Althoughgeneral the in <str<strong>on</strong>g>Report</str<strong>on</strong>g> the word “standard” is used in the practice <strong>of</strong> some countries the word“requirement” would fit better (the regulatory authority sets “requirements” instead <strong>of</strong> “standards”).The following table serves as a guide to the most popular and most frequently used standards.72Council <strong>of</strong> European Energy Regulators – Ref: C05-QOS-01-03
TABLE 3.5MOST FREQUENTLY USED COMMERCIAL QUALITY STANDARDSAreaStandardNumber <strong>of</strong> countries where appliedOS GS Both DSO Supp. BothC<strong>on</strong>necti<strong>on</strong>s <strong>of</strong> the customersEstimating charge (simple work)Executi<strong>on</strong> <strong>of</strong> simple worksExecuti<strong>on</strong> <strong>of</strong> complex worksC<strong>on</strong>necti<strong>on</strong> (supply and meter)2223543910017651200000000Restorati<strong>on</strong> in case <strong>of</strong> fault related to single customerResp<strong>on</strong>ding to failure <strong>of</strong> distributor's fuse090900Solving problems related with voltage or meterVoltage complaintsMeter problems33780011110100Customer c<strong>on</strong>tact in pers<strong>on</strong>, in writing or by ph<strong>on</strong>eNotice <strong>on</strong> interrupti<strong>on</strong> <strong>of</strong> supplyQueries <strong>on</strong> charges and paymentsResp<strong>on</strong>se to customers lettersResp<strong>on</strong>se to customers claimsAppointments scheduling6234099558000001452370511001551Meter reading and billingNumber <strong>of</strong> meter readings within a yearRec<strong>on</strong>necti<strong>on</strong> following repayment <strong>of</strong> debts94380010100100(Note: In many cases the sum <strong>of</strong> figures DSO+ Supplier cells is not equal to that in GS+OS cells. The reas<strong>on</strong> is the incompleteanswer to the questi<strong>on</strong>naire, obviously, empty cells could not be analyzed. Further, in some cases - e.g. Italy in estimati<strong>on</strong>charges - the same standard is a GS and OS depending <strong>on</strong> the category <strong>of</strong> the customers or <strong>on</strong> the voltage level. In other casesthe same standard is applied both for DSO and Supplier.The highly important standard <strong>on</strong> Restoring/rec<strong>on</strong>necting supply and its analysis are not included here, as they are addressedin details in Chapter 2, The use <strong>of</strong> Standard and Incentives in <strong>Quality</strong> Regulati<strong>on</strong>.)These 14 standards serve as the mainstream standards for trhe purposes <strong>of</strong> comparis<strong>on</strong> andanalysis while the other arguably less important standards are summarized in Annex 3A.From the standards applied by at least 5 countries (see Table 3.5) it is clearly shown that thefocus is <strong>on</strong> five different activities. The first <strong>on</strong>e is c<strong>on</strong>necti<strong>on</strong> to the network, the sec<strong>on</strong>d <strong>on</strong>e isthe restorati<strong>on</strong> <strong>of</strong> the supply, the third <strong>on</strong>e is the settlement <strong>of</strong> problems associated with voltageand metering, the fourth <strong>on</strong>e is maintaining relati<strong>on</strong>s with the customers (in writing, in pers<strong>on</strong> andover the ph<strong>on</strong>e) and handling <strong>of</strong> claims, and the fifth <strong>on</strong>e is the activities relevant to meter-readingand billing. The analysis <strong>of</strong> these activities is presented in the following secti<strong>on</strong>s.The most comm<strong>on</strong> five standards for suppliers (see Table 3.5) appear at most in 5 countries (notethe figures in column “Both” too), whereas for distributi<strong>on</strong> companies apply significant more standards.This is explained by a number <strong>of</strong> countries focusing <strong>on</strong> c<strong>on</strong>tinuity and other quality <strong>of</strong> serviceissues relating to the DSO, while quality <strong>of</strong> service issues related to Suppliers is allowed to bedriven by competitive market forces. This approach may justified in certain circumstances.However, c<strong>on</strong>sidering the current situati<strong>on</strong> <strong>of</strong> several CEER member states where competiti<strong>on</strong> isstarting to be introduced and there is no established quality regulati<strong>on</strong> in place it may be is usefulto cover Commercial <strong>Quality</strong> issue both for DSOs and Suppliers.73<str<strong>on</strong>g>Third</str<strong>on</strong>g> <str<strong>on</strong>g>Benchmarking</str<strong>on</strong>g> <str<strong>on</strong>g>Report</str<strong>on</strong>g> <strong>on</strong> <strong>Quality</strong> <strong>of</strong> <strong>Electricity</strong> <strong>Supply</strong> – 2005 · Chapter 3
3.2.5 Kinds <strong>of</strong> Standards <strong>of</strong> Commercial <strong>Quality</strong>There are two kinds <strong>of</strong> Standards <strong>of</strong> Commercial <strong>Quality</strong>: guaranteed standards and overall standards.··Guaranteed Standards (GS) set minimum service levels, which must be met in each individualcase. If the company does not meet these standards compensati<strong>on</strong> at fixed rates ispayable to the customers c<strong>on</strong>cerned. The definiti<strong>on</strong> <strong>of</strong> Guaranteed Standards involves the followingattributes:1. Service covered (e.g. estimating charges).2. Required performance level – usually stipulating a resp<strong>on</strong>se time (e.g. 5 working days).3. Penalty/compensati<strong>on</strong> payment the customer (e.g. € 20) in case <strong>of</strong> n<strong>on</strong>-performance <strong>of</strong>standard level.Overall Standards (OS) cover areas <strong>of</strong> service where it may not be possible to provide guaranteesbut where customers are entitled to expect pre-determined levels <strong>of</strong> service. With overallstandards the company is required to c<strong>on</strong>duct its business in such a way as to be reas<strong>on</strong>ablyexpected to deliver the standard. Overall Standards are defined as follows:1. Service covered (e.g. c<strong>on</strong>necting new customers’ premises to electricity distributi<strong>on</strong> system).2. Minimum performance level (usually a percentage) to be achieved over a defined period(e.g. 90% <strong>of</strong> cases should be c<strong>on</strong>nected within 20 working days, over a <strong>on</strong>e year period).Overall standards do not imply penalty payments but are fundamental to m<strong>on</strong>itor and promote quality<strong>of</strong> service. The instituti<strong>on</strong> <strong>of</strong> GS is a very effective means for the regulatory system to stimulatethe c<strong>on</strong>tinuous increase <strong>of</strong> the standard <strong>of</strong> supply. However, both types <strong>of</strong> standards are <strong>on</strong>ly effectiveif the c<strong>on</strong>sumers get sufficient informati<strong>on</strong> <strong>on</strong> them. Regular (annual) reports by the regulator<strong>on</strong> the performance <strong>of</strong> companies are effective means not <strong>on</strong>ly to measure performance and for thecompany to improve its image, but also to inform customers <strong>of</strong> the standard <strong>of</strong> service they canexpect. The presence <strong>of</strong> standards and regular reporting <strong>on</strong> quality actual levels also c<strong>on</strong>firms theimprovement <strong>of</strong> the standard <strong>of</strong> customer service as a regulatory objective in several countries.It is clearly shown (from Table 3.4 in Annex 3B and Table 3.5 above) that the regulators makemore use <strong>of</strong> Guaranteed Standards (GS) than Overall Standards (OS). (The number <strong>of</strong> GS ismore than the double <strong>of</strong> that <strong>of</strong> OS.) We think that this is useful as most standards are then arequirement that the company has to meet for each individual customer rather than an averagetarget for performance. As Italian and English practice show the number <strong>of</strong> OS have beendecreasing or disappearing while more and more GS come into force instead. This process is likelyc<strong>on</strong>tinues in other countries in the next future.3.2.6 Layout methodologyAfter an introductory interpretati<strong>on</strong> the commercial quality-related indicators applied by CEERmember authorities are presented <strong>on</strong>e by <strong>on</strong>e. Where possible the actual performance as well as74Council <strong>of</strong> European Energy Regulators – Ref: C05-QOS-01-03
the standards relating to a particular service are given. The reference number <strong>of</strong> the questi<strong>on</strong> inthe original questi<strong>on</strong>naire is given as well as the number <strong>of</strong> countries in which the standard hasbeen applied for· DSO or· Supplier and· whether it has been applied as a GS or OS.In order to encourage the use and refinement <strong>of</strong> particular standards recommendati<strong>on</strong>s <strong>on</strong> theirapplicati<strong>on</strong> (and their relative importance, marked by ✰s) is set out. These are based <strong>on</strong> practicalexperience <strong>of</strong> quality regulati<strong>on</strong> and/or <strong>on</strong> the opini<strong>on</strong> <strong>of</strong> CEER members. (marked asRecomm.)3.3 Standards and actual levels <strong>of</strong> Commercial <strong>Quality</strong>3.3.1 C<strong>on</strong>necti<strong>on</strong> <strong>of</strong> the customer to the networkQuest.2.1.4Supp.0Recomm.✰✰✰DSO7OS GS3 63.3.1.1 Standards applied for the preparati<strong>on</strong> <strong>of</strong> a cost estimate for simple worksThe standards applied for preparati<strong>on</strong> <strong>of</strong> a cost estimate for simple works in the case <strong>of</strong> householdcustomers ranges between 6 and 20 working days. The rate <strong>of</strong> compensati<strong>on</strong> payable incase <strong>of</strong> n<strong>on</strong>-compliance varies between € 8 and € 60. The separati<strong>on</strong> <strong>of</strong> the simple and complexworks is not uniform across countries. Payment is automatic in the countries answering the questi<strong>on</strong>naire.In Spain the rate <strong>of</strong> compensati<strong>on</strong> is influenced also by the amount <strong>of</strong> the bill <strong>of</strong> the customer(Table 3.6 <strong>of</strong> Annex 3B.).CQ#1 For the harm<strong>on</strong>ized use <strong>of</strong> a standard for preparati<strong>on</strong> <strong>of</strong> a cost estimate for simple works first<strong>of</strong> all it is necessary, that “simple work” should be interpreted in the same way by all regulatoryauthorities. Time limist can be set subsequently. Efforts should be made to make the paymentautomatic where practicable.Quest.2.1.20Supp.0Recomm.✰✰✰DSO4OS GS2 33.3.1.2 Standards applied for the preparati<strong>on</strong>os a cost estimate for complex worksThe standards applied for preparati<strong>on</strong> <strong>of</strong> a cost estimate for complex works varies between 21and 90 days. It is characteristic that the timescale depends <strong>on</strong> the voltage level. (Higher voltagelevel = l<strong>on</strong>ger timescale for the provisi<strong>on</strong> <strong>of</strong> a c<strong>on</strong>necti<strong>on</strong> quotati<strong>on</strong>) In Italy 90% <strong>of</strong> the cases shallbe arranged within the prescribed 40 working days. The rate <strong>of</strong> compensati<strong>on</strong> in Ireland is € 130,and in Spain a minimum <strong>of</strong> € 30. (Table 3.7 <strong>of</strong> Annex 3B.)CQ#2 For the harm<strong>on</strong>ized use <strong>of</strong> the standard for preparati<strong>on</strong> <strong>of</strong> a cost estimate for commplex worksfirst <strong>of</strong> all it is necessary, that “complex work” sould be interpreted in the same way by all regulatoryauthorities. Time limist can be set subsequently. Efforts should be made to make the payment automaticwhere practicable.75<str<strong>on</strong>g>Third</str<strong>on</strong>g> <str<strong>on</strong>g>Benchmarking</str<strong>on</strong>g> <str<strong>on</strong>g>Report</str<strong>on</strong>g> <strong>on</strong> <strong>Quality</strong> <strong>of</strong> <strong>Electricity</strong> <strong>Supply</strong> – 2005 · Chapter 3
Quest.2.1.17Supp.0Recomm.✰✰✰✰DSO6OS GS2 43.3.1.3 Standards applied for the executi<strong>on</strong> <strong>of</strong> simple worksIf “simple works” refers to activities when the request <strong>of</strong> the customer can be realized without theextensi<strong>on</strong> <strong>of</strong> the existing network or without building a new network, the standards applied rangesbetween 3-20 working days. In Italy the standard is differentiated for voltage levels: 15 workingdays for LV customers, 30 working days for MV cases. In case <strong>of</strong> n<strong>on</strong>-compliance the compensati<strong>on</strong>payment is automatic in all cases, the rate <strong>of</strong> compensati<strong>on</strong> in LV is between € 25 and € 65.This rate may vary depending <strong>on</strong> the category <strong>of</strong> the customer, the voltage level and the amount<strong>of</strong> the first complete bill. (Table 3.8 <strong>of</strong> Annex 3B.)CQ#3 The definiti<strong>on</strong> and classificati<strong>on</strong> <strong>of</strong> activities referred to as“simple works” need furtherimprovement. Introducti<strong>on</strong> <strong>of</strong> harm<strong>on</strong>ized standard is <strong>on</strong>ly possible subsequently.Quest.2.1.21Supp.0Recomm.✰✰✰DSO5OS GS2 33.3.1.4 Standards applied for the executi<strong>on</strong> <strong>of</strong> complex worksAccording to the previous secti<strong>on</strong>, this group includes the activities when the works to be carried outare not <strong>of</strong> low voltage, and where it is necessary to extend the existing network, to build a new networkor <strong>on</strong>e or more transformer stati<strong>on</strong>s. The relevant standards specify 45-60-80 working days forthe executi<strong>on</strong> <strong>of</strong> these works. The rate <strong>of</strong> payable compensati<strong>on</strong> – in case <strong>of</strong> n<strong>on</strong>-compliance – is €30-65 in case <strong>of</strong> household customers, in case <strong>of</strong> medium voltage customers the compensati<strong>on</strong> is €60-65. Compensati<strong>on</strong> may be paid <strong>on</strong> request or automatically. (Table 3.9 <strong>of</strong> Annex 3B.)CQ#4 The works in the category <strong>of</strong> “complex works”are so varied that a harm<strong>on</strong>ized regulati<strong>on</strong> doesnot seem possible. However, it is important that every country has a clear standard applicable for theexecuti<strong>on</strong> <strong>of</strong> complex works in order that the customer can calculate in advance the completi<strong>on</strong> time.Quest.2.1.3Supp.0Recomm.✰✰✰✰DSO12OS GS4 103.3.1.5 Standards applied for the start <strong>of</strong> supplyThe most comm<strong>on</strong>ly applied standards for the start <strong>of</strong> supply are 2, 3 and 5 working days. A “loose”standard <strong>of</strong> 30 working days is applied in Greece, in case where the LV service is also to be rendered.The compensati<strong>on</strong> is characteristically a lump sum predetermined by voltage levels, which variesbetween € 8 and € 150. In the Czech Republic the sum is influenced by the number <strong>of</strong> days <strong>of</strong> thedelay, while in Spain it may be influenced by the amount <strong>of</strong> the bill <strong>of</strong> the customer with a minimum <strong>of</strong>€ 30. In Lithuania and Slovenia there is no compensati<strong>on</strong> payment. (Table 3.10. <strong>of</strong> Annex 3B.)CQ#5 The supply <strong>of</strong> the customer with energy is a questi<strong>on</strong> <strong>of</strong> outstanding importance.The Directives <strong>of</strong> the EU also priorities the issue <strong>of</strong> c<strong>on</strong>necti<strong>on</strong> to the network and the issue <strong>of</strong>network access, and places these under the resp<strong>on</strong>sibility <strong>of</strong> the regulators. Therefore it is recommendedthat there should be harm<strong>on</strong>ized standards in this area that set out within how much time thecustomer shall be c<strong>on</strong>nected to the network following the fulfilment <strong>of</strong> the c<strong>on</strong>diti<strong>on</strong>s to be met by thecustomers, and the c<strong>on</strong>clusi<strong>on</strong> <strong>of</strong> the supply c<strong>on</strong>tract. The majority <strong>of</strong> the standards determine2-5 working days. The compensati<strong>on</strong> may increase depending <strong>on</strong> the durati<strong>on</strong> <strong>of</strong> the delay.In this case also, efforts should be made to make the payment automatic.76Council <strong>of</strong> European Energy Regulators – Ref: C05-QOS-01-03
Quest.2.1.19Supp.1Recomm.✰✰✰✰✰DSO10OS GS4 83.3.1.6 Standards applied for the rec<strong>on</strong>necti<strong>on</strong> <strong>of</strong> the customer to the network after the payment<strong>of</strong> debtAlmost every regulator indicated a rec<strong>on</strong>necti<strong>on</strong> time <strong>of</strong> 1 day. The Greek standard is a bit morerigorous, in Greece the customer will be rec<strong>on</strong>nected <strong>on</strong> the same day that the payment is madeprovided that this is within working hours. The standard which can be met most easily exists inLithuania and Est<strong>on</strong>ia, where the customer shall be rec<strong>on</strong>nected to the network within 5 workingdays. The compensati<strong>on</strong> rate varies between € 15 and € 120 depending <strong>on</strong> the voltage level and<strong>on</strong> the delay in making the rec<strong>on</strong>necti<strong>on</strong>, <strong>on</strong> the category <strong>of</strong> the customer, <strong>on</strong> the c<strong>on</strong>necti<strong>on</strong>capacity and <strong>on</strong> the amount <strong>of</strong> the customer’s bill. There are countries where no compensati<strong>on</strong> ispaid (Slovenia, Lithuania), while in some specific cases (Czech Republic, Hungary) compensati<strong>on</strong>is paid <strong>on</strong>ly up<strong>on</strong> request. (Table 3.11. <strong>of</strong> Annex 3B.)CQ#6 C<strong>on</strong>sidering that the customer – even if he/she has not always paid <strong>on</strong> schedule – has fullypaid its debt, and according to the practice <strong>of</strong> several countries, has paid a specific fee for the rec<strong>on</strong>necti<strong>on</strong>,it may request the restorati<strong>on</strong> <strong>of</strong> the supply as so<strong>on</strong> as possible. Therefore CEER recommendsthat the maximum length <strong>of</strong> time for rec<strong>on</strong>necti<strong>on</strong> should be <strong>on</strong>e working day. Any delay pastthe <strong>on</strong>eworking day rec<strong>on</strong>necti<strong>on</strong> time could increase the amount <strong>of</strong> compensati<strong>on</strong>.Quest.1.1.13Supp.7Recomm.✰✰✰DSO63.3.1.7 Actual levels for the average resp<strong>on</strong>se time to demands for LV supplyThe seven answers received showed resp<strong>on</strong>se times between 0 and 30 days. The original datagenerally came from distributors, but in Hungary suppliers also delivered data, while in Est<strong>on</strong>ia itwas exclusively the sales agent who supplied data. The 5 working days indicated by Portugal hasbeen taken to be equivalent to 7 calendar days. Est<strong>on</strong>ia’s figures are the average <strong>of</strong> the timesbetween the receipt <strong>of</strong> an applicati<strong>on</strong> for a c<strong>on</strong>necti<strong>on</strong> and sending out the <strong>of</strong>fer. The Sloveniandata refers <strong>on</strong>ly to queries arriving by mail. (Table 3.12 <strong>of</strong> Annex 3B.)Quest.1.1.14Supp.1Recomm.✰✰✰✰DSO93.3.1.8 Actual levels for the time <strong>of</strong> c<strong>on</strong>necti<strong>on</strong> <strong>of</strong> a new customer to the networkThe figures indicated by the nine countries answering the questi<strong>on</strong>naire were between 1 day andfour m<strong>on</strong>ths. In all cases the original data came from distributors, which was complemented bysupplier data <strong>on</strong>ly in the case <strong>of</strong> Hungary. The working days for the Portuguese and Lithuanianstandards have been c<strong>on</strong>verted into calendar days. Depending <strong>on</strong> the type <strong>of</strong> the work Greeceindicated three standards, while Latvia and Italy indicated two standards. (Table 3.13 <strong>of</strong> Annex 3B.)Quest.1.1.15Supp.0Recomm.✰✰✰✰DSO73.3.1.9 Actual levels for the time <strong>of</strong> starting the supplyIn the countries answering the questi<strong>on</strong>naire this activity is performed within a period <strong>of</strong> time rangingbetween 1 and 7 days. The original data were supplied by distributors in all cases. All times inworking days were c<strong>on</strong>verted into calendar days. In Italy the average time is 0 day in case <strong>of</strong> selfactivati<strong>on</strong>(i.e. by the customer, subsequent to activati<strong>on</strong> permissi<strong>on</strong> from the supplier), while ifAutomatic meter Reading (AMR) is available activati<strong>on</strong> is c<strong>on</strong>trolled remotely. In Hungary thesigning <strong>of</strong> the c<strong>on</strong>tract takes place at the time <strong>of</strong> the c<strong>on</strong>necti<strong>on</strong>, thus in the specific regi<strong>on</strong>s thetime passing between the two steps can be measured as a few minutes. (Table 3.14 <strong>of</strong> Annex 3B)77<str<strong>on</strong>g>Third</str<strong>on</strong>g> <str<strong>on</strong>g>Benchmarking</str<strong>on</strong>g> <str<strong>on</strong>g>Report</str<strong>on</strong>g> <strong>on</strong> <strong>Quality</strong> <strong>of</strong> <strong>Electricity</strong> <strong>Supply</strong> – 2005 · Chapter 3
3.3.2 Restorati<strong>on</strong> <strong>of</strong> supplyQuest.2.1.1Supp.0Recomm.✰✰✰✰✰DSO9OS GS0 93.3.2.1 Standards applied in the case <strong>of</strong> a distributor’s fuse 14 failureIn some countries customers at their premises are equipped with a distributor’s fuse and this standardrefers exclusively to replacement <strong>of</strong> such fuse, while in other countries this standard refersto faults <strong>of</strong> meter or breaker or LV services in customers’ premises too. In case <strong>of</strong> fuse failure themajority <strong>of</strong> standards prescribe 3 and 6 hours as the time <strong>of</strong> restorati<strong>on</strong>. The restorati<strong>on</strong> time ismaximum 6 hours for Wall<strong>on</strong>ia (in Belgium). In many countries the restorati<strong>on</strong> time has been differentiatedfor example by customer category (household – n<strong>on</strong>-household), density <strong>of</strong> customers(city, town, rural area), time <strong>of</strong> the occurrence <strong>of</strong> the error (working hours – out <strong>of</strong> working hours– weekend). Similarly to other standards this <strong>on</strong>e is differently defined and interpreted by countries.In Italy a new standard is applied from 2005 to eliminate meter faults. Relevant data will beavailable from 2006.The rate <strong>of</strong> compensati<strong>on</strong> varies between € 8 and € 35, depending <strong>on</strong> the category and z<strong>on</strong>e <strong>of</strong>the customer. In the majority <strong>of</strong> countries the electricity companies pay a sum <strong>of</strong> € 15-30 to thecustomers.The payment is generally automatic. There is a small number <strong>of</strong> countries where paymentdepends <strong>on</strong> customer claiming (for example in the Czech Republic). In Portugal the customershall be obliged to pay for the cost <strong>of</strong> the work if the fault is in the customer’s installati<strong>on</strong>. (Table3.15 <strong>of</strong> Annex 3B.)CQ#7 Due to its high importance the standard applied in the case <strong>of</strong> a distributor’s fuse failure,should be applied within all CEER member countries. Most <strong>of</strong> the current standards specify 3-4 hoursas restorati<strong>on</strong> time and CEER thinks compensati<strong>on</strong> be automatic if practicable. Differentiati<strong>on</strong> am<strong>on</strong>gthe regi<strong>on</strong>s and according to the density <strong>of</strong> customers (town-countryside) may depend <strong>on</strong> politicalc<strong>on</strong>siderati<strong>on</strong>s in some countries. When determining standards this questi<strong>on</strong> is to be handled by thenati<strong>on</strong>al regulator; this cannot be harm<strong>on</strong>ized am<strong>on</strong>g the CEER members.Quest.1.1.16Supp.0Recomm.✰✰✰✰✰DSO103.3.2.2 Actual levels for the average time <strong>of</strong> restorati<strong>on</strong>Data received from nine countries ranged typically between 0,72 and 2 working days. The originaldata is supplied in all cases by the distributor. The comment made by Norway in c<strong>on</strong>necti<strong>on</strong> withthis point (it does not include the data <strong>of</strong> the delays occurring due to low voltage faults), and theindividual quality indicator recommended by Lithuania (see secti<strong>on</strong> 3.3.10.6) suggests that thisindicator has been applied differently by these two countries. (Table 3.16 <strong>of</strong> Annex 3B.)14(or breaker or meter)78Council <strong>of</strong> European Energy Regulators – Ref: C05-QOS-01-03
3.3.3 Problems associated with voltage and meteringQuest.2.1.6Supp.0Recomm.✰✰✰✰DSO11OS GS3 73.3.3.1 Standards applied for voltage complaintsIn several countries this activity has been separated into two steps. The first step is a check-up<strong>on</strong> the site, which is followed by a resp<strong>on</strong>se to the complaint. Separate time limits are prescribedfor both steps, 7-8 days for the check-up, and 5-8 days for the resp<strong>on</strong>se to the complaint. Wheresuch complaints are handled as <strong>on</strong>e single procedure, the standard is 10-15 working days for theresoluti<strong>on</strong> <strong>of</strong> the problem. Many countries indicated Standard EN-50160:1999 as a norm relevantto the voltage. In Italy – depending <strong>on</strong> the voltage level – the adjustment time shall be respectedin 90-95% <strong>of</strong> cases. In Norway <strong>on</strong>e m<strong>on</strong>th is available for the survey and for the preparati<strong>on</strong> <strong>of</strong>the progress schedule. In Portugal the customer shall pay to the supplier the cost <strong>of</strong> the m<strong>on</strong>itoring(capped by the nati<strong>on</strong>al regulator) if the complaint is not justified. In case <strong>of</strong> n<strong>on</strong>-complianceby the electricity company the compensati<strong>on</strong> rate to be paid varies between € 8 and € 75 depending<strong>on</strong> the voltage level and <strong>on</strong> the c<strong>on</strong>necti<strong>on</strong> capacity. The payment <strong>of</strong> compensati<strong>on</strong> – if any –is automatic. (Table 3.17 <strong>of</strong> Annex 3B.)CQ#8 This standard applied for voltage complaints is a major issue with potentially significantimplicati<strong>on</strong>s. This may mean that some voltage discrepancies may be caused by the customer.CEER recommends further analysis in this area as part <strong>of</strong> its 2006 work programme.Quest.2.1.7Supp.1Recomm.✰✰✰✰DSO11OS GS3 83.3.3.2 Standards applied for the case <strong>of</strong> meter problemsSimilar to the previous standard, in many countries the process for dealing with metering problemshas been divided into two steps. The visit to the site and the check-up shall take place within5-7 working days from the receipt <strong>of</strong> the customer’s complaint. The most characteristic timelimit for fully addressing such complaints is 15 days. In the Czech Republic and Slovenia the customershall make a payment to the distributor for the verificati<strong>on</strong>, if the meter is found to be perfect.In Lithuania the reported problems <strong>of</strong> n<strong>on</strong>-household customers shall be handled within 2days. In Spain the standard is 5 working days below 15 kW c<strong>on</strong>necti<strong>on</strong> capacity, over this it is 15working days. The rate <strong>of</strong> compensati<strong>on</strong> varies between € 15 and € 75. The sum may be influencedby the delay in resp<strong>on</strong>ding, the category <strong>of</strong> the customer, the voltage level, the c<strong>on</strong>necti<strong>on</strong>capacity and the amount <strong>of</strong> the customer’s bills. The majority <strong>of</strong> the countries answering the questi<strong>on</strong>naireapply automatic compensati<strong>on</strong> payments. (Table 3.18 <strong>of</strong> Annex 3B.)CQ#9 In the case <strong>of</strong> standards to be applied for meter problems the provisi<strong>on</strong> that the customer shallpay the full or partial costs if the meter proves not to be foulty, can be a useful soluti<strong>on</strong> to reduceunjustified customer complaints which engage significant resources. However, when determining thesum to be paid, attenti<strong>on</strong> has to be paid that the payment shall not be a disproporti<strong>on</strong>ate burden <strong>on</strong>the customer.79<str<strong>on</strong>g>Third</str<strong>on</strong>g> <str<strong>on</strong>g>Benchmarking</str<strong>on</strong>g> <str<strong>on</strong>g>Report</str<strong>on</strong>g> <strong>on</strong> <strong>Quality</strong> <strong>of</strong> <strong>Electricity</strong> <strong>Supply</strong> – 2005 · Chapter 3
Quest.2.1.12Supp.0Recomm.✰✰✰DSO4OS GS0 43.3.3.3 Standards applied for the correcti<strong>on</strong> <strong>of</strong> voltage faultsSince several countries answered this questi<strong>on</strong> together with the indicators under secti<strong>on</strong> 3.4.3.1,<strong>on</strong>ly Hungary and Ireland answered to this specific questi<strong>on</strong>. In these countries in case <strong>of</strong> a voltageproblem examined and found justified, the required acti<strong>on</strong>s <strong>on</strong> the network (c<strong>on</strong>structi<strong>on</strong>,extensi<strong>on</strong>, modificati<strong>on</strong> <strong>of</strong> the secti<strong>on</strong> border) shall be carried out within a max. 0,25 – 1 year, asa result <strong>of</strong> which the prescribed voltage should be assured. Compensati<strong>on</strong> is paid <strong>on</strong> the request<strong>of</strong> the customer. The rate <strong>of</strong> compensati<strong>on</strong> is € 20 - 50 for household customers, while for medium-voltagecustomers € 120 shall be paid. (Table 3.19 <strong>of</strong> Annex 3B.)CQ#10 It is useful to apply this standard (applied for the correcti<strong>on</strong> <strong>of</strong> voltage faults) together with thestandard for voltage complaints (analyzed in secti<strong>on</strong> 3.3.3.1). While that standard includes provisi<strong>on</strong>srelevant to the handling <strong>of</strong> the complaints, this standard for the correcti<strong>on</strong> <strong>of</strong> voltage faults has provisi<strong>on</strong>srelevant to the actual time <strong>of</strong> the correcti<strong>on</strong> <strong>of</strong> voltage complaints, sometimes lasting for a l<strong>on</strong>g period.3.3.4 Customer c<strong>on</strong>tact in writingQuest.2.1.5Supp.0Recomm.✰✰✰✰✰DSO14OS GS6 93.3.4.1 Standards applied for informati<strong>on</strong> (notice) <strong>on</strong> scheduled supply interrupti<strong>on</strong>sMany countries have standards for notice to be given <strong>on</strong> scheduled supply interrupti<strong>on</strong>s. The mostrigorous deadline exists in the Czech Republic, where the customer shall be informed 15 daysprior to the scheduled interrupti<strong>on</strong>. However, in the majority <strong>of</strong> cases there is an obligati<strong>on</strong> toinform the customers 24-36-48 hours prior to the scheduled interrupti<strong>on</strong>. In Norway there is nospecific standard, <strong>on</strong>ly the c<strong>on</strong>diti<strong>on</strong>, that the customers shall be informed in proper time and in aproper way. In France in case <strong>of</strong> emergency works “a.s.a.p.” notice is to be sent. With regard tothe compensati<strong>on</strong> fees there are significant differences am<strong>on</strong>g the countries. While in Poland thecompensati<strong>on</strong> fee is € 3,8 at LV, in the Czech Republic the fee may reach even € 300 at HV. Therate <strong>of</strong> the fee may be influenced by the amount <strong>of</strong> the bill, the voltage level and the category <strong>of</strong>the customer. In approximately 50 per cent <strong>of</strong> replies to the questi<strong>on</strong>naire compensati<strong>on</strong> is paidautomatically, in other cases up<strong>on</strong> request <strong>of</strong> the customer. (Table 3.20 <strong>of</strong> Annex 3B.)CQ#11 The large number <strong>of</strong> countries where the standards for notice <strong>on</strong> scheduled interrupti<strong>on</strong> areapplied clearly shows the importance that regulators attribute to inform the customers <strong>of</strong> all foreseeableinterrupti<strong>on</strong>s. CEER recommends that providing informati<strong>on</strong> 24 hours prior to the interrupti<strong>on</strong>may not be sufficient for small industrial customers to take the appropriate preventive measures.Therefore some working day(s) for sending a prior notice is (are) recommended.Quest.2.1.8Supp.680Recomm.✰✰✰✰DSO6OS GS2 93.3.4.2 Standards applied for resp<strong>on</strong>ding to queries for informati<strong>on</strong> associated with charges andpaymentsThe standard (applied for resp<strong>on</strong>ding to queries for informati<strong>on</strong> associated with the charges andpayments) sets in three countries is 5, in <strong>on</strong>e country is 7, in two country is 10 and in two furthercountries 15 and 20 working days, respectively. These periods relate to the requirements <strong>on</strong> electricitycompanies to resp<strong>on</strong>d to customer’s queries regarding charges and payment. The sum <strong>of</strong>Council <strong>of</strong> European Energy Regulators – Ref: C05-QOS-01-03
the compensati<strong>on</strong> paid by the electricity company in case <strong>of</strong> n<strong>on</strong>-compliance varies between €1,9 and € 30 for household customers. In the Czech Republic the sum is determined by the durati<strong>on</strong><strong>of</strong> the delay. In Hungary it is determined by the category <strong>of</strong> the customer and the voltagelevel, in Portugal it is determined by the c<strong>on</strong>necti<strong>on</strong> capacity and the voltage level, while in Spainit is determined by the sum <strong>of</strong> the first complete bill <strong>of</strong> the customer with a minimum <strong>of</strong> € 30 compensati<strong>on</strong>.(Table 3.21 <strong>of</strong> Annex 3B.)CQ#12 Due to the very differing results it is recommended to harm<strong>on</strong>ize this standard applied forresp<strong>on</strong>ding to queries for informati<strong>on</strong> associated with the charges and payments across CEERmember authorities. The payment <strong>of</strong> compensati<strong>on</strong> should be automatic.Quest.2.1.15Supp.2Recomm.✰✰✰✰✰DSO7OS GS3 53.3.4.3 Standards applied for answering customer’s lettersThe regulators <strong>of</strong> the CEER member countries answering the questi<strong>on</strong>naire have a rather uniformstandpoint in this questi<strong>on</strong>. The resp<strong>on</strong>se time is 15 days in almost every case. The requiredresp<strong>on</strong>se time is l<strong>on</strong>ger in Est<strong>on</strong>ia (30 days), in Greece if there is a need to visit the site (15 workingdays), and in Italy (20 days), while in France it is shorter 8 days. In Italy this level does nothave to be met in 100% <strong>of</strong> the cases, but in 90% for low voltage and in 95% <strong>of</strong> cases for mediumvoltage customers. In Latvia it is not the regulator who determines this standard, but it is includedin the internal regulati<strong>on</strong> prepared by the licensees. In case <strong>of</strong> n<strong>on</strong>-compliance the rate <strong>of</strong> compensati<strong>on</strong>to be paid is € 15-25 for household customers. In case <strong>of</strong> n<strong>on</strong>-household customers itis between € 40 and € 120. In Poland the sum <strong>of</strong> the compensati<strong>on</strong> is proporti<strong>on</strong>ate to the durati<strong>on</strong><strong>of</strong> the delay. (Table 3.22 <strong>of</strong> Annex 3B.)CQ#13 The experience shows that the 15-day resp<strong>on</strong>se time for answering customer’s letters can bemet by the licensees and it is also acceptable for the customers. However, c<strong>on</strong>sidering the morecomplicated cases which occur from time to time, it is also reas<strong>on</strong>able, that this period should not berespected in 100% <strong>of</strong> the cases, in certain percentage when it is impossible to give appropriateanswer within the deadline, a notice to the customer is to be sent disclosing the reas<strong>on</strong>s and time <strong>of</strong>expected answer. As a c<strong>on</strong>diti<strong>on</strong> <strong>of</strong> this, data management system should be established recordingeach and every customer c<strong>on</strong>tact, and which is able to reliably produce the required records.Furthermore, it is recommended to introduce an absolute time during which all matters should besettled. If regulator decides so data availability enables automatic compensati<strong>on</strong>.Quest.1.1.7Supp.2Recomm.✰✰✰✰✰DSO53.3.4.4 Actual levels for the average resp<strong>on</strong>se time <strong>of</strong> answering written queriesAnswers were received from six regulators. The applied resp<strong>on</strong>se times are between 3 and 18days. The data have been supplied mostly by the distributors, while, in the case <strong>of</strong> Est<strong>on</strong>ia and Italythe delivered data relates to the supplier. The Hungarian data include the resp<strong>on</strong>se time <strong>of</strong> theanswers related not <strong>on</strong>ly to the distributors, but also to the suppliers. (Table 3.23 <strong>of</strong> Annex 3B.)The following table shows expected and the actual values <strong>of</strong> the indices menti<strong>on</strong>ed in this secti<strong>on</strong>.A more detailed table can be found in Annex 3B.81<str<strong>on</strong>g>Third</str<strong>on</strong>g> <str<strong>on</strong>g>Benchmarking</str<strong>on</strong>g> <str<strong>on</strong>g>Report</str<strong>on</strong>g> <strong>on</strong> <strong>Quality</strong> <strong>of</strong> <strong>Electricity</strong> <strong>Supply</strong> – 2005 · Chapter 3
TABLE 3.24 RESPONSE TO CUSTOMER'S WRITTEN QUERIES353025Days20151050Est<strong>on</strong>ia30 7France8Greece14Hungary15 11Ireland3Italy DSO28 18Italy Supp.28 16,8Latvia15 15Poland14Portugal21 9Slovenia8Slovenia4Sweden14■ 2.1.15. Resp<strong>on</strong>se to customers letters [Standard] (day) ■ 1.1.7. Average resp<strong>on</strong>se time to customer's written queries [Actual level] (day)Country3.3.5 Customer c<strong>on</strong>tact in pers<strong>on</strong>Quest.2.1.9Supp.1Recomm.✰✰✰✰✰DSO8OS GS0 83.3.5.1 Standards applied for keeping scheduled appointmentsIn the case <strong>of</strong> scheduled appointments 3 countries apply a window <strong>of</strong> 4-hour intervals, an other 3countries a 3-hours, <strong>on</strong>e country 2-hours, and there is also <strong>on</strong>e country applying 1-hour interval.These appointments shall <strong>on</strong>ly be during the working hours <strong>of</strong> the licensees. In case <strong>of</strong> n<strong>on</strong>-compliancethe compensati<strong>on</strong> rate payable to the customer varies between € 15 and € 40 for domestic c<strong>on</strong>sumers.Its higher for LV n<strong>on</strong>-domestic c<strong>on</strong>sumers e.g. in Italy or in Hungary. The sum may be influencedby the category <strong>of</strong> the customer, the voltage level, and the c<strong>on</strong>necti<strong>on</strong> capacity. In Portugal thecustomer also has to pay if it is not available at the time <strong>of</strong> the scheduled appointment. Both types <strong>of</strong>compensati<strong>on</strong> payment are applied (automatic and up<strong>on</strong> request). (Table 3.25 <strong>of</strong> Annex 3B.)CQ#14 The regulator should require a maximum <strong>of</strong> 4 hours intgerval for licensee to respect whenscheduling appointments with customers. This means that it is not acceptable that the customershould wait for more than 4 hours for an acti<strong>on</strong> which <strong>of</strong>ten lasts <strong>on</strong>ly 10-15 minutes. CEER notescustomer’s expectati<strong>on</strong> that compensati<strong>on</strong> payments are <strong>of</strong> higher importance than in other cases,since by waiting at the site, actual costs may arise to the customer, which have to be compensated.82Council <strong>of</strong> European Energy Regulators – Ref: C05-QOS-01-03
Quest.2.1.23Supp.0Recomm.✰✰✰DSO1OS GS1 03.3.5.2 Standards applied for the attendance <strong>of</strong> customer centers 15In the first round <strong>of</strong> reducti<strong>on</strong> <strong>of</strong> the operating costs (especially after privatizati<strong>on</strong> and/or after theintroducti<strong>on</strong> <strong>of</strong> incentives into the network charge regulati<strong>on</strong>) in most cases it is <strong>of</strong>ten the traditi<strong>on</strong>alcustomer centers which have been reduced or closed. Distributors and suppliers favor upto-dateforms <strong>of</strong> administrati<strong>on</strong> which are more cost-effective: Call Centres or the Internet.However, for some customers these changes are too fast. They are used to the old practice: „I gothere, I sit down, we discuss the problem and we arrange it”, they prefer to go to the customercentres. It may be the case that as Call Centres develop customers may be reluctant to try thistype <strong>of</strong> communicati<strong>on</strong> channel in which case Call Centres will have unused capacities, while dueto the customer centre closures the existing customer centres suddenly have to face an increasedattendance. In medium/l<strong>on</strong>ger term more and more customers using the customer centres, willswitch to Call Centres or other new forms <strong>of</strong> communicati<strong>on</strong>. (Table 3.26 <strong>of</strong> Annex 3B.)Quest.1.1.1Supp.3Recomm.✰✰✰✰DSO53.3.5.3 Actual levels applied for the average waiting time in the customer centresThe actual levels <strong>of</strong> waiting time in the customer centres range between 6 and 20 minutes. In fivecountries the data refer to the distributor licensee, while in the case <strong>of</strong> three countries they referto the supplier. Greek data refer to both DSOs and suppliers as sources <strong>of</strong> data. (The data providedto RAE by PPC – collectively as DSO and main supplier – corresp<strong>on</strong>d to 50 large customercentres, where an automated system is in operati<strong>on</strong>, out <strong>of</strong> a total <strong>of</strong> 223 customer centresnati<strong>on</strong>wide.) Almost every regulator has presented the data provided by the companies supplyingthe specific regi<strong>on</strong>s in a different way. The regulator <strong>of</strong> Greece calculated an average withoutweighting it by the number <strong>of</strong> customers while the regulator <strong>of</strong> Hungary weighted it by the number<strong>of</strong> customers. The regulator <strong>of</strong> Est<strong>on</strong>ia calculated the targets from the waiting time in the customercenters operating in the cities with the number <strong>of</strong> customers living in the territory <strong>of</strong> the customercenters. (Table 3.27 <strong>of</strong> Annex 3B.)CQ#15 Since in the majority <strong>of</strong> cases there are many other ways <strong>of</strong> communicati<strong>on</strong> (teleph<strong>on</strong>e, Internet)which are more and more popular, the harm<strong>on</strong>izati<strong>on</strong> <strong>of</strong> this indicator is not necessary. However,in theshort term in smaller settlements (rural area), until modern communicati<strong>on</strong> means become widely used,the regulators could c<strong>on</strong>sider whether it is necessary to maintain appropriate number <strong>of</strong> customercentres to meet customer expectati<strong>on</strong>s and to comply with standards for waiting times.The following table shows the expected and the actual values <strong>of</strong> the indices menti<strong>on</strong>ed in this secti<strong>on</strong>.A more detailed table can be found in Annex 3B.15A distincti<strong>on</strong> is made between traditi<strong>on</strong>al "customer centres" which are a phisical locati<strong>on</strong> and ph<strong>on</strong>e/internet "call" centres.83<str<strong>on</strong>g>Third</str<strong>on</strong>g> <str<strong>on</strong>g>Benchmarking</str<strong>on</strong>g> <str<strong>on</strong>g>Report</str<strong>on</strong>g> <strong>on</strong> <strong>Quality</strong> <strong>of</strong> <strong>Electricity</strong> <strong>Supply</strong> – 2005 · Chapter 3
TABLE 3.28 WAITING TIME IN CUSTOMER CENTERS252015Min1050Est<strong>on</strong>ia6France21Greece12,5Hungary17,6Latvia10Portugal20Slovenia10■ 2.1.15. Attendance in customers centres (Standart) min ■ Average waiting time in customer centres (Fact) minCountry3.3.6 Customer c<strong>on</strong>tact by ph<strong>on</strong>eQuest.2.1.24Supp.2Recomm.✰✰✰✰✰DSO2OS GS4 03.3.6.1 Standards applied for the service level indicators <strong>of</strong> Call CentresUnfortunately, despite the great importance attached to this form <strong>of</strong> c<strong>on</strong>tact by the licensees, theresp<strong>on</strong>ses referred to surprisingly few standards, and not all resp<strong>on</strong>ses referred to the same indicator.In France the relevant standard prescribes, that the number <strong>of</strong> aband<strong>on</strong>ed calls should notbe more than 5% <strong>of</strong> all incoming calls. The Hungarian and the Portuguese standards refer to thesame parameter, but the expectati<strong>on</strong>s are different. In Hungary 80% <strong>of</strong> the calls shall be receivedwithin 30 sec<strong>on</strong>ds, while in Portugal within 60 sec<strong>on</strong>ds. In Ireland the standard is that 75% <strong>of</strong> thecall shall be received within 20 sec<strong>on</strong>ds. The provisi<strong>on</strong> <strong>of</strong> an automatic message informing thecustomer <strong>on</strong> the expected waiting time or <strong>on</strong> the busyness <strong>of</strong> the administrator is not regarded asan actual answer in any <strong>of</strong> countries. As this is an average measure <strong>of</strong> performance, in case <strong>of</strong>n<strong>on</strong>-compliance no compensati<strong>on</strong> is payed to customers. (Table 3.29 <strong>of</strong> Annex 3B.)CQ#16 From the answers to the questi<strong>on</strong>naires received it is not clear that the standards for theservice level in Call Centres refer to the distributor licensee or the supplier licensee, therefore it isrecommended to make clear first <strong>of</strong> all the interpretati<strong>on</strong> <strong>of</strong> the standard.Quest.1.1.3Supp.384Recomm.✰✰✰✰DSO53.3.6.2 Actual levels for the average waiting time measured in Call CentresThe data received <strong>on</strong> actual levels <strong>of</strong> performance for waiting times in call centres are typicallybetween 15 and 70 sec<strong>on</strong>ds. In five cases the data suppliers were the distributors, in three casesthey were the suppliers. The Italian data are based <strong>on</strong> the ENEL data-supply <strong>of</strong> the sec<strong>on</strong>d half <strong>of</strong>2004. The data <strong>of</strong> Great Britain refer to the period between April 2004 and March 2005. From theresp<strong>on</strong>ses received it is clear that not every regulator measures the speed <strong>of</strong> resp<strong>on</strong>se in thesame way. Some <strong>of</strong> them measure the time from the arrival <strong>of</strong> the incoming call until the call isCouncil <strong>of</strong> European Energy Regulators – Ref: C05-QOS-01-03
answered (for instance Portugal and Italy), others (like Hungary) measure the time after the selecti<strong>on</strong>from the menu until the start <strong>of</strong> the answer (Table 3.30 <strong>of</strong> Annex 3B.)CQ#17 Instead <strong>of</strong> visiting the customer centres more and more customers call the companies byph<strong>on</strong>e. Therefore this service is important for an ever growing number <strong>of</strong> customers. It is important forthem, that they can start the c<strong>on</strong>versati<strong>on</strong> with the operator as so<strong>on</strong> as possible. Due to thesignificance <strong>of</strong> the indicator for the customers, it would be useful to measure the waiting time in aharm<strong>on</strong>ized way. At the same time, it would be useful to establish set <strong>of</strong> customers’ expectati<strong>on</strong>s andbased <strong>on</strong> these stipulate requirements, as guidelines for the licensees when establishing andoperating the Call Centers.3.3.7 Customer complaintsQuest.2.1.16Supp.6Recomm.✰✰✰✰✰DSO8OS GS4 53.3.7.1 Standards applied for resp<strong>on</strong>ses to customers’ complaintsIn relati<strong>on</strong> to written complaints the typical resp<strong>on</strong>se time is 15 days. There is a differing standard inEst<strong>on</strong>ia (for business customers) and in Lithuania, where the required resp<strong>on</strong>se time is max. 30 days,as well as in Spain, where it is 7 days below 15 kW c<strong>on</strong>necti<strong>on</strong> capacity, and in France, where therequired resp<strong>on</strong>se time is a max. <strong>of</strong> 8 days for every customer. The complaints must be answered in21 days in Portugal, and in Spain for over 15 kW c<strong>on</strong>necti<strong>on</strong> capacity. In Lithuania and Portugal thedeadline shall be met in 95% <strong>of</strong> the cases. The compensati<strong>on</strong> fee – in case <strong>of</strong> n<strong>on</strong>-compliance – isbetween € 15 and € 30. The rate <strong>of</strong> compensati<strong>on</strong> may be influenced by the category <strong>of</strong> the customer,the voltage level, the durati<strong>on</strong> <strong>of</strong> the delay and the sum <strong>of</strong> the first complete bill. Compensati<strong>on</strong>payment may be effected both automatically and <strong>on</strong> request. (Table 3.31 <strong>of</strong> Annex 3B.)CQ#18 Regardless <strong>of</strong> whether “written queries” and ”written complaints” are addressed jointly orseparately, the regulators should in any case formulate expectati<strong>on</strong>s towards resp<strong>on</strong>ding written claims.CEER recommends that <strong>on</strong>e must not keep the customer in uncertainty for a l<strong>on</strong>g timein knowingwhether or not his/her complaint has been accepted by the licensee. CEER thinks that the generally used15-day deadline is acceptable standards for resp<strong>on</strong>ding customers’ complaints and that it can be met.Quest.1.1.5Supp.2Recomm.✰✰✰✰DSO93.3.7.2 Actual levels applied for the number <strong>of</strong> complaints per 100 customersData were supplied by six distributors and in case <strong>of</strong> Greece and Italy by suppliers. The Greekdata refer <strong>on</strong>ly to written complaints. The Hungarian data include not <strong>on</strong>ly the complaints arrivedto the distributor, but also those received by the supplier. Figures <strong>of</strong> less than <strong>on</strong>e are typical forthis indicator. (Table 3.32 <strong>of</strong> Annex 3B.)Quest.1.1.6Supp.2Recomm.✰✰✰✰DSO63.3.7.3 Actual levels relevant to the average time <strong>of</strong> written resp<strong>on</strong>ses to customers’ complaintsThe resp<strong>on</strong>ses indicated that average time <strong>of</strong> written resp<strong>on</strong>ses to customers’ complaints rangedbetween 3 days and 15 days. The data referred to the distributor, but in the case <strong>of</strong> Est<strong>on</strong>ia andItaly the supplier also delivered data. The latter, generally for this reas<strong>on</strong>, indicated separately the85<str<strong>on</strong>g>Third</str<strong>on</strong>g> <str<strong>on</strong>g>Benchmarking</str<strong>on</strong>g> <str<strong>on</strong>g>Report</str<strong>on</strong>g> <strong>on</strong> <strong>Quality</strong> <strong>of</strong> <strong>Electricity</strong> <strong>Supply</strong> – 2005 · Chapter 3
data supplied by the distributor and the supplier. The number <strong>of</strong> working days have been c<strong>on</strong>vertedinto calendar days (2 working days = 3 calendar days) (Table 3.33 <strong>of</strong> Annex 3B.)The following table shows the expected and the actual values <strong>of</strong> the indices menti<strong>on</strong>ed in this secti<strong>on</strong>.A more detailed table can be found in Annex 3B.TABLE 3.34 RESPONSE TO CUSTOMER'S WRITTEN COMPLAINTS353025Days20151050Est<strong>on</strong>ia30 15France8Hungary15Ireland5Italy*28 18Latvia15 15Lithuania30 11Poland14Portugal21 3Slovenia5Spain
countries who supplied data have a practice <strong>of</strong> compensati<strong>on</strong> payment in case <strong>of</strong> n<strong>on</strong>-compliance<strong>of</strong> the meter-reading requirements. (Table 3.35 <strong>of</strong> Annex 3B.)CQ#19 Meter readings and through it the accuracy <strong>of</strong> the bills cause the largest number <strong>of</strong> customercomplaints. Customers <strong>of</strong>ten dislike flat rate payments calculated <strong>on</strong> the basis <strong>of</strong> <strong>on</strong>e single readingper year, because <strong>of</strong> the eventually high sum year-end balance. They would like to know the precisec<strong>on</strong>sumpti<strong>on</strong> in a given period <strong>of</strong> time and they wish to pay accordingly. Regulators should discusswith the representative organizati<strong>on</strong>s <strong>of</strong> distributors the advantages/disadvantages and theopti<strong>on</strong>s/costs <strong>of</strong> the meters suitable for automatic meter reading (AMR). Thus in the medium term itmay become possible to read the meter <strong>of</strong> every customer in every m<strong>on</strong>th without his assistance andto issue a bill <strong>on</strong> this basis. CEER member authorities intend to further address this issue in 2006.Quest.1.1.8Supp.0Recomm.✰✰✰✰DSO83.3.8.2 Actual levels applied for the annual readings by the distributor licenseeThe data from the six replies vary between 1.3 and 3.72 average meter-readings per customerper year. The data supplier was the distributor in all cases. In Portugal <strong>on</strong>ly low voltage customershave been taken into c<strong>on</strong>siderati<strong>on</strong> up to a c<strong>on</strong>tracted capacity <strong>of</strong> 41.4 kVA. In Sweden the issue<strong>of</strong> annual readings are under revisi<strong>on</strong> by the regulator. According to the relevant legal regulati<strong>on</strong>sfrom 2009 all meters shall be read in every m<strong>on</strong>th, and the customers will pay for actual c<strong>on</strong>sumpti<strong>on</strong>.(Table 3.36 <strong>of</strong> Annex 3B.)The following table shows the expected and the actual values <strong>of</strong> the indices menti<strong>on</strong>ed in this secti<strong>on</strong>.A more detailed table can be found in Annex 3B.TABLE 3.37 NUMBER OF METER READINGS43,532,5Year21,510,50Austriasmall cust.Belgium(Flanders) LVEst<strong>on</strong>ia France Hungary Ireland Italy Latvia Norway Portugal Sloveniasmall cust.1 1 1,89 2 1,86 1 1,42 1 3,72 1 1 1,3 1 1 1,8 1 2,3 2 1SpainSweden■ 2.1.14. Number <strong>of</strong> meter readings within a year [Standard] ■ 1.1.8. Average annual meter readings per customer for LV (carried out by the network operator) [Actual level]Country87<str<strong>on</strong>g>Third</str<strong>on</strong>g> <str<strong>on</strong>g>Benchmarking</str<strong>on</strong>g> <str<strong>on</strong>g>Report</str<strong>on</strong>g> <strong>on</strong> <strong>Quality</strong> <strong>of</strong> <strong>Electricity</strong> <strong>Supply</strong> – 2005 · Chapter 3
3.4. Standards and actual levels <strong>of</strong> Commercial <strong>Quality</strong> related to transmissi<strong>on</strong>3.4.1 Applied standardsFour countries supplied data to these questi<strong>on</strong>s <strong>on</strong> the actual levels <strong>of</strong> commercial standardsrelated to transmissi<strong>on</strong> (Table 2.2 <strong>of</strong> questi<strong>on</strong>naire). Every country supplied informati<strong>on</strong> regardingstandards in accordance with its own regulati<strong>on</strong>s. The low number <strong>of</strong> replies can be explained bytwo reas<strong>on</strong>s: the quality regulati<strong>on</strong> <strong>of</strong> the operator <strong>of</strong> the transmissi<strong>on</strong> network does not bel<strong>on</strong>g tothe scope <strong>of</strong> activity <strong>of</strong> the regulator <strong>of</strong> the given country, or, due to the low number <strong>of</strong> problemsin the transmissi<strong>on</strong> network (TSO) this area is not c<strong>on</strong>sidered as primarily critical from the point <strong>of</strong>view <strong>of</strong> the service level <strong>of</strong> customers. It has to be noted, that in case <strong>of</strong> n<strong>on</strong>-compliance with thestandards listed below the TSO is not obliged to pay compensati<strong>on</strong> in any <strong>of</strong> the indicated cases.3.4.1.1 BelgiumDuring the preliminary examinati<strong>on</strong> <strong>of</strong> the c<strong>on</strong>necti<strong>on</strong> to the grid the examinati<strong>on</strong> <strong>of</strong> the completeness<strong>of</strong> the applicati<strong>on</strong> must take place within 10 working days. If the applicati<strong>on</strong> proves to becomplete, the quotati<strong>on</strong> which includes the technical informati<strong>on</strong> will be prepared within 40 workingdays. The final analysis <strong>of</strong> the c<strong>on</strong>necti<strong>on</strong> to the grid starts again with the examinati<strong>on</strong> <strong>of</strong> thecompleteness <strong>of</strong> the applicati<strong>on</strong>. This is performed within 10 working days. This is followed by theexaminati<strong>on</strong> <strong>of</strong> the technical soluti<strong>on</strong>s together with the petiti<strong>on</strong>er within 40 working days. At theend the c<strong>on</strong>clusi<strong>on</strong> <strong>of</strong> the technical agreement will follow within 60 working days. The TSO willsend a proposal to the customer relevant to the c<strong>on</strong>necti<strong>on</strong> agreement within 30 working days.For the c<strong>on</strong>clusi<strong>on</strong> <strong>of</strong> the c<strong>on</strong>tract there are a further 30 working days available. A change <strong>of</strong> suppliermust be arranged within 5 working days. The TSO will provide authenticated data for everysupplier in each m<strong>on</strong>th, at least relevant to the previous m<strong>on</strong>th.3.4.1.2 Est<strong>on</strong>iaComplaints associated with the meter device are investigated within five working days. The informati<strong>on</strong>relevant to the planned modificati<strong>on</strong>s to be carried out <strong>on</strong> the meter device shall be sentto the customer a minimum <strong>of</strong> 5 days before starting the work. The notice <strong>on</strong> the scheduled interrupti<strong>on</strong>sshall be sent to the customer until the 15 th day <strong>of</strong> the previous m<strong>on</strong>th. The <strong>of</strong>fer for c<strong>on</strong>necti<strong>on</strong><strong>of</strong> a new customer shall be answered within 90 days. The maximum durati<strong>on</strong> <strong>of</strong> n<strong>on</strong>scheduledinterrupti<strong>on</strong>s may be 12 hours, and may not exceed 240 hours in total <strong>on</strong> annual level.3.4.1.3 France<strong>Supply</strong> interrupti<strong>on</strong>s are scheduled in cooperati<strong>on</strong> with the customer. Five days <strong>of</strong> scheduled interrupti<strong>on</strong>are permissible over three years. Scheduling shall be d<strong>on</strong>e a minimum <strong>of</strong> 15 days prior tothe planned interrupti<strong>on</strong>. In case <strong>of</strong> c<strong>on</strong>necting a new customer to the grid 90 days are availablefor preparing the cost estimate <strong>of</strong> the works. According to the Guaranteed Standards customers’queries shall be answered within 30 days, while the resp<strong>on</strong>se time according to the GeneralStandards is 15 days. C<strong>on</strong>tact will be established automatically in the case <strong>of</strong> voltage problems,88Council <strong>of</strong> European Energy Regulators – Ref: C05-QOS-01-03
metering problems, customer’s queries relevant to charges and payments, appointment scheduling,relocati<strong>on</strong> and replacement <strong>of</strong> the meter, carrying out <strong>on</strong>-site works.3.4.1.4 SloveniaThe customer shall be informed <strong>of</strong> the scheduled interrupti<strong>on</strong> at least 48 hours in advance. Duringa possible breakdown rectificati<strong>on</strong> shall be commenced within 2 hours, and the fault shall be eliminatedwithin 4 hours. Voltage complaints shall be investigated within 8 days and within another 8days shall be answered. In case <strong>of</strong> problems associated with charges and payments the customerwill inform TSO about the problem within 8 days, and TSO shall answer within another 8 days.3.4.2 Actual levels <strong>of</strong> the commercial quality indicators (transmissi<strong>on</strong>)Three countries supplied data relevant to this table (1.2) <strong>of</strong> the questi<strong>on</strong>naire.3.4.2.1 BelgiumIn Belgium the customers supplied <strong>on</strong> a voltage level between 150 kV and 380 kV bel<strong>on</strong>g to thiscategory. In their case no complaint has been lodged due to n<strong>on</strong>-compliance with the time givenfor the specific steps <strong>of</strong> c<strong>on</strong>necti<strong>on</strong> to the grid.3.4.2.2 Est<strong>on</strong>iaIn Est<strong>on</strong>ia the number <strong>of</strong> customers c<strong>on</strong>necting to the grids <strong>of</strong> a voltage level <strong>of</strong> 110 kV and aboveis 13 in total. Only <strong>on</strong>e <strong>of</strong> them had made a complaint in 2004. In case <strong>of</strong> written complaint theaverage resp<strong>on</strong>se time was 15 days (in the above menti<strong>on</strong>ed single case). The average resp<strong>on</strong>setime in case <strong>of</strong> a written customer’s query is 10 days. The proporti<strong>on</strong> <strong>of</strong> estimated bills and correctedbills is 2% in both categories.3.4.2.3 FranceIn France for customers c<strong>on</strong>necting to a network <strong>of</strong> a voltage level between 63 kV and 400 kV thetotal number <strong>of</strong> complaints in 2004 was 142 and 65 in the first five m<strong>on</strong>ths <strong>of</strong> 2005.3.5. C<strong>on</strong>clusi<strong>on</strong>s and recommendati<strong>on</strong>s1. C<strong>on</strong>tent <strong>of</strong> standards and indicators: The results <strong>of</strong> the analysis <strong>of</strong> standards <strong>of</strong> commercialquality show that the regulating authorities closely follow the level <strong>of</strong> the services provided tocustomers. However, it is also clear from the received data/informati<strong>on</strong> that in the memberstates there are significantly different sets <strong>of</strong> standards with different c<strong>on</strong>tents and implementati<strong>on</strong>levels. Before the next benchmarking analysis is c<strong>on</strong>ducted the CEER shall clarify preciselyall specific indicators used in each country, since otherwise the analysis <strong>of</strong> the receivedresults may lead to false c<strong>on</strong>clusi<strong>on</strong>s. (For example: unique definiti<strong>on</strong> <strong>of</strong> waiting time in the CallCenters; what kinds <strong>of</strong> calls are counted into the number <strong>of</strong> calls arriving to the Call Center;what kinds <strong>of</strong> complaints count as teleph<strong>on</strong>e complaint; how waiting times are calculated; etc.)89<str<strong>on</strong>g>Third</str<strong>on</strong>g> <str<strong>on</strong>g>Benchmarking</str<strong>on</strong>g> <str<strong>on</strong>g>Report</str<strong>on</strong>g> <strong>on</strong> <strong>Quality</strong> <strong>of</strong> <strong>Electricity</strong> <strong>Supply</strong> – 2005 · Chapter 3
2. Level <strong>of</strong> unbundling: The situati<strong>on</strong> is made even more complicated by the fact, that the scope<strong>of</strong> activities and resp<strong>on</strong>sibilities <strong>of</strong> the supplier, the distributor and the public utility (regulatedtariff) supplier are not always clearly separated. From the data provided and from the indicati<strong>on</strong><strong>of</strong> the licensee resp<strong>on</strong>sible for data supply it seems that in the countries where liberalizati<strong>on</strong>has fully been realized and competiti<strong>on</strong> is efficient, the data supplier is almost exclusively thedistributor, and the regulatory authority deals solely with the supervisi<strong>on</strong> <strong>of</strong> the activity <strong>of</strong> thedistributor. However, in case <strong>of</strong> countries where the supplier has not yet been legally separatedfrom the distributor, the regulatory authorities supervise all electricity companies performingboth distributi<strong>on</strong> and commercial tasks. This duality also appears in the supplied data, since theindicated values are generally higher in these countries than the data <strong>of</strong> the countries havingrealized the unbundling <strong>of</strong> activities and effective competiti<strong>on</strong>.3. Ways <strong>of</strong> quality regulati<strong>on</strong>s: Regarding the type <strong>of</strong> quality regulati<strong>on</strong> the realizati<strong>on</strong> <strong>of</strong> two differentc<strong>on</strong>cepts can be shown.1. On the <strong>on</strong>e side, and this is more general, regulatory authorities prescribe objective requirements,and they measure the compliance, and in case <strong>of</strong> n<strong>on</strong>-compliance they impose a kind<strong>of</strong> sancti<strong>on</strong>. Thus the licensees are expected to comply with the level set by the authority. In thiscase the regulator is largely resp<strong>on</strong>sible for establishing indicators and requirements (standards),in order to assure an appropriate service level for the customer.1. Another possibility is the analysis <strong>of</strong> the subjective elements, where by collecting the opini<strong>on</strong>and expectati<strong>on</strong> <strong>of</strong> the customers c<strong>on</strong>tinuously or temporarily, the electricity companies arequalified and ranked <strong>on</strong> the basis <strong>of</strong> the customer’s opini<strong>on</strong>. In this case it is not the expectati<strong>on</strong>s<strong>of</strong> the regulator that will be the driving force <strong>of</strong> quality improvement, but the ranking <strong>of</strong>companies according to customers’ views, which will stimulate the electricity companies tomake all possible efforts to improve. Obviously, the combinati<strong>on</strong> <strong>of</strong> the two above opti<strong>on</strong>s is themost desirable.4. The method <strong>of</strong> ranking <strong>of</strong> suppliers publicly can be the simplest way in countries where thereare the social and cultural bases in place and ec<strong>on</strong>omy is in such a c<strong>on</strong>diti<strong>on</strong> that the competiti<strong>on</strong><strong>on</strong> the market has a forcing effect <strong>on</strong> the electricity companies without any special regulatoryinterference. This type <strong>of</strong> market regulati<strong>on</strong> may also result in a situati<strong>on</strong> where there areno requirements expressed in figures, or there are <strong>on</strong>ly a few <strong>of</strong> them which are <strong>of</strong> a generalcharacter (Sweden, Norway). However, for this it is necessary that the companies have a servicelevel accepted by the society, and where it is enough to focus solely to the preventi<strong>on</strong> <strong>of</strong>worsening performance.4. Regulati<strong>on</strong>s by standards: In countries where the regulator chooses the objective indicatoropti<strong>on</strong> there could be at least two ways to sancti<strong>on</strong>. First, the regulator can establish overallstandards (OS) and failure in performance results in impositi<strong>on</strong> <strong>of</strong> penalty or in applicati<strong>on</strong> <strong>of</strong>price reducti<strong>on</strong>. Sec<strong>on</strong>d, a more customer-friendly way is the applicati<strong>on</strong> <strong>of</strong> guaranteed standards(GS), by which affected customers can be directly compensated if n<strong>on</strong>-performance isevident. The tendency is for regulators to move from OS towards GS like in Great Britain whereno OS are in force anymore and in Italy where the number <strong>of</strong> OS have been reduced step by90Council <strong>of</strong> European Energy Regulators – Ref: C05-QOS-01-03
step. CEER recommends that member states put in place guaranteed standards together withautomatic compensati<strong>on</strong> directly to the customer, where appropriate.5. One goal – more soluti<strong>on</strong>s: This <str<strong>on</strong>g>Report</str<strong>on</strong>g> shows that the same goal can be achieved in differentways, depending <strong>on</strong> the circumstances. Any <strong>of</strong> the different regulati<strong>on</strong> methods can resultin equally high commercial quality. A perspective for future research is evaluating how effectiveis the regulati<strong>on</strong> <strong>of</strong> the commercial quality across countries. CEER should focus its attenti<strong>on</strong> <strong>on</strong>the effects following the introducti<strong>on</strong> <strong>of</strong> the specific indicators: how the service quality hasimproved, how easily the expected value (required service level) can be complied with orindeed whether the penalties paid for n<strong>on</strong>-compliance have an appropriate effect. Even if it isnot known, so far, the effects <strong>of</strong> commercial quality regulati<strong>on</strong>, <strong>on</strong>e thing is sure that the nati<strong>on</strong>alregulatory authorities have had reas<strong>on</strong>s to establish their regulati<strong>on</strong> system as it was, sincein their c<strong>on</strong>siderati<strong>on</strong> that was the most effective means in the given ec<strong>on</strong>omical, political andcultural envir<strong>on</strong>ment.6. Automatic Meter Reading as target: From the informati<strong>on</strong> received it is apparent, that theaccuracy <strong>of</strong> the issued bills and the real values <strong>of</strong> the billed c<strong>on</strong>sumpti<strong>on</strong> have an ever greaterimportance both for the customers and the licensees. Developments have been started in severalcountries the aim <strong>of</strong> which was to acquire m<strong>on</strong>thly (or more frequent) meter readings without“disturbing” the customers. To this end in some countries automatic metering systems (AMS)will be established, which can make possible the (remote-c<strong>on</strong>trolled) reading <strong>of</strong> the meters withopti<strong>on</strong>al frequency, without the necessity <strong>of</strong> the assistance <strong>of</strong> the customer. In Italy the system isunder c<strong>on</strong>structi<strong>on</strong> and for all ENEL customers it will be completed by the end <strong>of</strong> 2006, while inSweden m<strong>on</strong>thly reading and billing shall be resolved in case <strong>of</strong> all LV customers by 2009.7. Appointments scheduling: It can be problematic for distributors to schedule appointmentswith customers. In general, the time which is good for <strong>on</strong>e party is not good for the other, andvice versa. Remote c<strong>on</strong>trol systems <strong>of</strong>fer soluti<strong>on</strong> to this problem. Moreover, in case <strong>of</strong> thechange <strong>of</strong> customer AMS enables the DSO to start the billing process by remote c<strong>on</strong>trol. Withthe overall establishment <strong>of</strong> such systems customer’s queries can significantly be reduced, thereading and billing process can be made more simple, and in specific cases the executi<strong>on</strong> timecan be less. On customer’s side, the use <strong>of</strong> opti<strong>on</strong> <strong>of</strong> recording multiple readings in the bill willresult in tougher competiti<strong>on</strong> in the retail sector (switch to another supplier).8. New means <strong>of</strong> communicati<strong>on</strong>: The new communicati<strong>on</strong> forms were made possible by thetechnical development and the problem <strong>of</strong> their handling is worth menti<strong>on</strong>ing. The opti<strong>on</strong> <strong>of</strong> e-mail communicati<strong>on</strong> and perhaps mobile ph<strong>on</strong>e SMS are an ever growing requirement from thepart <strong>of</strong> the customers, and the electricity companies endeavour to create the possibility.However, customers sometimes have unreas<strong>on</strong>able expectati<strong>on</strong>s. Except for the reports <strong>on</strong>events or a breakdown endangering the safety <strong>of</strong> life or property, the changes in the (communicati<strong>on</strong>)form <strong>of</strong> the reports do not justify prompt arrangement, all the more, since this wouldimpose disadvantage to those customers who c<strong>on</strong>tinue to submit queries in the traditi<strong>on</strong>al way.91<str<strong>on</strong>g>Third</str<strong>on</strong>g> <str<strong>on</strong>g>Benchmarking</str<strong>on</strong>g> <str<strong>on</strong>g>Report</str<strong>on</strong>g> <strong>on</strong> <strong>Quality</strong> <strong>of</strong> <strong>Electricity</strong> <strong>Supply</strong> – 2005 · Chapter 3
Thus it is recommended to handle the e-mail and SMS communicati<strong>on</strong> according to the rulesrelevant to written reports.9. Dialog with partners: Finally, it worth to state, that the c<strong>on</strong>tinuous c<strong>on</strong>sultati<strong>on</strong> with the customerorganizati<strong>on</strong>s <strong>on</strong> their expectati<strong>on</strong> regarding commercial quality and with the licenseholders <strong>on</strong> feasibility <strong>of</strong> fulfilment <strong>of</strong> such expectati<strong>on</strong>s, <strong>on</strong> planned acti<strong>on</strong>s and <strong>on</strong> the method<strong>of</strong> data gathering is extremely important for the nati<strong>on</strong>al regulators.92Council <strong>of</strong> European Energy Regulators – Ref: C05-QOS-01-03
CHAPTER 4 – Voltage <strong>Quality</strong> M<strong>on</strong>itoring Systems,Standards and Market MechanismsCONTENT4.1 Introducti<strong>on</strong>: What is Voltage <strong>Quality</strong> and why are Regulators interested in it? 954.2 Voltage quality m<strong>on</strong>itoring systems 964.3 Individual voltage quality verificati<strong>on</strong> 984.4 Voltage quality standards 1004.5 Market mechanisms for improving quality 1044.6 Main findings <strong>of</strong> the survey about voltage quality 1064.7 C<strong>on</strong>clusi<strong>on</strong>s: recommendati<strong>on</strong>s for the future work <strong>on</strong> Voltage <strong>Quality</strong> 107Annex to Chapter 4 16393<str<strong>on</strong>g>Third</str<strong>on</strong>g> <str<strong>on</strong>g>Benchmarking</str<strong>on</strong>g> <str<strong>on</strong>g>Report</str<strong>on</strong>g> <strong>on</strong> <strong>Quality</strong> <strong>of</strong> <strong>Electricity</strong> <strong>Supply</strong> – 2005 · Chapter 4
VOLTAGE QUALITY MONITORING SYSTEMS, STANDARDSAND MARKET MECHANISMS4.1 Introducti<strong>on</strong>: what is Voltage <strong>Quality</strong> and why are Regulators interested in it?The term voltage quality (VQ) covers a variety <strong>of</strong> disturbances in power systems. For the purpose<strong>of</strong> this report, the definiti<strong>on</strong> <strong>of</strong> voltage quality is “the characteristics <strong>of</strong> the supply voltage c<strong>on</strong>cerningmagnitude, waveform and symmetry <strong>of</strong> the phases”.The voltage quality parameters are listed and defined in the European standard EN 50160 (1999,Corrigendum Sept. 2004; hereinafter “EN 50160”), which is applicable in all EU countries for lowand medium voltage networks (up to 35 kV). For the purpose <strong>of</strong> this work, we refer to the followingVQ parameters:· supply voltage variati<strong>on</strong>s;· rapid voltage changes;· flicker severity;· supply voltage dips;· temporary (power frequency) and transient (impulsive) overvoltages;· voltage unbalance;· harm<strong>on</strong>ic distorti<strong>on</strong> <strong>of</strong> voltage waveform;· interharm<strong>on</strong>ic voltage;· mains signalling voltage.Generally power quality covers a range <strong>of</strong> factors including interrupti<strong>on</strong>s, but in this report interrupti<strong>on</strong>sare c<strong>on</strong>sidered separately under the heading “c<strong>on</strong>tinuity <strong>of</strong> supply”. 16 This is why here theterm “voltage quality” is used to refer to every disturbance <strong>of</strong> voltage except interrupti<strong>on</strong>s.Furthermore, in this report, we do not draw attenti<strong>on</strong> to frequency variati<strong>on</strong> limits, as they arem<strong>on</strong>itored and managed by the interc<strong>on</strong>nected European power system operators. Frequencyvariati<strong>on</strong>s are <strong>of</strong> c<strong>on</strong>cern for isolated networks, typically <strong>on</strong> islands not synchr<strong>on</strong>ously c<strong>on</strong>nectedto the main grid.In all 19 countries surveyed, EN 50160 is translated and/or applied (it is not yet translated intoLatvian but is applied as a nati<strong>on</strong>al standard), and may or may not be obligatory.EN 50160 refers to low and medium voltage networks; it does not apply to voltage levels higherthan 35 kV. It sets mandatory values <strong>of</strong> compliance, which are stated for <strong>on</strong>ly a few voltage qualityparameters, under normal operating c<strong>on</strong>diti<strong>on</strong>s and for 95% <strong>of</strong> the time (generally valued asthe 95th percentile <strong>of</strong> the 10 minutes average rms values):· supply voltage variati<strong>on</strong>s;· flicker severity;harm<strong>on</strong>ic distorti<strong>on</strong> <strong>of</strong> voltage waveform;·95· mains signalling voltage. <str<strong>on</strong>g>Third</str<strong>on</strong>g> <str<strong>on</strong>g>Benchmarking</str<strong>on</strong>g> <str<strong>on</strong>g>Report</str<strong>on</strong>g> <strong>on</strong> <strong>Quality</strong> <strong>of</strong> <strong>Electricity</strong> <strong>Supply</strong> – 2005 · Chapter 416Please refer to Chapter 1 (c<strong>on</strong>tinuity measurement systems and actual levels) and to Chapter 2 (c<strong>on</strong>tinuity standards and incentiveregimes).
For the rest <strong>of</strong> the voltage quality parameters, <strong>on</strong>ly indicative values are given in EN 50160; thisis especially true for events like voltage dips, which however are the disturbances generally perceivedas annoying by the largest share <strong>of</strong> business customers.Indeed, voltage quality is becoming an important issue in many countries, because <strong>of</strong> the sensitivity<strong>of</strong> end-user equipment and the increasing c<strong>on</strong>cern <strong>of</strong> both distributors and customers. In particularthe wide use <strong>of</strong> electr<strong>on</strong>ic devices in homes and small businesses has increased the sensitivity <strong>of</strong> agreater number <strong>of</strong> users for voltage quality, making it no l<strong>on</strong>ger an issue for big customers <strong>on</strong>ly.In most <strong>of</strong> the EU countries, the regulator is interested in m<strong>on</strong>itoring actual voltage quality levelsand in some cases the regulators have set different, more restrictive voltage quality standardsthan those indicated in EN 50160. In <strong>on</strong>ly a few EU countries is a body other than the regulatorresp<strong>on</strong>sible for voltage quality. For instance, in Lithuania, a functi<strong>on</strong> <strong>of</strong> the State EnergyInspectorate is to assure technical parameters <strong>of</strong> electricity. In Great Britain it is the resp<strong>on</strong>sibility<strong>of</strong> the Department <strong>of</strong> Trade and Industry (DTI) Engineering Inspectorate.This chapter c<strong>on</strong>tains comparative informati<strong>on</strong> about voltage quality m<strong>on</strong>itoring systems, individualvoltage quality verificati<strong>on</strong>, voltage quality standards (in particular those different from EN50160) and experience <strong>of</strong> market mechanisms deployed to cope with voltage quality problems(such as power quality c<strong>on</strong>tracts). The most relevant issues are summarised in findings, and finalrecommendati<strong>on</strong>s c<strong>on</strong>clude the chapter.4.2 Voltage quality m<strong>on</strong>itoring systemsUnlike c<strong>on</strong>tinuity <strong>of</strong> supply, m<strong>on</strong>itoring voltage quality disturbances requires installing specific voltagequality recorders and cannot be obtained through ordinary SCADA systems (as in the case <strong>of</strong>interrupti<strong>on</strong>s).N<strong>on</strong>etheless, a growing number <strong>of</strong> European countries have m<strong>on</strong>itoring systems installed or planto install them in the near future (see table 4.1, where ordinary systems for voltage regulati<strong>on</strong> intransmissi<strong>on</strong> are not c<strong>on</strong>sidered as voltage quality m<strong>on</strong>itoring systems).TABLE 4.1VOLTAGE QUALITY MONITORING SYSTEMSM<strong>on</strong>itoring at both transmissi<strong>on</strong> and distributi<strong>on</strong> levelM<strong>on</strong>itoring <strong>on</strong>ly at transmissi<strong>on</strong> levelM<strong>on</strong>itoring <strong>on</strong>ly at distributi<strong>on</strong> levelProposal stageN<strong>on</strong>eIT*, NO, PT, SLCZ*HUES, SEAT, BE, EE, FI, FR, GB, GR, IE, LV, LT, PL(*) Voltage quality m<strong>on</strong>itoring system currently under commissi<strong>on</strong>ing96Council <strong>of</strong> European Energy Regulators – Ref: C05-QOS-01-03
Even if these m<strong>on</strong>itoring systems are different from each other in many respects, a comm<strong>on</strong> pointis that at least short and l<strong>on</strong>g interrupti<strong>on</strong>s, voltage magnitude, voltage dips and harm<strong>on</strong>ic distorti<strong>on</strong><strong>of</strong> the voltage waveform are m<strong>on</strong>itored. The number and locati<strong>on</strong> <strong>of</strong> voltage recorders is quitedifferent from <strong>on</strong>e country to another. The most interesting cases are the following:· In Norway, a m<strong>on</strong>itoring system has been applied for several years. From 2006, mandatoryvoltage quality m<strong>on</strong>itoring will enter into force. Each network company (even the smallest <strong>on</strong>e)will be obliged to m<strong>on</strong>itor quality parameters c<strong>on</strong>tinuously in different characteristic parts <strong>of</strong> itsMV, HV and EHV power system. At least the following parameters have to be m<strong>on</strong>itored: l<strong>on</strong>g(durati<strong>on</strong> > 3 min.) and short (durati<strong>on</strong> between 1 sec. and 3 min.) interrupti<strong>on</strong>s, voltage dips,temporary overvoltages and rapid voltage changes (>3%). If customers are facing problemsbecause <strong>of</strong> other parameters (harm<strong>on</strong>ics, voltage unbalance, supply voltage variati<strong>on</strong>s, flickerseverity), companies will be obliged to measure these parameters too.· In Hungary, the regulator owns 400 voltage quality recorders that are installed each semesterin <strong>on</strong>e <strong>of</strong> the six distributi<strong>on</strong> companies, at low voltage level <strong>on</strong>ly (around 0.007% related toLV c<strong>on</strong>sumers). The cost <strong>of</strong> m<strong>on</strong>itoring the system is shared between the regulator and theutilities, the former having paid the cost <strong>of</strong> VQ recorders, the latter bearing the cost <strong>of</strong> installati<strong>on</strong>and removal. The regulator chooses the network points randomly, in a way that does notdepend <strong>on</strong> previous events or complaints. The VQ recorder is compliant with all EN61000-4-30 (Class B); the system uses GSM for automatic remote reading. The measurementsare actually in a test phase, because <strong>of</strong> the need to improve the recorder. At the end <strong>of</strong>the test, the measurement results are made public.· In Portugal, there are 61 points m<strong>on</strong>itored <strong>on</strong> the transmissi<strong>on</strong> grid (40 for 4 weeks and therest all year l<strong>on</strong>g); in distributi<strong>on</strong>, all substati<strong>on</strong>s (423) in MV and 1270 power transformati<strong>on</strong>stati<strong>on</strong>s in LV have been m<strong>on</strong>itored for 3 years. The companies pay the cost <strong>of</strong> the m<strong>on</strong>itoringsystem, which m<strong>on</strong>itors not <strong>on</strong>ly the above menti<strong>on</strong>ed voltage characteristics but also theflicker and the unbalance <strong>of</strong> three-phase voltages.· In Slovenia, distributi<strong>on</strong> and transmissi<strong>on</strong> companies are obliged to measure voltage qualityparameters: voltage quality m<strong>on</strong>itoring is implemented in high voltage covering all the substati<strong>on</strong>s(8) and about 10% (160) <strong>of</strong> medium voltage systems; all the voltage quality parametersare m<strong>on</strong>itored according to EN 50160.· In Italy, at the end <strong>of</strong> 2004 the regulator asked the transmissi<strong>on</strong> company to install about <strong>on</strong>ehundred voltage quality recorders; as for distributi<strong>on</strong>, a voltage quality m<strong>on</strong>itoring system <strong>of</strong>400 points (10% <strong>of</strong> MV bus-bars in HV/MV transformers) is under commissi<strong>on</strong>ing. All the voltagequality parameters (except transient overvoltage, interharm<strong>on</strong>ics and mains signallingvoltage) will be m<strong>on</strong>itored from 2006 both <strong>on</strong> transmissi<strong>on</strong> and distributi<strong>on</strong> networks. Thetransmissi<strong>on</strong> m<strong>on</strong>itoring system is paid for by the TSO; for distributi<strong>on</strong>, the system is financedthrough a tariff comp<strong>on</strong>ent funding n<strong>on</strong>-competitive R&D projects, in place since liberalisati<strong>on</strong>started. Both systems involve customer participati<strong>on</strong>, with participating customers paying thecost <strong>of</strong> their own voltage quality recorder: in distributi<strong>on</strong>, for example, a further 200 pointscould be measured at MV customers’ delivery points at their request.· In Spain, the distributi<strong>on</strong> companies and the regulator have been working <strong>on</strong> a procedure forc<strong>on</strong>trolling and measuring voltage quality; in the near future, 10% <strong>of</strong> the busbars in MV <strong>of</strong>each province will be involved (costs will be sustained by the distributi<strong>on</strong> companies).97<str<strong>on</strong>g>Third</str<strong>on</strong>g> <str<strong>on</strong>g>Benchmarking</str<strong>on</strong>g> <str<strong>on</strong>g>Report</str<strong>on</strong>g> <strong>on</strong> <strong>Quality</strong> <strong>of</strong> <strong>Electricity</strong> <strong>Supply</strong> – 2005 · Chapter 4
·In Czech Republic a m<strong>on</strong>itoring system is going to be installed at the interc<strong>on</strong>necti<strong>on</strong> pointsbetween transmissi<strong>on</strong> and distributi<strong>on</strong> networks.The availability, in coming years, <strong>of</strong> voltage quality data <strong>on</strong> both transmissi<strong>on</strong> and distributi<strong>on</strong> gridswill not <strong>on</strong>ly allow a deeper knowledge <strong>of</strong> actual voltage quality levels, but is also likely to enableregulators to define focused acti<strong>on</strong>s plans to improve voltage quality and to set standards in theinterests <strong>of</strong> c<strong>on</strong>sumer protecti<strong>on</strong>.4.3 Individual voltage quality verificati<strong>on</strong>Although voltage quality m<strong>on</strong>itoring systems are very useful for getting a general picture <strong>of</strong> actualaverage voltage quality, for a single customer it is more important to have a specific measurement<strong>of</strong> voltage quality levels <strong>on</strong> its own c<strong>on</strong>necti<strong>on</strong> point. The reas<strong>on</strong> is that voltage quality levels(for instance, the depth <strong>of</strong> voltage dips) change for the same perturbati<strong>on</strong> from <strong>on</strong>e point toanother even al<strong>on</strong>g the same circuit.In most countries, customers who experience voltage quality problems can ask for individual voltagequality verificati<strong>on</strong> <strong>on</strong> their c<strong>on</strong>necti<strong>on</strong> point, although the distributi<strong>on</strong> companies are notlegally required in all countries to install a voltage quality recorder for a given time period (seetable 4.2). Generally costs are paid for by the requesting customer. Sometimes costs are paid bythe customer if parameters comply with standards, and by the company if they d<strong>on</strong>’t (see alsoadditi<strong>on</strong>al informati<strong>on</strong> 4.1).In a few countries, customers have the right to install their own voltage quality recorder instead <strong>of</strong>asking for it from the distributi<strong>on</strong> company. Generally, the voltage quality recorder owned by thecustomer must comply with technical standards to be accepted by the distributi<strong>on</strong> company. Insome countries the voltage quality recorder owned by the customer has to comply with severaltechnical criteria, defined by the operator.TABLE 4.2INDIVIDUAL VERIFICATION OF VOLTAGE QUALITYDistributi<strong>on</strong> companies compelled to provide voltagequality individual verificati<strong>on</strong> when requested by thecustomerNo duty for installing a voltage quality recorder butfor providing informati<strong>on</strong> to the customerProposal stageNo legal obligati<strong>on</strong>AT, BE, CZ, EE, FR, HU, IT, LV, NO, PLFI, PTSWES, GB, GR, LT, SL98Council <strong>of</strong> European Energy Regulators – Ref: C05-QOS-01-03
ADDITIONAL INFORMATION 4.1 – INDIVIDUAL VERIFICATION OF VOLTAGE QUALITY IN PORTUGALWhen a client complains about voltage quality and the distributi<strong>on</strong> operator does not have enoughinformati<strong>on</strong> to typify the waveform in the client delivery point, the operator has to make additi<strong>on</strong>almeasurements. After the m<strong>on</strong>itoring, the distributor has to give the client the following informati<strong>on</strong>:M<strong>on</strong>itoring periodType <strong>of</strong> equipment that was used in the m<strong>on</strong>itoring.Type <strong>of</strong> perturbati<strong>on</strong>s that have been registered.Analysis <strong>of</strong> the regulated values or limits fulfilment.· Entity resp<strong>on</strong>sible for the perturbati<strong>on</strong>s.Deadline to solve the detected problem in case code levels are not met.·The limits for voltage characteristics at the delivery point are established in NP EN 50160 (translati<strong>on</strong><strong>of</strong> the European Standard EN 50160) for LV and MV networks, and in the ComplementaryInstructi<strong>on</strong>s published by the Ministry (DGGE) in accordance with <strong>Quality</strong> <strong>of</strong> Service Code for HVand EHV networks. If actual results reveal that waveform characteristics are in accordance with thecode values, or if they are not in accordance with the code values for reas<strong>on</strong>s attributable to theclient, then the client has to pay the costs related to the extra measurements. The amount that theclient has to pay in this situati<strong>on</strong> is limited to a figure established and published each year by theregulator (ERSE). The following table presents the amount published by ERSE for 2005.Client (voltage level) Amount (€)*LVN (low voltage with c<strong>on</strong>tract power up to 41,4 kVA)LVS (low voltage with c<strong>on</strong>tract power higher than 41,4 kVA)MVHVVHV20,00160,001.350,004.650,004.650,00The client can install equipment to measure installati<strong>on</strong> voltage quality. If the equipment is installedand sealed after a written agreement with the distributi<strong>on</strong> operator, its measured values are validas proved in a claim.As for individual voltage quality measurement, <strong>on</strong>e case deserves special attenti<strong>on</strong>. In France,both the Transmissi<strong>on</strong> System Operator (RTE) and the main distributi<strong>on</strong> company (EdF) <strong>of</strong>fertheir customers customized c<strong>on</strong>tracts with assigned voltage quality levels (“engagements” or c<strong>on</strong>tractuallevels). If the customer claims for better c<strong>on</strong>tractual levels than the normal <strong>on</strong>es, he canask the operator for customized c<strong>on</strong>tractual levels in his c<strong>on</strong>tract, paying an extra charge.Customers who have customized c<strong>on</strong>tractual levels must have a m<strong>on</strong>itoring recorder installed (itcan be owned by the customers themselves or by the network operator). The existence <strong>of</strong> voltagequality c<strong>on</strong>tracts has led to a high diffusi<strong>on</strong> <strong>of</strong> voltage quality recorders installed <strong>on</strong> the c<strong>on</strong>nec-99<str<strong>on</strong>g>Third</str<strong>on</strong>g> <str<strong>on</strong>g>Benchmarking</str<strong>on</strong>g> <str<strong>on</strong>g>Report</str<strong>on</strong>g> <strong>on</strong> <strong>Quality</strong> <strong>of</strong> <strong>Electricity</strong> <strong>Supply</strong> – 2005 · Chapter 4
ti<strong>on</strong> point <strong>of</strong> single customers: in distributi<strong>on</strong> networks, about 16% <strong>of</strong> MV customers have a voltagequality recorder installed; in the transmissi<strong>on</strong> network, the figure is about 12% <strong>of</strong> EHV-HVcustomers.4.4 Voltage quality standardsIn recent years, some regulators have introduced voltage quality standards different from thoseindicated in EN 50160. Table 4.3 lists, for each voltage quality parameter (excluding interrupti<strong>on</strong>sand frequency variati<strong>on</strong>s for the reas<strong>on</strong>s explained at the beginning <strong>of</strong> this chapter), the countrieswhere voltage quality standards differ from those set in EN 50160, although in some cases thesestandards have not been set by the regulator. More details can be found in Annex 4.As for voltage variati<strong>on</strong> limits, with respect to MV customers (1-35 kV), the European standard EN50160 states that “under normal operating c<strong>on</strong>diti<strong>on</strong>s, during each period <strong>of</strong> <strong>on</strong>e week, 95% <strong>of</strong> the10 minutes rms values <strong>of</strong> the supply voltage shall be within the range <strong>of</strong> U c± 10%”, where U cisdefined as “declared supply voltage” and “is normally the nominal voltage U n<strong>of</strong> the system”, but“if by agreement between the supplier and the customer a voltage different from the nominal voltageis applied to the terminal, then this voltage is the declared supply voltage U c”.Although the above-menti<strong>on</strong>ed voltage variati<strong>on</strong> limit is am<strong>on</strong>g the few enforceable <strong>on</strong>es set byEN 50160, some countries have introduced different, more restrictive limits for voltage variati<strong>on</strong>s.The restricti<strong>on</strong>s affect both the “95% <strong>of</strong> time intervals” clause foreseen by EN 50160 for voltagesupply variati<strong>on</strong> for MV customers and the width <strong>of</strong> the allowed variati<strong>on</strong> band.TABLE 4.3 VOLTAGE QUALITY STANDARDS DIFFERENT FROM EN 50160<strong>Supply</strong> voltage variati<strong>on</strong>sRapid voltage changesFlicker severityVoltage dipsTemporary or transient overvoltagesVoltage unbalanceHarm<strong>on</strong>ic distorti<strong>on</strong> <strong>of</strong> voltage waveformInterharm<strong>on</strong>ic voltageMains signalling voltageES, FR*, HU, NO, PT (<strong>on</strong>ly for EHV-HV customers)NONO, PT (<strong>on</strong>ly for EHV-HV customers)FR* (customised engagement <strong>on</strong> request <strong>on</strong>ly for MVand HV customers)FR*FR*, NOFR*, NO, PTN<strong>on</strong>eN<strong>on</strong>e(*) In France the voltage quality limits are set in the c<strong>on</strong>tracts between the customer and the distributi<strong>on</strong>/transmissi<strong>on</strong> operator;the regulator surveys the c<strong>on</strong>tracts but does not set standards.100Council <strong>of</strong> European Energy Regulators – Ref: C05-QOS-01-03
In greater detail:· in France, for MV customers the supply c<strong>on</strong>tracts c<strong>on</strong>tain the voltage variati<strong>on</strong> limit U ± 5% cfor 100% <strong>of</strong> the time, where U cmust be in the range ±5 % around U n;· in Hungary, the limit is U ± 7,5%, with a maximum <strong>of</strong> 115% for 1 minute, for both LV and MVnnetworks;· in Portugal, the EN 50160 (1999) standard is applied for MV and LV. For EHV and HV the<strong>Quality</strong> <strong>of</strong> Service Code establishes that the value <strong>of</strong> U cshall be within the range <strong>of</strong> U n±7%.Under normal operating c<strong>on</strong>diti<strong>on</strong>s, during each period <strong>of</strong> <strong>on</strong>e week, 95% <strong>of</strong> the 10 min averagerms values <strong>of</strong> the supply voltage shall be within the range <strong>of</strong> U c±5%.· in Norway, the distributi<strong>on</strong> companies shall ensure that variati<strong>on</strong>s in the stati<strong>on</strong>ary voltage rmsvalue are within an interval <strong>of</strong> U n± 10 % for 100% <strong>of</strong> the time intervals, measured as a meanvalue over <strong>on</strong>e minute, at the points <strong>of</strong> c<strong>on</strong>necti<strong>on</strong> to the LV network;in Spain, the maximum variati<strong>on</strong> limit for the supply voltage to final c<strong>on</strong>sumers is Uc ± 7%.·Other voltage quality standards regarding rapid voltage changes (including flicker), voltage dipsand harm<strong>on</strong>ics are listed in detail in Annex 4.In <strong>on</strong>ly few countries penalties are foreseen in case the voltage limit standards are not met. InFrance, through c<strong>on</strong>tract c<strong>on</strong>diti<strong>on</strong>s, customers can receive compensati<strong>on</strong> payments <strong>on</strong> requestif voltage quality c<strong>on</strong>tractual levels are not met. For instance, a customer with a customized c<strong>on</strong>tractuallevel <strong>on</strong> voltage dips can receive compensati<strong>on</strong> if the operator does not respect this standard.This is also valid for EN 50160 standards, when referenced in c<strong>on</strong>tracts. In other countries(like Hungary), if the voltage quality standards are not met, a financial penalty may be applied bythe regulator. In others still, the distributi<strong>on</strong> company must take appropriate steps to rectify thecauses <strong>of</strong> the inadequate voltage quality within a given time (in Spain and in Great Britain theperiod is six m<strong>on</strong>ths for voltage variati<strong>on</strong>s out <strong>of</strong> prescribed limits).In no country is there an ec<strong>on</strong>omic incentive regime aimed at general voltage quality improvement,even if the guaranteed standards for the customer requesting for voltage quality problem solving,which are enforced in some countries (like for instance Hungary and Great Britain), are a key regulatorymeasure in order to assure timeliness for restoring normal voltage quality levels <strong>on</strong> a local basis.The most interesting case for voltage quality regulati<strong>on</strong> is Norway, where the regulator recentlyintroduced regulati<strong>on</strong> with some stricter requirements than EN 50160 (see additi<strong>on</strong>al informati<strong>on</strong>4.2). The regulator decided to set limits for voltage quality parameters after becoming very familiarwith the subject (thanks to the several years <strong>of</strong> c<strong>on</strong>tinuous m<strong>on</strong>itoring), and for which it is possibleto prevent disturbances. Through cooperati<strong>on</strong> with Norwegian distributi<strong>on</strong>s companies formore than 12 years organized through research projects, the regulator obtained a good knowledgeabout actual VQ levels in Norway.101<str<strong>on</strong>g>Third</str<strong>on</strong>g> <str<strong>on</strong>g>Benchmarking</str<strong>on</strong>g> <str<strong>on</strong>g>Report</str<strong>on</strong>g> <strong>on</strong> <strong>Quality</strong> <strong>of</strong> <strong>Electricity</strong> <strong>Supply</strong> – 2005 · Chapter 4
ADDITIONAL INFORMATION 4.2 – POWER QUALITY DIRECTIVE IN NORWAY ( 17 )The Norwegian regulator NVE has put into force a new Directive <strong>on</strong> quality <strong>of</strong> supply from January1st 2005. As a rati<strong>on</strong>ale for the new Directive, NVE states “to ensure a satisfactory quality <strong>of</strong> supplyin the Norwegian power system and a rati<strong>on</strong>al operati<strong>on</strong>, development and c<strong>on</strong>structi<strong>on</strong> <strong>of</strong> thepower system”. NVE have also stated a goal to keep the voltage quality close to the present andacceptable levelNVE draws attenti<strong>on</strong> to the importance <strong>of</strong> compatibility between immunity levels for electric equipment(limits for damage in particular) and the power quality level.The Directive defines requirements for:• A minimum acceptable level <strong>of</strong> power quality at customers terminals• C<strong>on</strong>tinuous measurements <strong>of</strong> power quality• Informati<strong>on</strong> to customers about what power quality is to be expected• Time limits for handling and solving customers’ complaints related to power qualityFor some phenomena NVE has chosen to not introduce minimum limits:<strong>Supply</strong> voltage dipsShort interrupti<strong>on</strong>sL<strong>on</strong>g interrupti<strong>on</strong>sTemporary overvoltages live/earthTransient overvoltages· Interharm<strong>on</strong>ic voltagesMains signalling voltage <strong>on</strong> the supply voltage.·The reas<strong>on</strong> for not introducing limits for these phenomena is partly due to difficulties in setting limitsand m<strong>on</strong>itoring them. Another aspect was the socio-ec<strong>on</strong>omic importance or weight <strong>of</strong> somephenomena.Both utilities and customers are subject to the Directive and might be ec<strong>on</strong>omically resp<strong>on</strong>sible forinsufficient power quality and hence may have to finance mitigati<strong>on</strong>. The Directive puts the resp<strong>on</strong>sibility<strong>on</strong> the legal entity/pers<strong>on</strong> owning or using electrical equipment or plants that causes violati<strong>on</strong><strong>of</strong> the limits. Procedures to determine whether the supply system is too weak or emissi<strong>on</strong>sfrom the load are too high are however not yet given. It is pointed out in the regulati<strong>on</strong> that powerquality shall be a part <strong>of</strong> the network c<strong>on</strong>tract between DSOs and customers. Such a c<strong>on</strong>tract is animportant instrument to limit emissi<strong>on</strong>s from customers so that the power quality requirements atall supply terminals can be managed.There are some significant differences between EN50160 and the new Directive, where the lattergoes bey<strong>on</strong>d the former. A comparis<strong>on</strong> is given in the table below.17Excerpt from H. Seljeseth, K. Sand, K. Samdal, “<strong>Quality</strong> <strong>of</strong> supply regulati<strong>on</strong> in Norway: Going bey<strong>on</strong>d EN 50160”. CEER TFQoS thanks the authors – who are with SINTEF Energy Research, Tr<strong>on</strong>dheim (NO) – for permissi<strong>on</strong> to publish this excerpt.102Council <strong>of</strong> European Energy Regulators – Ref: C05-QOS-01-03
COMPARISON BETWEEN EN 50160 AND THE NEW NORWEGIAN DIRECTIVE ON VOLTAGE QUALITY<strong>Quality</strong> aspectsEN 50160The new Norwegian directive <strong>on</strong> voltage qualityMain evaluati<strong>on</strong> periodfor most phenomenaRMS-variati<strong>on</strong>averaging time periodFlicker levelsVoltage steps LVTHD (low and mediumvoltage)Higher order harm<strong>on</strong>icsHV/EHV95%10 min95% value for Plt 1Normally 5% and in special situati<strong>on</strong> up to10% a few times per day8% for the 10 minute averageNo limits for harm<strong>on</strong>ics above 25th orderNo limits for HV/EHV as customers c<strong>on</strong>nectedto these voltage levels are expected to becovered by special c<strong>on</strong>tracts100%1 min100% value <strong>of</strong> Plt 1 and a 95% value for Pst 1,2Once per day for voltage steps up to 10%, 24 stepsper day up to 5% and for steps that occur more than24 times per day the change shall not exceed 3%.8% for the 10 minute average, and 5% weekly averageGeneral limits for higher order harm<strong>on</strong>icsIntroducing some limits for HV and EHV: Rapid voltagechanges, flicker, harm<strong>on</strong>ics, voltage unbalanceIn general, there is a growing number <strong>of</strong> countries whose regulator is not satisfied with EN 50160standards, especially for the following reas<strong>on</strong>s:· EN 50160 does not take into account abnormal exploitati<strong>on</strong> situati<strong>on</strong>s and sets standards <strong>on</strong>lyfor 95% <strong>of</strong> the time; this weakens the limits prescribed by that standard;· EN 50160 does not set standards for higher voltage levels than 35 kV and does not take intoaccount that in some countries MV is defined up to a higher level than 35 kV;· as regards harm<strong>on</strong>ic distorti<strong>on</strong>, harm<strong>on</strong>ic currents are not menti<strong>on</strong>ed, nor are there standardsfor customers c<strong>on</strong>nected to the network: but, distributi<strong>on</strong> companies can meet standards <strong>on</strong>lyif customers meet some as well.In coming years, therefore, we can expect regulators to pay increasing attenti<strong>on</strong> to voltage qualityissues. For instance, some regulators think that stricter voltage quality standards are requiredor are actually engaged to prepare more c<strong>on</strong>straining standards because they are not happy withEN 50160. Setting more restrictive standards than those stated in EN 50160 can entail highercosts for network investments: hence, regulators should be aware <strong>of</strong> both costs and benefits forthe customers deriving from tighter voltage quality standards.Voltage quality regulati<strong>on</strong> might also do well to c<strong>on</strong>sider the problem <strong>of</strong> disturbing customers’plants. In Portugal, for instance, the <strong>Quality</strong> <strong>of</strong> Service Code imposes maximum levels <strong>of</strong> disturbancec<strong>on</strong>cerning voltage quality for installati<strong>on</strong>s c<strong>on</strong>nected or having applied for c<strong>on</strong>necti<strong>on</strong> tothe networks. If <strong>on</strong>e installati<strong>on</strong> c<strong>on</strong>nected to the network has levels <strong>of</strong> disturbance greater thanthe limit, the network operator must notify the party in charge <strong>of</strong> the installati<strong>on</strong>. The network oper-103<str<strong>on</strong>g>Third</str<strong>on</strong>g> <str<strong>on</strong>g>Benchmarking</str<strong>on</strong>g> <str<strong>on</strong>g>Report</str<strong>on</strong>g> <strong>on</strong> <strong>Quality</strong> <strong>of</strong> <strong>Electricity</strong> <strong>Supply</strong> – 2005 · Chapter 4
ator must advise clients c<strong>on</strong>nected to its network <strong>on</strong> the best way to mitigate the polluti<strong>on</strong> causedby their installati<strong>on</strong>s. But if the polluti<strong>on</strong> due to a client damages voltage quality, the network operatorhas to c<strong>on</strong>tact the client and agree <strong>on</strong> a deadline to solve the problem. If they fail to agree,the decisi<strong>on</strong> is submitted to the regulator (ERSE). If at the end <strong>of</strong> that time the problems remainor are causing serious damage, for instance related to the safety <strong>of</strong> other customers’ equipment,the entity resp<strong>on</strong>sible for the network can disc<strong>on</strong>nect the polluting installati<strong>on</strong>. This situati<strong>on</strong> mustbe communicated both to the regulator (ERSE) and to governmental <strong>of</strong>fices (DGGE).Similar soluti<strong>on</strong>s are adopted in Spain and in France to assure that c<strong>on</strong>sumers establish a set <strong>of</strong>measures to minimise the risks stemming from lack <strong>of</strong> quality. For these purposes, the distributi<strong>on</strong>companies must inform the c<strong>on</strong>sumer in writing <strong>of</strong> the steps to be taken to achieve this risk minimisati<strong>on</strong>.Defining allowed emissi<strong>on</strong>s to customers is a very complex matter that still needs to bestudied pr<strong>of</strong>oundly, as it involves both the customer installati<strong>on</strong>s and the network characteristics,in terms <strong>of</strong> short circuit power at the c<strong>on</strong>necti<strong>on</strong> point.4.5 Market mechanisms for improving qualityIn some countries, the customer can negotiate with the distributor to get a higher level <strong>of</strong> quality(both voltage quality and interrupti<strong>on</strong>s); this is generally called a “power quality c<strong>on</strong>tract”. In mostcases, this is possible through the c<strong>on</strong>necti<strong>on</strong> c<strong>on</strong>tracts: for example, it may involve having a dualc<strong>on</strong>necti<strong>on</strong> with automatic changeover.Power quality c<strong>on</strong>tracts are rarely m<strong>on</strong>itored by the regulator. In the majority <strong>of</strong> cases where c<strong>on</strong>tractsare foreseen, the regulator has no role in market mechanisms for quality (see table 4.4,where “interruptible” c<strong>on</strong>tracts, more widespread than power quality c<strong>on</strong>tracts, are not c<strong>on</strong>sidered).TABLE 4.4POWER QUALITY CONTRACTSPower quality c<strong>on</strong>tracts with some ex-anteinterventi<strong>on</strong> <strong>of</strong> RegulatorPower quality c<strong>on</strong>tracts with <strong>on</strong>ly ex-post interventi<strong>on</strong><strong>of</strong> RegulatorPower quality c<strong>on</strong>tracts with no interventi<strong>on</strong> <strong>of</strong>RegulatorN<strong>on</strong>e (or simply special c<strong>on</strong>necti<strong>on</strong>s <strong>on</strong> customerrequest)FR, ITSICZ, ES, GB, LV, PTAT, BE, EE, FI, GR, HU, IE, LT, NO, PL, SEIn <strong>on</strong>ly two cases the regulator has a specific role ex-ante in the setting <strong>of</strong> power quality c<strong>on</strong>tracts.· In France, both the transmissi<strong>on</strong> and distributi<strong>on</strong> companies <strong>of</strong>fer all customers the possibilityto c<strong>on</strong>tract for extra quality requirements. If the customer needs better standards than the normal<strong>on</strong>es in his c<strong>on</strong>tract, he can ask the operator for customized c<strong>on</strong>tractual levels. The cus-104Council <strong>of</strong> European Energy Regulators – Ref: C05-QOS-01-03
·tomer will have to pay for them, depending <strong>on</strong> the necessary works to reach these new standards.The regulator has to receive a copy <strong>of</strong> every new c<strong>on</strong>tract. Even if it has no real power,the regulator has a great influence <strong>on</strong> c<strong>on</strong>tract models. Its comments <strong>on</strong> those models are usuallytaken into account by the operator. When a customer wants customized c<strong>on</strong>tractual levelsin his c<strong>on</strong>tract, the operator makes a technical and financial proposal, which describes the necessaryworks <strong>on</strong> the network to reach the levels <strong>of</strong> quality wanted by the customer, and theircosts. If the customer accepts, the works will be at the customer’s expense. With customizedc<strong>on</strong>tractual levels, the operator has to provide an annual or biannual report to the customerdescribing the quality performance <strong>of</strong> the site. The report should especially focus <strong>on</strong> the customizedc<strong>on</strong>tractual levels. This situati<strong>on</strong>, which existed before the regulator was formed, hasled to a wide usage <strong>of</strong> power quality c<strong>on</strong>tracts in France: in MV networks, in 2003, around <strong>on</strong>ethousand MV customers (out <strong>of</strong> more 100,000) had customized c<strong>on</strong>tractual levels for c<strong>on</strong>tinuity<strong>of</strong> supply (maximum number <strong>of</strong> unplanned interrupti<strong>on</strong>s per year), and 92 customers hadcustomized c<strong>on</strong>tractual levels <strong>on</strong> c<strong>on</strong>tinuity and quality <strong>of</strong> supply (voltage dips or other voltagequality factors). Moreover, around 12% <strong>of</strong> the customers directly c<strong>on</strong>nected to the transmissi<strong>on</strong>network have customized c<strong>on</strong>tractual levels (see also additi<strong>on</strong>al informati<strong>on</strong> 4.3).In Italy, the regulator explicitly provides for power quality c<strong>on</strong>tracts and sets some minimum criteriafor these. Each power quality c<strong>on</strong>tract must c<strong>on</strong>tain at least 3 elements: c<strong>on</strong>tractual level<strong>of</strong> quality, yearly premium, and penalty for n<strong>on</strong>-compliance. Exclusi<strong>on</strong>s are possible if agreedby the parties. AEEG deemed it preferable not to require that power quality c<strong>on</strong>tracts be submittedfor preliminary approval and to limit regulatory activity to establishing a few generalrules to be observed by the distributi<strong>on</strong> company in <strong>of</strong>fering power quality c<strong>on</strong>tracts: (i) thec<strong>on</strong>tractual level <strong>of</strong> quality shall be expressed as a threshold applied to <strong>on</strong>e or more indicators<strong>of</strong> c<strong>on</strong>tinuity <strong>of</strong> supply or voltage quality; (ii) the durati<strong>on</strong> <strong>of</strong> the c<strong>on</strong>tract may be no less than<strong>on</strong>e year and no more than four years; (iii) c<strong>on</strong>tracts can be differentiated according to thelevel <strong>of</strong> voltage and every other electrical parameter relating to supply, including the actuallevel <strong>of</strong> quality recorded at the delivery point. C<strong>on</strong>tracts are totally voluntary, both for customersand for distributi<strong>on</strong> companies (or the transmissi<strong>on</strong> system operator). For the networkoperators, the additi<strong>on</strong>al revenues coming from power quality c<strong>on</strong>tracts are treated as a serviceexcluded from the company’s revenue c<strong>on</strong>trol. Suppliers can be involved, especially to“federate” more than <strong>on</strong>e c<strong>on</strong>sumer interested in quality improvement in the same distributi<strong>on</strong>area; the cost (and the benefits) <strong>of</strong> power quality c<strong>on</strong>tract can be shared am<strong>on</strong>g several customers.Bey<strong>on</strong>d the ex-ante criteria, distributi<strong>on</strong> companies are supposed to communicate tothe regulator (AEEG) the number and c<strong>on</strong>tents <strong>of</strong> power quality c<strong>on</strong>tracts. The rules for powerquality c<strong>on</strong>tracts were issued in 2004 and no such c<strong>on</strong>tracts have been signed so far.Power quality c<strong>on</strong>tracts are still at a starting phase but they can be seen as an efficient soluti<strong>on</strong> forimproving voltage quality without imposing excessive costs <strong>on</strong> general tariffs. Anyway, these c<strong>on</strong>tractsrequire that customers requiring better voltage quality have a clear willingness to pay for it.105<str<strong>on</strong>g>Third</str<strong>on</strong>g> <str<strong>on</strong>g>Benchmarking</str<strong>on</strong>g> <str<strong>on</strong>g>Report</str<strong>on</strong>g> <strong>on</strong> <strong>Quality</strong> <strong>of</strong> <strong>Electricity</strong> <strong>Supply</strong> – 2005 · Chapter 4
ADDITIONAL INFORMATION 4.3 – CUSTOMISED VOLTAGE DIP ARRANGEMENTS IN FRANCEVoltage quality standards defined as in the EN 50160 document are respected in France for distributi<strong>on</strong>networks, even if this norm is not obligatory. Moreover, distributi<strong>on</strong> and transmissi<strong>on</strong> gridaccess c<strong>on</strong>tracts c<strong>on</strong>tain voltage quality engagements (arranged c<strong>on</strong>tractual levels). Theseengagements are more severe than standards set in EN 50160 and c<strong>on</strong>cern fluctuati<strong>on</strong>s <strong>of</strong> voltagemagnitude, frequency, temporary or transient over-voltages and unbalance <strong>of</strong> the three phase voltage.They c<strong>on</strong>cern <strong>on</strong>ly customers c<strong>on</strong>nected to distributi<strong>on</strong> networks at MV level and to the transmissi<strong>on</strong>network. For LV customers, such c<strong>on</strong>tractual c<strong>on</strong>diti<strong>on</strong>s are not established yet.Nowadays, customers c<strong>on</strong>nected to distributi<strong>on</strong> networks at MV level or to the transmissi<strong>on</strong> networkcan ask for customized engagements <strong>on</strong> the maximum number <strong>of</strong> voltage dips they might sufferper year.At transmissi<strong>on</strong> level (63 kV and above), the arrangement is 5 voltage dips per year. Only voltagedips deeper than 30% and l<strong>on</strong>ger than 600 ms are counted by the operator. It does not take intoaccount voltage dips occurring less than <strong>on</strong>e sec<strong>on</strong>d after an interrupti<strong>on</strong> (short or l<strong>on</strong>g). Voltagedips due to a fault in the customer’s installati<strong>on</strong> are likewise not taken into account. If the site issupplied in 225 or 400 kV, <strong>on</strong>ly the durati<strong>on</strong> <strong>of</strong> fault eliminati<strong>on</strong> is counted as a voltage dip whenthe origin <strong>of</strong> the voltage dip is a default <strong>on</strong> <strong>on</strong>e phase <strong>of</strong> the main feeder. In this case, the automaticreclosure operating time (single phase operati<strong>on</strong> <strong>of</strong> circuit breakers) is not taken into account.At MV level, this engagement is determined depending <strong>on</strong> the local c<strong>on</strong>diti<strong>on</strong>s <strong>of</strong> the site’s alimentati<strong>on</strong>.Since the engagement at transmissi<strong>on</strong> level is automatically 5 voltage dips per year, the distributi<strong>on</strong>operator can not take a better <strong>on</strong>e. Thus, a customer c<strong>on</strong>nected at MV level can not havean engagement <strong>of</strong> less than 5 voltage dips per year. As well as for transmissi<strong>on</strong>, <strong>on</strong>ly voltage dipsdeeper than 30% and l<strong>on</strong>ger than 600 ms are taken into account by the operator.At the transmissi<strong>on</strong> level, the customer can ask the operator for other customized arrangementsc<strong>on</strong>cerning voltage quality. The operator answers that request with either a motivated rejecti<strong>on</strong>, ora technical and financial proposal. If the customer accepts this proposal, the cost <strong>of</strong> the necessarystudies and works <strong>on</strong> the network are at the customer’s expense. When customers ask for customizedarrangements, they pay an annual fee to operators.4.6 Main findings from the survey <strong>on</strong> voltage qualityVQ#1: Voltage quality is a complex issue as it is composed <strong>of</strong> several parameters, each <strong>of</strong> them withits own characteristics. A good knowledge <strong>of</strong> the real situati<strong>on</strong> is a preliminary step towards any kind <strong>of</strong>regulatory interventi<strong>on</strong>. A significant number <strong>of</strong> EU countries have installed or will so<strong>on</strong> install a m<strong>on</strong>itoringsystem (see Table 4.1). All these are based <strong>on</strong> a sampling either <strong>of</strong> transmissi<strong>on</strong>-distributi<strong>on</strong>interface points or customer c<strong>on</strong>necti<strong>on</strong> points. Different soluti<strong>on</strong>s have been adopted in order t<strong>of</strong>inance the m<strong>on</strong>itoring systems; in some countries distributi<strong>on</strong> companies have been imposed withduties for voltage quality regular measurements; in other countries the m<strong>on</strong>itoring system is partlyfinanced with public resources.106Council <strong>of</strong> European Energy Regulators – Ref: C05-QOS-01-03
VQ#2: Customers requiring a verificati<strong>on</strong> <strong>of</strong> actual voltage quality levels <strong>on</strong> their own c<strong>on</strong>necti<strong>on</strong> pointare generally entitled to have their request satisfied (see Table 4.2). The regulator can either put anobligati<strong>on</strong> <strong>on</strong> distributi<strong>on</strong> companies or regulate the customer’s right to measure voltage quality withits own voltage quality recorder; in the latter case, in order to assure that measurements are valid forthe distributi<strong>on</strong> company, the voltage quality recorder must comply with technical standards ortechnical criteria set by the operator.VQ#3: In some countries, voltage quality standards differ from the limits prescribed by EN 50160 (seeTable 4.3 and Annex 4); this means that in an increasing number <strong>of</strong> EU countries the EN 50160(1999) reference levels are not found to be satisfactory both by regulators and customers, for anumber <strong>of</strong> reas<strong>on</strong>s am<strong>on</strong>g which the following are the most important:· EN 50160 does not take abnormal operati<strong>on</strong>s into account and sets standards <strong>on</strong>ly for 95% <strong>of</strong> thetime; this weakens the limits prescribed by that standard;· EN 50160 does not set standards for higher voltage levels than 35 kV and does not take intoaccount that in some countries MV is defined up to a higher level than 35 kV;· as regards harm<strong>on</strong>ic distorti<strong>on</strong>, harm<strong>on</strong>ic currents are not menti<strong>on</strong>ed, nor are there standards forcustomers c<strong>on</strong>nected to the network: distributi<strong>on</strong> companies can meet standards <strong>on</strong>ly if customersmeet some as well.This is especially true for supply voltage variati<strong>on</strong>s, rapid voltage changes and voltage dips, and to alesser extent for harm<strong>on</strong>ic distorti<strong>on</strong> and flicker severity. Setting quality standards different than EN50160 requires the regulator to have not <strong>on</strong>ly a good knowledge <strong>of</strong> the actual situati<strong>on</strong>, but also anidea about the cost/benefit ratio <strong>of</strong> the new standards in order to avoid excessive costs <strong>on</strong> thenetwork.VQ#4: In some countries customers and distributi<strong>on</strong> companies have the possibility to agree up<strong>on</strong> aspecial c<strong>on</strong>tract with c<strong>on</strong>tractual quality levels and extra-revenue for the distributi<strong>on</strong> companies; <strong>on</strong>lyin a few countries do regulators have scope to intervene in this market mechanism (see Table 4.4).Where the regulator intervenes in power quality c<strong>on</strong>tracts, his role can be either ex-ante, determiningthe general form <strong>of</strong> the c<strong>on</strong>tracts, or ex-post, m<strong>on</strong>itoring the diffusi<strong>on</strong> and actual applicati<strong>on</strong> <strong>of</strong> powerquality c<strong>on</strong>tracts.4.7 C<strong>on</strong>clusi<strong>on</strong>s: recommendati<strong>on</strong>s for the future work <strong>on</strong> Voltage <strong>Quality</strong>Voltage quality is still a largely new issue for regulators. The following recommendati<strong>on</strong>s arisefrom the survey <strong>on</strong> existing experiences <strong>of</strong> measuring and regulating aspects <strong>of</strong> voltage quality insome European countries. Setting tighter standards than EN 50160 could involve major costs fornetwork investments, especially for those VQ parameters for which mandatory values have beenset; hence, regulators should be aware <strong>of</strong> both the costs and benefits for the customers derivingfrom the new standards. N<strong>on</strong>etheless, standards more c<strong>on</strong>straining than the indicative valuesreported by EN 50160 are necessary to protect customers from VQ disturbances, as customers’applicati<strong>on</strong>s are becoming ever more sensible over time, especially to voltage dips.1. Voltage quality parameters and standards: European regulators are c<strong>on</strong>cerned about thevoltage quality standards indicated by EN 50160 (1999). This standard determines limits forvoltage quality parameters that in most cases are <strong>on</strong>ly indicative, and even when they are107<str<strong>on</strong>g>Third</str<strong>on</strong>g> <str<strong>on</strong>g>Benchmarking</str<strong>on</strong>g> <str<strong>on</strong>g>Report</str<strong>on</strong>g> <strong>on</strong> <strong>Quality</strong> <strong>of</strong> <strong>Electricity</strong> <strong>Supply</strong> – 2005 · Chapter 4
mandatory such values are applicable <strong>on</strong>ly for 95% <strong>of</strong> the time (leaving no limits for approx. 8hours every week). Following that standard, many disturbances are not c<strong>on</strong>strained at all. Thesestandards are not restrictive enough and do not c<strong>on</strong>stitute a good reference for voltage quality inEuropean networks. Generally, network performance in Europe is already better than EN 50160values, which are actually recommended, rather than compulsory, in some countries. For this reas<strong>on</strong>,some regulators would like to react to this problem, especially at a time <strong>of</strong> electric companyprivatisati<strong>on</strong>. They want to set more restrictive standards, especially looking at voltage supply variati<strong>on</strong>s,rapid voltage changes and voltage dips, and to a lesser extent at harm<strong>on</strong>ic distorti<strong>on</strong> andflicker severity. Even though some internati<strong>on</strong>al standards (for example in IEC community) dealwith VQ measurement, several problems are still open and under discussi<strong>on</strong>. Then, efforts fortechnical standardisati<strong>on</strong> are needed also in this field, with reference to accuracy not <strong>on</strong>ly <strong>of</strong> themeasuring instrument, but <strong>of</strong> the whole measurement chain, including frequency and phaseresp<strong>on</strong>se characterizati<strong>on</strong> <strong>of</strong> the transducers and other technical aspects. The aim is to haverobust and comparable VQ data throughout all Europe (not <strong>on</strong>ly for voltage analysis but also forcurrents, in order to better identify resp<strong>on</strong>sibilities in introducing disturbances).It is highly recommended that EN 50160 be revised by CENELEC in cooperati<strong>on</strong> with CEER and otherstakeholders, taking into account both the actual levels <strong>of</strong> voltage quality in European transmissi<strong>on</strong>and distributi<strong>on</strong> networks, the evoluti<strong>on</strong> <strong>of</strong> customers’ needs and the VQ measurement issues.2. Actual levels <strong>of</strong> voltage quality: Knowledge <strong>of</strong> performances in terms <strong>of</strong> voltage quality overseveral years is necessary. M<strong>on</strong>itoring <strong>of</strong> voltage quality parameters is difficult and costly, but thenumber <strong>of</strong> voltage quality measurement systems in Europe is increasing and regulators showincreasing c<strong>on</strong>cern for the technical aspects <strong>of</strong> quality. From this initial overview <strong>of</strong> voltage quality,regulators will be able to determine objectives for companies, taking into account the costsand benefits <strong>of</strong> new voltage quality standards for customers and for network companies.It is str<strong>on</strong>gly recommended that at least the most critical voltage quality parameters be m<strong>on</strong>itored andthat results be published, in order to determine, in a first stage, the actual performance <strong>of</strong> networks.This has to be d<strong>on</strong>e over several years (at least 3), in order to draw significant trends.3. Power quality c<strong>on</strong>tracts: Even if quality c<strong>on</strong>tracts are not yet widespread, they can be usefulfor revealing customer preferences for quality, especially for customers with the greatest needfor c<strong>on</strong>tinuity and voltage quality.It is highly advisable to undertake further research and informati<strong>on</strong> <strong>on</strong> this market-like tool, which canresult in an efficient way to satisfy special quality needs without increasing general tariffs.108Council <strong>of</strong> European Energy Regulators – Ref: C05-QOS-01-03
PARTICIPANTS OF THE CEER QUALITY OF SUPPLY TFGünter PauritschAlf<strong>on</strong>s HaberRafael JahnOndøej FraòoThorbjorn NejsumTiina MaldreMarkku KinnunenFlorence DelestreJochen PattChris WattsJames HopeGeorge Pep<strong>on</strong>isNikos Boulaxisdr. Gábor Szörényi (TF Chair)Ivar Thorsteinss<strong>on</strong>Luca Lo SchiavoRoberto MalamanDenis CagneyRaitis RežaisKestutis ZilenasCamille HierzigRuud VrolijkKarstein BrekkeLeszek KukulaAmanda FalcaoPeter DurackaErvin SeršenMaría Jesús Gagodr. Rémy KolessarDietmar PreinstorferE-C<strong>on</strong>trolE-C<strong>on</strong>trolCREGERUDERAEMIEMVCREBundesnetzagenturOfgemOfgemRAERAEHEOOrkust<strong>of</strong>nunAEEGAEEGCERPUCNCCILRDTENVEUREERSERONIEARSCNESTEMCEER SecretariatAustriaAustriaBelgiumCzech RepublicDenmarkEst<strong>on</strong>iaFinlandFranceGermanyGreat BritainGreat BritainGreeceGreeceHungaryIcelandItalyItalyIrelandLatviaLithuaniaLuxemburgThe NetherlandsNorwayPolandPortugalSlovak RepublicSloveniaSpainSwedenguenter.pauritsch@e-c<strong>on</strong>trol.atalf<strong>on</strong>s.haber@e-c<strong>on</strong>trol.atrja@creg.be<strong>on</strong>drej.frano@eu.cztne@ks.dktiina.maldre@eti.gov.eemarkku.kinnunen@ceer-eu.orgflorence.delestre@cre.frjochen.patt@bnetz.dechris.watts@<strong>of</strong>gem.gov.ukjames.hope @<strong>of</strong>gem.gov.ukpep<strong>on</strong>is@rea.grboulaxis@rae.grszorenyig@eh.gov.huith@os.islloschiavo@autorita.energia.itrmalaman@autorita.energia.itdcagney@cer.ieraitis.rezais@sprk.gov.lvkestutis.zilenas@regula.is.ltcamille.hierzig@ilr.lua.w.r.vrolijk@nmanet.nlkab@nve.noleszek.kukula@ure.gov.plafalcao@erse.ptduracka@urso.gov.skervin.sersen@agen-rs.simgc@cne.esremy.kolessar@stem.sedietmar.preinstorfer@ceer-eu.org109<str<strong>on</strong>g>Third</str<strong>on</strong>g> <str<strong>on</strong>g>Benchmarking</str<strong>on</strong>g> <str<strong>on</strong>g>Report</str<strong>on</strong>g> <strong>on</strong> <strong>Quality</strong> <strong>of</strong> <strong>Electricity</strong> <strong>Supply</strong> – 2005 · Participants
ANNEXES – ANNEX TO CHAPTER 1.Secti<strong>on</strong> 1 – Comparative table <strong>on</strong> force majeureSecti<strong>on</strong> 2 – Comparative table <strong>on</strong> planned interrupti<strong>on</strong>sSecti<strong>on</strong> 3 – Tables <strong>on</strong> c<strong>on</strong>tinuity indicatorsSecti<strong>on</strong> 4 – Voltage level analysisSecti<strong>on</strong> 5 – Density analysisSecti<strong>on</strong> 6 – Regressi<strong>on</strong> analysisSecti<strong>on</strong> 1 – Comparative table <strong>on</strong> force majeureSECTION 1 – FORCE MAJEUREAUSTRIANo explicit regulatory definiti<strong>on</strong>. Force majeure intended as events that are more severe than the design networkrequirements; order by public authority; strikes; transmissi<strong>on</strong> blackouts; generati<strong>on</strong> inadequacy. Data from 2002 aregiven without flood In Austria there were serious floods especially <strong>on</strong> the danube river in August 2002. The interrupti<strong>on</strong>swhich were caused by these rare flood events (acts <strong>of</strong> god) were removed from the statistics, because they werenot representative for the situati<strong>on</strong> in the networksBELGIUM(nati<strong>on</strong>al, transmissi<strong>on</strong>)Definiti<strong>on</strong> in Royal Decree <strong>of</strong> 19/12/2002. Force majeure intended as events that are more severe than the designnetwork requirements; order by public authority; strikes; transmissi<strong>on</strong> blackouts, due to other TSO-z<strong>on</strong>es; generati<strong>on</strong>inadequacy (multiple generators out)BELGIUM(Wall<strong>on</strong>ia, distributi<strong>on</strong>and local transmissi<strong>on</strong>)CZECH REPUBLICESTONIAFINLANDFRANCEForce majeure intended as events that are more severe than the design network requirements; order by publicauthority; strikes (<strong>on</strong>ly for LTSO, not for DSO); see for detail the legal text belowEvents “Acts <strong>of</strong> God” have to be recognized by the Energy Regulatory OfficeForce majeure: when interrupti<strong>on</strong> is caused by a l<strong>on</strong>g time event (natural disaster, heavy winds or glazed frost thatexceeds design norm) that network operator could not foresee, the interrupti<strong>on</strong> must be eliminated within 3 days afterthe end <strong>of</strong> this event.if all the three following c<strong>on</strong>diti<strong>on</strong>s are meet 1) the interrupti<strong>on</strong> is out <strong>of</strong> the c<strong>on</strong>trol <strong>of</strong> the distributi<strong>on</strong> company (storm,snow, animals does not qualify to this “out <strong>of</strong> c<strong>on</strong>trol” definiti<strong>on</strong>) 2) the interrupti<strong>on</strong> is such that it is not reas<strong>on</strong>able forthe distributi<strong>on</strong> company that it could have been taking it into account in its operati<strong>on</strong> 3) the distributi<strong>on</strong> companycould not have avoid the interrupti<strong>on</strong> even when operating very carefullyRegulator: no definiti<strong>on</strong>. Definiti<strong>on</strong> <strong>of</strong> “Excepti<strong>on</strong>al events” in article 11 <strong>of</strong> the decree <strong>of</strong> 1995 (copied out in c<strong>on</strong>tracts).Voluntary destructi<strong>on</strong> (in case <strong>of</strong> war, riots, terrorism…); Incidental and unc<strong>on</strong>trollable 3 rd parties damages (fire, explosi<strong>on</strong>,plane crash…); Natural disaster; Irresistible atmospheric phenomen<strong>on</strong>, involving outage for more than 100.000customers; Load-shedding in case <strong>of</strong> general strike; Outage asked by public authorities (for security or nati<strong>on</strong>aldefence reas<strong>on</strong>s); Unbalance between generati<strong>on</strong> and c<strong>on</strong>sumpti<strong>on</strong> (lack <strong>of</strong> power generati<strong>on</strong>). This last c<strong>on</strong>diti<strong>on</strong> isnot written in the decree but operators added it in c<strong>on</strong>tracts.Force majeure intended as events that are more severe than the design network requirements, in the meaning <strong>of</strong> thelaw n°82-600 from the 13 th July 1982; order by public authority; strikes; transmissi<strong>on</strong> blackouts; generati<strong>on</strong> inadequacy;wars, terrorist acti<strong>on</strong>s, thieving111<str<strong>on</strong>g>Third</str<strong>on</strong>g> <str<strong>on</strong>g>Benchmarking</str<strong>on</strong>g> <str<strong>on</strong>g>Report</str<strong>on</strong>g> <strong>on</strong> <strong>Quality</strong> <strong>of</strong> <strong>Electricity</strong> <strong>Supply</strong> – 2005 · Annex 1
(CONTINUE) SECTION 1 – FORCE MAJEUREGREAT BRITAINGREECEHUNGARYIRELANDITALYLATVIALITHUANIANORWAYPOLANDPORTUGALSLOVENIASPAINSWEDENOfgem has defined a mechanism under its quality <strong>of</strong> service incentive scheme, which allows companies to ask for theimpact <strong>of</strong> a small number <strong>of</strong> excepti<strong>on</strong>al events to be excluded from their performance. This has been updated from1 April 2005 as part <strong>of</strong> the new price c<strong>on</strong>trol <strong>on</strong> the electricity distributi<strong>on</strong> businesses in GB. See for detail Additi<strong>on</strong>alInformati<strong>on</strong> n. … and n. … in the body <strong>of</strong> Chapter 2No classificati<strong>on</strong> <strong>of</strong> data made by DSO as regards circumstances that various interrupti<strong>on</strong>s are attributed to.“Extraordinary event” defined by independent authority but applied <strong>on</strong>ly for guaranteed standards. Regarding the 3years average the specificati<strong>on</strong>s must be matchForce majeure intended as events that are more severe than the design network requirements; order by publicauthority; strikes. For the incentive regime, those days with daily SAIDI larger than yearly average plus two standarddeviati<strong>on</strong>s are excluded“Force majeure” intended as events that are more severe than the design network requirements; order by publicauthority; strikes; transmissi<strong>on</strong> blackouts; generati<strong>on</strong> inadequacy (load shedding), public calamities, <strong>on</strong>ly if there is anact <strong>of</strong> calamity declared by a public authority (e.g. natural disaster central authority or local authorities). The distributormust prove that the technical design requirements have been overpassed. There are technical design requirementsfor wind (120km/h) and for ice <strong>on</strong> the overhead lines (12mm in some parts <strong>of</strong> Italy).In order to simplify the registrati<strong>on</strong> there is also a statistical method to define “major event days” and distributi<strong>on</strong> companiescan choose to apply this statistical methodology (called “EPR”) that is based <strong>on</strong> a statistical analysis in twosteps <strong>of</strong> the daily value <strong>of</strong> c<strong>on</strong>tinuity indicators and excludes automatically the day in which indicators present anabnormally high value. The interrupti<strong>on</strong>s starting in “major event days” are excluded from incentive regulati<strong>on</strong>. 14 distributors<strong>on</strong> 23 subject to incentive regulati<strong>on</strong> have chosen this methodology.“Force Majeure” definedForce majeure: War and terrorist acti<strong>on</strong>s, acti<strong>on</strong>s or directi<strong>on</strong>s <strong>of</strong> competent state bodies, natural disasters or otherexcepti<strong>on</strong>al events, which cause announcement <strong>of</strong> the emergency situati<strong>on</strong>; significant climate changes, which causeexceeding <strong>of</strong> permitted technical norms.No regulatory definiti<strong>on</strong>. Force majeure intended as events that are more severe than the design network requirements;generati<strong>on</strong> inadequacy if there is energy shortageDefiniti<strong>on</strong> included in Transmissi<strong>on</strong> Grid Code. No statistical method. Force majeure intended as events that are moresevere than the design network requirements; order by public authority; strikes (in some cases <strong>on</strong>ly); transmissi<strong>on</strong>blackouts; generati<strong>on</strong> inadequacy.The <strong>Quality</strong> <strong>of</strong> Service Code c<strong>on</strong>siders the following situati<strong>on</strong>s as force majeure: general strike, public order altercati<strong>on</strong>,fire (if its origin is not in the network), earthquake, flood, wind <strong>of</strong> intensity superior to the values c<strong>on</strong>sidered in thedesign <strong>of</strong> the network, direct lightning strikes (if damages <strong>on</strong> equipments proved), sabotage, malefacti<strong>on</strong>, proven thirdparty interventi<strong>on</strong>. An act <strong>of</strong> god is any situati<strong>on</strong> that is simultaneously unpredictable, irresistible and external to thenetwork.No regulatory definiti<strong>on</strong>. Force majeure intended as events that are more severe than the design network requirements;order by public authority; strikes; transmissi<strong>on</strong> blackouts; generati<strong>on</strong> inadequacy.Force majeure: incidents accepted as such by the competent administrati<strong>on</strong>, including governmental decisi<strong>on</strong>s or civilprotecti<strong>on</strong> service decisi<strong>on</strong>s and extraordinary atmospheric phenomena that go bey<strong>on</strong>d the limits set in the regulati<strong>on</strong>s<strong>on</strong> extraordinary risks for people and property. Atmospheric phenomena that are deemed usual and normal ineach geographical area according to the statistical data available may not be cited as reas<strong>on</strong>s <strong>of</strong> force majeureNot taken into account by the regulator. Force majeure defined as war, terror attack and natural disaster like earthquakesor ice storms and strikes.112Council <strong>of</strong> European Energy Regulators – Ref: C05-QOS-01-03
Appendix – BELGIUM – Wall<strong>on</strong>ia1. According to technical rules for DSO: those cases are foreseen:Art. 20. In these technical rules, is regarded as an emergency1. the situati<strong>on</strong> which follows a case <strong>of</strong> «force majeure» and in which excepti<strong>on</strong>al and temporary measurementsmust be taken to face the c<strong>on</strong>sequences <strong>of</strong> a case <strong>of</strong> «force majeure» in order to be able to guaranteeor restore the reliable operati<strong>on</strong> and reliable distributi<strong>on</strong> network;2. a situati<strong>on</strong> which follows up<strong>on</strong> an event which, although it cannot be described as a case <strong>of</strong> «forcemajeure» depending <strong>on</strong> the current state <strong>of</strong> jurisprudence and the legal studies, require, according to theevaluati<strong>on</strong> <strong>of</strong> the DSO or the user <strong>of</strong> the distributi<strong>on</strong> network, an urgent and adapted interventi<strong>on</strong> <strong>of</strong> the DSOin order to be able to guarantee or restore the reliable operati<strong>on</strong> and reliable distributi<strong>on</strong> network, or to preventother damage …Art. 21. Following situati<strong>on</strong>s, if they are irresistible and unforeseeable, are regarded as cases <strong>of</strong>«force majeure» for the DSO1. natural disasters, including the earthquakes, floods, storms, cycl<strong>on</strong>es or other excepti<strong>on</strong>al climatologiccircumstances;2. a nuclear or chemical explosi<strong>on</strong> and its c<strong>on</strong>sequences;3. the sudden unavailability <strong>of</strong> the installati<strong>on</strong>s for other reas<strong>on</strong>s than the outdatedness, lack <strong>of</strong> maintenanceor the qualificati<strong>on</strong> <strong>of</strong> the operators; including a collapse <strong>of</strong> the informati<strong>on</strong> processing system, caused or notby a virus, whereas all the preventive measures had been taken, according to the state <strong>of</strong> technology;4. technical impossibility, temporary or permanent, for the distributi<strong>on</strong> network to provide electricity because<strong>of</strong> a brutal lack <strong>of</strong> injecti<strong>on</strong> <strong>of</strong> energy coming from the transmissi<strong>on</strong> network or local transmissi<strong>on</strong> networkand not compensable by other means;5. the fire, the explosi<strong>on</strong>, the sabotage, the acts <strong>of</strong> terrorism, the act <strong>of</strong> vandalism, the damage caused bycriminal acts and the threats <strong>of</strong> same nature;6. the war declared or not, the threat <strong>of</strong> war, the invasi<strong>on</strong>, the war, embargo, the revoluti<strong>on</strong>, the revolt;7. the “government fiat”, in which, in particular situati<strong>on</strong>s, the authority makes reference to an urgency andimposes excepti<strong>on</strong>al and temporary measurements to the DSO or to the users <strong>of</strong> the distributi<strong>on</strong> network inorder to be able to maintain or restore the reliable operati<strong>on</strong> and reliable <strong>of</strong> the whole <strong>of</strong> the networks.2. According to technical rules for LTSO: those cases are foreseen:Art. 16 §1. In these technical rules, are regarded as emergenciesa) the situati<strong>on</strong>s which follow a case <strong>of</strong> «force majeure» and in which excepti<strong>on</strong>al and temporary measurementsmust be taken to face the c<strong>on</strong>sequences <strong>of</strong> a case <strong>of</strong> «force majeure» in order to be able to maintainor restore the reliable operati<strong>on</strong> and reliable local transmissi<strong>on</strong> network, during time strictly necessary torec<strong>on</strong>figure the local transmissi<strong>on</strong> network with safe equipments;b) the situati<strong>on</strong>s which follow up<strong>on</strong> an event which, although it cannot be described as a case <strong>of</strong>«force majeure» depending <strong>on</strong> the current state <strong>of</strong> jurisprudence and the legal studies, require,according to the evaluati<strong>on</strong> <strong>of</strong> the LTSO or the user <strong>of</strong> the local transmissi<strong>on</strong> network, an interventi<strong>on</strong>urgent and directed <strong>of</strong> the LTSO in order to be able to maintain or restore the reliable operati<strong>on</strong> andreliable local transmissi<strong>on</strong> network, or to prevent other damage …Art. 16 §2. Following situati<strong>on</strong>s, if they are irresistible and unforeseeable, are regarded as cases <strong>of</strong>«force majeure» for the LTSO113<str<strong>on</strong>g>Third</str<strong>on</strong>g> <str<strong>on</strong>g>Benchmarking</str<strong>on</strong>g> <str<strong>on</strong>g>Report</str<strong>on</strong>g> <strong>on</strong> <strong>Quality</strong> <strong>of</strong> <strong>Electricity</strong> <strong>Supply</strong> – 2005 · Annex 1
1. natural disaster following earthquakes, floods, storms, cycl<strong>on</strong>es or other excepti<strong>on</strong>al climatologic circumstances;2. a nuclear or chemical explosi<strong>on</strong> and its c<strong>on</strong>sequences;3. the sudden unavailability <strong>of</strong> the installati<strong>on</strong>s for other reas<strong>on</strong>s than the outdatedness, lack <strong>of</strong> maintenanceor the qualificati<strong>on</strong> <strong>of</strong> the operators; including a collapse <strong>of</strong> the informati<strong>on</strong> processing system, caused or notby a virus, whereas all the preventive measures had been taken, according to the state <strong>of</strong> technology;4. technical impossibility, temporary or permanent, for the local transmissi<strong>on</strong> network to transport electricitybecause <strong>of</strong> disturbances within the z<strong>on</strong>e <strong>of</strong> adjustment caused by flows <strong>of</strong> electricity which result from energyexchanges within another z<strong>on</strong>e <strong>of</strong> adjustment or between two or several other z<strong>on</strong>es <strong>of</strong> adjustment andwhose identity <strong>of</strong> the actors <strong>of</strong> the market c<strong>on</strong>cerned with these energy exchanges is not known from theLTSO and cannot reas<strong>on</strong>ably be known;5. impossibility <strong>of</strong> operating <strong>on</strong> the local transmissi<strong>on</strong> network or the installati<strong>on</strong>s which functi<strong>on</strong>ally form <strong>of</strong>its part, because <strong>of</strong> a collective c<strong>on</strong>flict and which gives place to a unilateral measurement <strong>of</strong> employees (orgroups <strong>of</strong> employees) or any other social c<strong>on</strong>flict;6. the fire, the explosi<strong>on</strong>, the sabotage, the acts <strong>of</strong> terrorism, the act <strong>of</strong> vandalism, the damage caused bycriminal acts, the c<strong>on</strong>straint <strong>of</strong> criminal nature and threats <strong>of</strong> same nature;7. the war declared or not, the threat <strong>of</strong> war, the invasi<strong>on</strong>, the war, embargo, the revoluti<strong>on</strong>, the revolt;8. the “government fiat”, in which, in particular situati<strong>on</strong>s, the authority makes reference to an urgencyand imposes excepti<strong>on</strong>al and temporary measurements to the LTSO or to the users <strong>of</strong> the localtransmissi<strong>on</strong> network in order to be able to maintain or restore the reliable operati<strong>on</strong> and reliablelocal transmissi<strong>on</strong> network.Secti<strong>on</strong> 2 – Comparative table <strong>on</strong> planned interrupti<strong>on</strong>sSECTION 2 – PLANNED INTERRUPTIONSAdvance noticeProcedureATBE(W)CZEEESFI48 hrs10 days15 days2 days24 hrsNo ruleNo ruleNo ruleNo ruleSuggested: web site/large companies by newslettera) By means <strong>of</strong> individualised notificati<strong>on</strong> using a method wherebythere is a record (c<strong>on</strong>sumers at voltages higher than 1 kV andessential services).b) By means <strong>of</strong> advertising posters placed invisible spots with regard to all other c<strong>on</strong>sumers and by means <strong>of</strong>two <strong>of</strong> the most widely circulated printed media in the province.No rule114Council <strong>of</strong> European Energy Regulators – Ref: C05-QOS-01-03
(CONTINUE) SECTION 2 – PLANNED INTERRUPTIONSAdvance noticeProcedureFRThe regulator didn't issue any rules about the notice to the users, but there are some c<strong>on</strong>tractual rules (in c<strong>on</strong>tracts between thedistributor and the customer):· for MV customers:– for not emergency works, the distributor c<strong>on</strong>tacts the customer to decide when the works will be held;– for emergency works, the distributor has to inform the customer as so<strong>on</strong> as possible.· for LV customers:– the distributor has to inform the customer (by letter or public informati<strong>on</strong>) for works without emergency;– for works with emergency, the distributor has to inform the customer as so<strong>on</strong> as he can;– each interrupti<strong>on</strong> cannot last more than 10 hours.GBGRHUIEITLVLTNOPO48 hrs (or shorter period where this has been agreed with thecustomer)n.a.for household c<strong>on</strong>sumer: in the case <strong>of</strong> less than 4 hoursplanned interrupti<strong>on</strong> the minimum time-lag is 4 days, in thecase <strong>of</strong> more than 4 hours it is 8 days.2 day (MV and LV customers)24 hrsNo ruleNo ruleGive c<strong>on</strong>sumers sufficient time to prepareNo ruleNo rulen.a.The regulator approves procedure established by distributi<strong>on</strong>companiesCompulsory: by mailUsing appropriate means <strong>of</strong> communicati<strong>on</strong>, like individualizednotificati<strong>on</strong> for MV customers and advertising posters placed invisible spots for LV customers.No ruleRules set by Ministry <strong>of</strong> Ec<strong>on</strong>omySuggested: newspaper adds, mail (postcard)No rulePTThe Commercial Relati<strong>on</strong>s Code, published by ERSE, establishes rules about the notice to the customer according to the reas<strong>on</strong>s<strong>of</strong> interrupti<strong>on</strong>:· Interrupti<strong>on</strong>s for reas<strong>on</strong>s <strong>of</strong> public interest: the entity resp<strong>on</strong>sible for the network must inform, whenever possible, and with aminimum prior notice <strong>of</strong> thirty-six hours, the customers which may be affected by the interrupti<strong>on</strong>.· Interrupti<strong>on</strong>s for service reas<strong>on</strong>s: the entity resp<strong>on</strong>sible for the network has the duty to minimize the impact <strong>of</strong> the interrupti<strong>on</strong>sam<strong>on</strong>g costumers. For this purpose, distributors may agree with the clients that will be affected the best moment for theinterrupti<strong>on</strong>. If the agreement is not possible, the interrupti<strong>on</strong>s must occur, preferentially, <strong>on</strong> Sundays, between 05:00 hours and15:00 hours, with a maximum durati<strong>on</strong> <strong>of</strong> eight hours per interrupti<strong>on</strong> and five Sundays per year, per costumer affected.The entity resp<strong>on</strong>sible for the network must inform with a minimum prior notice <strong>of</strong> thirty-six hours.· Interrupti<strong>on</strong>s due to a fact from the costumer resp<strong>on</strong>sibility: The supply interrupti<strong>on</strong> may <strong>on</strong>ly take place following a prior notice<strong>of</strong> interrupti<strong>on</strong>, with a minimum advance warning <strong>of</strong> 8 days relative to the date when it will occur. If the costumer installati<strong>on</strong>emits perturbati<strong>on</strong>s to the network, the operator establishes, in accordance with the costumer, a time period for solving theproblem.SISENo ruleGive sufficient advance warningNo ruleNo rule115<str<strong>on</strong>g>Third</str<strong>on</strong>g> <str<strong>on</strong>g>Benchmarking</str<strong>on</strong>g> <str<strong>on</strong>g>Report</str<strong>on</strong>g> <strong>on</strong> <strong>Quality</strong> <strong>of</strong> <strong>Electricity</strong> <strong>Supply</strong> – 2005 · Annex 1
Secti<strong>on</strong> 3 – Tables <strong>on</strong> c<strong>on</strong>tinuity indicatorsTABLE 3.1 – UNPLANNED INTERRUPTIONS EXCLUDING EXCEPTIONAL EVENTSMinutes lost per customer per year (1999 – 2004)Country 19992000 2001 2002 2003 2004AustriaFranceGreat BritainItalyIrelandPortugalSpain52.00227.60137.4046.00187.60125.4045.0073.80138.57183.00412.86149.4035.2344.0072.24108.88183.00334.54132.0038.4351.0068.1696.82162.00303.75130.8030.3351.0061.4375.85156.50148.81118.20GreeceLithuania108.0032.3TABLE 3.2 – UNPLANNED INTERRUPTIONSMinutes lost per customer per year (1999 – 2004)Country 19992000 2001 2002 2003 2004FinlandFranceGreat BritainHungaryItalyIrelandNetherlandsPortugalSpainSweden198.00459.00411.00191.77273.6026.00156.37165.77129.60176.00241.20187.40257.9027.00145.4189.17468.0059.0075.84250.20149.09199.3034.00530.74179.69162.90284.4052.00101.33196.80114.74230.2028.00467.98142.56101.84212.4069.3072.68155.40546.08171.9030.00406.18141.91148.05103.0057.1087.33137.4090.53162.8024.00217.79123.6059.73LatviaLithuania14.008.50190.00Note: France 1999, 2000 and 2001 are MV and LV, 2002 <strong>on</strong>wards is <strong>on</strong>ly LVTABLE 3.3 – PLANNED INTERRUPTIONSMinutes lost per customer per year (1999 – 2004)Country 19992000 2001 2002 2003 2004AustriaFinlandFranceGreat BritainHungaryItalyIrelandPortugalSpainSweden103.204.0075.00172.0031.9690.0738.006.0099.6082.62164.7037.0534.5333.006.007.85139.8084.82202.0057.3736.5742.287.4032.009.04142.8077.97284.1052.2130.6637.1212.7932.005.308.43199.8080.67422.3062.3924.7925.4120.6930.006.606.95178.8062.62390.7049.1622.8029.59Est<strong>on</strong>iaGreeceLithuania11624.3887.00122.45Council <strong>of</strong> European Energy Regulators – Ref: C05-QOS-01-03
TABLE 3.4 – UNPLANNED INTERRUPTIONS EXCLUDING EXCEPTIONAL EVENTSInterrupti<strong>on</strong>s per customer per year (1999 – 2004)Country 19992000 2001 2002 2003 2004AustriaFranceGreat BritainItalyIrelandPortugalSpain1.031.301.200.833.191.265.900.591.150.752.741.245.932.510.671.400.772.681.474.812.510.611.300.692.391.682.952.47GreeceLithuania1.180.26TABLE 3.5 – UNPLANNED INTERRUPTIONSInterrupti<strong>on</strong>s per customer per year (1999 – 2004)Country 19992000 2001 2002 2003 2004FinlandFranceGreat BritainHungaryItalyIrelandNetherlandsPortugalSpainSweden3.321.223.093.811.150.401.382.891.202.293.591.490.401.236.611.200.842.133.291.310.407.513.301.343.341.200.822.032.761.370.307.352.651.323.971.430.792.053.961.500.405.962.601.644.001.300.751.902.481.700.303.662.061.05LatviaLithuania0.040.041.58TABLE 3.6 – PLANNED INTERRUPTIONSInterrupti<strong>on</strong>s per customer per year (1999 – 2004)Country 19992000 2001 2002 2003 2004AustriaFinlandFranceGreat BritainHungaryItalyIrelandPortugalSpainSweden1.830.030.290.510.451.300.040.340.610.430.250.550.040.040.500.590.490.320.420.230.070.460.040.520.490.660.290.260.260.130.470.040.040.750.490.760.300.200.220.170.500.050.030.680.400.670.230.190.22Est<strong>on</strong>iaGreeceLithuania1170.490.440.40<str<strong>on</strong>g>Third</str<strong>on</strong>g> <str<strong>on</strong>g>Benchmarking</str<strong>on</strong>g> <str<strong>on</strong>g>Report</str<strong>on</strong>g> <strong>on</strong> <strong>Quality</strong> <strong>of</strong> <strong>Electricity</strong> <strong>Supply</strong> – 2005 · Annex 1
TABLE 3.7 – SHORT INTERRUPTIONSNumber <strong>of</strong> short interrupti<strong>on</strong>s per customer per year (1999 – 2004)Country 19992000 2001 2002 2003 2004FinlandFranceGreat BritainHungaryItaly5.313.105.002.805.582.300.755.002.001.016.684.002.602.0210.986.432.601.0310.315.83Est<strong>on</strong>iaLithuania0.100.52TABLE 3.8 – ENERGY NOT SUPPLIEDMWh not supplied per year (1999 – 2004)Country 19992000 2001 2002 2003 2004FinlandFranceGreat BritainHungaryItalyNorwayPortugalSpainSweden41318.72007.530824311.967696058613.42485.1269842016.87799124014043.26377.320222254.4699023.1626981.01387.01978091.480349.2673263.141516.514546.421858976.246610416.7672948132952.73626.315996496.0125025.2TABLE 3.9 – DISTRIBUTED ENERGYTWh distributed per year (1999 – 2004)Country 19992000 2001 2002 2003 2004FinlandFranceGreat BritainHungaryItalyNorwayPortugalSpainSweden77.830.45103.86184.2810079.2305.89231.15107.42195.809981.2309.8432.20285108.37205.4110383.5315.3232.46290107.6136.15210.7010285.2521.6319.9234.33299105.1137.86216.0010486.8546.634.75299109.3140.12216.14108118Council <strong>of</strong> European Energy Regulators – Ref: C05-QOS-01-03
TABLE 3.10 – ENERGY NOT SUPPLIED AS A PERCENTAGE OF ENERGY DISTRIBUTEDPercentage Not Supplied per year (1999 – 2004)Country 19992000 2001 2002 2003 2004FinlandFranceGreat BritainHungaryItalyNorwayPortugalSpainSweden0.0005%0.0001%0.0297%0.0004%0.0001%0.0000%0.0002%0.0000%0.0251%0.0004%0.0001%0.0003%0.0005%0.0000%0.0022%0.0187%0.0034%0.0000%0.0001%0.0002%0.0000%0.0005%0.0184%0.0003%0.0004%0.0000%0.0001%0.0006%0.0001%0.0000%0.0049%0.0208%0.0026%0.0002%0.0100%0.0001%0.0005%0.0002%0.0012%0.0146%0.0012%0.0006%0.0000%TABLE 3.11 – AITCountry 19992000 2001 2002 2003 2004Belgium – nati<strong>on</strong>alBelgium – Wall<strong>on</strong>iaFinlandFranceGreat BritainHungaryItalyLatviaPolandPortugalSpainSweden3.321.223.093.811.150.401.3803.620.790.233.53317029.542.110.4170.981.552.461.870.058.0529293.8217.870.10.620.392.400.930.161.7225781.352.010.2172.3220.50.414.210.540.1317.95261513.931.147.529.960.413.771.710.794.420.2828466.682.80.12119<str<strong>on</strong>g>Third</str<strong>on</strong>g> <str<strong>on</strong>g>Benchmarking</str<strong>on</strong>g> <str<strong>on</strong>g>Report</str<strong>on</strong>g> <strong>on</strong> <strong>Quality</strong> <strong>of</strong> <strong>Electricity</strong> <strong>Supply</strong> – 2005 · Annex 1
Secti<strong>on</strong> 4 – Voltage level analysisTABLE 4.1 – VOLTAGE ANALYSIS UNPLANNED MINUTES LOST PER CUSTOMER EXCLUDINGEXCEPTIONAL EVENTSCountry 19992000 2001 2002 2003 2004AustriaEst<strong>on</strong>iaGreat BritainGreeceHungaryItalyLithuaniaMVTHV, MV, LVMV, HV, TLVMVLVHVMVLVTHVMVLVMVLV316.294.80.681.15136.2526.4416576.82.722.63124.3129.5617476.282.12102.6325.8235.23130.851.60.821.4680.5926.0138.435.8812.3150.6317.5395134.212340.20.941.6673.8520.3830.3344.5816.851.895.440.21.682.8155.8715.5239Note: A number <strong>of</strong> countries did not provide data split by voltage level, therefore the number <strong>of</strong> countries included in this table does not match those representedin the corresp<strong>on</strong>ding figure in Chapter 1.VOLTAGE ANALYSIS SAIDI – EXCLUDING EXCEPTIONAL EVENTSMinutes lost per customer per year due to unplanned interrupti<strong>on</strong>s400minutes lost per customer300200100■ T network■ HV networks■ MV networks■ LV networks0ITHU IT HU IT HU IT HU AT IT HU GR GB EE AT LT IT HU GB AT1999 2000 2001 year 2002 2003 2004For most countries the majority <strong>of</strong> customer minutes lost occur due to faults <strong>on</strong> the MV networks.The data for Great Britain records all interrupti<strong>on</strong>s occurring <strong>on</strong> MV, HV and T networks under theHV networks category. Over time it is generally the case that the durati<strong>on</strong> <strong>of</strong> interrupti<strong>on</strong>s at allvoltage levels has been declining.120Council <strong>of</strong> European Energy Regulators – Ref: C05-QOS-01-03
TABLE 4.2 – VOLTAGE LEVEL ANALYSIS UNPLANNED INTERRUPTIONS PER CUSTOMEREXCLUDING EXCEPTIONAL EVENTSAustriaEst<strong>on</strong>iaFranceGreat BritainGreeceHungaryItalyCountry 19992000 2001 2002 2003 2004LithuaniaMVTHV, MV, LVTMV, HV, TLVMVLVHVMVLVTHVMVLVMVLV0.092.50.590.090.13.560.230.091.830.460.130.122.970.24Note: A number <strong>of</strong> countries did not provide data split by voltage level, therefore the number <strong>of</strong> countries included in this table does not match those representedin the corresp<strong>on</strong>ding figure in Chapter 1.0.091.70.420.180.142.690.180.590.071.550.400.071.12.410.160.670.140.090.140.670.091.00.180.111.650.370.070.092.350.170.610.090.600.090.091.620.350.090.112.050.140.20.07VOLTAGE LEVEL ANALYSIS SAIFI – EXCLUDING EXCEPTIONAL EVENTSCustomer interrupti<strong>on</strong>s per customer per year due to unplanned interrupti<strong>on</strong>s4number <strong>of</strong> interrupti<strong>on</strong>s per customer321■ T network■ HV networks■ MV networks■ LV networks0IT HU FRIT HU FRIT HU FR IT HU FR AT IT HU GR GB FR EE AT LT IT HU GB FR AT1999 2000 2001 year 2002 2003 2004Again it can be seen that the majority <strong>of</strong> interrupti<strong>on</strong>s are due to faults <strong>on</strong> MV networks.121<str<strong>on</strong>g>Third</str<strong>on</strong>g> <str<strong>on</strong>g>Benchmarking</str<strong>on</strong>g> <str<strong>on</strong>g>Report</str<strong>on</strong>g> <strong>on</strong> <strong>Quality</strong> <strong>of</strong> <strong>Electricity</strong> <strong>Supply</strong> – 2005 · Annex 1
Secti<strong>on</strong> 5 – Density analysisRegulators were asked to provide a density level analysis <strong>of</strong> nati<strong>on</strong>wide c<strong>on</strong>tinuity levels forunplanned interrupti<strong>on</strong>s from the year 1999 to the year 2004.DENSITY ANALYSIS SAIDI EXCLUDING EXCEPTIONAL EVENTSMinutes lost per customer per year due to unplanned interrupti<strong>on</strong>s – split by area600minutes lost per customer500400300200100■ Urban■ Suburban■ Rural0IT SE IT SE FR IT PT SE IT PT SE GR IE IT PT SE FR IE IT SE LT1999 2000 2001 2002 2003 2004DENSITY ANALYSIS SAIFI – EXCLUDING EXCEPTIONAL EVENTSNumber <strong>of</strong> interrupti<strong>on</strong>s per customer per year due to unplanned interrupti<strong>on</strong>s – split by area9number <strong>of</strong> l<strong>on</strong>g interrupti<strong>on</strong>s per customer876543210IT SE IT SE FR IT PT SE IT PT SE GR IT PT SE FR IT SE LT1999 2000 2001 2002 2003 2004■ Urban■ Suburban■ Rural122Council <strong>of</strong> European Energy Regulators – Ref: C05-QOS-01-03
The classificati<strong>on</strong> <strong>of</strong> c<strong>on</strong>tinuity data <strong>on</strong> the basis <strong>of</strong> density level is a useful way, within a country,for a regulatory authority to m<strong>on</strong>itor network performance in rural and urban areas. However,cross-country comparis<strong>on</strong>s are complicated for the following reas<strong>on</strong>s:Not all countries adopt a classificati<strong>on</strong> for density analysis. For example, Austria, Est<strong>on</strong>ia, GreatBritain, Hungary, Latvia, Poland and Slovenia do not use territorial classificati<strong>on</strong> for disaggregatedanalysis. Figures below show the survey results for Italy, Sweden, France and Greece, <strong>on</strong> thebasis <strong>of</strong> “urban”, “semi-urban” and “rural” classificati<strong>on</strong>.As would be expected both the durati<strong>on</strong> and number <strong>of</strong> interrupti<strong>on</strong>s rise the less dense the area, withurban areas showing the best performance, followed by suburban areas and then the rural areas.Secti<strong>on</strong> 6 – Regressi<strong>on</strong> analysisRegressi<strong>on</strong> analysis <strong>of</strong> durati<strong>on</strong> and frequency <strong>of</strong> unplanned interrupti<strong>on</strong>s using regi<strong>on</strong>al dataREGRESSION OF THE DURATION AND FREQUENCY OF UNPLANNEDINTERRUPTIONS USING REGIONAL DATA (2004)2000minutes lost per customer1800160014001200100080060040020000y = 51.954x + 43.647R 2 = 0.26832 4 6 8 10Interrupti<strong>on</strong>s per customerThere should be a positive correlati<strong>on</strong> between the number and durati<strong>on</strong> <strong>of</strong> interrupti<strong>on</strong>s as displayedby the graph, however, the R 2 is very low and <strong>on</strong> inspecti<strong>on</strong> <strong>of</strong> the data it was felt that <strong>on</strong>ecountry’s informati<strong>on</strong> was distorting the analysis. The following graph shows the same analysisbut excluding that country. It can be seen that the R 2 value increases significantly.123<str<strong>on</strong>g>Third</str<strong>on</strong>g> <str<strong>on</strong>g>Benchmarking</str<strong>on</strong>g> <str<strong>on</strong>g>Report</str<strong>on</strong>g> <strong>on</strong> <strong>Quality</strong> <strong>of</strong> <strong>Electricity</strong> <strong>Supply</strong> – 2005 · Annex 1
REGRESSION ANALYSIS OF THE DURATION AND FREQUENCY OF UNPLANNEDINTERRUPTIONS USING REGIONAL DATA (2004)500minutes lost per customer40030020010000y = 49.191x + 19.187R 2 = 0.70621 2 3 4 5 6 7 8Interrupti<strong>on</strong>s per customerCorrelati<strong>on</strong> between quality <strong>of</strong> supply and densityThe number <strong>of</strong> supply interrupti<strong>on</strong>s is to a large extent dependent <strong>on</strong> whether a c<strong>on</strong>sumer is c<strong>on</strong>nectedto an urban or rural network. This is because urban customers are generally supplied byunderground cables whereas rural customers are supplied by overhead lines. One would expecthigh density levels (urban customers) to experience high levels <strong>of</strong> quality <strong>of</strong> supply (low number<strong>of</strong> interrupti<strong>on</strong>s for short periods). Work carried out in Great Britain has indicated that the performance<strong>of</strong> completely overhead circuits is similar to that <strong>of</strong> entirely underground cables and thatit is mixed circuits, those c<strong>on</strong>taining both overhead and underground secti<strong>on</strong>s, which have theworst performance.Using all the available informati<strong>on</strong> for this analysis resulted in a very low R 2 and a negligible relati<strong>on</strong>shipbetween the density represented by the average length <strong>of</strong> MV circuits and the durati<strong>on</strong> <strong>of</strong>interrupti<strong>on</strong>s. Removing countries whose data appeared to be skewing the results improved theR 2 and the relati<strong>on</strong>ship although the relati<strong>on</strong>ship shown is still weak.SAIDI AND DENSITY (AVERAGE LENGTH OF MV CIRCUITS PER CUSTOMER)USING UNPLANNED INTERRUPTIONS REGIONAL DATA (2004)minutes lost per customer2502001501005000y = 2.3722x + 64.019R 2 = 0.173410 20 30 40Average length <strong>of</strong> MV circuits per 1,000 customers124Council <strong>of</strong> European Energy Regulators – Ref: C05-QOS-01-03
The same pattern emerges with the interrupti<strong>on</strong>s data when correlated with the average length <strong>of</strong>MV circuits. The R 2 is very low and the relati<strong>on</strong>ship very weak when looking at all the availabledata but improves somewhat when a smaller number <strong>of</strong> countries are evaluated.Based <strong>on</strong> subset <strong>of</strong> informati<strong>on</strong> received.NUMBER OF INTERRUPTIONS AND DENSITY (AVERAGE LENGTH OF MV CIRCUITSPER CUSTOMER) USING UNPLANNED INTERRUPTIONS REGIONAL DATA (2004)3minutes lost per customer2211y = 0.0228x + 0.8713R 2 = 0.14690010 20 30 40Average length <strong>of</strong> MV circuits per 1,000 customersUsing the number <strong>of</strong> customers per Km 2 as the proxy for density resulted in low R 2 even whencertain data was excluded. As expected, quality appears to decrease with lower levels <strong>of</strong> density,as indicated by the slopes in the graphs.Distributed energyDISTRIBUTED ENERGY – ALL CUSTOMERSdistributed energy (TWh)500400300200100019992000 2001 year 2002 2003 2004AustriaBelgium_natBelgium_wallCzech RepublicEst<strong>on</strong>iaFinlandFranceGreat BritainGreeceHungaryIrelandItalyLatviaLithuaniaNorwayPolandPortugalSloveniaSpainSweden125<str<strong>on</strong>g>Third</str<strong>on</strong>g> <str<strong>on</strong>g>Benchmarking</str<strong>on</strong>g> <str<strong>on</strong>g>Report</str<strong>on</strong>g> <strong>on</strong> <strong>Quality</strong> <strong>of</strong> <strong>Electricity</strong> <strong>Supply</strong> – 2005 · Annex 1
France distributes the most energy across all customers with Great Britain generally distributingthe most energy to MV and LV customers. The growth in total energy distributed appears to havebeen driven by growth at the MV and LV level, as can be seen in the graph below.DISTRIBUTED ENERGY – MV AND LV CUSTOMERS350distributed energy (TWh)30025020015010050019992000 2001 year 2002 2003 2004Belgium_wallCzech RepublicEst<strong>on</strong>iaFinlandFranceGreat BritainGreeceHungaryIrelandItalyLatviaLithuaniaNorwayPolandPortugalSloveniaSpain126Council <strong>of</strong> European Energy Regulators – Ref: C05-QOS-01-03
ANNEX TO CHAPTER 2.Annex 2.1 – Competencies <strong>of</strong> Regulatory Authorities <strong>on</strong> the Subject <strong>of</strong> <strong>Quality</strong> Regulati<strong>on</strong>CountryAustriaCan set qualitystandardsNoCan set compensati<strong>on</strong> tocustomersNoCan setincentive/penaltyregimesNoCannot setquality regulati<strong>on</strong> /can make proposalsto the GovernmentYesOtherThe implementati<strong>on</strong> <strong>of</strong> a system for qualityregulati<strong>on</strong> will be discussed in the near future. Itwill be necessary to legislate resp<strong>on</strong>sibilities andcompetencies with regard to quality regulati<strong>on</strong>.BelgiumCzech Rep.YesYesYesEst<strong>on</strong>iaNoYesNoYesFinlandYes (if it is under the"obligati<strong>on</strong> to developthe network")NoNoYesFranceNoYes: if the customercomplains to the regulator,the regulator canset compensati<strong>on</strong>, butin particular cases <strong>on</strong>lyNot yetYesA law was just published <strong>on</strong> 13 July aboutenergey policies and orientati<strong>on</strong>s. This lawprovides for quality standards and thresholdsthat have to be respected by distributi<strong>on</strong> andtransmissi<strong>on</strong> companies. A decree will set thesethresholds, and if they are not respected, theoperator (transmissi<strong>on</strong> or distributi<strong>on</strong>) will haveto pay penalties. The regulator will be c<strong>on</strong>sulted<strong>on</strong> this decree, and will give advice andcomments about it before its publicati<strong>on</strong>.Great BritainYesYesYesGreeceNoNoNoYesHungaryYesYesYesIrelandYesItalyYesYesYesLatviaYesNoNoLithuaniaNoNoNoRegulator's legal power is limited: it superviseshow licensed companies follow the qualityrequirements established by the Ministry <strong>of</strong>Ec<strong>on</strong>omyNorwayYesYesYesPolandNoNot yetNot yetYesRegulator will be c<strong>on</strong>sulted <strong>on</strong> the new lawregarding quality standards and incentive/penalty regimesPortugalYes, in collaborati<strong>on</strong>with DGGEYesYesSpainNoNoNoYesSwedenNoYesYesYes18DGGE: General Directorate for Geology and Energy: resp<strong>on</strong>sible for the publicati<strong>on</strong> <strong>of</strong> the <strong>Quality</strong> <strong>of</strong> Service Code, while theregulator ERSE is resp<strong>on</strong>sible for presenting to DGGE a proposal for commercial regulati<strong>on</strong>s and for supervising enforcement<strong>of</strong> the Code.127<str<strong>on</strong>g>Third</str<strong>on</strong>g> <str<strong>on</strong>g>Benchmarking</str<strong>on</strong>g> <str<strong>on</strong>g>Report</str<strong>on</strong>g> <strong>on</strong> <strong>Quality</strong> <strong>of</strong> <strong>Electricity</strong> <strong>Supply</strong> – 2005 · Annex 2
ANNEX TO CHAPTER 3.Annex 3AAs menti<strong>on</strong>ed in the chapter “Commercial quality”, some standards and facts are analyzed here.The structure is similar to the chapter’s body and the numbering is c<strong>on</strong>tinuous.3.3.3. Problems associated with voltage and meteringQuest.2.1.11Supp.1Recomm.✰✰DSO2OS GS1 23.3.3.4. Standards applied for prepayment meter faultsOnly two countries indicated standards relevant to this case. The reas<strong>on</strong> can possibly be the lownumber <strong>of</strong> prepayment meters. However, there is a significant deviati<strong>on</strong> between the standards <strong>of</strong>the two countries. In Spain the timescale is 5 working days below 15 kW c<strong>on</strong>necti<strong>on</strong> capacity,while it is 15 working days over this capacity. In c<strong>on</strong>trast, in Britain the fault shall be eliminatedwithin 3 hours in working days, and within 4 hours in other days. Eliminati<strong>on</strong> <strong>of</strong> the fault may meanthe repair or the replacement <strong>of</strong> the meter. In case <strong>of</strong> n<strong>on</strong>-compliance the payment <strong>of</strong> compensati<strong>on</strong>is automatic in both cases, the rate <strong>of</strong> compensati<strong>on</strong> is € 30. In Spain this sum may begreater if 15% <strong>of</strong> the first complete bill is less than the this sum. (Table 3.38 <strong>of</strong> Annex 3B.)Currently this standard is applied <strong>on</strong>ly in a few countries. We do not recommend its harm<strong>on</strong>izedintroducti<strong>on</strong> within CEER.Customer c<strong>on</strong>tact in Pers<strong>on</strong>Quest.2.1.13Supp.0Recomm.✰✰✰DSO3OS GS2 13.3.5.4. Standards applied for the visits necessary for the replacement <strong>of</strong> the meterIn most countries this is part <strong>of</strong> the simple works described under secti<strong>on</strong> 3.3.1.3, thus no separatestandard has been established for this activity. Only three substantial answers where received. InEst<strong>on</strong>ia, where 7 working days are available following the receipt <strong>of</strong> the notice <strong>of</strong> the customer forthe adjustment or the replacement <strong>of</strong> the meter, and the customer shall pay for the activity. In Italysame figure is 15 working days while compesati<strong>on</strong> is € 30-60. (Table 3.39 <strong>of</strong> Annex 3B.)If the meter is owned by the distributor or the supplier, we do not c<strong>on</strong>sider it justified, that thecustomer shall pay for the adjustment or the replacement <strong>of</strong> the meter, except in the case when themeter has been damaged by the customer, or the customer has caused the replacement necessary.129<str<strong>on</strong>g>Third</str<strong>on</strong>g> <str<strong>on</strong>g>Benchmarking</str<strong>on</strong>g> <str<strong>on</strong>g>Report</str<strong>on</strong>g> <strong>on</strong> <strong>Quality</strong> <strong>of</strong> <strong>Electricity</strong> <strong>Supply</strong> – 2005 · Annex 3A
Quest.2.1.18Supp.0Recomm.✰✰DSO5OS GS2 43.3.5.5. Standards applied for the case <strong>of</strong> deactivati<strong>on</strong> <strong>on</strong> customer’s requestIn Belgium (Flanders), Greece and France the DSO has 2 (working) days for deactivati<strong>on</strong> based<strong>on</strong> customers’ requests. The Italian standard is l<strong>on</strong>ger (5 working days for low voltage, 7 workingdays for medium voltage), but the compensati<strong>on</strong> payment is higher. (In France the compensati<strong>on</strong>is € 25, in Greece: € 15, in Italy: € 30 (household customers), € 60 (n<strong>on</strong>-household customers),€ 120 (medium voltage.) (Table 3.40 <strong>of</strong> Annex 3B.)From the low number <strong>of</strong> countries applying this standard the c<strong>on</strong>clusi<strong>on</strong> can be drawn, that thisindicator is not significant from the point <strong>of</strong> view <strong>of</strong> commercial quality, therefore we think, itsharm<strong>on</strong>ized introducti<strong>on</strong> and applicati<strong>on</strong> within CEER is not necessary.Quest.1.1.2Supp.1Recomm.✰✰✰DSO43.3.5.6. Actual levels applied for the number <strong>of</strong> visits to the customer centers per 100 customersThe indicated actual levels are between 2.6 and 116. Except Est<strong>on</strong>ia the data were supplied in allcases by the distributor. Portugal’s data are based <strong>on</strong> the data measured in the three largest customercenters. The calculati<strong>on</strong> method applied by Est<strong>on</strong>ia corresp<strong>on</strong>ds to the method describedunder secti<strong>on</strong> 3.3.5.3. (Table 3.41 <strong>of</strong> Annex 3B.)The resp<strong>on</strong>ses given in relati<strong>on</strong> with this indicator also c<strong>on</strong>firm that the expectati<strong>on</strong>s and the practice<strong>of</strong> the customers are different by the regi<strong>on</strong>, the nati<strong>on</strong>al characteristics, and the town/countrysiderequirements, and these expectati<strong>on</strong>s are c<strong>on</strong>tinuously changing. Therefore it is not necessary to strivefor the establishment <strong>of</strong> uniform indicators, respectively for a harm<strong>on</strong>izati<strong>on</strong> <strong>of</strong> indicators within CEER.3.3.6 Customer c<strong>on</strong>tact by ph<strong>on</strong>eQuest.1.1.4Supp.4Recomm.✰✰✰DSO63.3.6.3. Actual levels applied for the ph<strong>on</strong>e calls per 100 customersThe data received regarding actual levels <strong>of</strong> ph<strong>on</strong>e calls per 100 customers are between 1,8 and137. The original data were supplied by the distributors, except Est<strong>on</strong>ia, Hungary and Italy. Theregulator <strong>of</strong> Greece indicated both licensees as data suppliers. Italy’s are based <strong>on</strong> the ENEL datasupply referring to the sec<strong>on</strong>d half <strong>of</strong> 2004. In the case <strong>of</strong> Hungary the data include the reports <strong>on</strong>meter readings, reports <strong>on</strong> interrupti<strong>on</strong>s, billing complaints and all other changes in technical orbilling parameters. However, it is possible that in the other countries <strong>on</strong>ly a part <strong>of</strong> these areincluded in the statements. (Table 3.42 <strong>of</strong> Annex 3B.)The low level <strong>of</strong> ph<strong>on</strong>e calls maybe the result <strong>of</strong> a number <strong>of</strong> factors, like:· in case <strong>of</strong> new Call Centers the customers still prefer the pers<strong>on</strong>al c<strong>on</strong>tact,· high level <strong>of</strong> customer satisfacti<strong>on</strong> (they have <strong>on</strong>ly a few complaints),meter readings “must not” be reported or are measured separately.·The high level <strong>of</strong> ph<strong>on</strong>e calls maybe the result customer satisfacti<strong>on</strong> with the operati<strong>on</strong> <strong>of</strong> CallCenter, however complaints <strong>on</strong> interrupti<strong>on</strong>s or billing may also result in high number <strong>of</strong> ph<strong>on</strong>e calls.130Council <strong>of</strong> European Energy Regulators – Ref: C05-QOS-01-03
When evaluating service quality, it is important to use the indicator <strong>on</strong>ly in its own nati<strong>on</strong>al, regi<strong>on</strong>aland historical envir<strong>on</strong>ment. Internati<strong>on</strong>al comparis<strong>on</strong> may be misleading. However, in a nati<strong>on</strong>alenvir<strong>on</strong>ment it allows us to evaluate, how the Call Centers are “loaded”.3.3.7 Customer complaintsQuest.1.1.11Supp.3Recomm.✰✰✰DSO53.3.7.4. Actual levels relevant to the number <strong>of</strong> corrected bills per 100 customersThe data received from five countries are between 0.01 and 5.2. The data were supplied by thedistributor, except in Ireland, Italy and Est<strong>on</strong>ia. It seems to be, that 5 mistakes (corrected bills) inevery 100 issued bills are rather high! (Table 3.43 <strong>of</strong> Annex 3B.)Quest.1.1.17Supp.4Recomm.✰✰✰DSO43.3.7.5. Actual levels relevant to billing complaints per 100 customersOnly four countries supplied data which are between 0.0004 and 3.6. The original data were deliveredby the suppliers, except in Ireland, in Latvia and in Portugal. The data <strong>of</strong> Greece refer <strong>on</strong>lyto written complaints. In Hungary in the regulated tariff segment <strong>on</strong>ly the public supplier issuesbills which combine the distributi<strong>on</strong> fee and the supply fee. In the free market segment there areseparate network related and energy related bills. The indicated data show the number <strong>of</strong> complaintsrelevant to these bills. (Table 3.44 <strong>of</strong> Annex 3B.)3.3.8 Meter reading, billingQuest.2.1.22Supp.0Recomm.✰✰DSO1OS GS0 13.3.8.3. Standards applied for the accuracy <strong>of</strong> the bills <strong>of</strong> estimated c<strong>on</strong>sumpti<strong>on</strong>We have received answer to this questi<strong>on</strong> <strong>on</strong>ly from Spain. According to the standard effective inthat country customers with supply tariffs 1.0 and 2.0 may be billed by historical averages.However, the distributor must make an adjustment every six m<strong>on</strong>ths in order to base the bill <strong>on</strong>the actual c<strong>on</strong>sumpti<strong>on</strong>. There was no menti<strong>on</strong> by the regulators <strong>of</strong> the countries whether the customershave expectati<strong>on</strong>s with regard to the rate <strong>of</strong> difference between the c<strong>on</strong>sumpti<strong>on</strong> billed bythe mid-year estimated bills and the c<strong>on</strong>sumpti<strong>on</strong> billed by the final bill issued at the end <strong>of</strong> theyear. Namely, it may occur, that the licensees – estimating the expected increase <strong>of</strong> c<strong>on</strong>sumpti<strong>on</strong>– issue estimated bills during the year in which they account for c<strong>on</strong>sumpti<strong>on</strong> higher than the realisticallyexpected volume, thus forcing the customers to overpay. (Table 3.45 <strong>of</strong> Annex 3B.)If we take into c<strong>on</strong>siderati<strong>on</strong> the above suggesti<strong>on</strong>, namely that the soluti<strong>on</strong> <strong>of</strong> the current problemswould be the more frequent meter-reading in the future, this also means that the problem <strong>of</strong> theaccuracy <strong>of</strong> the estimated bills will cease, since the estimated bills themselves will also cease within afew years. Therefore, we think that there is no need for a harm<strong>on</strong>ized regulati<strong>on</strong> in this matterwithin the framework <strong>of</strong> CEER.131<str<strong>on</strong>g>Third</str<strong>on</strong>g> <str<strong>on</strong>g>Benchmarking</str<strong>on</strong>g> <str<strong>on</strong>g>Report</str<strong>on</strong>g> <strong>on</strong> <strong>Quality</strong> <strong>of</strong> <strong>Electricity</strong> <strong>Supply</strong> – 2005 · Annex 3A
Quest.1.1.9Supp.0Recomm.✰✰✰DSO53.3.8.4. Actual levels relevant to the annual readings by the customersFour countries supplied data which are between 0.03 and 8.7 average self meter-readings peryear. The data supplier was the distributor in all cases. In Portugal <strong>on</strong>ly low voltage customershave been taken into c<strong>on</strong>siderati<strong>on</strong> up to a c<strong>on</strong>tracted capacity <strong>of</strong> 41.1 kVA. In Italy the meters areread <strong>on</strong>ly <strong>on</strong>ce in a year. 95% <strong>of</strong> these readings are self-readings by customers. Therefore thisvalue is included in the previous indicator. (Table 3.46 <strong>of</strong> Annex 3B.)Quest.1.1.10Supp.2Recomm.✰✰✰DSO53.3.8.5. Actual levels relevant to the proporti<strong>on</strong> <strong>of</strong> estimated billsThe data supplies varied between 0,58% and 94%. In five countries the data supplier was the distributorlicensee, in two countries the data were supplied by the supplier. In Portugal <strong>on</strong>ly low voltagecustomers have been taken into c<strong>on</strong>siderati<strong>on</strong> up to a c<strong>on</strong>tracted capacity <strong>of</strong> 41.1 kVA. In Italythe automatic meter reading project will result so<strong>on</strong> in the eliminati<strong>on</strong> <strong>of</strong> estimated bills. In Est<strong>on</strong>iathere is meter reading <strong>on</strong>ce in a year which is generally performed by the customer. Further billsare based <strong>on</strong> estimati<strong>on</strong>. (Table 3.47 <strong>of</strong> Annex 3B.)3.3.9 Individual (special) standards (applied <strong>on</strong>ly in <strong>on</strong>e country)Country Standard Expected valueOS/GSDSO/Supp.Compensati<strong>on</strong> paymentsRecommendati<strong>on</strong>AustriaBelgium (Wall<strong>on</strong>ia)Resp<strong>on</strong>se to the applicati<strong>on</strong> for new c<strong>on</strong>necti<strong>on</strong> to the gridTransmissi<strong>on</strong> <strong>of</strong> meter reading data to the suppliersChange <strong>of</strong> supplier and/or ARP14 daysBefore 4. or 10. workingday after the subjectm<strong>on</strong>thsat least a m<strong>on</strong>ths inadvanceOSGSGSDSODSOSupp.✰✰✰✰✰✰✰Czech RepublicEst<strong>on</strong>iaGreeceHungaryAnswer to supply quality complaintsEliminati<strong>on</strong> <strong>of</strong> reas<strong>on</strong>s <strong>of</strong> n<strong>on</strong>-quality supplyResp<strong>on</strong>se to the applicati<strong>on</strong> for new network c<strong>on</strong>necti<strong>on</strong>Resp<strong>on</strong>se to the applicati<strong>on</strong> for a new c<strong>on</strong>necti<strong>on</strong> to the gridFeasibility study associated with a new c<strong>on</strong>necti<strong>on</strong>Reimbursement after wr<strong>on</strong>g billing30 days30, 60 days 2 years30 days30 days15 or 25 working days8 daysGSGSGSOSGSGSDSODSODSODSOSup.€ 30/days, max. € 800€ 30/days, max. € 1600€ 15 /days€ 15HH € 8, N<strong>on</strong> HH € 24,MV € 60✰✰✰✰✰✰✰✰✰✰✰✰✰✰✰✰✰✰Unjustified disc<strong>on</strong>necti<strong>on</strong>GSDSO/Sup.HH € 40, N<strong>on</strong> HH€ 80, MV € 240✰✰IrelandNumber <strong>of</strong> justified complaints received by the regulatorMeter works requested by Supplier <strong>on</strong> behalf <strong>of</strong> customerdiffering per regi<strong>on</strong>95% 5 w.day,100% 10 w.dayGSOSDSO/Sup.✰✰✰✰✰✰Refund GuaranteeIndependent Complaints Arbitratorwithin 5 working daywithin 10 working dayGSGSDSODSO€ 35€ 130✰✰✰✰✰✰132Council <strong>of</strong> European Energy Regulators – Ref: C05-QOS-01-03
(CONTINUE)Country Standard Expected valueOS/GSDSO/Supp.Compensati<strong>on</strong> paymentsRecommendati<strong>on</strong>SpainDisc<strong>on</strong>necti<strong>on</strong> <strong>of</strong> the eligible customer due to lack <strong>of</strong> payment5 daysGSDSO✰✰Disc<strong>on</strong>necti<strong>on</strong> following lack <strong>of</strong> payment for Public EntitiesDisc<strong>on</strong>necti<strong>on</strong> following lack <strong>of</strong> payment for integral tariffscustomers n<strong>on</strong> Public Entities4 m<strong>on</strong>ths2 m<strong>on</strong>thsGSGSDSODSO✰✰✰✰Notifying anomalies or errors in applicati<strong>on</strong> <strong>of</strong> access tothe distributi<strong>on</strong> network10 daysGSDSO✰✰✰Rejecti<strong>on</strong> <strong>of</strong> applicati<strong>on</strong> <strong>of</strong> access to the distributi<strong>on</strong> network15 daysGSDSO✰✰✰Notificati<strong>on</strong> <strong>of</strong> finalizati<strong>on</strong> <strong>of</strong> power purchase c<strong>on</strong>tracts atlow voltage between customer and supplier (LV)15 working daysGSDSO/Sup.✰✰✰Reply to applicati<strong>on</strong>s <strong>of</strong> eligible customers to modify thec<strong>on</strong>tract5 working daysGSDSO✰✰3.3.10 Individual (special) facts (measured <strong>on</strong>ly by <strong>on</strong>e country)At the end <strong>of</strong> Table 1.1 <strong>of</strong> the questi<strong>on</strong>naire the regulators were asked to add further indicators inadditi<strong>on</strong> to the predetermined 17 standard indicators. Six countries made use <strong>of</strong> this opti<strong>on</strong>, thus,in total 19 new indicators were specified.3.3.10.1 Belgium (Flanders)Number <strong>of</strong> complaints per 100 customers voltage quality: Change <strong>of</strong> voltage magnitude 0.1143,Flicker 0.0092, Harm<strong>on</strong>ic voltage 0.0002, Voltage dips 0.006. Number <strong>of</strong> complaints per 100 customers:<strong>Quality</strong> <strong>of</strong> service by DSO (realizati<strong>on</strong> <strong>of</strong> c<strong>on</strong>necti<strong>on</strong>s, timely reacti<strong>on</strong>s <strong>on</strong> interrupti<strong>on</strong>s,supplying informati<strong>on</strong> about interrupti<strong>on</strong>s, repairing malfuncti<strong>on</strong>ing meter)3.3.10.2 Est<strong>on</strong>iaNumber <strong>of</strong> letters per 100 customers: 2.5. Average resp<strong>on</strong>se time to the letters: 23.3 days.Number <strong>of</strong> e-mails per 100 customers: 3.5. Average resp<strong>on</strong>se time to the e-mails: 12.1 hours.3.3.10.3 GreeceAverage time <strong>of</strong> attendance in the customer centers. 2003: 5.3 minutes, 2004: 6.15 minutes. Number<strong>of</strong> fr<strong>on</strong>t <strong>of</strong>fice staff per 1000 customers. 2003: 0.08. Number <strong>of</strong> back <strong>of</strong>fice staff per 1000 customers.2003: 0.18. Number <strong>of</strong> cashiers per 1000 customers. 2003: 0.05. Number <strong>of</strong> collectors per 1000customers. 2003: 0.23. Total number <strong>of</strong> customer service positi<strong>on</strong>s (own employees & billing subc<strong>on</strong>tractors)per 1000 customers in 2003 is 0.36. Number <strong>of</strong> customer centers per 1000 customersis 0.003 in 2003. Number <strong>of</strong> service positi<strong>on</strong> in the customer centers is 9.47 in 2003.133<str<strong>on</strong>g>Third</str<strong>on</strong>g> <str<strong>on</strong>g>Benchmarking</str<strong>on</strong>g> <str<strong>on</strong>g>Report</str<strong>on</strong>g> <strong>on</strong> <strong>Quality</strong> <strong>of</strong> <strong>Electricity</strong> <strong>Supply</strong> – 2005 · Annex 3A
3.3.10.4 Hungary<strong>Supply</strong> level in the Call Centers. The proporti<strong>on</strong> <strong>of</strong> calls received by the operators within a givenperiod <strong>of</strong> time: 2004: 81.1%. (Expectati<strong>on</strong>: 80% within 30 sec<strong>on</strong>ds). Number <strong>of</strong> complaints per1000 customers arriving to the regulator. Fact: 2004: 0.0563.3.3.10.5 ItalyAverage adjustment time <strong>of</strong> billing complaints, if the customer paid a wr<strong>on</strong>g sum: 47.73 days.3.3.10.6 LithuaniaTime <strong>of</strong> restorati<strong>on</strong> <strong>of</strong> the supply following disc<strong>on</strong>necti<strong>on</strong> due to unpaid bills: 2 days for householdcustomers, 1 day for other customers. (This indicator corresp<strong>on</strong>ds to the indicator under questi<strong>on</strong>1.1.16.). Notice before scheduled interrupti<strong>on</strong>: 14 days in case <strong>of</strong> household customers, 10 daysin case <strong>of</strong> other customers. Time between the receipt <strong>of</strong> meter complaints and the visit to the site:4 days in case <strong>of</strong> household customers, 3 days in case <strong>of</strong> other customers.3.3.10.7 PortugalProporti<strong>on</strong> <strong>of</strong> customers waiting less than 20 minutes in the customer centers (data from the threelargest customer centers with the highest number <strong>of</strong> customers: 96%. Proporti<strong>on</strong> <strong>of</strong> customerssupplied with energy within four hours after a breakdown: 97%.134Council <strong>of</strong> European Energy Regulators – Ref: C05-QOS-01-03
ANNEX 3B135<str<strong>on</strong>g>Third</str<strong>on</strong>g> <str<strong>on</strong>g>Benchmarking</str<strong>on</strong>g> <str<strong>on</strong>g>Report</str<strong>on</strong>g> <strong>on</strong> <strong>Quality</strong> <strong>of</strong> <strong>Electricity</strong> <strong>Supply</strong> – 2005 · Annex 3B
TABLE 3.2INDICATORS1.1.1. Average waiting time in customer centres1.1.2. Number <strong>of</strong> visits per 100 customers incustomer centres1.1.3. Average waiting time in call centres1.1.4. Number <strong>of</strong> calls per 100 customersin call centres1.1.5. Number <strong>of</strong> complaints per 100 customers1.1.6. Average resp<strong>on</strong>se time to writtencustomer's complaints1.1.7. Average resp<strong>on</strong>se time to customer'swritten queries1.1.8. Average annual meter readings per customerfor LV (carried out by the network operator)1.1.9. Average annual self meter readings percustomer for LV (carried out by the customer)1.1.10. Percentage <strong>of</strong> estimated bills1.1.11. Number <strong>of</strong> revised bills per 100 customers1.1.12. Average resp<strong>on</strong>se time <strong>of</strong> repair service1.1.13. Average resp<strong>on</strong>se time for LV supplyquotati<strong>on</strong>s1.1.14. Average time to c<strong>on</strong>nect a new LVcustomer to the network1.1.15. Average time to provide meter and supplyafter supply c<strong>on</strong>tract1.1.16. Average time to restore supply to a customerafter disc<strong>on</strong>necti<strong>on</strong>1.1.17. Number <strong>of</strong> billing complaints per 100customers1.1.18. Average service time in customer centres1.1.19. Number <strong>of</strong> fr<strong>on</strong>t <strong>of</strong>fice service positi<strong>on</strong>sper 1000 customers1.1.20. Number <strong>of</strong> back <strong>of</strong>fice service positi<strong>on</strong>sper 1000 customers1.1.21. Number <strong>of</strong> cashier positi<strong>on</strong>s per 1000customers1.1.22. Number <strong>of</strong> subc<strong>on</strong>tractors for collecti<strong>on</strong><strong>of</strong> bills per 1000 customers1.1.23. Total number <strong>of</strong> customer service positi<strong>on</strong>s(PPC&billing subc<strong>on</strong>tractors) per 1000customers1.1.24. Number <strong>of</strong> customer service centres per1000 customers (PPC <strong>on</strong>ly)Bg FlandersCzech Rep. Est<strong>on</strong>ia France Greece Hungary Ireland Italy Latvia Lithuania Portugal Slovenia UK Sum.DSOSp. DSO Sp. DSO Sp. DSO Sp. DSO Sp. DSO Sp. DSO Sp. DSO Sp. DSO Sp. DSO Sp. DSO Sp. DSO Sp. DSO Sp. DSO Sp. Both. Sum.X X X X XXX X4 2 1 7X XXX X4 1 0 5XX X X XXXXXXXXXXXX XX55330189XX X X X X X X X X X7 0 2 9X X XX XX X X4 0 2 6X X XX XXX3 0 2 5X XX X X XX X8 0 0 8XXXX X5 0 0 5X XX XXX X5 2 0 7XX XXXXX XXXXXXX565XXXXXXXX301001867XX X X X X X X X X8 0 1 9XX X X XX X7 0 0 7X X XX X X X X X X10 0 0 10XX X X XX XX3 3 1 7XXXX00001111X X0 0 1 1X X0 0 1 1X X0 0 1 1X X0 0 1 1X X0 0 1 1136Council <strong>of</strong> European Energy Regulators – Ref: C05-QOS-01-03
(CONTINUE) TABLE 3.2INDICATORS1.1.25. Number <strong>of</strong> service positi<strong>on</strong>s percustomer service centres (PPC <strong>on</strong>ly)1.1.26. Percentage <strong>of</strong> customers with waitingtime in customer centres lower than 20 minutes1.1.27. Percentage <strong>of</strong> customers with a time torestore supply after a fault lower than 4 hours1.1.28. Number <strong>of</strong> letters per 100 customers1.1.29. Average resp<strong>on</strong>se time for letters <strong>of</strong>clients1.1.30.Number <strong>of</strong> e-letters per 100 customers1.1.31. Average resp<strong>on</strong>se time for e-letters <strong>of</strong>clients1.1.32. 80/30 call centre quality1.1.33. Average time to fix billing problems(in case the customer has already paid thewr<strong>on</strong>g sum)1.1.34. Average time to executi<strong>on</strong> <strong>of</strong> simpleworks1.1.35. Average time to executi<strong>on</strong> <strong>of</strong> complexworks1.1.36. Appointment scheduling1.1.37. Period <strong>of</strong> time restoring <strong>of</strong> electricitysupply after disc<strong>on</strong>necti<strong>on</strong> for debts1.1.38. Period <strong>of</strong> time from notificati<strong>on</strong> to theplanned interrupti<strong>on</strong>1.1.39. Period <strong>of</strong> time during which the suppliercame to the c<strong>on</strong>sumer by his request due toproblems in metering1.1.40. Rightful complaints received by theregulator1.1.41. Number <strong>of</strong> complaints per 100customers voltage quality1.1.42. Number <strong>of</strong> complaints per 100customers: <strong>Quality</strong> <strong>of</strong> service by DSOSum.Bg FlandersCzech Rep. Est<strong>on</strong>ia France Greece Hungary Ireland Italy Latvia Lithuania Portugal Slovenia UK Sum.DSOSp. DSO Sp. DSO Sp. DSO Sp. DSO Sp. DSO Sp. DSO Sp. DSO Sp. DSO Sp. DSO Sp. DSO Sp. DSO Sp. DSO Sp. DSO Sp. Both. Sum.X X0 0 1 1X1 0 0 1X1 0 0 11111X X0 0 1 1X0 1 0 1X1 0 0 1X1 0 0 1X1 0 0 1X X2 0 0 2X1 0 0 1X1 0 0 10 0 1 1X1 0 0 1X1 0 0 13 0 6 0 6 10 7 0 13 12 9 9 12 1 11 7 16 0 7 0 19 0 15 0 1 0 105 19 21 149doesn't specify an informant The regulator gather the informati<strong>on</strong>137<str<strong>on</strong>g>Third</str<strong>on</strong>g> <str<strong>on</strong>g>Benchmarking</str<strong>on</strong>g> <str<strong>on</strong>g>Report</str<strong>on</strong>g> <strong>on</strong> <strong>Quality</strong> <strong>of</strong> <strong>Electricity</strong> <strong>Supply</strong> – 2005 · Annex 3B
TABLE 3.3.AINDICATORS2.1.1. Resp<strong>on</strong>ding to failure <strong>of</strong> supplier's fuse2.1.2. Restoring/ rec<strong>on</strong>necting supply2.1.3. C<strong>on</strong>necti<strong>on</strong> (supply and meter)2.1.4. Estimating Charges2.1.5. Notice <strong>of</strong> supply interrupti<strong>on</strong>2.1.6. Voltage complaints2.1.7. Meter problems2.1.8. Queries <strong>on</strong> charges and payments2.1.9. Appointments scheduling2.1.10. Payments notice under standards2.1.11. Prepayment meter fault2.1.12. Correcti<strong>on</strong> <strong>of</strong> voltage faults2.1.13. Visits to customers who required a meter move2.1.14. Number <strong>of</strong> meter readings within a year2.1.15. Resp<strong>on</strong>se to customers letters2.1.16. Resp<strong>on</strong>se to customers claims2.1.17. Executi<strong>on</strong> <strong>of</strong> simple works2.1.18. Deactivati<strong>on</strong> <strong>on</strong> customer's request2.1.19. Rec<strong>on</strong>necti<strong>on</strong> following lack <strong>of</strong> payment2.1.20. Estimating charges for complex works2.1.21. Executi<strong>on</strong> <strong>of</strong> complex works2.1.22. Accuracy <strong>of</strong> bills made <strong>on</strong> estimati<strong>on</strong>s2.1.23. Attendance in customers centres2.1.24. Attendance in teleph<strong>on</strong>e serviceAustriaDSO Sp.XXBg FlandersDSO Sp.XXXXXXXXXXXXBg Wall<strong>on</strong>iaDSO Sp.XXXXXXXXXXXXCzech Rep.DSO Sp.XXXXXXXXEst<strong>on</strong>iaDSO Sp.XXXXXXXXXXXXFranceDSO Sp.XXXXXXXXXXXXGreeceDSO Sp.XXXXXXXXHungaryDSO Sp.XXXXXXXXXXXXXXXXXIrelandDSO Sp.XXXXXXXXXXXXXItalyDSO Sp.XXXXXXXXXXXXXXXXXLatviaDSO Sp.XXXXXXXXXXX138Council <strong>of</strong> European Energy Regulators – Ref: C05-QOS-01-03
TABLE 3.3.CINDICATORS2.1.25. Resp<strong>on</strong>se to customers applicati<strong>on</strong> for a newc<strong>on</strong>necti<strong>on</strong> to the grid2.1.26. Feasibility study & design for new c<strong>on</strong>necti<strong>on</strong>s2.1.27. Disc<strong>on</strong>necti<strong>on</strong> following lack <strong>of</strong> payment forintegral tariffs customers n<strong>on</strong> Public Entities2.1.28. Disc<strong>on</strong>necti<strong>on</strong> following lack <strong>of</strong> payment foreligible customers, demanded by supplier2.1.29. Disc<strong>on</strong>necti<strong>on</strong> following lack <strong>of</strong> payment forPublic Entities2.1.30. Notifying anomalies or errors in applicati<strong>on</strong> <strong>of</strong>access to the distributi<strong>on</strong> network2.1.31. Rejecti<strong>on</strong> <strong>of</strong> applicati<strong>on</strong> <strong>of</strong> access to thedistributi<strong>on</strong> network2.1.32. Notificati<strong>on</strong> <strong>of</strong> finalisati<strong>on</strong> <strong>of</strong> power purchasec<strong>on</strong>tracts at low voltage between customer and supplier2.1.33. Reply to applicati<strong>on</strong>s to modify the c<strong>on</strong>tractingmethod from eligible c<strong>on</strong>sumers2.1.34. <strong>Quality</strong> supplies complaints2.1.35. Remove cases <strong>of</strong> n<strong>on</strong>-quality supplies2.1.36. Formulati<strong>on</strong> to requests for customer'snetworking2.1.37. Offer for c<strong>on</strong>necti<strong>on</strong>2.1.38. Max time <strong>of</strong> unplanned interrupti<strong>on</strong> <strong>on</strong> thec<strong>on</strong>necti<strong>on</strong> point2.1.39. Max summary <strong>of</strong> times <strong>of</strong> interrupti<strong>on</strong>s per year2.1.40. Max time <strong>of</strong> planned interrupti<strong>on</strong>2.1.41. Refund because <strong>of</strong> false billing2.1.42. Unjustifiable disc<strong>on</strong>necti<strong>on</strong>2.1.43. Number <strong>of</strong> justifed complaints per 1000customers (different for every supplier)2.1.44. Transmissi<strong>on</strong> <strong>of</strong> meter reading data to thesuppliers2.1.45. Change <strong>of</strong> supplier and/or ARP2.1.46. Meter works2.1.47. Refund Guarantee2.1.48. Independent Complaints ArbitratorSum.AustriaBg FlandersDSO Sp.DSO Sp.X3 0 12 0Bg Wall<strong>on</strong>ia Czech Rep. Est<strong>on</strong>ia France Greece Hungary Ireland Italy LatviaDSO Sp. DSO Sp. DSO Sp. DSO Sp. DSO Sp. DSO Sp. DSO Sp. DSO Sp. DSO Sp.X XXXXXXXXXX XXXXXXX104 11 0 13 3 12 0 8 2 14 7 16 0 14 3 11 0139<str<strong>on</strong>g>Third</str<strong>on</strong>g> <str<strong>on</strong>g>Benchmarking</str<strong>on</strong>g> <str<strong>on</strong>g>Report</str<strong>on</strong>g> <strong>on</strong> <strong>Quality</strong> <strong>of</strong> <strong>Electricity</strong> <strong>Supply</strong> – 2005 · Annex 3B
TABLE 3.3.BINDICATORS2.1.1.Resp<strong>on</strong>ding to failure <strong>of</strong> supplier's fuse2.1.2.Restoring/ rec<strong>on</strong>necting supply2.1.3.C<strong>on</strong>necti<strong>on</strong> (supply and meter)2.1.4.Estimating Charges2.1.5.Notice <strong>of</strong> supply interrupti<strong>on</strong>2.1.6.Voltage complaints2.1.7.Meter problems2.1.8.Queries <strong>on</strong> charges and payments2.1.9.Appointments scheduling2.1.10.Payments notice under standards2.1.11.Prepayment meter fault2.1.12.Correcti<strong>on</strong> <strong>of</strong> voltage faults2.1.13.Visits to customers who required a meter move2.1.14.Number <strong>of</strong> meter readings within a year2.1.15.Resp<strong>on</strong>se to customers letters2.1.16.Resp<strong>on</strong>se to customers claims2.1.17.Executi<strong>on</strong> <strong>of</strong> simple works2.1.18.Deactivati<strong>on</strong> <strong>on</strong> customer's request2.1.19.Rec<strong>on</strong>necti<strong>on</strong> following lack <strong>of</strong> payment2.1.20.Estimating charges for complex works2.1.21.Executi<strong>on</strong> <strong>of</strong> complex works2.1.22.Accuracy <strong>of</strong> bills made <strong>on</strong> estimati<strong>on</strong>s2.1.23.Attendance in customers centres2.1.24.Attendance in teleph<strong>on</strong>e serviceLithuania NorwayPoland Portugal Slovenia SpainUKDSO Sp. DSO Sp. DSO Sp. DSO Sp. DSO Sp. DSO Sp. DSO Sp.XXXXXXXXXXXXXXXXXXXXXXXXXXXXXX X XXXXXXXXXXXXXXXXXXXXX XX XXXXXXXXXXXXXXXSum.DSO Sp. Both Sum.9 0 0 916 0 0 1612 0 0 127 0 0 714 0 0 1411 0 0 1111 1 0 125 5 1 117 0 1 84 1 1 62 1 0 34 0 0 43 0 0 310 0 0 102 1 5 83 1 5 96 0 0 65 0 0 510 1 0 114 0 0 45 0 0 51 0 0 10 1 0 11 1 1 3140Council <strong>of</strong> European Energy Regulators – Ref: C05-QOS-01-03
TABLE 3.3.DINDICATORS2.1.25. Resp<strong>on</strong>se to customers applicati<strong>on</strong> for a newc<strong>on</strong>necti<strong>on</strong> to the grid2.1.26. Feasibility study & design for new c<strong>on</strong>necti<strong>on</strong>s2.1.27. Disc<strong>on</strong>necti<strong>on</strong> following lack <strong>of</strong> payment forintegral tariffs customers n<strong>on</strong> Public Entities2.1.28. Disc<strong>on</strong>necti<strong>on</strong> following lack <strong>of</strong> payment foreligible customers, demanded by supplier2.1.29. Disc<strong>on</strong>necti<strong>on</strong> following lack <strong>of</strong> payment forPublic Entities2.1.30. Notifying anomalies or errors in applicati<strong>on</strong> <strong>of</strong>access to the distributi<strong>on</strong> network2.1.31. Rejecti<strong>on</strong> <strong>of</strong> applicati<strong>on</strong> <strong>of</strong> access to thedistributi<strong>on</strong> network2.1.32. Notificati<strong>on</strong> <strong>of</strong> finalisati<strong>on</strong> <strong>of</strong> power purchasec<strong>on</strong>tracts at low voltage between customer and supplier2.1.33. Reply to applicati<strong>on</strong>s to modify the c<strong>on</strong>tractingmethod from eligible c<strong>on</strong>sumers2.1.34. <strong>Quality</strong> supplies complaints2.1.35. Remove cases <strong>of</strong> n<strong>on</strong>-quality supplies2.1.36. Formulati<strong>on</strong> to requests for customer'snetworking2.1.37. Offer for c<strong>on</strong>necti<strong>on</strong>2.1.38. Max time <strong>of</strong> unplanned interrupti<strong>on</strong> <strong>on</strong> thec<strong>on</strong>necti<strong>on</strong> point2.1.39. Max summary <strong>of</strong> times <strong>of</strong> interrupti<strong>on</strong>s per year2.1.40. Max time <strong>of</strong> planned interrupti<strong>on</strong>2.1.41. Refund because <strong>of</strong> false billing2.1.42. Unjustifiable disc<strong>on</strong>necti<strong>on</strong>2.1.43. Number <strong>of</strong> justifed complaints per 1000customers (different for every supplier)2.1.44. Transmissi<strong>on</strong> <strong>of</strong> meter reading data to thesuppliers2.1.45. Change <strong>of</strong> supplier and/or ARP2.1.46. Meter works2.1.47. Refund Guarantee2.1.48. Independent Complaints ArbitratorSum.Lithuania NorwayPoland Portugal Slovenia SpainUKDSO Sp. DSO Sp. DSO Sp. DSO Sp. DSO Sp. DSO Sp. DSO Sp.XXXXXXXX61 5 0 5 3 12 4 6 0 22 1 7 5Sum.DSO Sp. Both. Sum..1 0 0 10 0 1 11 0 0 11 0 0 11 0 0 11 0 0 11 0 0 10 0 1 11 0 0 11 0 0 11 0 0 11 0 0 11 0 0 11 0 0 11 0 0 11 0 0 10 1 0 10 0 1 10 1 0 11 0 0 10 1 0 11 0 0 11 0 0 11 0 0 1170 16 17 203141<str<strong>on</strong>g>Third</str<strong>on</strong>g> <str<strong>on</strong>g>Benchmarking</str<strong>on</strong>g> <str<strong>on</strong>g>Report</str<strong>on</strong>g> <strong>on</strong> <strong>Quality</strong> <strong>of</strong> <strong>Electricity</strong> <strong>Supply</strong> – 2005 · Annex 3B
TABLE 3.4INDICATORSAustriaBg Flanders Bg Wall<strong>on</strong>ia Czech Rep. Est<strong>on</strong>ia France Greece Hungary IrelandOS GS OS GS OS GS OS GS OS GS OS GS OS GS OS GS OS GS2.1.1. Resp<strong>on</strong>ding to failure <strong>of</strong> supplier's fuseXXXXXX2.1.2. Restoring/ rec<strong>on</strong>necting supplyXXXXXXXX2.1.3. C<strong>on</strong>necti<strong>on</strong> (supply and meter)XXXXXXXX2.1.4. Estimating ChargesXXXX2.1.5. Notice <strong>of</strong> supply interrupti<strong>on</strong>XXXXXXX2.1.6. Voltage complaintsXXXX2.1.7. Meter problemsXXXXX2.1.8. Queries <strong>on</strong> charges and paymentsXXXX2.1.9. Appointments schedulingXXXXX2.1.10. Payments notice under standardsXXX2.1.11. Prepayment meter faultX2.1.12. Correcti<strong>on</strong> <strong>of</strong> voltage faultsXXX2.1.13. Visits to customers who required a meter moveXX2.1.14. Number <strong>of</strong> meter readings within a yearXXXXX2.1.15. Resp<strong>on</strong>se to customers lettersXXXX2.1.16. Resp<strong>on</strong>se to customers claimsXXX2.1.17. Executi<strong>on</strong> <strong>of</strong> simple worksXXX2.1.18. Deactivati<strong>on</strong> <strong>on</strong> customer's requestXXXXX2.1.19. Rec<strong>on</strong>necti<strong>on</strong> following lack <strong>of</strong> paymentXXXXXXX2.1.20. Estimating charges for complex worksXX2.1.21. Executi<strong>on</strong> <strong>of</strong> complex worksXXX2.1.22. Accuracy <strong>of</strong> bills made <strong>on</strong> estimati<strong>on</strong>s2.1.23. Attendance in customers centres2.1.24. Attendance in teleph<strong>on</strong>e serviceXXXSum.2 012 0 012 089 02 12 12 8 9 13 7 15 174907213512142Council <strong>of</strong> European Energy Regulators – Ref: C05-QOS-01-03
Italy Latvia Lithuania Norway Poland Portugal Slovenia Spain Sweden UK Sum. IrelandOS GS OS GS OS GS OS GS OS GS OS GS OS GS OS GS OS GS OS GS OS GS Both.Sum..XXX0909XXXXXXXX511016XXXXXX39113X(MV)X(LV)XXX2518XXXXXXXX69015XXXXXX37010XXXXXX38011XXXXXXX29011XXX0808XXX1506XX1203X0404X2103XXXXXXX93012XXXX3508XXXXXX4509XXX2406X2406XXXXX48012X(MV)X(MV)X1214XX2305X0101X1001X400489011 1 5 2 3 051067 0 017 11 6 5 5 16 7 15 1 10 60 122 3 1851510010143<str<strong>on</strong>g>Third</str<strong>on</strong>g> <str<strong>on</strong>g>Benchmarking</str<strong>on</strong>g> <str<strong>on</strong>g>Report</str<strong>on</strong>g> <strong>on</strong> <strong>Quality</strong> <strong>of</strong> <strong>Electricity</strong> <strong>Supply</strong> – 2005 · Annex 3B
TABLE 3.6 ESTIMATING CHARGES (WORKING DAY)706050140120100working day403020806040euro10200Belgium Belgium France Hungary Hungary Ireland Ireland Italy dom. Italy Portugal Spain LV Spain LV Spain LV Spain Spain UK(Flanders) (Flanders)for simple for dom. cust. n<strong>on</strong>dom. cust. n<strong>on</strong>dom. LV supplies other other with MVHV MVHVfor simplec<strong>on</strong>n.c<strong>on</strong>n. withstudyc<strong>on</strong>n. complexc<strong>on</strong>n.cust.cust.withoutSubstati<strong>on</strong>Substati<strong>on</strong> (1-66kV) >66kV10 n.a. 15 n.a. 6 25 5 8 20 8. 15 65. 15 130 20 30 20 60 20 n.a. 5 30 10 30 30 30 40 30 60 30 15 60■ 2.1.4. Estimating Charges (working day) ■ Compensati<strong>on</strong> payments (euro)country0TABLE 3.7 ESTIMATING CHARGES FOR COMPLEX WORK (DAY)working day7060504030201014012010080604020euro0Belgium (Flanders)orienting studyBelgium (Flanders)detailed studyIrelandItalySpain 66kV021 n.a.42 n.a90 13056 n.a.40 3060 30* Calculated where figures were supplied in working days■ 2.1.20. Estimating charges for complex work (day*) ■ Compensati<strong>on</strong> payments (euro)country144Council <strong>of</strong> European Energy Regulators – Ref: C05-QOS-01-03
TABLE 3.8 EXECUTION OF SIMPLE WORKS (WORKING DAY)90140807060120100working day50403020806040euro10200Belgium(Flanders)15 n.a.France11 25Ireland dom.cust.3 65Irelandn<strong>on</strong>dom. cust.5 130Italy LVdom. cust.15 30Italy LV n<strong>on</strong>dom. cust.15 60Italy MV30 120Portugal LV20 n.a.Spain5 30Spain*30 30Spain**80 300Spain* with LV network expansi<strong>on</strong>Spain** with several transformator centre■ 2.1.17. Executi<strong>on</strong> <strong>of</strong> simple works (working day) ■ Compensati<strong>on</strong> payments (euro)countryTABLE 3.9 EXECUTION OF COMPLEX WORKS (WORKING DAY)working day90807060504030201070605040302010euro0Belgium(Wall<strong>on</strong>ia)IrelandItaly dom.cust.Italy LVItaly MVSpain < 66kVSpain > 66kV*045 n.a.60 6560 3060 6060 (**)80 30n.a. 30* deadlines determine in each case in line with importance <strong>of</strong> the work** For MV customers the standard is always OS■ 2.1.21. Executi<strong>on</strong> <strong>of</strong> complex works (working day) ■ Compensati<strong>on</strong> payments (euro)country145<str<strong>on</strong>g>Third</str<strong>on</strong>g> <str<strong>on</strong>g>Benchmarking</str<strong>on</strong>g> <str<strong>on</strong>g>Report</str<strong>on</strong>g> <strong>on</strong> <strong>Quality</strong> <strong>of</strong> <strong>Electricity</strong> <strong>Supply</strong> – 2005 · Annex 3B
TABLE 3.10 CONNECTING (SUPPLY AND METER) (WORKING DAY)353025350300250working day201510200150100euro5500Belgium(Flanders)for simplec<strong>on</strong>n.Belgium(Wall<strong>on</strong>ia)for HVc<strong>on</strong>n.Belgium Belgium(Wall<strong>on</strong>ia) (Wall<strong>on</strong>ia)for LVc<strong>on</strong>n.startup forLV&HVc<strong>on</strong>n.CzechRepublicLVCzechRepublicHV15 n.a. 20 n.a. 10 n.a. 3 n.a. 5 150 5 300France2 25Greecesimplec<strong>on</strong>necti<strong>on</strong>30 15Greecemeterinstallati<strong>on</strong>3 15Hungarydom.cust.8 8HungaryLV8 24HungaryHV8 60Irelanddom.cust.3 65Irelandn<strong>on</strong> dom.cust.5 130Italy LVdom.cust.5 30Italy LVn<strong>on</strong> dom.cust.5 60Italy MV7 120Latvia Lithuania Portugal3 n.a. 15 n.a. 2 n.a.Spain5 300Slovenia: c<strong>on</strong>necti<strong>on</strong> time is defined in c<strong>on</strong>necti<strong>on</strong> c<strong>on</strong>tract■ 2.1.3. C<strong>on</strong>necting (supply and meter) (working day) ■ Compensati<strong>on</strong> payments (euro)countryTABLE 3.11 RECONNECTION FOLLOWING LACK OF PAYMENT (WORKING DAY)8140working day765432120100806040euro1200CzechRepublicLV1 30CzechRepublicHV1 100Est<strong>on</strong>ia7 n.a.France1 n.a.Greece1 15Hungarydom.cust.1 20HungaryLV1 40HungaryMV1 120Ireland2 n.a.Italy LVdom.cust.1 30.Italy LVn<strong>on</strong> dom.cust.1 60Italy MV1 120Lithuanian<strong>on</strong> dom.cust.2 n.a.Lithuaniadom.cust.5 n.a.PortugalLV 11 15PortugalLV 21 25PortugalMV/HV0,3 75Spain Slovenia1 n.a. 1 300■ 2.1.19. Rec<strong>on</strong>necti<strong>on</strong> following lack <strong>of</strong> payment (working day) ■ Compensati<strong>on</strong> payments (euro)countryBelgium (Wall<strong>on</strong>ia): n.a., n.a.146Council <strong>of</strong> European Energy Regulators – Ref: C05-QOS-01-03
TABLE 3.12 AVERAGE RESPONSE TIME FOR LV SUPPLY QUOTATIONS (DAY)35302520day151050Est<strong>on</strong>ia16Hungary5.15Ireland13Italy11.11Latvia30Portugal7Slovenia I.8Slovenia II.*0■ 1.1.13. Average resp<strong>on</strong>se time for LV supply quotati<strong>on</strong>s (day)country* 0 means answer is given <strong>on</strong> the same dayTABLE 3.13 AVERAGE TIME TO CONNECT A NEW LV CUSTOMER TO THE NETWORK (DAY)14012010080day6040200Est<strong>on</strong>ia120Greece*25.96Greece**43.91Greece***72.16Hungary6.1Ireland119Italy*8.69Italy**44.67Latvia*60Latvia**120Lithuania17Portugal14Slovenia I. Slovenia II.1 3■ 1.1.14. Average time to c<strong>on</strong>nect a new LV customer to the network (day)countryGreece * Simple overhead c<strong>on</strong>necti<strong>on</strong> (2003)Greece ** Simple underground c<strong>on</strong>necti<strong>on</strong> (2003)Greece *** C<strong>on</strong>necti<strong>on</strong> involving expansi<strong>on</strong> <strong>on</strong> distributi<strong>on</strong> network (2003)Italy *Italy **Latvia *Latvia **simple c<strong>on</strong>necti<strong>on</strong>complex c<strong>on</strong>necti<strong>on</strong>simple c<strong>on</strong>necti<strong>on</strong>C<strong>on</strong>necti<strong>on</strong> involving expansi<strong>on</strong> <strong>on</strong> distributi<strong>on</strong> network147<str<strong>on</strong>g>Third</str<strong>on</strong>g> <str<strong>on</strong>g>Benchmarking</str<strong>on</strong>g> <str<strong>on</strong>g>Report</str<strong>on</strong>g> <strong>on</strong> <strong>Quality</strong> <strong>of</strong> <strong>Electricity</strong> <strong>Supply</strong> – 2005 · Annex 3B
TABLE 3.14 AVERAGE TIME TO PROVIDE METER AND SUPPLY AFTER SUPPLY CONTRACT (DAY)7654day3210Hungary1Ireland6.8Italy1.83Latvia3Portugal6Slovenia1■ 1.1.15. Average time to provide meter and supply after supply c<strong>on</strong>tract (day)countryTABLE 3.15 RESPONDING TO FAILURE OF SUPPLIER'S FUSE (HOUR)764035hour54323025201510euro150 0Czech France Greece Hungary Hungary Ireland Latvia**UK UKRepublicweekdays weekendweekdays weekend6 303 254 154 86 83 35 asap■ 2.1.1. Resp<strong>on</strong>ding to failure <strong>of</strong> supplier's fuse (hour) ■ Compensati<strong>on</strong> payments (euro)countryBelgium (Wall<strong>on</strong>ia): n.a./n.a.* area quality standards with authomatical penalties MV and HV figures are different** "ASAP" can not be put in the diagrammPortugalz<strong>on</strong>e A+B,LV 14 15Portugalz<strong>on</strong>e C,LV 25 15Portugalz<strong>on</strong>e A+B,LV 24 25Portugalz<strong>on</strong>e C,LV 15 253 304 30148Council <strong>of</strong> European Energy Regulators – Ref: C05-QOS-01-03
TABLE 3.16 AVERAGE TIME TO RESTORE SUPPLY TO A CUSTOMER AFTER DISCONNECTION (DAY)3,532,52day1,510,50Belgium(Flanders)0.015Est<strong>on</strong>ia0.8Hungary1Ireland2Italy0.72Latvia3Lithuania0.225Norway0.2Slovenia I.2Slovenia II.1■ 1.1.16. Average time to restore supply to a customer after disc<strong>on</strong>necti<strong>on</strong> (working day)countryTABLE 3.17 VOLTAGE COMPLAINTS (WORKING DAY)161412807060working day1086504030euro4220100Hungary Hungary Hungary Ireland Italy Latvia Portugal Portugal Portugal Slovenia UK0dom. cust.* LV* MV*LV 1LV 2MV/HV7 8 7 24 7 60 10 35 10 n.a. 10 n.a. 15 15 15 25. 15 75 5 n.a. 12 30Belgium: n.a./n.a.Norway: n.a./n.a.* A total <strong>of</strong> 20 w. day is provided for c<strong>on</strong>tacting, site supervis<strong>on</strong> and resp<strong>on</strong>se.■ 2.1.6. Voltage complaints (working day) ■ Compensati<strong>on</strong> payments (euro)country149<str<strong>on</strong>g>Third</str<strong>on</strong>g> <str<strong>on</strong>g>Benchmarking</str<strong>on</strong>g> <str<strong>on</strong>g>Report</str<strong>on</strong>g> <strong>on</strong> <strong>Quality</strong> <strong>of</strong> <strong>Electricity</strong> <strong>Supply</strong> – 2005 · Annex 3B
TABLE 3.18 METER PROBLEMS (WORKING DAY)1614140120working day1210864100806040euro2200 0Czech Est<strong>on</strong>iaHungary Hungary Italy LatviaPortugal Spain Spain UKRepublicLV MVMV/HV 100 kVA3 n.a.Ireland: n.a./n.a.Belgium(W)others7 n.a.10 155 n.a.Hungarydom.cust.10 2010 4010 12010 n.a.3 n.a.■ 2.1.7. Meter problems (working day) ■ Compensati<strong>on</strong> payments (euro)countryLithuanian<strong>on</strong> dom.cust.2 n.a.Lithuaniadom.cust.10 n.a.PortugalLV 115 15PortugalLV 215 2515 755 3015 305 30TABLE 3.19 CORRECTIONAL OF VOLTAGE FAILURE (MONTHS)m<strong>on</strong>ths131211109876543210Hungary dom. cust.12 20Hungary LV12 40Hungary MV12 120Ireland3 50140120100806040200euro■ 2.1.12. Correcti<strong>on</strong> <strong>of</strong> voltage failure (m<strong>on</strong>ths) ■ Compensati<strong>on</strong> payments (euro)countryBelgium (Wall<strong>on</strong>ia): n.a./n.a.Norway: n.a./n.a.150Council <strong>of</strong> European Energy Regulators – Ref: C05-QOS-01-03
TABLE 3.20 NOTICE OF SUPPLY INTERRUPTION (DAY BEFORE)1614350300day before1210864250200150100euro2500 0AustriaBelgium(Flanders)HVBelgium(Flanders)LVBelgium(Wall<strong>on</strong>ia)HVBelgium(Wall<strong>on</strong>ia)LVCzechRepublicLVCzechRepublicHVEst<strong>on</strong>iaHungarydom.cust.*HungaryLV*HungaryMV*Irelanddom.cust.*Irelandn<strong>on</strong> dom.cust.*LatviaLithuaniaPolandLVPolandMVPortugalSloveniaSpainUK UKdom. cust. n<strong>on</strong> dom.cust.2 n.a.5 n.a.2 n.a.10 n.a.2 n.a.15 15015 3002 n.a.8 208 408 1202 352 1305 n.a.10 05 3.85 381.5 n.a.2 n.a.1 302 302 60■ 2.1.5. Notice <strong>of</strong> supply interrupti<strong>on</strong> (day before) ■ Compensati<strong>on</strong> payments (euro)country*If expected durati<strong>on</strong> <strong>of</strong> interrupti<strong>on</strong> is less than 4 hours a 4 days prior notice is to be sent.Norway: n.a./n.a.TABLE 3.21 QUERIES ON CHARGES AND PAYMENTS (WORKING DAY)2520807060working day1510504030euro520100 0Belgium Czech Est<strong>on</strong>iaItaly Latvia Poland Portugal Portugal Portugal Spain Spain UK(Wall<strong>on</strong>ia) RepublicLV 1LV 2MV/HV
TABLE 3.22 RESPONSE TO CUSTOMER LETTERS (DAY)35 14030 12025 100day20 8015 60euro10 405 200Est<strong>on</strong>ia France Greece Hungary Hungary Hungary Italy Latvia Poland Portugal Sweden**0dom. cust. LV MV30 n.a. 8 25 14 15 15 20 15 40 15 120 28 n.a. 15 n.a. 14 0.57 21 n.a. 14 15* Calculated where figures were supplied in working days**Example <strong>of</strong> resp<strong>on</strong>se time guaranteed by <strong>on</strong>e company■ 2.1.15. Resp<strong>on</strong>se to customers letters (day*) ■ Compensati<strong>on</strong> payments (euro)countryTABLE 3.23 AVERAGE RESPONSE TIME TO CUSTOMER'S WRITTEN QUERIES (DAY)2018161412day1086420Est<strong>on</strong>ia7Hungary11Ireland3Italy DSO18Italy Supp.16.8Latvia15Portugal9Slovenia I.8Slovenia II.4■ 1.1.7. Average resp<strong>on</strong>se time to customer's written queries (day)country152Council <strong>of</strong> European Energy Regulators – Ref: C05-QOS-01-03
TABLE 3.25 APPOINTMENTS SCHEDULING (HOUR)4.543.53300250200hour2.52150euro1.510.5100500 0Czech France Greece Hungary Hungary Hungary IrelandItalyPortugal UKRepublicdom. cust. LV MVMVMV/HV1 152 253 154 404 804 2404 35■ 2.1.9. Appointments scheduling (hour) ■ Compensati<strong>on</strong> payments (euro)countryItalyLV dom.cust.3 30ItalyLV n<strong>on</strong>dom. cust.3 603 120PortugalLV 13 15PortugalLV 23 253 754 30TABLE 3.26ATTENDANCE IN CUSTOMERS CENTRES (MIN)Country2.1.23. Attendance in customerscentres (min)Compensati<strong>on</strong> payments (euro)Portugal 20** 90% <strong>of</strong> cases153<str<strong>on</strong>g>Third</str<strong>on</strong>g> <str<strong>on</strong>g>Benchmarking</str<strong>on</strong>g> <str<strong>on</strong>g>Report</str<strong>on</strong>g> <strong>on</strong> <strong>Quality</strong> <strong>of</strong> <strong>Electricity</strong> <strong>Supply</strong> – 2005 · Annex 3B
TABLE 3.27 AVERAGE WAITING TIME IN CUSTOMERS CENTRES (MIN)252015min1050Est<strong>on</strong>iaFrance*GreeceHungaryLatviaSlovenia I.Slovenia II.62112.517.610100■ 1.1.1. Averange waiting time in customer centres (min)countryFrance*In Questi<strong>on</strong>naire >20 min includedTABLE 3.29ATTENDANCE IN TELEPHONE CENTRES (SEC)Country2.1.24. Attendance in teleph<strong>on</strong>ecentres (sec)Compensati<strong>on</strong> payments (euro)France***Hungary*Ireland **Portugal*n.a.302060* in Hungary and in Portugal 80% <strong>of</strong> calls must be answered in this time interval** in Ireland 75 % <strong>of</strong> calls must be answered in this time time interval*** 95% must get a pers<strong>on</strong>al call (not recorded)154Council <strong>of</strong> European Energy Regulators – Ref: C05-QOS-01-03
TABLE 3.30 AVERAGE WAITING TIME IN CALL CENTRES (SEC)12010080sec6040200Est<strong>on</strong>ia40Hungary17Ireland27Italy100Latvia8Portugal11Slovenia I.104Slovenia II.69UK24■ 1.1.3. Average waiting time in call centres (sec)countryTABLE 3.31 RESPONSE TO CUSTOMERS CLAIMS (DAY)353025140120100day20158060euro10540200Est<strong>on</strong>ia France Hungary Hungary Hungary Italy Latvia Lithuania Poland Portugal* Spain Spain Sweden0dom. cust. LV MV
TABLE 3.32 NUMBER OF COMPLAINTS PER 100 CUSTOMERS76543210BelgiumHungaryIrelandItalyLatviaLithuaniaPortugalSlovenia I.Slovenia II.0.1356.1520.270.690.20.383.60.0070.001■ 1.1.5. Number <strong>of</strong> complaints per 100 customerscountryTABLE 3.33 AVERAGE RESPONSE TIME TO CUSTOMER'S COMPLAINTS (DAY)16141210day86420Est<strong>on</strong>iaIrelandItaly DSOItaly Supp.LatviaLithuaniaPortugalSlovenia I.Slovenia II.15512.9121511358■ 1.1.6. Average resp<strong>on</strong>se time to written customer's complaints (day)country156Council <strong>of</strong> European Energy Regulators – Ref: C05-QOS-01-03
TABLE 3.35 NUMBER OF METER READINGS WITHIN A YEAR14121086420Austriasmallcust.1 n.a.Austriabig cust.12 n.a.Belgium Belgium(Flanders)** (Flanders)**HV LV12 n.a. 1 n.a.France2 n.a.Hungary1 n.a.Ireland1 n.a.Italy1 n.a.Latvia1 n.a.Norway****1 n.a.Portugal1 n.a.Sloveniasmallcust.1 n.a.Sloveniabig cust.12 n.a.Spain2 n.a. 1Swedenn.a.Austria big cust.* >50 kW and >100.000 kWhBelgium (Flanders)** c<strong>on</strong>necti<strong>on</strong> >100 kVA c<strong>on</strong>tinuously (every 15 minutes)Belgium (Flanders)*** physically by DSO in every two yearsNorway****: 4, 6 or 12 times if >8000 kWh, hourly if >100000 kWh■ 2.1.14. Number <strong>of</strong> meter readings within a year ■ Compensati<strong>on</strong> payments (euro)countryTABLE 3.36 AVERAGE ANNUAL METER READINGS PER CUSTOMER FOR LV(carried out by the network operator)43.532.521.510.50Est<strong>on</strong>iaFranceHungaryIrelandLatviaPortugalSlovenia I.Slovenia II.1.891.861.423.721.31.82.31.9■ 1.1.8. Average annual meter readings per customer for LV (carried out by the network operator)country157<str<strong>on</strong>g>Third</str<strong>on</strong>g> <str<strong>on</strong>g>Benchmarking</str<strong>on</strong>g> <str<strong>on</strong>g>Report</str<strong>on</strong>g> <strong>on</strong> <strong>Quality</strong> <strong>of</strong> <strong>Electricity</strong> <strong>Supply</strong> – 2005 · Annex 3B
TABLE 3.38PREPAYMENT METER FAULT (WORKING DAY)CountryBelgium (Flanders)Spain
TABLE 3.41 NUMBER OF VISITS PER 100 CUSTOMERS IN CUSTOMERS CENTRES120100806040200Est<strong>on</strong>iaFranceLatviaSlovenia I.Slovenia II.55301129030■ 1.1.2. Number <strong>of</strong> visits per 100 customers in customer centrescountryTABLE 3.42 NUMBER OF CALLS PER 100 CUSTOMERS IN CALL CENTRES140120100806040200Est<strong>on</strong>iaFranceGreeceHungaryIrelandItalyLatviaPortugalSlovenia I.Slovenia II.11210018136.865241.880.63923■ 1.1.4. Number <strong>of</strong> calls per 100 customers in call centrescountry159<str<strong>on</strong>g>Third</str<strong>on</strong>g> <str<strong>on</strong>g>Benchmarking</str<strong>on</strong>g> <str<strong>on</strong>g>Report</str<strong>on</strong>g> <strong>on</strong> <strong>Quality</strong> <strong>of</strong> <strong>Electricity</strong> <strong>Supply</strong> – 2005 · Annex 3B
TABLE 3.43NUMBER OF REVISED BILLS PER 100 CUSTOMERSCountryEst<strong>on</strong>iaFranceItalyPortugalSlovenia I.Slovenia II.1.1.11. Number <strong>of</strong> revised bills per 100 customers0,490,80,15,21,20,01TABLE 3.44NUMBER OF BILLING COMPLAINTS PER 100 CUSTOMERSCountryEst<strong>on</strong>iaGreeceHungaryIrelandItalyPortugal1.1.17. Number <strong>of</strong> billing complaints per 100 customers0,160,004283,60,050,122,8TABLE 3.45ACCURACY OF BILLS MADE ON ESTIMATIONS (MONTHS)CountrySpain2.1.22. Accuracy <strong>of</strong> bills made <strong>on</strong> estimati<strong>on</strong>s(m<strong>on</strong>th)6Compensati<strong>on</strong> payments (euro)n.a.TABLE 3.46AVERAGE ANNUAL SELF METER READINGS PER CUSTOMER FOR LV(CARRIED OUT BY THE CUSTOMER)CountryFranceLatviaPortugalSlovenia I.Slovenia II.1.1.9. Average annual self meter readings per customer for LV(carried out by the customer)0,038,70,80,160,1160Council <strong>of</strong> European Energy Regulators – Ref: C05-QOS-01-03
TABLE 3.47 PERCENTAGE OF ESTIMATED BILLS (%)10090807060%50403020100Est<strong>on</strong>iaFranceHungaryIrelandPortugalSlovenia I.Slovenia II.12.353.488.12064.5940.58■ 1.1.10. Percentage <strong>of</strong> estimated bills (%)country161<str<strong>on</strong>g>Third</str<strong>on</strong>g> <str<strong>on</strong>g>Benchmarking</str<strong>on</strong>g> <str<strong>on</strong>g>Report</str<strong>on</strong>g> <strong>on</strong> <strong>Quality</strong> <strong>of</strong> <strong>Electricity</strong> <strong>Supply</strong> – 2005 · Annex 3B
ANNEX TO CHAPTER 4.ANNEX 4.1 Voltage quality standards different from EN 50160 applied in various European countriesCountryFluctuati<strong>on</strong>s <strong>of</strong>voltagemagnitudeRapid voltagechanges andflickerVoltagedipsTemporary ortransientovervoltagesVoltageunbalanceHarm<strong>on</strong>icdistorti<strong>on</strong> <strong>of</strong> thevoltagewaveformInterharm<strong>on</strong>icvoltagesMainssignallingvoltageCdcomp<strong>on</strong>entsFrance 19LV: +6/-10 % (decree)MV: U c=±5 % U n,U f=±5 % U cT: 63, 90 kV: U c=U n±6% U f=U c±8 %150 kV: U c=U n±7 %U f=U c±10 %225 kV: U c=200/245 kVU f=200/245 kV400 kV: U c=380/420 kVU f=380/430 kVEN50160Only voltage dipsdeeper than 30% andl<strong>on</strong>ger than 600 msare taken into accountMV: customizedc<strong>on</strong>tractual levelsdepending <strong>on</strong> the localc<strong>on</strong>diti<strong>on</strong>s <strong>on</strong> the site(cannot be lessthan 5 vd/y)T: customizedc<strong>on</strong>tractual levels(5vd/yLV, MV, T:P lt1(l<strong>on</strong>g term flicker)LV, MV, T:t vm2 %(average value <strong>of</strong>unbalance)MV: Rates <strong>of</strong>harm<strong>on</strong>ic voltages t hin % <strong>of</strong> U fand THDdo not rise above thethresholds <strong>of</strong> table 1T: Rates <strong>of</strong>harm<strong>on</strong>ic voltagestable 1LV, MV, T:n<strong>on</strong>eLV, MV, T:n<strong>on</strong>eLV, MV, T:n<strong>on</strong>eGreat Britain 20 +10% and -6% EN50160EN50160EN50160EN50160EN50160EN50160EN50160EN50160Hungary±7.5 %, max 115 %for 1 minute.EN50160EN50160EN50160EN50160EN50160EN50160EN50160EN50160NorwayRMS value in therange ±10% <strong>of</strong> U n.(mean value over 1min, in c<strong>on</strong>necti<strong>on</strong>points in LV net)Limits to the number<strong>of</strong> rapid voltagechanges table 2 andlimit to flicker severity<strong>on</strong> both Pst and Plttable 3The Norwegian WaterResources and EnergyDirectorate may orderto reduce voltage dipsNVE may order toreduce temporary ortransient overvoltages2 % in points c<strong>on</strong>necti<strong>on</strong>at all voltagelevels, measured as amean value over tenminutesLimits for individualharm<strong>on</strong>ics and THD;use <strong>of</strong> mean valuesover ten minutes, inc<strong>on</strong>necti<strong>on</strong> points;table 4The NorwegianWater Resourcesand EnergyDirectorate maystipulate limit valuesThe NorwegianWater Resourcesand EnergyDirectorate maystipulate limit valuesNo limit are set atpresentPortugalEN50160 (LV and MV).VHV, HV: <strong>Quality</strong> <strong>of</strong>service Code:U c=U n±7%U n21U f= U c±5%U cFlicker severity:- EN50160 for MVand LV.- Pst
TABLE 1: FRANCE: Rates <strong>of</strong> harm<strong>on</strong>ic voltagesMV NETWORKSOdd harm<strong>on</strong>icsNot multiples <strong>of</strong> 3 Multiples <strong>of</strong> 3Even harm<strong>on</strong>icsRankThresholds (%) Rank Thresholds (%) Rank Thresholds (%)5635227591,541113,515 and 210,56 to 240,513317219, 23, 251,5THD 8%HV NETWORKSOdd harm<strong>on</strong>icsNot multiples <strong>of</strong> 3 Multiples <strong>of</strong> 3Even harm<strong>on</strong>icsRankThresholds (%) Rank Thresholds (%) Rank Thresholds (%)5 and 723221,511 and 131,5914117 and 19115 and 210,56 to 240,523 and 250,7THD 3%164Council <strong>of</strong> European Energy Regulators – Ref: C05-QOS-01-03
TABLE 2: NORWAY: Flicker severity limits: network companies shall ensure thatflicker severity does not exceed the following values in points <strong>of</strong> c<strong>on</strong>necti<strong>on</strong> with therespective nominal voltage value, for the respective time intervals:Flicker severity index0,23 U N35 kV 35 kV < UN Time intervalShort-term flicker severity, P st[pu]1,21,095% <strong>of</strong> the weekL<strong>on</strong>g-term flicker severity, P lt[pu]1,00,8100% <strong>of</strong> the timeTABLE 3: NORWAY: rapid voltage changes: network companies shall ensure thatrapid voltage changes do not exceed the following values in points <strong>of</strong> c<strong>on</strong>necti<strong>on</strong> withthe respective nominal voltage value, for the respective frequency:Frequency <strong>of</strong> rapid voltage changesRapid voltage changes [%]0,23 U N35 kV 1 kV < U N1 change per 24hour periodUp to 24 changes per 24 hour periodMore than 24 changes per 24 hour period1053643165<str<strong>on</strong>g>Third</str<strong>on</strong>g> <str<strong>on</strong>g>Benchmarking</str<strong>on</strong>g> <str<strong>on</strong>g>Report</str<strong>on</strong>g> <strong>on</strong> <strong>Quality</strong> <strong>of</strong> <strong>Electricity</strong> <strong>Supply</strong> – 2005 · Annex 4
TABLE 4: NORWAY: Rates <strong>of</strong> individual harm<strong>on</strong>ic voltages (for both individual harm<strong>on</strong>ics and THD, the mean value over ten minutes has to be used in order to verify therespect <strong>of</strong> limits)NOMINAL VOLTAGE FROM AND INCLUDING 230 V UP TO AND INCLUDING 35 KVOdd harm<strong>on</strong>icsNot multiples <strong>of</strong> 3 Multiples <strong>of</strong> 3Even harm<strong>on</strong>icsOrder hU hOrder hU hOrder hU h5711131719, 23, 25> 256.0 %5.0 %3.5 %39> 95.0 %1.5 %0.5 %24> 43.0 %2.0 %1.5 %1.0 %THD 8% over ten minutes; THD 5% over <strong>on</strong>e week2.0 %1.0 %0.5 %NOMINAL VOLTAGE FROM 35 KV UP TO AND INCLUDING 245 KVOdd harm<strong>on</strong>icsNot multiples <strong>of</strong> 3 Multiples <strong>of</strong> 3Even harm<strong>on</strong>icsOrder hU hOrder hU hOrder hU h53.0 %33.0 %21.5 %7, 112.5 %91.5 %41.0 %13, 172.0 %15, 210.5 %60.5 %19, 231.5 %> 210.3 %> 60.3 %251.0 %> 250.5 %THD3 % over ten minutesNOMINAL VOLTAGE ABOVE 245 KVOdd harm<strong>on</strong>icsNot multiples <strong>of</strong> 3 Multiples <strong>of</strong> 3Even harm<strong>on</strong>icsOrder hU hOrder hU hOrder hU h5, 72.0 %32.0 %21.0 %11, 13, 17, 191.5 %91.0 %4, 60.5 %23, 251.0 %15, 210.5 %> 60.3 %> 250.5 %> 210.3 %THD3 % over ten minutes166Council <strong>of</strong> European Energy Regulators – Ref: C05-QOS-01-03
TABLE 5: PORTUGAL: for EHV and HV, under normal c<strong>on</strong>diti<strong>on</strong>s, during each period<strong>of</strong> <strong>on</strong>e week, 95% <strong>of</strong> the 10 min mean rms values <strong>of</strong> each individual harm<strong>on</strong>ic voltageshall be less than or equal to the following values:EHV AND HV NETWORKSOdd harm<strong>on</strong>icsNot multiples <strong>of</strong> 3Multiples <strong>of</strong> 3Even harm<strong>on</strong>icsOrder h hHVUh (%)HVhHVUh (%)HVhHVUh (%)HV54,53,033,02,021,61,573,02,091,11,041,01,0112,51,5150,30,360,50,5132,01,5210,20,280,40,4171,31,0>210,20,2100,40,4191,11,0120,20,2231,00,7>120,20,2251,00,7>250,2+12,5/h0,2+25/hTHD HV8%; THD EHV4%167<str<strong>on</strong>g>Third</str<strong>on</strong>g> <str<strong>on</strong>g>Benchmarking</str<strong>on</strong>g> <str<strong>on</strong>g>Report</str<strong>on</strong>g> <strong>on</strong> <strong>Quality</strong> <strong>of</strong> <strong>Electricity</strong> <strong>Supply</strong> – 2005 · Annex 4
Graphic design and Printed bye-Print Magyarország PLCH-1196 Budapest, Zalaegerszeg út 70.Ph<strong>on</strong>e: (+36-1) 299 2050Brochure layout: Bence GyergyákResp<strong>on</strong>sible manager: Ákos Oraveczwww.e-print.hu