Government & Corporate Bond Funds
Government & Corporate Bond Funds
Government & Corporate Bond Funds

Create successful ePaper yourself
Turn your PDF publications into a flip-book with our unique Google optimized e-Paper software.
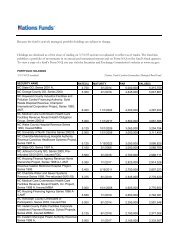
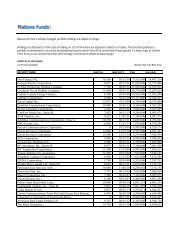
Nations Master Investment Trust<br />
Statements of changes in net assets<br />
Intermediate <strong>Bond</strong> High Yield <strong>Bond</strong><br />
Master Portfolio Master Portfolio<br />
Six months Six months<br />
ended ended<br />
9/30/02 Year ended 9/30/02 Year ended<br />
(unaudited) 3/31/02 (unaudited) 3/31/02<br />
(In thousands)<br />
Net investment income******************************** $ 9,909 $ 9,425 $ 18,471 $ 19,084<br />
Net realized gain/(loss) on investments******************* 8,548 (73) (1,763) 1,272<br />
Net change in unrealized appreciation/(depreciation) of<br />
investments *************************************** 26,433 (5,575) (55,548) (7,021)<br />
Net increase/(decrease) in net assets resulting from<br />
operations **************************************** 44,890 3,777 (38,840) 13,335<br />
Contributions *************************************** 607,765 314,639 365,170 356,998<br />
Withdrawals **************************************** (115,672) (100,895) (267,735) (139,663)<br />
Net increase/(decrease) in net assets ********************* 536,983 217,521 58,595 230,670<br />
Net assets:<br />
Beginning of period ********************************** 355,834 138,313 326,208 95,538<br />
End of period *************************************** $ 892,817 $ 355,834 $ 384,803 $ 326,208<br />
Financial highlights<br />
Without waivers<br />
and/or expense<br />
reimbursements<br />
Ratio of Ratio of net Ratio of<br />
operating investment operating<br />
expenses income/(loss) Portfolio expenses to<br />
Total to average to average turnover average<br />
return° net assets net assets rate net assets<br />
Intermediate <strong>Bond</strong> Master Portfolio:<br />
Six months ended 9/30/2002 (unaudited)*************** 7.98% 0.46%+(c)(d) 3.85%+ 68% 0.46%+(c)(d)<br />
Year ended 3/31/2002 ****************************** 4.33 0.49(c)(d) 5.24 228 0.49(c)(d)<br />
Year ended 3/31/2001 ****************************** — 0.45(c) 6.61 118 0.46(c)<br />
Period ended 3/31/2000***************************** — 0.54+ 6.10+ 90 0.55+<br />
Period ended 5/14/1999(a) ************************** — 0.38+ 5.61+ 19 0.42+<br />
Year ended 2/28/1999(a) **************************** — 0.35 5.69 137 0.45<br />
Year ended 2/28/1998(a) **************************** — 0.35 5.99 127 0.55<br />
High Yield <strong>Bond</strong> Master Portfolio:<br />
Six months ended 9/30/2002 (unaudited)*************** (9.08)% 0.62%+(c) 9.73%+ 31% 0.62%+(c)<br />
Year ended 3/31/2002 ****************************** 6.33 0.65(c)(d) 9.93 64 0.65(c)(d)<br />
Year ended 3/31/2001 ****************************** — 0.71 11.14 63 0.72<br />
Period ended 3/31/2000(b) ************************** — 2.82+ 5.16+ 26 2.86+<br />
+ Annualized.<br />
(a) Represents financial information for the Pacific Horizon Intermediate <strong>Bond</strong> Portfolio, which was reorganized into Intermediate <strong>Bond</strong> Master Portfolio<br />
on May 21, 1999.<br />
(b) High Yield <strong>Bond</strong> Master Portfolio commenced operations on February 14, 2000.<br />
(c) The effect of the custodial expense offset (Note 2) on the operating expense ratio, with and without waivers and/or expense reimbursements, was<br />
less than 0.01%.<br />
(d) The effect of interest expense on the operating expense ratio was less than 0.01%.<br />
° Total return for the Portfolio has been calculated based on the total return for the Feeder Fund adjusted for the applicable Feeder Fund expenses as<br />
set out in the notes to financial statements.<br />
See notes to financial statements.<br />
91