- Page 4:
M ETHODS IN M OLECULAR B IOLOGY TMB
- Page 10:
PrefaceThe recent accumulation of i
- Page 16:
xContents16. Analysis of Transposab
- Page 20:
xiiContributorsJOSHUA WING KEI HO
- Page 24:
Chapter 1Similarity Searching Using
- Page 28:
Similarity Searching Using BLAST 3F
- Page 32:
Similarity Searching Using BLAST 5m
- Page 36:
Similarity Searching Using BLAST 7F
- Page 40:
Similarity Searching Using BLAST 9i
- Page 44:
Similarity Searching Using BLAST 11
- Page 48:
Similarity Searching Using BLAST 13
- Page 54:
16 Menlove, Clement, and Crandallfa
- Page 58:
18 Menlove, Clement, and CrandallFi
- Page 62:
20 Menlove, Clement, and CrandallFi
- Page 68:
Chapter 2Gene Orthology Assessment
- Page 72:
Gene Orthology Assessment with Orth
- Page 80:
Gene Orthology Assessment with Orth
- Page 86:
32 Egan et al.Fig. 2.5. Screenshot
- Page 90:
34 Egan et al.Fig. 2.8. Screenshot
- Page 94:
36 Egan et al.and editing; and (5)
- Page 98:
38 Egan et al.9. Swofford, D. L. (2
- Page 102:
40 Katoh, Asimenos, and Tohmethods
- Page 106:
42 Katoh, Asimenos, and TohabcdeAll
- Page 110:
44 Katoh, Asimenos, and TohA1 A1’
- Page 114:
46 Katoh, Asimenos, and TohMAFFT ac
- Page 118:
48 Katoh, Asimenos, and Tohassuming
- Page 122:
50 Katoh, Asimenos, and Toh2.5. Out
- Page 126:
52 Katoh, Asimenos, and TohIn this
- Page 130:
54 Katoh, Asimenos, and Tohthe geno
- Page 134:
56 Katoh, Asimenos, and TohFragaria
- Page 138: 58 Katoh, Asimenos, and TohacDNAcDN
- Page 142: 60 Katoh, Asimenos, and TohA-B, B-C
- Page 146: 62 Katoh, Asimenos, and TohAcknowle
- Page 150: 64 Katoh, Asimenos, and Toh55. Rosh
- Page 154: 66 Jermiin et al.quantitatively (e.
- Page 158: 68 Jermiin et al.AjamCtubMtubPabrRm
- Page 162: 70 Jermiin et al.Carlo simulation i
- Page 166: 72 Jermiin et al.In the two-dimensi
- Page 170: 74 Jermiin et al.l Toggle between v
- Page 174: 76 Jermiin et al.GCATFig. 4.5. The
- Page 178: 78 Jermiin et al.AGBGCGTCTCTCAAAFig
- Page 184: SeqVis: Tool for Detecting Composit
- Page 188: SeqVis: Tool for Detecting Composit
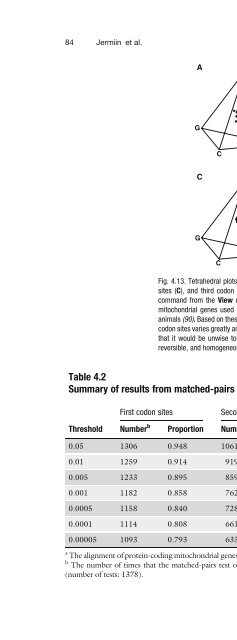
- Page 194: 86 Jermiin et al.3. Because the Cap
- Page 198: 88 Jermiin et al.construction. Syst
- Page 202: 90 Jermiin et al.69. Preparata, G.,
- Page 206: Chapter 5Selection of Models of DNA
- Page 210: Selection of Models of DNA Evolutio
- Page 214: Selection of Models of DNA Evolutio
- Page 218: Selection of Models of DNA Evolutio
- Page 222: Selection of Models of DNA Evolutio
- Page 226: Selection of Models of DNA Evolutio
- Page 230: Selection of Models of DNA Evolutio
- Page 234: Selection of Models of DNA Evolutio
- Page 238: Selection of Models of DNA Evolutio
- Page 242:
Selection of Models of DNA Evolutio
- Page 246:
Chapter 6Estimating Maximum Likelih
- Page 250:
Estimating Maximum Likelihood Phylo
- Page 254:
Estimating Maximum Likelihood Phylo
- Page 258:
Estimating Maximum Likelihood Phylo
- Page 262:
Estimating Maximum Likelihood Phylo
- Page 266:
Estimating Maximum Likelihood Phylo
- Page 270:
Estimating Maximum Likelihood Phylo
- Page 274:
Estimating Maximum Likelihood Phylo
- Page 278:
Estimating Maximum Likelihood Phylo
- Page 282:
Estimating Maximum Likelihood Phylo
- Page 286:
Estimating Maximum Likelihood Phylo
- Page 290:
Estimating Maximum Likelihood Phylo
- Page 294:
Estimating Maximum Likelihood Phylo
- Page 298:
140 Creevey and McInerneyFig. 7.1.
- Page 302:
142 Creevey and McInerneyapproach i
- Page 306:
144 Creevey and McInerneygenomes se
- Page 310:
146 Creevey and McInerneymore detai
- Page 314:
148 Creevey and McInerney2. Program
- Page 318:
150 Creevey and McInerneyFig. 7.5.
- Page 322:
152 Creevey and McInerneyFig. 7.8.
- Page 326:
154 Creevey and McInerneyFig. 7.10.
- Page 330:
156 Creevey and McInerneyFig. 7.12.
- Page 334:
158 Creevey and McInerneyThe second
- Page 338:
160 Creevey and McInerneygenomes: t
- Page 342:
Chapter 8Detecting Signatures of Se
- Page 346:
Detecting Signatures of Selection f
- Page 350:
Detecting Signatures of Selection f
- Page 354:
Detecting Signatures of Selection f
- Page 358:
Detecting Signatures of Selection f
- Page 362:
Detecting Signatures of Selection f
- Page 366:
Detecting Signatures of Selection f
- Page 370:
Detecting Signatures of Selection f
- Page 374:
Detecting Signatures of Selection f
- Page 378:
Detecting Signatures of Selection f
- Page 382:
Detecting Signatures of Selection f
- Page 386:
186 MartinAt its very core the dete
- Page 390:
188 MartinFig. 9.2. The General set
- Page 394:
190 MartinBOOTSCAN windows should b
- Page 398:
192 Martinreason is that RDP3 ident
- Page 402:
194 Martinthe other indicating a cl
- Page 406:
196 Martinunique recombination even
- Page 410:
198 Martin3. Examples3.1. Producing
- Page 414:
200 Martinpointer over the left mos
- Page 418:
202 MartinFig. 9.5. Comparing recom
- Page 422:
204 Martinphylogenetic trees that t
- Page 426:
Chapter 10CodonExplorer: An Interac
- Page 430:
CodonExplorer 209selection and muta
- Page 434:
CodonExplorer 211Example: Searching
- Page 438:
CodonExplorer 2132.2. Output Option
- Page 442:
CodonExplorer 215Fig. 10.7. Selecti
- Page 446:
CodonExplorer 217in each gene into
- Page 450:
CodonExplorer 219Fig. 10.8. The cod
- Page 454:
CodonExplorer 221between a subset o
- Page 458:
CodonExplorer 223pull-down menu. Se
- Page 462:
CodonExplorer 225Fig. 10.13. Finger
- Page 466:
CodonExplorer 227checkbox, the desi
- Page 470:
CodonExplorer 2294. For details on
- Page 474:
CodonExplorer 2314. Efstratiadis, A
- Page 478:
Chapter 11Genetic Code Prediction f
- Page 482:
Genetic Code Prediction for Metazoa
- Page 486:
Genetic Code Prediction for Metazoa
- Page 490:
Genetic Code Prediction for Metazoa
- Page 494:
Genetic Code Prediction for Metazoa
- Page 498:
Chapter 12Computational Gene Annota
- Page 502:
Computational Gene Annotation 245De
- Page 506:
Computational Gene Annotation 2473.
- Page 510:
Computational Gene Annotation 249in
- Page 514:
Computational Gene Annotation 2513.
- Page 518:
Computational Gene Annotation 253Fi
- Page 522:
Computational Gene Annotation 255Fi
- Page 526:
Computational Gene Annotation 257Fi
- Page 530:
Computational Gene Annotation 25910
- Page 534:
Computational Gene Annotation 26129
- Page 538:
264 Mariño-Ramírez et al.lower eu
- Page 542:
266 Mariño-Ramírez et al.The anne
- Page 546:
268 Mariño-Ramírez et al.Fig. 13.
- Page 550:
270 Mariño-Ramírez et al.$aglam
- Page 554:
272 Mariño-Ramírez et al.individu
- Page 558:
274 Mariño-Ramírez et al.Fig. 13.
- Page 562:
276 Mariño-Ramírez et al.Yamamoto
- Page 566:
278 PevsnerThere are currently thre
- Page 570:
280 PevsnerFig. 14.1. A portion of
- Page 574:
282 Pevsnerand sequencing tracks (a
- Page 578:
284 Pevsnerqueries). For DNA querie
- Page 582:
286 PevsnerFor the top entry having
- Page 586:
288 PevsnerFig. 14.6. The Table Bro
- Page 590:
290 PevsnerComparative Genomics; tr
- Page 594:
292 Pevsner5 0 -TCCTTGCCACGGGCCACCA
- Page 598:
294 Pevsnercan differ dramatically
- Page 602:
296 Pevsner(a)(b)(c)Fig. 14.10. Cre
- Page 606:
298 PevsnerView the custom tracks.
- Page 610:
300 PevsnerTrevanion, S., Ureta-Vid
- Page 614:
Chapter 15Mining for SNPs and SSRs
- Page 618:
Mining for SNPs and SSRs 305routine
- Page 622:
Mining for SNPs and SSRs 307remains
- Page 626:
Mining for SNPs and SSRs 3092.1. SN
- Page 630:
Mining for SNPs and SSRs 311GC cont
- Page 634:
Mining for SNPs and SSRs 313Fig. 15
- Page 638:
Mining for SNPs and SSRs 315Table 1
- Page 642:
Mining for SNPs and SSRs 317Fig. 15
- Page 646:
Mining for SNPs and SSRs 319all pol
- Page 650:
Mining for SNPs and SSRs 32127. Kat
- Page 654:
324 Huda and JordanTE-related seque
- Page 658:
326 Huda and Jordansequences (i.e.,
- Page 662:
328 Huda and Jordan2.1.5. Method CE
- Page 666:
330 Huda and JordanFig. 16.1. CENSO
- Page 670:
332 Huda and JordanFig. 16.4. CENSO
- Page 674:
334 Huda and JordanFig. 16.7. Repea
- Page 678:
336 Huda and JordanReferences1. Lan
- Page 682:
338 RozasDNA polymorphism informati
- Page 686:
340 Rozasplotted. In this section,
- Page 690:
342 RozasThe raggedness r statistic
- Page 694:
344 Rozasdistribution of D. This di
- Page 698:
346 Rozasempirical distribution of
- Page 702:
348 Rozas3. Nucleotide diversity ca
- Page 706:
350 Rozas12. Swofford, D. L. (1998)
- Page 710:
352BIOINFORMATICS FOR DNA SEQUENCE
- Page 714:
354BIOINFORMATICS FOR DNA SEQUENCE