- Page 4:
M ETHODS IN M OLECULAR B IOLOGY TMB
- Page 10:
PrefaceThe recent accumulation of i
- Page 16:
xContents16. Analysis of Transposab
- Page 20:
xiiContributorsJOSHUA WING KEI HO
- Page 24:
Chapter 1Similarity Searching Using
- Page 28:
Similarity Searching Using BLAST 3F
- Page 32:
Similarity Searching Using BLAST 5m
- Page 36:
Similarity Searching Using BLAST 7F
- Page 40:
Similarity Searching Using BLAST 9i
- Page 44:
Similarity Searching Using BLAST 11
- Page 48:
Similarity Searching Using BLAST 13
- Page 54:
16 Menlove, Clement, and Crandallfa
- Page 58:
18 Menlove, Clement, and CrandallFi
- Page 62:
20 Menlove, Clement, and CrandallFi
- Page 68:
Chapter 2Gene Orthology Assessment
- Page 72:
Gene Orthology Assessment with Orth
- Page 80:
Gene Orthology Assessment with Orth
- Page 86:
32 Egan et al.Fig. 2.5. Screenshot
- Page 90:
34 Egan et al.Fig. 2.8. Screenshot
- Page 94:
36 Egan et al.and editing; and (5)
- Page 98:
38 Egan et al.9. Swofford, D. L. (2
- Page 102:
40 Katoh, Asimenos, and Tohmethods
- Page 106:
42 Katoh, Asimenos, and TohabcdeAll
- Page 110:
44 Katoh, Asimenos, and TohA1 A1’
- Page 114:
46 Katoh, Asimenos, and TohMAFFT ac
- Page 118:
48 Katoh, Asimenos, and Tohassuming
- Page 122:
50 Katoh, Asimenos, and Toh2.5. Out
- Page 126:
52 Katoh, Asimenos, and TohIn this
- Page 130:
54 Katoh, Asimenos, and Tohthe geno
- Page 134:
56 Katoh, Asimenos, and TohFragaria
- Page 138:
58 Katoh, Asimenos, and TohacDNAcDN
- Page 142:
60 Katoh, Asimenos, and TohA-B, B-C
- Page 146:
62 Katoh, Asimenos, and TohAcknowle
- Page 150:
64 Katoh, Asimenos, and Toh55. Rosh
- Page 154:
66 Jermiin et al.quantitatively (e.
- Page 158:
68 Jermiin et al.AjamCtubMtubPabrRm
- Page 162:
70 Jermiin et al.Carlo simulation i
- Page 166:
72 Jermiin et al.In the two-dimensi
- Page 170:
74 Jermiin et al.l Toggle between v
- Page 174:
76 Jermiin et al.GCATFig. 4.5. The
- Page 178:
78 Jermiin et al.AGBGCGTCTCTCAAAFig
- Page 184:
SeqVis: Tool for Detecting Composit
- Page 188:
SeqVis: Tool for Detecting Composit
- Page 192:
SeqVis: Tool for Detecting Composit
- Page 196:
SeqVis: Tool for Detecting Composit
- Page 200:
SeqVis: Tool for Detecting Composit
- Page 204:
SeqVis: Tool for Detecting Composit
- Page 208:
94 Posada(1, 2). In addition, measu
- Page 212:
96 Posadamaximizes a significant ga
- Page 216:
98 Posadaaveraging or multimodel in
- Page 220:
100 PosadaTable 5.1(continued)Model
- Page 224:
102 PosadaFig. 5.5. AIC panel. This
- Page 228:
104 PosadaFig. 5.9. Likelihood calc
- Page 232:
106 PosadaFig. 5.11. AIC selection
- Page 236:
108 PosadaFig. 5.13. AIC model-aver
- Page 240:
110 Posadaunder a maximum likelihoo
- Page 244:
112 Posadathe finite corrections. C
- Page 248:
114 Guindon et al.and MAP, both rel
- Page 252:
116 Guindon et al.compared to the p
- Page 256:
118 Guindon et al.100/1.0099/0.9875
- Page 260:
120 Guindon et al.that some options
- Page 264:
122 Guindon et al.Table 6.2List of
- Page 268:
124 Guindon et al.string ‘‘0100
- Page 272:
126 Guindon et al.likelihood functi
- Page 276:
128 Guindon et al.the earliest dive
- Page 280:
130 Guindon et al.Fig. 6.4. ML phyl
- Page 284:
132 Guindon et al.Fig. 6.5. ML phyl
- Page 288:
134 Guindon et al.also have aLRT va
- Page 292:
136 Guindon et al.References1. Fels
- Page 296:
Chapter 7Trees from Trees: Construc
- Page 300:
Construction of Phylogenetic Supert
- Page 304:
Construction of Phylogenetic Supert
- Page 308:
Construction of Phylogenetic Supert
- Page 312:
Construction of Phylogenetic Supert
- Page 316:
Construction of Phylogenetic Supert
- Page 320:
Construction of Phylogenetic Supert
- Page 324:
Construction of Phylogenetic Supert
- Page 328:
Construction of Phylogenetic Supert
- Page 332:
Construction of Phylogenetic Supert
- Page 336:
Construction of Phylogenetic Supert
- Page 340:
Construction of Phylogenetic Supert
- Page 344:
164 Poon, Frost, and Kosakovsky Pon
- Page 348:
166 Poon, Frost, and Kosakovsky Pon
- Page 352:
168 Poon, Frost, and Kosakovsky Pon
- Page 356:
170 Poon, Frost, and Kosakovsky Pon
- Page 360:
1510-5-10-15-20-25-305:12TREESPARRO
- Page 364:
174 Poon, Frost, and Kosakovsky Pon
- Page 368:
176 Poon, Frost, and Kosakovsky Pon
- Page 372:
178 Poon, Frost, and Kosakovsky Pon
- Page 376:
180 Poon, Frost, and Kosakovsky Pon
- Page 380:
182 Poon, Frost, and Kosakovsky Pon
- Page 384:
Chapter 9Recombination Detection an
- Page 388:
Recombination Detection and Analysi
- Page 392:
Recombination Detection and Analysi
- Page 396: Recombination Detection and Analysi
- Page 400: Recombination Detection and Analysi
- Page 404: Recombination Detection and Analysi
- Page 408: Recombination Detection and Analysi
- Page 412: Recombination Detection and Analysi
- Page 416: Recombination Detection and Analysi
- Page 420: Recombination Detection and Analysi
- Page 424: Recombination Detection and Analysi
- Page 428: 208 Zaneveld et al.equivalent state
- Page 432: 210 Zaneveld et al.the NCBI taxonom
- Page 436: 212 Zaneveld et al.Example: To sele
- Page 440: 214 Zaneveld et al.Fig. 10.6. ‘
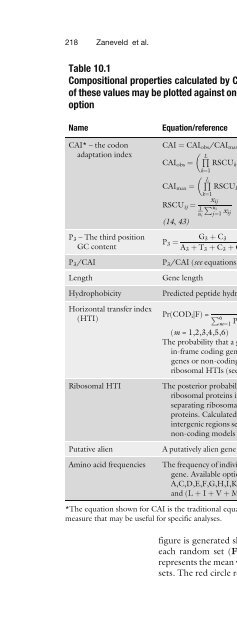
- Page 444: 216 Zaneveld et al.(but see Note 14
- Page 450: CodonExplorer 219Fig. 10.8. The cod
- Page 454: CodonExplorer 221between a subset o
- Page 458: CodonExplorer 223pull-down menu. Se
- Page 462: CodonExplorer 225Fig. 10.13. Finger
- Page 466: CodonExplorer 227checkbox, the desi
- Page 470: CodonExplorer 2294. For details on
- Page 474: CodonExplorer 2314. Efstratiadis, A
- Page 478: Chapter 11Genetic Code Prediction f
- Page 482: Genetic Code Prediction for Metazoa
- Page 486: Genetic Code Prediction for Metazoa
- Page 490: Genetic Code Prediction for Metazoa
- Page 494: Genetic Code Prediction for Metazoa
- Page 498:
Chapter 12Computational Gene Annota
- Page 502:
Computational Gene Annotation 245De
- Page 506:
Computational Gene Annotation 2473.
- Page 510:
Computational Gene Annotation 249in
- Page 514:
Computational Gene Annotation 2513.
- Page 518:
Computational Gene Annotation 253Fi
- Page 522:
Computational Gene Annotation 255Fi
- Page 526:
Computational Gene Annotation 257Fi
- Page 530:
Computational Gene Annotation 25910
- Page 534:
Computational Gene Annotation 26129
- Page 538:
264 Mariño-Ramírez et al.lower eu
- Page 542:
266 Mariño-Ramírez et al.The anne
- Page 546:
268 Mariño-Ramírez et al.Fig. 13.
- Page 550:
270 Mariño-Ramírez et al.$aglam
- Page 554:
272 Mariño-Ramírez et al.individu
- Page 558:
274 Mariño-Ramírez et al.Fig. 13.
- Page 562:
276 Mariño-Ramírez et al.Yamamoto
- Page 566:
278 PevsnerThere are currently thre
- Page 570:
280 PevsnerFig. 14.1. A portion of
- Page 574:
282 Pevsnerand sequencing tracks (a
- Page 578:
284 Pevsnerqueries). For DNA querie
- Page 582:
286 PevsnerFor the top entry having
- Page 586:
288 PevsnerFig. 14.6. The Table Bro
- Page 590:
290 PevsnerComparative Genomics; tr
- Page 594:
292 Pevsner5 0 -TCCTTGCCACGGGCCACCA
- Page 598:
294 Pevsnercan differ dramatically
- Page 602:
296 Pevsner(a)(b)(c)Fig. 14.10. Cre
- Page 606:
298 PevsnerView the custom tracks.
- Page 610:
300 PevsnerTrevanion, S., Ureta-Vid
- Page 614:
Chapter 15Mining for SNPs and SSRs
- Page 618:
Mining for SNPs and SSRs 305routine
- Page 622:
Mining for SNPs and SSRs 307remains
- Page 626:
Mining for SNPs and SSRs 3092.1. SN
- Page 630:
Mining for SNPs and SSRs 311GC cont
- Page 634:
Mining for SNPs and SSRs 313Fig. 15
- Page 638:
Mining for SNPs and SSRs 315Table 1
- Page 642:
Mining for SNPs and SSRs 317Fig. 15
- Page 646:
Mining for SNPs and SSRs 319all pol
- Page 650:
Mining for SNPs and SSRs 32127. Kat
- Page 654:
324 Huda and JordanTE-related seque
- Page 658:
326 Huda and Jordansequences (i.e.,
- Page 662:
328 Huda and Jordan2.1.5. Method CE
- Page 666:
330 Huda and JordanFig. 16.1. CENSO
- Page 670:
332 Huda and JordanFig. 16.4. CENSO
- Page 674:
334 Huda and JordanFig. 16.7. Repea
- Page 678:
336 Huda and JordanReferences1. Lan
- Page 682:
338 RozasDNA polymorphism informati
- Page 686:
340 Rozasplotted. In this section,
- Page 690:
342 RozasThe raggedness r statistic
- Page 694:
344 Rozasdistribution of D. This di
- Page 698:
346 Rozasempirical distribution of
- Page 702:
348 Rozas3. Nucleotide diversity ca
- Page 706:
350 Rozas12. Swofford, D. L. (1998)
- Page 710:
352BIOINFORMATICS FOR DNA SEQUENCE
- Page 714:
354BIOINFORMATICS FOR DNA SEQUENCE