BIRD POPULATIONS - Birdpop.org
BIRD POPULATIONS - Birdpop.org
BIRD POPULATIONS - Birdpop.org
- No tags were found...

Create successful ePaper yourself
Turn your PDF publications into a flip-book with our unique Google optimized e-Paper software.
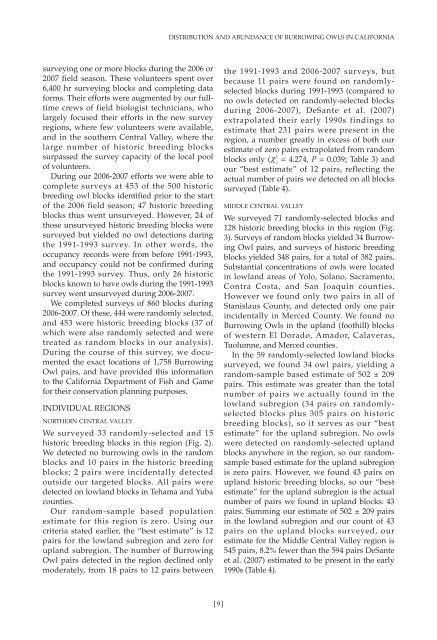
DISTRIBUTION AND ABUNDANCE OF BURROWING OWLS IN CALIFORNIAsurveying one or more blocks during the 2006 or2007 field season. These volunteers spent over6,400 hr surveying blocks and completing dataforms. Their efforts were augmented by our fulltimecrews of field biologist technicians, wholargely focused their efforts in the new surveyregions, where few volunteers were available,and in the southern Central Valley, where thelarge number of historic breeding blockssurpassed the survey capacity of the local poolof volunteers.During our 2006-2007 efforts we were able tocomplete surveys at 453 of the 500 historicbreeding owl blocks identified prior to the startof the 2006 field season; 47 historic breedingblocks thus went unsurveyed. However, 24 ofthose unsurveyed historic breeding blocks weresurveyed but yielded no owl detections duringthe 1991-1993 survey. In other words, theoccupancy records were from before 1991-1993,and occupancy could not be confirmed duringthe 1991-1993 survey. Thus, only 26 historicblocks known to have owls during the 1991-1993survey went unsurveyed during 2006-2007.We completed surveys of 860 blocks during2006-2007. Of these, 444 were randomly selected,and 453 were historic breeding blocks (37 ofwhich were also randomly selected and weretreated as random blocks in our analysis).During the course of this survey, we documentedthe exact locations of 1,758 BurrowingOwl pairs, and have provided this informationto the California Department of Fish and Gamefor their conservation planning purposes.INDIVIDUAL REGIONSNORTHERN CENTRAL VALLEYWe surveyed 33 randomly-selected and 15historic breeding blocks in this region (Fig. 2).We detected no burrowing owls in the randomblocks and 10 pairs in the historic breedingblocks; 2 pairs were incidentally detectedoutside our targeted blocks. All pairs weredetected on lowland blocks in Tehama and Yubacounties.Our random-sample based populationestimate for this region is zero. Using ourcriteria stated earlier, the “best estimate” is 12pairs for the lowland subregion and zero forupland subregion. The number of BurrowingOwl pairs detected in the region declined onlymoderately, from 18 pairs to 12 pairs betweenthe 1991-1993 and 2006-2007 surveys, butbecause 11 pairs were found on randomlyselectedblocks during 1991-1993 (compared tono owls detected on randomly-selected blocksduring 2006-2007), DeSante et al. (2007)extrapolated their early 1990s findings toestimate that 231 pairs were present in theregion, a number greatly in excess of both ourestimate of zero pairs extrapolated from randomblocks only (χ 2 = 4.274, P = 0.039; Table 3) and1our “best estimate” of 12 pairs, reflecting theactual number of pairs we detected on all blockssurveyed (Table 4).MIDDLE CENTRAL VALLEYWe surveyed 71 randomly-selected blocks and128 historic breeding blocks in this region (Fig.3). Surveys of random blocks yielded 34 BurrowingOwl pairs, and surveys of historic breedingblocks yielded 348 pairs, for a total of 382 pairs.Substantial concentrations of owls were locatedin lowland areas of Yolo, Solano, Sacramento,Contra Costa, and San Joaquin counties.However we found only two pairs in all ofStanislaus County, and detected only one pairincidentally in Merced County. We found noBurrowing Owls in the upland (foothill) blocksof western El Dorado, Amador, Calaveras,Tuolumne, and Merced counties.In the 59 randomly-selected lowland blockssurveyed, we found 34 owl pairs, yielding arandom-sample based estimate of 502 ± 209pairs. This estimate was greater than the totalnumber of pairs we actually found in thelowland subregion (34 pairs on randomlyselectedblocks plus 305 pairs on historicbreeding blocks), so it serves as our “bestestimate” for the upland subregion. No owlswere detected on randomly-selected uplandblocks anywhere in the region, so our randomsamplebased estimate for the upland subregionis zero pairs. However, we found 43 pairs onupland historic breeding blocks, so our “bestestimate” for the upland subregion is the actualnumber of pairs we found in upland blocks: 43pairs. Summing our estimate of 502 ± 209 pairsin the lowland subregion and our count of 43pairs on the upland blocks surveyed, ourestimate for the Middle Central Valley region is545 pairs, 8.2% fewer than the 594 pairs DeSanteet al. (2007) estimated to be present in the early1990s (Table 4).[9]