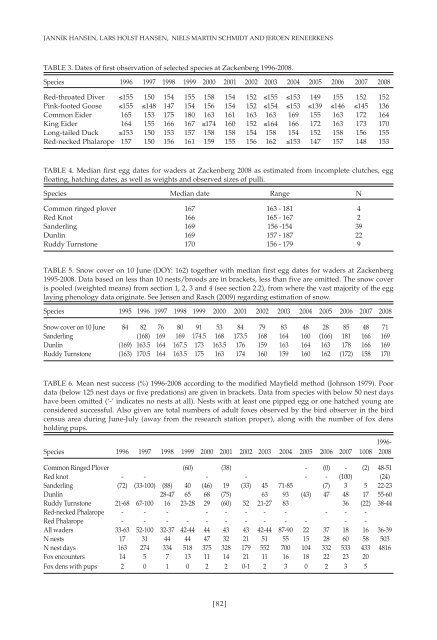
JANNIK HANSEN, LARS HOLST HANSEN, NIELS MARTIN SCHMIDT AND JEROEN RENEERKENSTABLE 3. Dates of first observation of selected species at Zackenberg 1996-2008.Species 1996 1997 1998 1999 2000 2001 2002 2003 2004 2005 2006 2007 2008Red-throated Diver ≤155 150 154 155 158 154 152 ≤155 ≤153 149 155 152 152Pink-footed Goose ≤155 ≤148 147 154 156 154 152 ≤154 ≤153 ≤139 ≤146 ≤145 136Common Eider 165 153 175 180 163 161 163 163 169 155 163 172 164King Eider 164 155 166 167 ≤174 160 152 ≤164 166 172 163 173 170Long-tailed Duck ≤153 150 153 157 158 158 154 158 154 152 158 156 155Red-necked Phalarope 157 150 156 161 159 155 156 162 ≤153 147 157 148 153TABLE 4. Median first egg dates for waders at Zackenberg 2008 as estimated from incomplete clutches, eggfloating, hatching dates, as well as weights and observed sizes of pulli.Species Median date Range NCommon ringed plover 167 163 - 181 4Red Knot 166 165 - 167 2Sanderling 169 156 -154 39Dunlin 169 157 - 187 22Ruddy Turnstone 170 156 - 179 9TABLE 5. Snow cover on 10 June (DOY: 162) together with median first egg dates for waders at Zackenberg1995-2008. Data based on less than 10 nests/broods are in brackets, less than five are omitted. The snow coveris pooled (weighted means) from section 1, 2, 3 and 4 (see section 2.2), from where the vast majority of the egglaying phenology data originate. See Jensen and Rasch (2009) regarding estimation of snow.Species 1995 1996 1997 1998 1999 2000 2001 2002 2003 2004 2005 2006 2007 2008Snow cover on 10 June 84 82 76 80 91 53 84 79 83 48 28 85 48 71Sanderling (168) 169 169 174.5 168 173.5 168 164 160 (166) 181 166 169Dunlin (169) 163.5 164 167.5 173 163.5 176 159 163 164 163 178 166 169Ruddy Turnstone (163) 170.5 164 163.5 175 163 174 160 159 160 162 (172) 158 170TABLE 6. Mean nest success (%) 1996-2008 according to the modified Mayfield method (Johnson 1979). Poordata (below 125 nest days or five predations) are given in brackets. Data from species with below 50 nest dayshave been omitted (‘-’ indicates no nests at all). Nests with at least one pipped egg or one hatched young areconsidered successful. Also given are total numbers of adult foxes observed by the bird observer in the birdcensus area during June-July (away from the research station proper), along with the number of fox densholding pups.1996-Species 1996 1997 1998 1999 2000 2001 2002 2003 2004 2005 2006 2007 1008 2008Common Ringed Plover (60) (38) - (0) - (2) 48-51Red knot - - - - - - (100) (24)Sanderling (72) (33-100) (88) 40 (46) 19 (33) 45 71-85 (7) 3 5 22-23Dunlin 28-47 65 68 (75) 63 93 (43) 47 48 17 55-60Ruddy Turnstone 21-68 67-100 16 23-28 29 (60) 52 21-27 83 36 (22) 38-44Red-necked Phalarope - - - - - - - - - - -Red Phalarope - - - - - - - - - - - -All waders 33-63 52-100 32-37 42-44 44 43 43 42-44 87-90 22 37 18 16 36-39N nests 17 31 44 44 47 32 21 51 55 15 28 60 58 503N nest days 163 274 334 518 375 328 179 552 700 104 332 533 433 4816Fox encounters 14 5 7 13 11 14 21 11 16 18 22 23 20Fox dens with pups 2 0 1 0 2 2 0-1 2 3 0 2 3 5[82]
ZACKENBERG <strong>BIRD</strong>S 2008parents of Common Ringed Plovers, Red Knots,Sanderlings, Dunlins, and turnstones – and laterjuveniles – were found in the fens and marshes(dunlins), on the slopes of Aucellabjerg and inthe dry lowlands.Data on chick survival is scarce, but as earlyas 11 June, flocks of up to 10 individuals ofLong-tailed Skuas roamed the lower slopes ofAucellabjerg and the lowlands, which mostlikely have asserted a significant predationpressure on the chicks.REPRODUCTIVE PHENOLOGY AND SUCCESSIN LONG-TAILED SKUASEight (i.e. 80 %) of the Long-tailed Skua nestswere initiated prior to the census period. Interms of nest initiation, this season was aroundaverage (Table 8), and in the census area onlytwo nests were initiated after 20 June (DOY:172).Only one collared lemming (Dicrostonyxgroenlandicus) observation was made by thechief bird observer (J. Hansen), reflecting aseason with few lemmings (Table 8) – the mainfood resource for Arctic fox and Long-tailedSkua. The average clutch size was 1.6 eggs pernest. Only 5 chicks hatched. Nest success forLong-tailed Skuas was well below average(average nest success 1996-2007: 55%; Table 8).Most hatched chicks are thought to havesuffered predation; only two are thought tohave survived. The last observation was of ajuvenile (accompanied by an adult) on 13August (DOY: 226). This young bird was likelyto be 40 days old.BARNACLE GEESEThe Barnacle Goose (Branta leucopsis) colony onthe southern face of the mountain Zackenbergfjeldetwas active with at least three pairs.The colony was first found in 1964, andthereafter revisited and found still in use in 2005and 2006 (Hansen et al. 2008).The first families with goslings were seen on 9July. The number of broods was 15 (Table 9), andthe maximum number of goslings seen at onetime was 18.The mean brood size was high until mid July,but ended on a just 1 gosling per brood in earlyAugust (Table 9). From Isle of Islay, WesternScotland, it was reported that the percentage ofyoung in the flocks arriving to their winteringquarters was 8.2 (Table 9; M. Ogilvie, pers.comm.).In 2008, immature Barnacle Geese moulted innumbers well above average (1995-2007average: 196; Table 10).COMMON <strong>BIRD</strong>, NOT BREEDINGIN THE CENSUS AREAA total of 1,181 individual immature PinkfootedGeese (Anser brachyrhynchus) wereobserved migrating over Zackenbergdalennorthwards towards their moulting areas. Onlytwo immature Pink-footed Geese were foundmoulting at Zackenberg this year (Table 11).On 12 June (DOY: 164), the first CommonEider (Somateria mollissima) was seen on Lomsø(a female). In the following weeks pairs andsmaller flocks were seen regularly, but at notime more than ten individuals. Ten young –possibly from the Daneb<strong>org</strong> or Sandøen colonies(c. 30-35 km west of Zackenberg) – wererecorded with an adult female in the formerdelta, on 18 July (DOY: 200). The last adult malewas seen on 23 July (DOY: 205). The 63 adultsand three pulli seen at a sandy spit at the formerdelta on 29 July (DOY: 211) was the largest flockof the season. At Daneb<strong>org</strong>, the Common Eidercolony between the dog pens was once againTABLE 7. Mean clutch sizes in waders at Zackenberg 1995-2008. Samples of fewer than five clutches are givenin brackets.Species 1995 1996 1997 1998 1999 2000 2001 2002 2003 2004 2005 2006 2007 2008 MeanCommon Ringed Plover (4.00) (4.00) (3.50) (4.00) (3.50) (4.00) (3.50) (4.00) (4.00) (4.00) (3.75) (3.75) 3.83Red knot (4.00) (4.00) (4.00) (4.00) (4.00) (4.00) (4.00) 4.00Sanderling (4.00) 4.00 3.86 4.00 3.67 4.00 3.43 3.83 4.00 4.00 3.75 3.63 3.73 3.77 3.83Dunlin (4.00) (3.75) 3.90 3.70 3.93 3.63 (4.00) 4.00 3.92 4.00 3.13 3.79 3.67 3.80Ruddy Turnstone 3.71 3.79 3.82 3.58 3.80 3.75 4.00 3.77 3.92 3.86 (3.00) (4.00) 3.71 3.75Average 4.00 3.93 3.73 3.94 3.69 3.93 3.66 3.96 3.95 3.97 3.87 3.38 3.88 3.73 3.83[83]
- Page 1 and 2:
BIRD POPULATIONSA journal of global
- Page 3 and 4:
BIRD POPULATIONSA journal of global
- Page 6 and 7:
ROBERT L. WILKERSON AND RODNEY B. S
- Page 8 and 9:
ROBERT L. WILKERSON AND RODNEY B. S
- Page 10 and 11:
ROBERT L. WILKERSON AND RODNEY B. S
- Page 12 and 13:
ROBERT L. WILKERSON AND RODNEY B. S
- Page 14 and 15:
ROBERT L. WILKERSON AND RODNEY B. S
- Page 16 and 17:
ROBERT L. WILKERSON AND RODNEY B. S
- Page 18 and 19:
ROBERT L. WILKERSON AND RODNEY B. S
- Page 20 and 21:
ROBERT L. WILKERSON AND RODNEY B. S
- Page 22 and 23:
ROBERT L. WILKERSON AND RODNEY B. S
- Page 24 and 25:
ROBERT L. WILKERSON AND RODNEY B. S
- Page 26 and 27:
ROBERT L. WILKERSON AND RODNEY B. S
- Page 28 and 29:
ROBERT L. WILKERSON AND RODNEY B. S
- Page 30 and 31:
ROBERT L. WILKERSON AND RODNEY B. S
- Page 32 and 33:
ROBERT L. WILKERSON AND RODNEY B. S
- Page 34 and 35: ROBERT L. WILKERSON AND RODNEY B. S
- Page 36 and 37: ROBERT L. WILKERSON AND RODNEY B. S
- Page 38 and 39: ROBERT L. WILKERSON AND RODNEY B. S
- Page 40 and 41: NIRANJAN DAS AND SUJATA DEORIincluy
- Page 42 and 43: NIRANJAN DAS AND SUJATA DEORIprovid
- Page 44 and 45: NIRANJAN DAS AND SUJATA DEORIpopula
- Page 46 and 47: NIRANJAN DAS AND SUJATA DEORITABLE
- Page 48 and 49: NIRANJAN DAS AND SUJATA DEORITABLE
- Page 50 and 51: NIRANJAN DAS AND SUJATA DEORITABLE
- Page 52 and 53: NIRANJAN DAS AND SUJATA DEORITABLE
- Page 54 and 55: NIRANJAN DAS AND SUJATA DEORITABLE
- Page 56 and 57: NIRANJAN DAS AND SUJATA DEORITABLE
- Page 58 and 59: Bird Populations 10:56-64© The Ins
- Page 60 and 61: WETLAND BIRDS OF GHANAAvicennia afr
- Page 62 and 63: WETLAND BIRDS OF GHANATABLE 1. Data
- Page 64 and 65: WETLAND BIRDS OF GHANATABLE 2: Esti
- Page 66 and 67: WETLAND BIRDS OF GHANAATTUQUAYEFIO,
- Page 68 and 69: JANNIK HANSEN, LARS HOLST HANSEN, N
- Page 70 and 71: JANNIK HANSEN, LARS HOLST HANSEN, N
- Page 72 and 73: JANNIK HANSEN, LARS HOLST HANSEN, N
- Page 74 and 75: JANNIK HANSEN, LARS HOLST HANSEN, N
- Page 76 and 77: JANNIK HANSEN, LARS HOLST HANSEN, N
- Page 78 and 79: JANNIK HANSEN, LARS HOLST HANSEN, N
- Page 80 and 81: JANNIK HANSEN, LARS HOLST HANSEN, N
- Page 82 and 83: JANNIK HANSEN, LARS HOLST HANSEN, N
- Page 86 and 87: JANNIK HANSEN, LARS HOLST HANSEN, N
- Page 88 and 89: JANNIK HANSEN, LARS HOLST HANSEN, N
- Page 90 and 91: BIRD POPULATIONSA journal of global
- Page 92 and 93: Bird Populations 10:90-109© The In
- Page 94 and 95: DAVID J. ZIOLKOWSKI JR., KEITH L. P
- Page 96 and 97: DAVID J. ZIOLKOWSKI JR., KEITH L. P
- Page 98 and 99: DAVID J. ZIOLKOWSKI JR., KEITH L. P
- Page 100 and 101: DAVID J. ZIOLKOWSKI JR., KEITH L. P
- Page 102 and 103: DAVID J. ZIOLKOWSKI JR., KEITH L. P
- Page 104 and 105: DAVID J. ZIOLKOWSKI JR., KEITH L. P
- Page 106 and 107: DAVID J. ZIOLKOWSKI JR., KEITH L. P
- Page 108 and 109: DAVID J. ZIOLKOWSKI JR., KEITH L. P
- Page 110 and 111: DAVID J. ZIOLKOWSKI JR., KEITH L. P
- Page 112 and 113: Bird Populations 10:110-113© The I
- Page 114 and 115: THE 2007 AND 2008 NORTH AMERICAN BR
- Page 116 and 117: Bird Populations 10:114-124© The I
- Page 118 and 119: BREEDING BIRD CENSUS: 2007on the pl
- Page 120 and 121: BREEDING BIRD CENSUS: 2007May, with
- Page 122 and 123: BREEDING BIRD CENSUS: 2007Remarks:
- Page 124 and 125: BREEDING BIRD CENSUS: 200717. PITCH
- Page 126 and 127: BREEDING BIRD CENSUS: 2007+; Wester
- Page 128 and 129: BREEDING BIRD CENSUS: 2008gray Gnat
- Page 130 and 131: BREEDING BIRD CENSUS: 2008Warbler,
- Page 132 and 133: BREEDING BIRD CENSUS: 2008Source: W
- Page 134 and 135:
BREEDING BIRD CENSUS: 2008Spotted T
- Page 136 and 137:
BREEDING BIRD CENSUS: 2008precipita
- Page 138 and 139:
Bird Populations 10© The Institute
- Page 140 and 141:
IS AVIAN BREEDING SUCCESS WEATHERIN
- Page 142 and 143:
IS AVIAN BREEDING SUCCESS WEATHERIN
- Page 144 and 145:
DAVE LEECH AND CARL BARIMOREFlycatc
- Page 146 and 147:
Bird Populations 10:143-145Reprinte
- Page 148 and 149:
WOODPIGEON JOINS THE GARDEN PREMIER
- Page 150 and 151:
CHANGING THE GUARD AT UK BIRDTABLES
- Page 152 and 153:
Bird Populations is an entirely ele
- Page 154:
BIRD POPULATIONSA journal of global