What Works for Children with Literacy Difficulties? - Digital ...
What Works for Children with Literacy Difficulties? - Digital ...
What Works for Children with Literacy Difficulties? - Digital ...

You also want an ePaper? Increase the reach of your titles
YUMPU automatically turns print PDFs into web optimized ePapers that Google loves.
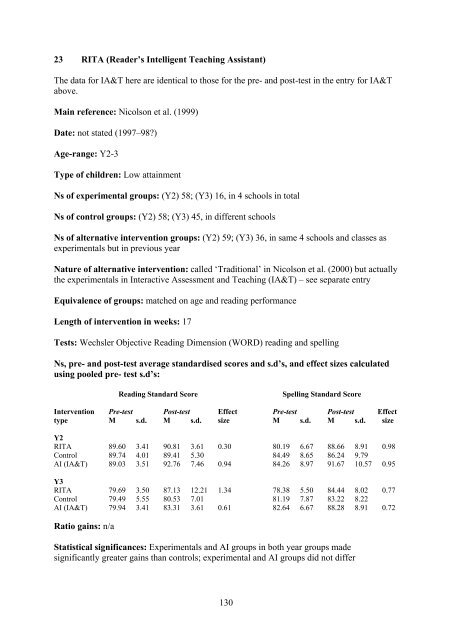
23 RITA (Reader’s Intelligent Teaching Assistant)<br />
The data <strong>for</strong> IA&T here are identical to those <strong>for</strong> the pre- and post-test in the entry <strong>for</strong> IA&T<br />
above.<br />
Main reference: Nicolson et al. (1999)<br />
Date: not stated (1997–98?)<br />
Age-range: Y2-3<br />
Type of children: Low attainment<br />
Ns of experimental groups: (Y2) 58; (Y3) 16, in 4 schools in total<br />
Ns of control groups: (Y2) 58; (Y3) 45, in different schools<br />
Ns of alternative intervention groups: (Y2) 59; (Y3) 36, in same 4 schools and classes as<br />
experimentals but in previous year<br />
Nature of alternative intervention: called ‘Traditional’ in Nicolson et al. (2000) but actually<br />
the experimentals in Interactive Assessment and Teaching (IA&T) – see separate entry<br />
Equivalence of groups: matched on age and reading per<strong>for</strong>mance<br />
Length of intervention in weeks: 17<br />
Tests: Wechsler Objective Reading Dimension (WORD) reading and spelling<br />
Ns, pre- and post-test average standardised scores and s.d’s, and effect sizes calculated<br />
using pooled pre- test s.d’s:<br />
Reading Standard Score Spelling Standard Score<br />
Intervention Pre-test Post-test Effect Pre-test Post-test Effect<br />
type M s.d. M s.d. size M s.d. M s.d. size<br />
Y2<br />
RITA 89.60 3.41 90.81 3.61 0.30 80.19 6.67 88.66 8.91 0.98<br />
Control 89.74 4.01 89.41 5.30 84.49 8.65 86.24 9.79<br />
AI (IA&T) 89.03 3.51 92.76 7.46 0.94 84.26 8.97 91.67 10.57 0.95<br />
Y3<br />
RITA 79.69 3.50 87.13 12.21 1.34 78.38 5.50 84.44 8.02 0.77<br />
Control 79.49 5.55 80.53 7.01 81.19 7.87 83.22 8.22<br />
AI (IA&T) 79.94 3.41 83.31 3.61 0.61 82.64 6.67 88.28 8.91 0.72<br />
Ratio gains: n/a<br />
Statistical significances: Experimentals and AI groups in both year groups made<br />
significantly greater gains than controls; experimental and AI groups did not differ<br />
130