What Works for Children with Literacy Difficulties? - Digital ...
What Works for Children with Literacy Difficulties? - Digital ...
What Works for Children with Literacy Difficulties? - Digital ...

Create successful ePaper yourself
Turn your PDF publications into a flip-book with our unique Google optimized e-Paper software.
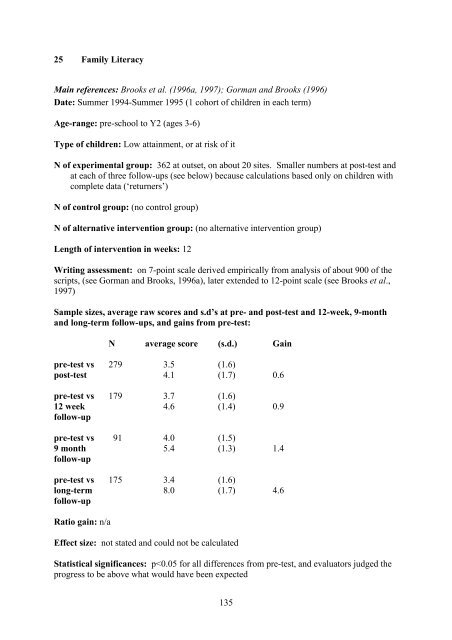
25 Family <strong>Literacy</strong><br />
Main references: Brooks et al. (1996a, 1997); Gorman and Brooks (1996)<br />
Date: Summer 1994-Summer 1995 (1 cohort of children in each term)<br />
Age-range: pre-school to Y2 (ages 3-6)<br />
Type of children: Low attainment, or at risk of it<br />
N of experimental group: 362 at outset, on about 20 sites. Smaller numbers at post-test and<br />
at each of three follow-ups (see below) because calculations based only on children <strong>with</strong><br />
complete data (‘returners’)<br />
N of control group: (no control group)<br />
N of alternative intervention group: (no alternative intervention group)<br />
Length of intervention in weeks: 12<br />
Writing assessment: on 7-point scale derived empirically from analysis of about 900 of the<br />
scripts, (see Gorman and Brooks, 1996a), later extended to 12-point scale (see Brooks et al.,<br />
1997)<br />
Sample sizes, average raw scores and s.d’s at pre- and post-test and 12-week, 9-month<br />
and long-term follow-ups, and gains from pre-test:<br />
N average score (s.d.) Gain<br />
pre-test vs 279 3.5 (1.6)<br />
post-test 4.1 (1.7) 0.6<br />
pre-test vs 179 3.7 (1.6)<br />
12 week 4.6 (1.4) 0.9<br />
follow-up<br />
pre-test vs 91 4.0 (1.5)<br />
9 month 5.4 (1.3) 1.4<br />
follow-up<br />
pre-test vs 175 3.4 (1.6)<br />
long-term 8.0 (1.7) 4.6<br />
follow-up<br />
Ratio gain: n/a<br />
Effect size: not stated and could not be calculated<br />
Statistical significances: p