Annualreport
Annualreport
Annualreport

You also want an ePaper? Increase the reach of your titles
YUMPU automatically turns print PDFs into web optimized ePapers that Google loves.
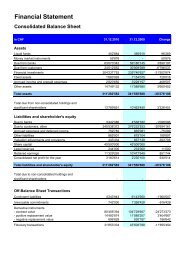
Financial Margin<br />
Year Ended<br />
(In thousands of Bs and millons of US$,<br />
except percentages)<br />
Interest Income<br />
Interest Expense<br />
Net Interest Income<br />
Provision for losses on loan Portfolio<br />
Expenses for Devaluation of<br />
Available-for-Sale Securities<br />
Net Financial Margin<br />
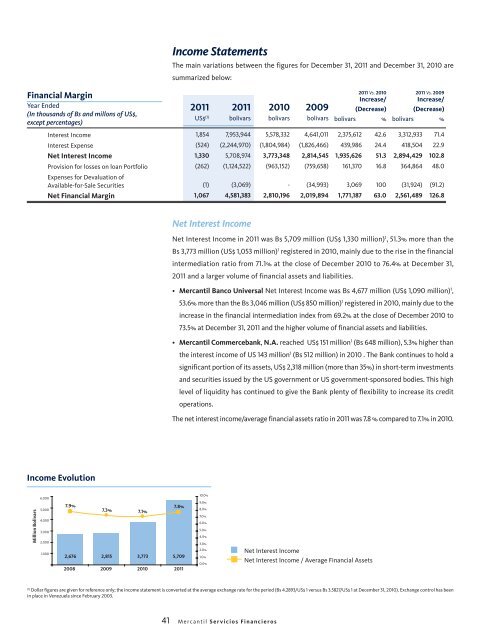
Income Evolution<br />
Million Bolivars<br />
6.000<br />
5.000<br />
4.000<br />
3.000<br />
2.000<br />
1.000<br />
7.9%<br />
2008<br />
7.3%<br />
7.1%<br />
Income Statements<br />
The main variations between the figures for December 31, 2011 and December 31, 2010 are<br />
summarized below:<br />
2011<br />
US$ (1)<br />
1,854<br />
(524)<br />
1,330<br />
(262)<br />
(1)<br />
1,067<br />
2011<br />
bolivars<br />
7,953,944<br />
(2,244,970)<br />
5,708,974<br />
(1,124,522)<br />
(3,069)<br />
4,581,383<br />
Net Interest Income<br />
5,578,332<br />
(1,804,984)<br />
3,773,348<br />
(963,152)<br />
Net Interest Income in 2011 was Bs 5,709 million (US$ 1,330 million) 1 , 51.3% more than the<br />
Bs 3,773 million (US$ 1,053 million) 1 registered in 2010, mainly due to the rise in the financial<br />
intermediation ratio from 71.1% at the close of December 2010 to 76.4% at December 31,<br />
2011 and a larger volume of financial assets and liabilities.<br />
• Mercantil Banco Universal Net Interest Income was Bs 4,677 million (US$ 1,090 million) 1 ,<br />
53.6% more than the Bs 3,046 million (US$ 850 million) 1 registered in 2010, mainly due to the<br />
increase in the financial intermediation index from 69.2% at the close of December 2010 to<br />
73.5% at December 31, 2011 and the higher volume of financial assets and liabilities.<br />
• Mercantil Commercebank, N.A. reached US$ 151 million1 (Bs 648 million), 5.3% higher than<br />
the interest income of US 143 million1 (Bs 512 million) in 2010 . The Bank continues to hold a<br />
significant portion of its assets, US$ 2,318 million (more than 35%) in short-term investments<br />
and securities issued by the US government or US government-sponsored bodies. This high<br />
level of liquidity has continued to give the Bank plenty of flexibility to increase its credit<br />
operations.<br />
The net interest income/average financial assets ratio in 2011 was 7.8 % compared to 7.1% in 2010.<br />
7.8%<br />
2,676 2,815 3,773 5,709<br />
2009 2010 2011<br />
10.0%<br />
9.0%<br />
8.0%<br />
7.0%<br />
6.0%<br />
5.0%<br />
4.0%<br />
3.0%<br />
2.0%<br />
1.0%<br />
0.0%<br />
41 Mercantil Servicios Financieros<br />
2010<br />
bolivars<br />
-<br />
2,810,196<br />
2009<br />
bolivars<br />
4,641,011<br />
(1,826,466)<br />
2,814,545<br />
(759,658)<br />
(34,993)<br />
2,019,894<br />
2011 Vs. 2010<br />
Increase/<br />
(Decrease)<br />
bolivars %<br />
2,375,612<br />
439,986<br />
1,935,626<br />
161,370<br />
3,069<br />
1,771,187<br />
Net Interest Income<br />
Net Interest Income / Average Financial Assets<br />
42.6<br />
24.4<br />
51.3<br />
16.8<br />
100<br />
63.0<br />
2011 Vs. 2009<br />
Increase/<br />
(Decrease)<br />
bolivars %<br />
3,312,933<br />
418,504<br />
2,894,429<br />
364,864<br />
(31,924)<br />
2,561,489<br />
(1) Dollar figures are given for reference only; the income statement is converted at the average exchange rate for the period (Bs 4.2893/US$ 1 versus Bs 3.5827/US$ 1 at December 31, 2010). Exchange control has been<br />
in place in Venezuela since February 2003.<br />
71.4<br />
22.9<br />
102.8<br />
48.0<br />
(91.2)<br />
126.8