The future size and shape of HE - Universities UK
The future size and shape of HE - Universities UK
The future size and shape of HE - Universities UK
- No tags were found...

Create successful ePaper yourself
Turn your PDF publications into a flip-book with our unique Google optimized e-Paper software.
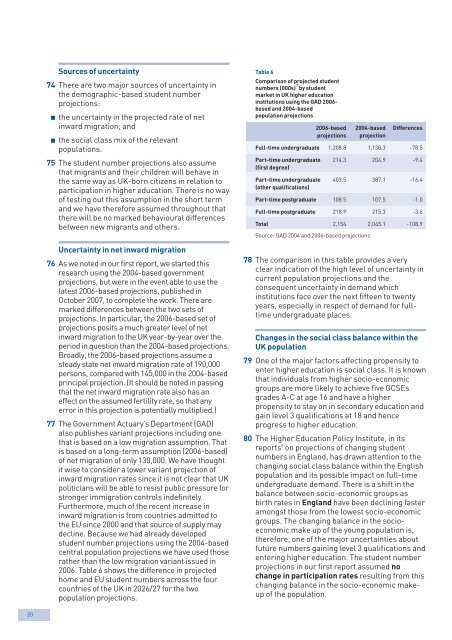
Sources <strong>of</strong> uncertainty74 <strong>The</strong>re are two major sources <strong>of</strong> uncertainty inthe demographic-based student numberprojections:p the uncertainty in the projected rate <strong>of</strong> netinward migration; <strong>and</strong>p the social class mix <strong>of</strong> the relevantpopulations.75 <strong>The</strong> student number projections also assumethat migrants <strong>and</strong> their children will behave inthe same way as <strong>UK</strong>-born citizens in relation toparticipation in higher education. <strong>The</strong>re is no way<strong>of</strong> testing out this assumption in the short term<strong>and</strong> we have therefore assumed throughout thatthere will be no marked behavioural differencesbetween new migrants <strong>and</strong> others.Uncertainty in net inward migration76 As we noted in our first report, we started thisresearch using the 2004-based governmentprojections, but were in the event able to use thelatest 2006-based projections, published inOctober 2007, to complete the work. <strong>The</strong>re aremarked differences between the two sets <strong>of</strong>projections. In particular, the 2006-based set <strong>of</strong>projections posits a much greater level <strong>of</strong> netinward migration to the <strong>UK</strong> year-by-year over theperiod in question than the 2004-based projections.Broadly, the 2006-based projections assume asteady state net inward migration rate <strong>of</strong> 190,000persons, compared with 145,000 in the 2004-basedprincipal projection. (It should be noted in passingthat the net inward migration rate also has aneffect on the assumed fertility rate, so that anyerror in this projection is potentially multiplied.)77 <strong>The</strong> Government Actuary’s Department (GAD)also publishes variant projections including onethat is based on a low migration assumption. Thatis based on a long-term assumption (2006-based)<strong>of</strong> net migration <strong>of</strong> only 130,000. We have thoughtit wise to consider a lower variant projection <strong>of</strong>inward migration rates since it is not clear that <strong>UK</strong>politicians will be able to resist public pressure forstronger immigration controls indefinitely.Furthermore, much <strong>of</strong> the recent increase ininward migration is from countries admitted tothe EU since 2000 <strong>and</strong> that source <strong>of</strong> supply maydecline. Because we had already developedstudent number projections using the 2004-basedcentral population projections we have used thoserather than the low migration variant issued in2006. Table 6 shows the difference in projectedhome <strong>and</strong> EU student numbers across the fourcountries <strong>of</strong> the <strong>UK</strong> in 2026/27 for the twopopulation projections.Table 6Comparison <strong>of</strong> projected studentnumbers (000s) 7 by studentmarket in <strong>UK</strong> higher educationinstitutions using the GAD 2006-based <strong>and</strong> 2004-basedpopulation projections2006-based 2004-based Differencesprojections projectionFull-time undergraduate 1,208.8 1,130.3 -78.5Part-time undergraduate 214.3 204.9 -9.4(first degree)Part-time undergraduate 403.5 387.1 -16.4(other qualifications)Part-time postgraduate 108.5 107.5 -1.0Full-time postgraduate 218.9 215.3 -3.6Total 2,154 2,045.1 -108.9Source: GAD 2004 <strong>and</strong> 2006-based projections78 <strong>The</strong> comparison in this table provides a veryclear indication <strong>of</strong> the high level <strong>of</strong> uncertainty incurrent population projections <strong>and</strong> theconsequent uncertainty in dem<strong>and</strong> whichinstitutions face over the next fifteen to twentyyears, especially in respect <strong>of</strong> dem<strong>and</strong> for fulltimeundergraduate places.Changes in the social class balance within the<strong>UK</strong> population79 One <strong>of</strong> the major factors affecting propensity toenter higher education is social class. It is knownthat individuals from higher socio-economicgroups are more likely to achieve five GCSEsgrades A-C at age 16 <strong>and</strong> have a higherpropensity to stay on in secondary education <strong>and</strong>gain level 3 qualifications at 18 <strong>and</strong> henceprogress to higher education.80 <strong>The</strong> Higher Education Policy Institute, in itsreports 8 on projections <strong>of</strong> changing studentnumbers in Engl<strong>and</strong>, has drawn attention to thechanging social class balance within the Englishpopulation <strong>and</strong> its possible impact on full-timeundergraduate dem<strong>and</strong>. <strong>The</strong>re is a shift in thebalance between socio-economic groups asbirth rates in Engl<strong>and</strong> have been declining fasteramongst those from the lowest socio-economicgroups. <strong>The</strong> changing balance in the socioeconomicmake up <strong>of</strong> the young population is,therefore, one <strong>of</strong> the major uncertainties about<strong>future</strong> numbers gaining level 3 qualifications <strong>and</strong>entering higher education. <strong>The</strong> student numberprojections in our first report assumed nochange in participation rates resulting from thischanging balance in the socio-economic makeup<strong>of</strong> the population.20