FALLOUT PROGRAM QUARTERLY SUMMARY REPORT
FALLOUT PROGRAM QUARTERLY SUMMARY REPORT
FALLOUT PROGRAM QUARTERLY SUMMARY REPORT
- No tags were found...
Create successful ePaper yourself
Turn your PDF publications into a flip-book with our unique Google optimized e-Paper software.
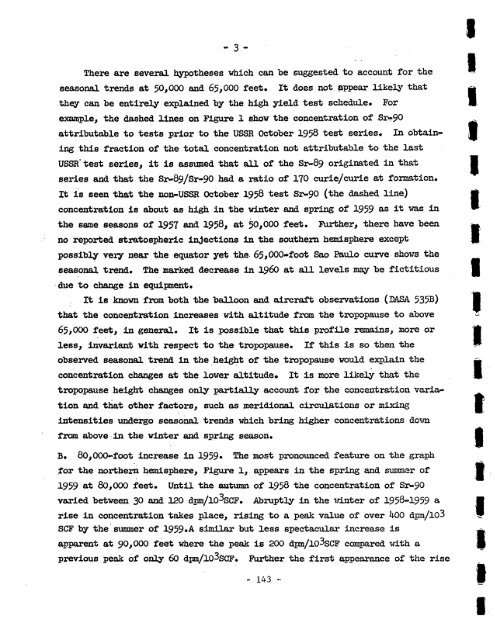
- 3 -IThere are several hypotheses which can be suggested to account for the seasonal trends at 50,000 and 65,000 feet* It does not appear likely that ^they can be entirely explained by the high yield test schedule• For •example, the dashed lines on Figure 1 show the concentration of Siy90attributable to tests prior to the USSR October 1958 test series. In obtain- •ing this fraction of the total concentration not attributable to the lastUSSR' test series, it is assumed that all of the Sr-89 originated in that Iseries and that the Sr*89/Sr-90 had a ratio of 170 curie/curie at formation*It is seen that the non-USSR October 1958 test Sa>90 (the dashed line) £concentration is about as high in the winter and spring of 1959 as i* was in the same seasons of 1957 and 1958, at 50,000 feet. Further, there have been ^no reported stratospheric injections in the southern hemisphere except •possibly very near the equator yet the 65,000-foot Sao Paulo curve shows theseasonal trend* The marked decrease in I960 at all levels may be fictitious •due to change in equipment.It is known from both the balloon and aircraft observations (DASA 535B) •that the concentration increases with altitude from the tropopause to above -65,000 feet, in general. It is possible that this profile remains, more or 1ftless, invariant with respect to the tropopause. If this is so then the observed seasonal trend in the height of the tropopause would explain the »concentration changes at the lower altitude. It is more likely that the J§tropopause height changes only partially account for the concentration variation and that other factors, such as meridional circulations or mixing •intensities undergo seasonal trends which bring higher concentrations downfrom above in the winter and spring season. •B. 80,000-foot increase in 1959• The most pronounced feature on the graphfor the northern hemisphere, Figure 1, appears in the spring and summer of m1959 at 80,000 feet. Until the autumn of 1958 the concentration of Sa>90varied between 30 and 120 dpm/lo3sCF. Abruptly in the winter of 1958-1959 a •rise in concentration takes place, rising to a peak value of over kOO dpm/103 SCF by the summer of 1959*A similar but less spectacular increase is ^apparent at 90,000 feet where the peak is 200 dpm/lo3sCF compared with a £previous peak of only 60 dpm/lo3sCF. Further the first appearance of the rise- 143 - I


