Operations Guide Tracer AdaptiView⢠Display for Gear ... - Trane
Operations Guide Tracer AdaptiView⢠Display for Gear ... - Trane
Operations Guide Tracer AdaptiView⢠Display for Gear ... - Trane
- No tags were found...

You also want an ePaper? Increase the reach of your titles
YUMPU automatically turns print PDFs into web optimized ePapers that Google loves.
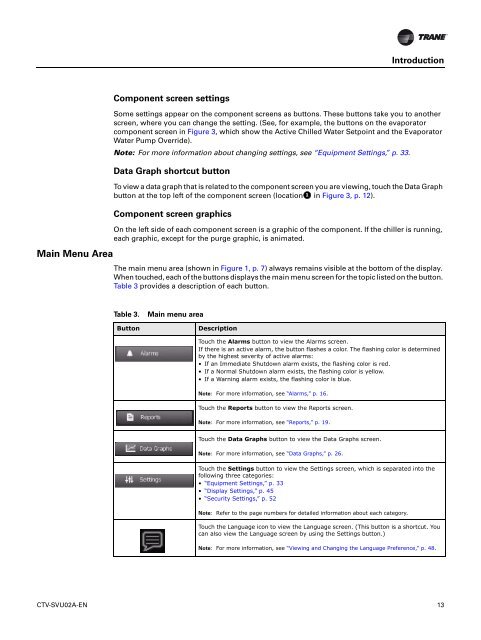
IntroductionMain Menu AreaComponent screen settingsSome settings appear on the component screens as buttons. These buttons take you to anotherscreen, where you can change the setting. (See, <strong>for</strong> example, the buttons on the evaporatorcomponent screen in Figure 3, which show the Active Chilled Water Setpoint and the EvaporatorWater Pump Override).Note: For more in<strong>for</strong>mation about changing settings, see “Equipment Settings,” p. 33.Data Graph shortcut buttonTo view a data graph that is related to the component screen you are viewing, touch the Data Graphbutton at the top left of the component screen (location 1 in Figure 3, p. 12).Component screen graphicsOn the left side of each component screen is a graphic of the component. If the chiller is running,each graphic, except <strong>for</strong> the purge graphic, is animated.The main menu area (shown in Figure 1, p. 7) always remains visible at the bottom of the display.When touched, each of the buttons displays the main menu screen <strong>for</strong> the topic listed on the button.Table 3 provides a description of each button.Table 3.ButtonMain menu areaDescriptionTouch the Alarms button to view the Alarms screen.If there is an active alarm, the button flashes a color. The flashing color is determinedby the highest severity of active alarms:• If an Immediate Shutdown alarm exists, the flashing color is red.• If a Normal Shutdown alarm exists, the flashing color is yellow.• If a Warning alarm exists, the flashing color is blue.Note: For more in<strong>for</strong>mation, see “Alarms,” p. 16.Touch the Reports button to view the Reports screen.Note: For more in<strong>for</strong>mation, see “Reports,” p. 19.Touch the Data Graphs button to view the Data Graphs screen.Note: For more in<strong>for</strong>mation, see “Data Graphs,” p. 26.Touch the Settings button to view the Settings screen, which is separated into thefollowing three categories:• “Equipment Settings,” p. 33• “<strong>Display</strong> Settings,” p. 45• “Security Settings,” p. 52Note:Refer to the page numbers <strong>for</strong> detailed in<strong>for</strong>mation about each category.Touch the Language icon to view the Language screen. (This button is a shortcut. Youcan also view the Language screen by using the Settings button.)Note: For more in<strong>for</strong>mation, see “Viewing and Changing the Language Preference,” p. 48.CTV-SVU02A-EN 13