FOR LOWïºFREQUENCY SEISMOMETRY - IRIS
FOR LOWïºFREQUENCY SEISMOMETRY - IRIS
FOR LOWïºFREQUENCY SEISMOMETRY - IRIS
- No tags were found...

You also want an ePaper? Increase the reach of your titles
YUMPU automatically turns print PDFs into web optimized ePapers that Google loves.
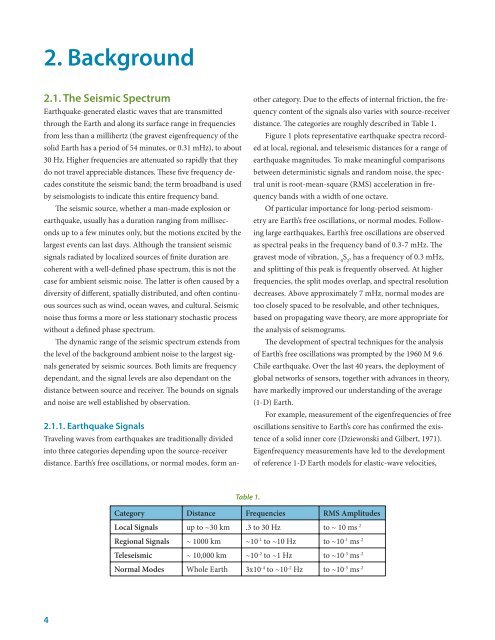
2. Background2.1. The Seismic SpectrumEarthquake-generated elastic waves that are transmittedthrough the Earth and along its surface range in frequenciesfrom less than a millihertz (the gravest eigenfrequency of thesolid Earth has a period of 54 minutes, or 0.31 mHz), to about30 Hz. Higher frequencies are attenuated so rapidly that theydo not travel appreciable distances. These five frequency decadesconstitute the seismic band; the term broadband is usedby seismologists to indicate this entire frequency band.The seismic source, whether a man-made explosion orearthquake, usually has a duration ranging from millisecondsup to a few minutes only, but the motions excited by thelargest events can last days. Although the transient seismicsignals radiated by localized sources of finite duration arecoherent with a well-defined phase spectrum, this is not thecase for ambient seismic noise. The latter is often caused by adiversity of different, spatially distributed, and often continuoussources such as wind, ocean waves, and cultural. Seismicnoise thus forms a more or less stationary stochastic processwithout a defined phase spectrum.The dynamic range of the seismic spectrum extends fromthe level of the background ambient noise to the largest signalsgenerated by seismic sources. Both limits are frequencydependant, and the signal levels are also dependant on thedistance between source and receiver. The bounds on signalsand noise are well established by observation.2.1.1. Earthquake SignalsTraveling waves from earthquakes are traditionally dividedinto three categories depending upon the source-receiverdistance. Earth’s free oscillations, or normal modes, form anothercategory. Due to the effects of internal friction, the frequencycontent of the signals also varies with source-receiverdistance. The categories are roughly described in Table 1.Figure 1 plots representative earthquake spectra recordedat local, regional, and teleseismic distances for a range ofearthquake magnitudes. To make meaningful comparisonsbetween deterministic signals and random noise, the spectralunit is root-mean-square (RMS) acceleration in frequencybands with a width of one octave.Of particular importance for long-period seismometryare Earth’s free oscillations, or normal modes. Followinglarge earthquakes, Earth’s free oscillations are observedas spectral peaks in the frequency band of 0.3-7 mHz. Thegravest mode of vibration, 0S 2, has a frequency of 0.3 mHz,and splitting of this peak is frequently observed. At higherfrequencies, the split modes overlap, and spectral resolutiondecreases. Above approximately 7 mHz, normal modes aretoo closely spaced to be resolvable, and other techniques,based on propagating wave theory, are more appropriate forthe analysis of seismograms.The development of spectral techniques for the analysisof Earth’s free oscillations was prompted by the 1960 M 9.6Chile earthquake. Over the last 40 years, the deployment ofglobal networks of sensors, together with advances in theory,have markedly improved our understanding of the average(1-D) Earth.For example, measurement of the eigenfrequencies of freeoscillations sensitive to Earth’s core has confirmed the existenceof a solid inner core (Dziewonski and Gilbert, 1971).Eigenfrequency measurements have led to the developmentof reference 1-D Earth models for elastic-wave velocities,Table 1.Category Distance Frequencies RMS AmplitudesLocal Signals up to ~30 km .3 to 30 Hz to ~ 10 ms -2Regional Signals ~ 1000 km ~10 -1 to ~10 Hz to ~10 -1 ms -2Teleseismic ~ 10,000 km ~10 -2 to ~1 Hz to ~10 -3 ms -2Normal Modes Whole Earth 3x10 -4 to ~10 -2 Hz to ~10 -5 ms -24