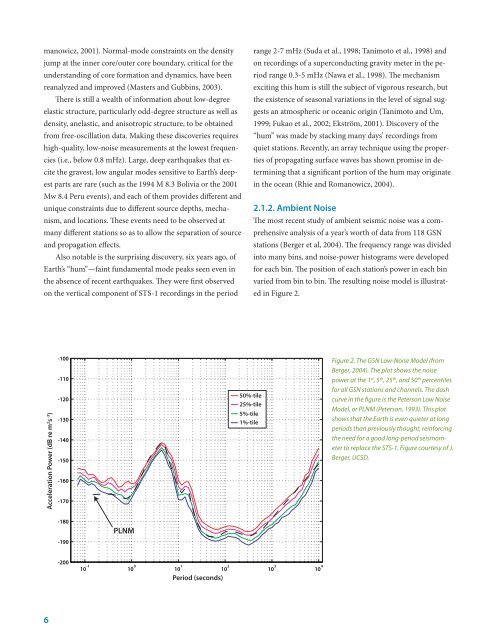
manowicz, 2001). Normal-mode constraints on the densityjump at the inner core/outer core boundary, critical for theunderstanding of core formation and dynamics, have beenreanalyzed and improved (Masters and Gubbins, 2003).There is still a wealth of information about low-degreeelastic structure, particularly odd-degree structure as well asdensity, anelastic, and anisotropic structure, to be obtainedfrom free-oscillation data. Making these discoveries requireshigh-quality, low-noise measurements at the lowest frequencies(i.e., below 0.8 mHz). Large, deep earthquakes that excitethe gravest, low angular modes sensitive to Earth’s deepestparts are rare (such as the 1994 M 8.3 Bolivia or the 2001Mw 8.4 Peru events), and each of them provides different andunique constraints due to different source depths, mechanism,and locations. These events need to be observed atmany different stations so as to allow the separation of sourceand propagation effects.Also notable is the surprising discovery, six years ago, ofEarth’s “hum”—faint fundamental mode peaks seen even inthe absence of recent earthquakes. They were first observedon the vertical component of STS-1 recordings in the periodrange 2-7 mHz (Suda et al., 1998; Tanimoto et al., 1998) andon recordings of a superconducting gravity meter in the periodrange 0.3-5 mHz (Nawa et al., 1998). The mechanismexciting this hum is still the subject of vigorous research, butthe existence of seasonal variations in the level of signal suggestsan atmospheric or oceanic origin (Tanimoto and Um,1999; Fukao et al., 2002; Ekström, 2001). Discovery of the“hum” was made by stacking many days’ recordings fromquiet stations. Recently, an array technique using the propertiesof propagating surface waves has shown promise in determiningthat a significant portion of the hum may originatein the ocean (Rhie and Romanowicz, 2004).2.1.2. Ambient NoiseThe most recent study of ambient seismic noise was a comprehensiveanalysis of a year’s worth of data from 118 GSNstations (Berger et al, 2004). The frequency range was dividedinto many bins, and noise-power histograms were developedfor each bin. The position of each station’s power in each binvaried from bin to bin. The resulting noise model is illustratedin Figure 2.Acceleration Power (dB re m 2 s -3 )-100-110-120-130-140-150-160-17050%-tile25%-tile5%-tile1%-tileFigure 2. The GSN Low-Noise Model (fromBerger, 2004). The plot shows the noisepower at the 1 st , 5 th , 25 th , and 50 th percentilesfor all GSN stations and channels. The dashcurve in the figure is the Peterson Low NoiseModel, or PLNM (Peterson, 1993). This plotshows that the Earth is even quieter at longperiods than previously thought, reinforcingthe need for a good long-period seismometerto replace the STS-1. Figure courtesy of J.Berger, UCSD.-180-190PLNM-20010 -1 10 0 10 1 10 2 10 3 10 4Period (seconds)6
2.2. Seismic NetworksThe original seismic instrumentation (see Box 1) evolvedinto a highly specialized sensor, the Streckeisen STS-1. TheSTS-1 was a very broadband device designed to take fundamentalresearch into Earth’s deep internal structure andearthquake physics to new levels of resolution, and yet remainsufficiently sensitive to also record local earthquake activitywith a fidelity approaching that of sensors specificallydesigned to monitor local activity in narrow spectral windows.The STS-1 was the ultimate sensor for probing the internalstructure of the whole Earth, representing 100 years oftechnological advances in thermally stable metallurgical andelectronics development.The primary application for the STS-1 was in global andcontinental-scale networks deployed to record large earthquakesfor studies of deep Earth structure and earthquakephysics. Two networks that do use, or intend to use, theSTS-1 are:• The Global Seismographic Network (GSN), which operatesand maintains 132 permanent stations globally.• The USArray Backbone Network, one component of thenew EarthScope program (http://www.earthscope.org).USArray is a large North American seismographic networkcurrently being constructed under NSF auspices. Itwill eventually be operated by the US Geological Survey.2.2.1. The Global Seismographic Network (GSN)The Federation of Digital Broadband Seismograph Networks(FDSN) (www.fdsn.org) is an international organization forthe exchange of data from global seismic observing systems.The Global Seismographic Network (www.iris.edu/about/GSN), operated by the <strong>IRIS</strong> Consortium and the US GeologicalSurvey, is the largest network within the FDSN. The cornerstoneof the GSN, the very broadband STS-1 seismometer,is no longer in production. The GSN is now faced with anaging technology base of equipment that cannot be replaced.Thus, unless steps are taken now to explore new and innovativetechnologies, the GSN will increasingly be unable tomeet the scientific demands of the community.GSN leadership has been aware of this problem for sometime. The following paragraphs, excerpted from “Global SeismicNetwork Design Goals Update 2002,” was prepared bythe GSN ad hoc Design Goals Subcommittee, chaired by T.Lay (http://www.iris.edu/about/GSN/docs/GSN_Design_Goals.pdf):The design of today’s Global Seismographic Network (GSN)dates back to 1985. The original design goals emphasized 20sample/sec digital recording with real-time or near real-timedata telemetry of all teleseismic ground motions (assumingabout 20 degrees station spacing) for earthquakes as large asM w= 9.5 (equivalent to the 1960 Chile earthquake) by a uniformglobal network of about 100 stations, with low noise instrumentationand environment, standardization of systemmodules, and linearity of response. These design goals wereframed within the context of both scientific goals of the researchcommunity and by general philosophy of network designand recording system attributes that service the scientific applicationsof the recorded data. The intent was for total systemnoise to be less than the ambient Earth noise over the operatingbandwidth, and to record with full fidelity and bandwidth allseismic signals above the Earth noise.Adaptation of GSN design goals to accommodate emergingscientific directions has been, and should continue to be, an ongoingprocess. However, since 1984 there has not been a community-widediscussion of scientific directions to guide or modifya future vision of GSN instrumentation. Renewal proposalsfor <strong>IRIS</strong> funding from NSF have included updated applicationsof GSN data, but there has not been a forum for broad thinkingon expanded roles or capabilities for GSN in the future. Thus,there is a general sense that, at a minimum, the existing instrumentationstrategy is serving the community rather well andthe original design criteria need to be sustained.Further, there is increasing scientific interest in ultra-longperiod signals, such as the Earth’s spectrum of continuouslyexcited modes and tides. For example, super conducting gravimetershave demonstrated superior response to existing GSNinstrumentation for very long-period free oscillations, and inclusionof a subset of these gravimeters at very quiet sites in theGSN may prove very attractive in the future. The value of highfidelity recording throughout the tidal band is not self-evident,and community discussion of the role GSN should play in datacollection at frequencies below the normal mode band (as forsome ocean oscillations) should be undertaken.7