Upgrade Report - Department of Informatics - King's College London
Upgrade Report - Department of Informatics - King's College London
Upgrade Report - Department of Informatics - King's College London
- No tags were found...

Create successful ePaper yourself
Turn your PDF publications into a flip-book with our unique Google optimized e-Paper software.
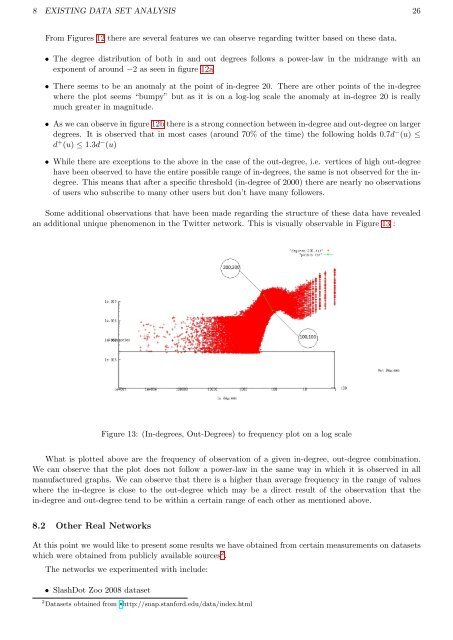
8 EXISTING DATA SET ANALYSIS 26From Figures 12 there are several features we can observe regarding twitter based on these data.• The degree distribution <strong>of</strong> both in and out degrees follows a power-law in the midrange with anexponent <strong>of</strong> around −2 as seen in figure 12a• There seems to be an anomaly at the point <strong>of</strong> in-degree 20. There are other points <strong>of</strong> the in-degreewhere the plot seems “bumpy” but as it is on a log-log scale the anomaly at in-degree 20 is reallymuch greater in magnitude.• As we can observe in figure 12b there is a strong connection between in-degree and out-degree on largerdegrees. It is observed that in most cases (around 70% <strong>of</strong> the time) the following holds 0.7d − (u) ≤d + (u) ≤ 1.3d − (u)• While there are exceptions to the above in the case <strong>of</strong> the out-degree, i.e. vertices <strong>of</strong> high out-degreehave been observed to have the entire possible range <strong>of</strong> in-degrees, the same is not observed for the indegree.This means that after a specific threshold (in-degree <strong>of</strong> 2000) there are nearly no observations<strong>of</strong> users who subscribe to many other users but don’t have many followers.Some additional observations that have been made regarding the structure <strong>of</strong> these data have revealedan additional unique phenomenon in the Twitter network. This is visually observable in Figure 13 :Figure 13: (In-degrees, Out-Degrees) to frequency plot on a log scaleWhat is plotted above are the frequency <strong>of</strong> observation <strong>of</strong> a given in-degree, out-degree combination.We can observe that the plot does not follow a power-law in the same way in which it is observed in allmanufactured graphs. We can observe that there is a higher than average frequency in the range <strong>of</strong> valueswhere the in-degree is close to the out-degree which may be a direct result <strong>of</strong> the observation that thein-degree and out-degree tend to be within a certain range <strong>of</strong> each other as mentioned above.8.2 Other Real NetworksAt this point we would like to present some results we have obtained from certain measurements on datasetswhich were obtained from publicly available sources 2 .The networks we experimented with include:• SlashDot Zoo 2008 dataset2 Datasets obtained from *http://snap.stanford.edu/data/index.html