Upgrade Report - Department of Informatics - King's College London
Upgrade Report - Department of Informatics - King's College London
Upgrade Report - Department of Informatics - King's College London
- No tags were found...

Create successful ePaper yourself
Turn your PDF publications into a flip-book with our unique Google optimized e-Paper software.
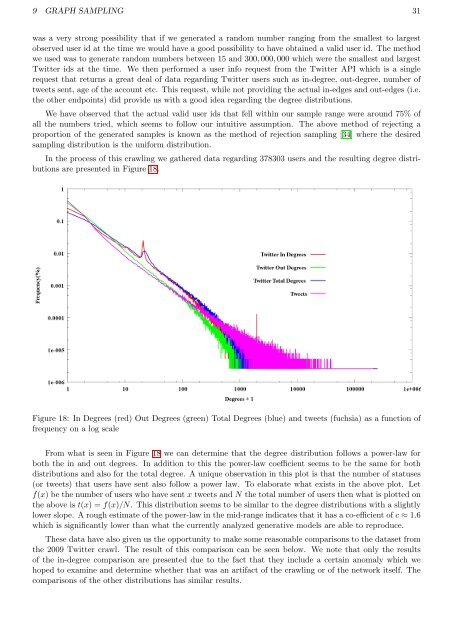
9 GRAPH SAMPLING 31was a very strong possibility that if we generated a random number ranging from the smallest to largestobserved user id at the time we would have a good possibility to have obtained a valid user id. The methodwe used was to generate random numbers between 15 and 300, 000, 000 which were the smallest and largestTwitter ids at the time. We then performed a user info request from the Twitter API which is a singlerequest that returns a great deal <strong>of</strong> data regarding Twitter users such as in-degree, out-degree, number <strong>of</strong>tweets sent, age <strong>of</strong> the account etc. This request, while not providing the actual in-edges and out-edges (i.e.the other endpoints) did provide us with a good idea regarding the degree distributions.We have observed that the actual valid user ids that fell within our sample range were around 75% <strong>of</strong>all the numbers tried, which seems to follow our intuitive assumption. The above method <strong>of</strong> rejecting aproportion <strong>of</strong> the generated samples is known as the method <strong>of</strong> rejection sampling [34] where the desiredsampling distribution is the uniform distribution.In the process <strong>of</strong> this crawling we gathered data regarding 378303 users and the resulting degree distributionsare presented in Figure 18.Figure 18: In Degrees (red) Out Degrees (green) Total Degrees (blue) and tweets (fuchsia) as a function <strong>of</strong>frequency on a log scaleFrom what is seen in Figure 18 we can determine that the degree distribution follows a power-law forboth the in and out degrees. In addition to this the power-law coefficient seems to be the same for bothdistributions and also for the total degree. A unique observation in this plot is that the number <strong>of</strong> statuses(or tweets) that users have sent also follow a power law. To elaborate what exists in the above plot. Letf(x) be the number <strong>of</strong> users who have sent x tweets and N the total number <strong>of</strong> users then what is plotted onthe above is t(x) = f(x)/N. This distribution seems to be similar to the degree distributions with a slightlylower slope. A rough estimate <strong>of</strong> the power-law in the mid-range indicates that it has a co-efficient <strong>of</strong> c ≈ 1.6which is significantly lower than what the currently analyzed generative models are able to reproduce.These data have also given us the opportunity to make some reasonable comparisons to the dataset fromthe 2009 Twitter crawl. The result <strong>of</strong> this comparison can be seen below. We note that only the results<strong>of</strong> the in-degree comparison are presented due to the fact that they include a certain anomaly which wehoped to examine and determine whether that was an artifact <strong>of</strong> the crawling or <strong>of</strong> the network itself. Thecomparisons <strong>of</strong> the other distributions has similar results.