Annual Report 2005 (62.7MB) - Western Riverside County Regional ...
Annual Report 2005 (62.7MB) - Western Riverside County Regional ...
Annual Report 2005 (62.7MB) - Western Riverside County Regional ...
- No tags were found...

You also want an ePaper? Increase the reach of your titles
YUMPU automatically turns print PDFs into web optimized ePapers that Google loves.
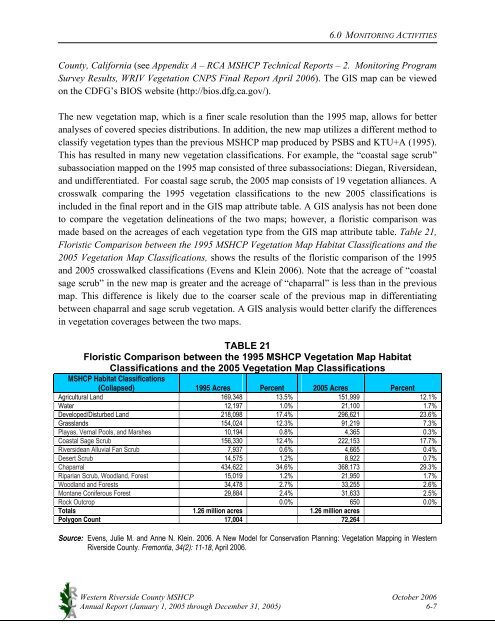
6.0 MONITORING ACTIVITIES<strong>County</strong>, California (see Appendix A – RCA MSHCP Technical <strong>Report</strong>s – 2. Monitoring ProgramSurvey Results, WRIV Vegetation CNPS Final <strong>Report</strong> April 2006). The GIS map can be viewedon the CDFG’s BIOS website (http://bios.dfg.ca.gov/).The new vegetation map, which is a finer scale resolution than the 1995 map, allows for betteranalyses of covered species distributions. In addition, the new map utilizes a different method toclassify vegetation types than the previous MSHCP map produced by PSBS and KTU+A (1995).This has resulted in many new vegetation classifications. For example, the “coastal sage scrub”subassociation mapped on the 1995 map consisted of three subassociations: Diegan, <strong>Riverside</strong>an,and undifferentiated. For coastal sage scrub, the <strong>2005</strong> map consists of 19 vegetation alliances. Acrosswalk comparing the 1995 vegetation classifications to the new <strong>2005</strong> classifications isincluded in the final report and in the GIS map attribute table. A GIS analysis has not been doneto compare the vegetation delineations of the two maps; however, a floristic comparison wasmade based on the acreages of each vegetation type from the GIS map attribute table. Table 21,Floristic Comparison between the 1995 MSHCP Vegetation Map Habitat Classifications and the<strong>2005</strong> Vegetation Map Classifications, shows the results of the floristic comparison of the 1995and <strong>2005</strong> crosswalked classifications (Evens and Klein 2006). Note that the acreage of “coastalsage scrub” in the new map is greater and the acreage of “chaparral” is less than in the previousmap. This difference is likely due to the coarser scale of the previous map in differentiatingbetween chaparral and sage scrub vegetation. A GIS analysis would better clarify the differencesin vegetation coverages between the two maps.TABLE 21Floristic Comparison between the 1995 MSHCP Vegetation Map HabitatClassifications and the <strong>2005</strong> Vegetation Map ClassificationsMSHCP Habitat Classifications(Collapsed) 1995 Acres Percent <strong>2005</strong> Acres PercentAgricultural Land 169,348 13.5% 151,999 12.1%Water 12,197 1.0% 21,100 1.7%Developed/Disturbed Land 218,098 17.4% 296,621 23.6%Grasslands 154,024 12.3% 91,219 7.3%Playas, Vernal Pools, and Marshes 10,194 0.8% 4,365 0.3%Coastal Sage Scrub 156,330 12.4% 222,153 17.7%<strong>Riverside</strong>an Alluvial Fan Scrub 7,937 0.6% 4,665 0.4%Desert Scrub 14,575 1.2% 8,922 0.7%Chaparral 434,622 34.6% 368,173 29.3%Riparian Scrub, Woodland, Forest 15,019 1.2% 21,950 1.7%Woodland and Forests 34,478 2.7% 33,255 2.6%Montane Coniferous Forest 29,884 2.4% 31,633 2.5%Rock Outcrop 0.0% 650 0.0%Totals 1.26 million acres 1.26 million acresPolygon Count 17,004 72,264Source: Evens, Julie M. and Anne N. Klein. 2006. A New Model for Conservation Planning: Vegetation Mapping in <strong>Western</strong><strong>Riverside</strong> <strong>County</strong>. Fremontia, 34(2): 11-18, April 2006.<strong>Western</strong> <strong>Riverside</strong> <strong>County</strong> MSHCP October 2006<strong>Annual</strong> <strong>Report</strong> (January 1, <strong>2005</strong> through December 31, <strong>2005</strong>) 6-7