T.F. Green Airport Improvement Program - FEIS Chapters - PVD
T.F. Green Airport Improvement Program - FEIS Chapters - PVD
T.F. Green Airport Improvement Program - FEIS Chapters - PVD
- No tags were found...

You also want an ePaper? Increase the reach of your titles
YUMPU automatically turns print PDFs into web optimized ePapers that Google loves.
volume 11 FeiS <strong>Chapters</strong>airport improvement programFinal Environmental Impact StatementFinal Section 4(f) EvaluationPrepared in cooperation with theFederal Highway Administrationjuly 2011
This Page Intentionally Left Blank
1 <strong>FEIS</strong> CHAPTERSAIRPORT IMPROVEMENT PROGRAMFinal Environmental Impact StatementFinal Section 4(f) EvaluationJULY 2011PREPARED FOR:Federal Aviation AdministrationPREPARED BY:Vanasse Hangen Brustlin, Inc.Prepared in cooperation with theFederal Highway AdministrationIN ASSOCIATION WITH:Economic Development Research Group, Inc.Harris Miller Miller & Hanson, Inc.I 2 Community Development Consulting, Inc.Intervistas, Inc.Jacobs Engineering, Inc.KB Environmental Sciences, Inc.KM Chng Environmental, Inc.O.R. Colan AssociatesPublic Archaeology LaboratoryRKG Associates, Inc.
AIRPORT IMPROVEMENT PROGRAMprinted on recycled paper
This Page Intentionally Left Blank
T.F. <strong>Green</strong> <strong>Airport</strong> <strong>Improvement</strong> <strong>Program</strong>Environmental Impact Statement and Final Section 4(f) EvaluationTable of ContentsVolume IAbstractChapter 1: Introduction and Background ........................................................................................1-11.1 Introduction ...............................................................................................................1-11.2 Proposed T.F. <strong>Green</strong> <strong>Airport</strong> <strong>Improvement</strong> <strong>Program</strong> ..........................................1-11.3 T.F. <strong>Green</strong> <strong>Airport</strong> <strong>Improvement</strong> <strong>Program</strong> Background and History ...............1-31.4 Final Section 4(f) and 6(f) Evaluation .....................................................................1-81.5 Reader’s Guide to the Final Environmental Impact Statement...........................1-8Chapter 2: Purpose and Need ............................................................................................................2-12.1 Purpose and Need Overview ..................................................................................2-12.2 <strong>Airport</strong> Background ..................................................................................................2-32.3 T.F. <strong>Green</strong> <strong>Airport</strong> Facility Requirements ............................................................2-202.4 Summary of the Purpose and Need for the T.F. <strong>Green</strong> <strong>Airport</strong><strong>Improvement</strong> <strong>Program</strong> ...........................................................................................2-37Chapter 3: Alternatives Analysis ......................................................................................................3-13.1 Introduction ...............................................................................................................3-13.2 Alternatives Screening Process ................................................................................3-33.3 Level 1 Screening – Candidate Alternatives ..........................................................3-63.4 Level 2 Screening – Preliminary Alternatives .....................................................3-103.5 Level 3 Screening - <strong>Airport</strong> <strong>Improvement</strong> <strong>Program</strong> (IP) Alternatives .............3-143.6 Level 4 Screening - Refined Combined Alternatives ..........................................3-153.7 Level 5 Screening – Further Refined Alternatives ..............................................3-163.8 Level 6 Screening – DEIS Final Alternatives .......................................................3-363.9 <strong>FEIS</strong> Analysis – Final Alternatives, the Preferred Alternative, and the Environmentally Preferable Alternative ..............................................................3-38Chapter 4: Affected Environment .....................................................................................................4-14.1 Introduction ...............................................................................................................4-14.2 Noise ...........................................................................................................................4-24.3 Compatible Land Use .............................................................................................4-134.4 Social and Socioeconomic, and Environmental Justice andChildren’s Health and Safety Risks ......................................................................4-174.5 Surface Transportation ...........................................................................................4-274.6 Air Quality ...............................................................................................................4-304.7 Historic, Architectural, Archaeological, and Cultural Resources .....................4-434.8 Section 4(f) and 6(f) Resources ...............................................................................4-484.9 Wetlands and Waterways ......................................................................................4-51Table of Contents and Acronyms i July 2011\\mawatr\ev\09228.00\reports\<strong>FEIS</strong>_Final_July_2011\<strong>PVD</strong>_00_TOC_JUL_2011.doc
T.F. <strong>Green</strong> <strong>Airport</strong> <strong>Improvement</strong> <strong>Program</strong>Environmental Impact Statement and Final Section 4(f) Evaluation4.10 Water Quality...........................................................................................................4-564.11 Fish, Wildlife, and Plants .......................................................................................4-604.12 Federal Threatened and Endangered Species .....................................................4-674.13 Floodplains ...............................................................................................................4-674.14 Coastal Resources ....................................................................................................4-704.15 Farmlands .................................................................................................................4-714.16 Hazardous Materials, Pollution Prevention, and Solid Waste ..........................4-734.17 Light Emissions and Visual Environment ...........................................................4-834.18 Energy Supply, Natural Resources, and Sustainable Design ............................4-86Chapter 5: Environmental Consequences .......................................................................................5-15.1 Introduction ...............................................................................................................5-15.2 Significance Thresholds ..........................................................................................5-105.3 Noise .........................................................................................................................5-135.4 Compatible Land Use .............................................................................................5-465.5 Social and Socioeconomic, and Environmental Justice and Children’s Health and Safety Risks .......................................................................................................5-745.6 Surface Transportation ......................................................................................... 5-1185.7 Air Quality ............................................................................................................. 5-1485.8 Historic, Architectural, Archaeological, and Cultural Resources ................... 5-1715.9 Department of Transportation Act: Section 4(f) and Section 6(f) Resources . 5-1835.10 Wetlands and Waterways .................................................................................... 5-1905.11 Water Quality......................................................................................................... 5-2085.12 Fish, Wildlife, and Plants ..................................................................................... 5-2255.13 Federal Threatened and Endangered Species ................................................... 5-2415.14 Floodplains ............................................................................................................. 5-2435.15 Coastal Resources .................................................................................................. 5-2515.16 Farmlands ............................................................................................................... 5-2545.17 Hazardous Materials, Pollution Prevention, and Solid Waste ........................ 5-2595.18 Light Emissions and Visual Environment ......................................................... 5-2695.19 Energy Supply, Natural Resources, and Sustainable Design .......................... 5-2765.20 Environmental Consequences Summary ........................................................... 5-281Chapter 6: Mitigation ..........................................................................................................................6-16.1 Introduction ...............................................................................................................6-16.2 Noise ...........................................................................................................................6-56.3 Compatible Land Use .............................................................................................6-166.4 Social and Socioeconomic, and Environmental Justice andChildren’s Health and Safety Risks ......................................................................6-186.5 Surface Transportation ...........................................................................................6-196.6 Air Quality ...............................................................................................................6-206.7 Historic, Architectural, Archaeological, and Cultural Resources .....................6-206.8 Section 4(f) Resources .............................................................................................6-246.9 Wetlands and Waterways ......................................................................................6-256.10 Water Quality...........................................................................................................6-326.11 Fish, Wildlife, and Plants .......................................................................................6-376.12 Threatened and Endangered Species ...................................................................6-376.13 Floodplains ...............................................................................................................6-37Table of Contents and Acronyms ii July 2011\\mawatr\ev\09228.00\reports\<strong>FEIS</strong>_Final_July_2011\<strong>PVD</strong>_00_TOC_JUL_2011.doc
T.F. <strong>Green</strong> <strong>Airport</strong> <strong>Improvement</strong> <strong>Program</strong>Environmental Impact Statement and Final Section 4(f) Evaluation6.14 Coastal Resources ....................................................................................................6-386.15 Farmlands .................................................................................................................6-386.16 Hazardous Materials, Pollution Prevention, and Solid Waste ..........................6-386.17 Light Emissions and Visual Environment ...........................................................6-396.18 Energy Supply, Natural Resources, and Sustainable Design ............................6-396.19 Construction Period Mitigation .............................................................................6-396.20 Mitigation Implementation and Monitoring .......................................................6-416.21 Alternative B2 Mitigation .......................................................................................6-44Chapter 7: Final Section 4(f)/Section 6(f) Evaluation ....................................................................7-17.1 Introduction ...............................................................................................................7-17.2 Regulatory Context ...................................................................................................7-17.3 Methodology ..............................................................................................................7-27.4 Description of Section 4(f) Properties .....................................................................7-37.5 Use of Section 4(f) Properties ...................................................................................7-77.6 Avoidance Alternatives ..........................................................................................7-127.7 Measures to Minimize Harm and Mitigation ......................................................7-187.8 Summary ..................................................................................................................7-217.9 Coordination and Consultation .............................................................................7-227.10 Least Overall Harm Analysis ................................................................................7-227.11 Section 6(f) Considerations ....................................................................................7-24Chapter 8: Consultation and Coordination .....................................................................................8-18.1 Introduction ...............................................................................................................8-18.2 Public Involvement ...................................................................................................8-28.3 Inter-Agency/Tribal Consultation and Coordination .........................................8-58.4 Section 106 Consultation between the FAA, the Rhode IslandState Historic Preservation Office, and the Narragansett Indian Tribal Historic Preservation Office .....................................................................................8-98.5 Section 4(f) and Section 6(f) Consultation among the FAA, theRhode Island State Historic Preservation Office, the Rhode Island Department of Environmental Management, and the City of Warwick .........8-118.6 City and Local Coordination .................................................................................8-128.7 Required Permits, Approvals, and Actions .........................................................8-138.8 EIS Notifications and Distribution ........................................................................8-158.9 Public Comments on the EIS .................................................................................8-15Chapter 9: List of Preparers ................................................................................................................9-1Chapter 10: Distribution List ............................................................................................................10-1Chapter 11: References .......................................................................................................................11-1IndexTable of Contents and Acronyms iii July 2011\\mawatr\ev\09228.00\reports\<strong>FEIS</strong>_Final_July_2011\<strong>PVD</strong>_00_TOC_JUL_2011.doc
T.F. <strong>Green</strong> <strong>Airport</strong> <strong>Improvement</strong> <strong>Program</strong>Environmental Impact Statement and Final Section 4(f) EvaluationVolume 2<strong>FEIS</strong> FiguresVolume 3Appendix A, Responses to Comments (Part 1)Volume 4Appendix A, Responses to Comments (Part 2)Volume 5Appendix B, Federal Register NoticesAppendix C, Federal, State, City and Tribal CoordinationAppendix D, Public Participation MaterialsAppendix E, Purpose and Need and AlternativesAppendix F, NoiseAppendix G, Social and Socioeconomic, and Environmental Justice and Children’s Health andSafety RisksAppendix H, Surface TransportationAppendix I, Historic, Architectural, Archaeological, and Cultural ResourcesAppendix J, Section 4(f) and Section 6(f) ResourcesAppendix K, Water QualityAppendix L, Floodplains Appendix M, Hazardous Materials, Pollution Prevention, and Solid WasteTable of Contents and Acronyms iv July 2011\\mawatr\ev\09228.00\reports\<strong>FEIS</strong>_Final_July_2011\<strong>PVD</strong>_00_TOC_JUL_2011.doc
T.F. <strong>Green</strong> <strong>Airport</strong> <strong>Improvement</strong> <strong>Program</strong>Environmental Impact Statement and Final Section 4(f) EvaluationList of TablesTable No. Description Page2-1 Summary of T.F. <strong>Green</strong> <strong>Airport</strong> Facility Requirements................................2-32-2 2010 <strong>FEIS</strong> No-Action Alternative and Build Forecast Summary .................2-62-3 Total Origin and Destination (O&D) Passengers between T.F. <strong>Green</strong>and Logan <strong>Airport</strong>s (combined) and West Coast U.S. Markets...................2-72-4 Average Origin and Destination (O&D) Passengers between T.F. <strong>Green</strong><strong>Airport</strong> and West Coast U.S. Markets (including Las Vegas)...................2-192-5 Annual Enplaned Passengers per Gate Method – 2010 <strong>FEIS</strong>No-Action Alternative and Build Alternative Forecasts.............................2-292-6 Annual Departures per Gate Method – 2010 <strong>FEIS</strong> No-Action Alternative and Build Alternative Forecasts ................................................2-292-7 Percent Increase in Annual Operations Method – 2010 <strong>FEIS</strong>No-Action Alternative and Build Alternative Forecasts.............................2-302-8 Integrated Cargo Carrier Building Facility Requirements .........................2-322-9 GSE Maintenance Building Requirements – 2010 <strong>FEIS</strong> No-Action Alternative and Build Alternative Forecasts ................................................2-332-10 Jet A Fuel Farm Demand and Capacity Requirements –2010 <strong>FEIS</strong> No-Action Alternative and Build Alternative Forecast ............2-342-11 Long-Term Passenger and <strong>Airport</strong> Employee Parking Requirements at T.F. <strong>Green</strong> <strong>Airport</strong> – 2010 <strong>FEIS</strong> No-ActionAlternative and Build Alternative Forecasts ................................................2-363-1 Level 1 Screening Results: On-<strong>Airport</strong> Candidate Alternatives ..................3-93-2 Level 2 Screening Results: Preliminary Alternatives ..................................3-133-3 Level 3 Screening Results: IP Options ...........................................................3-143-4 Summary of Level 4 Screening Analysis.......................................................3-163-5 Number of West Coast-Capable Aircraft Accommodated on VariousRunway Lengths ..............................................................................................3-213-6 Level 5 Screening Step 3 - Utility Assessment of Runway 5-23 Lengths .......3-273-7 Level 5 Screening Step 3 - Alternatives B3 South and B4: Summary ofKey Impacts and Costs ....................................................................................3-28Table of Contents and Acronyms v July 2011\\mawatr\ev\09228.00\reports\<strong>FEIS</strong>_Final_July_2011\<strong>PVD</strong>_00_TOC_JUL_2011.doc
T.F. <strong>Green</strong> <strong>Airport</strong> <strong>Improvement</strong> <strong>Program</strong>Environmental Impact Statement and Final Section 4(f) EvaluationTable No. Description Page4-16 Housing Cost Burdened Households in 2000: Study AreaCompared to Cranston, Warwick, the Region, and Rhode Island ............4-244-17 Publicly Subsidized Housing in the Project Area and Study Area ...........4-254-18 Completed Part 150 Voluntary Land Acquisition <strong>Program</strong> Impacts Affecting Environmental Justice Populations ..............................................4-264-19 National Ambient Air Quality Standards.....................................................4-314-20 2004 Baseline Condition Attainment/Non-Attainment Status of theProvidence Area ...............................................................................................4-334-21 2004 Baseline Condition Air Emissions Inventory ......................................4-374-22 2004 Baseline Condition Hazardous Air Pollutants Emissions Inventory ........................................................................................4-374-23 2004 Baseline Condition Atmospheric Dispersion Analysis Results forT.F. <strong>Green</strong> <strong>Airport</strong>............................................................................................4-384-24 Baseline Condition CO “Hot-Spot” Analysis Results .................................4-394-25 Permanent RIDEM Air Monitors - Data Summary 2005 through 2008 .....................................................................................................4-404-26 Section 4(f) Parks and Recreation Areas within the Study Area andProject Area.......................................................................................................4-504-27 Summary of Study Area Baseline Condition WetlandFunctions and Values ......................................................................................4-534-28 Project Area Baseline Condition Wetlands - State JurisdictionResource Areas .................................................................................................4-544-29 Summary of Project Area Wetland Functions and Values .........................4-554-30 Contributing Areas to Surface Waters Receiving <strong>Airport</strong> Discharges(Baseline Condition) ........................................................................................4-564-31 Regulatory Classifications for Surface Waters Receiving <strong>Airport</strong> Discharges...........................................................................................4-574-32 Drainage Areas and Outfalls within T.F. <strong>Green</strong> <strong>Airport</strong> ............................4-584-33 Water Quality at T.F. <strong>Green</strong> <strong>Airport</strong> Outfalls ..............................................4-594-34 Summary of Study Area Cover Types ..........................................................4-634-35 Summary of Project Area Cover Types (2004) .............................................4-644-36 Regulated Farmland Soils within the Project Area(Baseline Condition) ........................................................................................4-724-37 T.F <strong>Green</strong> <strong>Airport</strong> Aboveground Storage Tanks .........................................4-754-38 Underground Storage Tanks ..........................................................................4-764-39 Miscellaneous Oil and Hazardous Materials Storage .................................4-77Table of Contents and Acronyms vii July 2011\\mawatr\ev\09228.00\reports\<strong>FEIS</strong>_Final_July_2011\<strong>PVD</strong>_00_TOC_JUL_2011.doc
T.F. <strong>Green</strong> <strong>Airport</strong> <strong>Improvement</strong> <strong>Program</strong>Environmental Impact Statement and Final Section 4(f) EvaluationTable No. Description Page4-40 Leaking Underground Storage Tanks within the Project Area(Baseline Condition) ........................................................................................4-804-41 2004 Estimated Energy Consumption by Source Category........................4-865-1 Alternatives B2 and B4 ......................................................................................5-35-2 Resource Categories Evaluated and <strong>FEIS</strong> Analysis Years ...........................5-45-3 Aircraft Operations for 2010 <strong>FEIS</strong> No-Action, Incremental andTotal Build Alternative Forecasts ....................................................................5-65-4 Enplaned-Deplaned Passenger 2010 <strong>FEIS</strong> No-Action, Incremental andTotal Build Alternative Forecasts.................................................................... 5-65-5 New and Planned Developments in the Study Area ...................................5- 95-6 FAA Order 1050.1E Impact Thresholds for Significant Adverse Effects..5-115-7 DNL Noise Baseline Exposure Compared to Alternative Exposure.........5-135-8 No-Action Alternative: 2015, 2020, 2025 Aircraft Noise-ExposedHousing Units...................................................................................................5-185-9 No-Action Alternative: 2015, 2020, 2025 Aircraft Noise-ExposedPopulation.........................................................................................................5-185-10 No-Action Alternative and Alternatives B2 and B4: Comparison ofComputed DNL at Non-Residential Noise-Sensitive Sites within theDNL 60 dB Noise Contour..............................................................................5-195-11 No-Action Alternative: 2015 Summary of Vehicular Traffic Noise ..........5-215-12 No-Action Alternative: 2020 and 2025 Summary of VehicularTraffic Noise for Areas Potentially Impacted by Alternative B2 ...............5-225-13 No Action Alternative: 2020 and 2025 Summary of Vehicular Traffic Noise for Areas Potentially Impacted by Alternative B4............................5-235-14 Alternative B2: 2015 Aircraft Noise-Exposed Housing Units ....................5-245-15 Alternative B2: 2015 Aircraft Noise-Exposed Population ..........................5-255-16 Alternative B2: 2015 Summary of Traffic Noise Impacts by Neighborhood...................................................................................................5-265-17 Alternative B2: 2020 and 2025 Aircraft Noise-Exposed Housing Units....5-275-18 Alternative B2: 2020 and 2025 Aircraft Noise-Exposed Population..........5-285-19 Alternative B2: 2020 Summary of Traffic Noise Impacts by Neighborhood ..................................................................................................5-295-20 Alternative B2: 2025 Summary of Traffic Noise Impacts by Neighborhood...................................................................................................5-295-21 Alternative B4: 2015 Aircraft Noise-Exposed Housing Units ....................5-315-22 Alternative B4: 2015 Aircraft Noise-Exposed Population ..........................5-32Table of Contents and Acronyms viii July 2011\\mawatr\ev\09228.00\reports\<strong>FEIS</strong>_Final_July_2011\<strong>PVD</strong>_00_TOC_JUL_2011.doc
T.F. <strong>Green</strong> <strong>Airport</strong> <strong>Improvement</strong> <strong>Program</strong>Environmental Impact Statement and Final Section 4(f) EvaluationTable No. Description Page5-23 Alternative B4: 2015 Summary of Traffic Noise Impacts byNeighborhood...................................................................................................5-335-24 Alternative B4: 2020 and 2025 Aircraft Noise-Exposed Housing Units....5-345-25 Alternative B4: 2020 and 2025 Aircraft Noise-Exposed Population..........5-355-26 Alternative B4: 2020 Summary of Traffic Noise Impacts by Neighborhood...................................................................................................5-365-27 Alternative B4: 2025 Summary of Traffic Noise Impacts by Neighborhood ..................................................................................................5-375-28 Typical Construction Equipment Maximum Noise Levels ........................5-395-29 Comparison of Computed Time Above 75 at Noise Measurement Sites ......5-415-30 Comparison of Computed Time Above 75 at Non-Residential Noise-Sensitive Sites....................................................................................................5-425-31 Alternatives B2 and B4: Summary of Significant Impacts on Housing Units and Population.......................................................................5-435-32 Alternatives B2 and B4: Comparison of Newly Noise-Exposed Housing Units and Population to DNL 65 dB and Above ........................................5-445-33 Alternative B2: Summary of Vehicular Traffic Noise Impacts (Number of Housing Units)............................................................................5-455-34 Alternative B4: Summary of Vehicular Traffic Noise Impacts (Number of Housing Units)............................................................................5-455-35 Federally Defined Land Use Compatibility with Annual Day-NightAverage Sound Level (DNL) ..........................................................................5-505-36 No-Action Alternative: Residential Land Assumed to be Acquired under a No-Action Voluntary Land Acquisition <strong>Program</strong> ........................5-535-37 All Alternatives: Residential Land Exposed to DNL 65 dB andabove in Study Area.........................................................................................5-545-38 Alternative B2: Summary of Full Land Acquisitions in 2020.....................5-555-39 Alternative B2: Partial Parcels Required for Construction (Mandatory).... 5-565-40 Alternative B2: Residential Land Exposed to DNL 65 dB and AboveCompared to the No-Action Alternative ......................................................5-565-41 Alternatives B2 and B4: Significant Noise Impacts toResidential Land Uses .....................................................................................5-575-42 Alternative B4: Summary of Full Land Acquisitions .................................5-585-43 Alternative B4: Partial Parcels Required for Construction (Mandatory) ...5-595-44 Alternative B4: Residential Land Exposed to DNL 65 dBCompared to the No-Action Alternative (2015) .........................................5-605-45 Alternative B4: Residential Land Exposed to DNL 65 dBCompared to the No-Action Alternative (2020, 2025) ...............................5-61Table of Contents and Acronyms ix July 2011\\mawatr\ev\09228.00\reports\<strong>FEIS</strong>_Final_July_2011\<strong>PVD</strong>_00_TOC_JUL_2011.doc
T.F. <strong>Green</strong> <strong>Airport</strong> <strong>Improvement</strong> <strong>Program</strong>Environmental Impact Statement and Final Section 4(f) EvaluationTable No. Description Page5-46 No-Action Alternative: Residential Zoning Districts Exposed to DNL 65 dB and Above ....................................................................................5-655-47 Alternative B2: Residential Zoning Districts Exposed toDNL 65 dB and Above ....................................................................................5-665-48 Alternative B4: Residential Zoning Districts Exposed toDNL 65 dB and Above ....................................................................................5-675-49 All Alternatives: Cumulative Full Residential Land Acquisition (Parcels and Housing Units) ..........................................................................5-725-50 No-Action Alternative: Aviation Activity-Related Direct Impacts from On-<strong>Airport</strong> Economic Impacts (Losses and Gains) ...........................5-865-51 No-Action Alternative: Aviation Activity-Related Indirect Impacts from Off-<strong>Airport</strong> Visitor Spending and Jobs and Wages (Gains) .............5-875-52 Alternative B2 Aviation Activity: Related Total EconomicImpacts (Gains) in the City of Warwick and State of Rhode Island in2020 and 2025....................................................................................................5-895-53 Alternative B2: Economic Impacts (Losses) in 2020 due to Business Displacement for Construction (Mandatory) ..............................................5-915-54 Alternative B2: Direct Annual Property Tax Impacts (Losses) .................5-925-55 Alternative B2: Residential Units to be Acquired (2020) ...........................5-945-56 Aviation Activity: Related Total Economic Impacts (Gains) in theCity of Warwick and State of Rhode Island .................................................5-965-57 Alternative B4: Economic Impacts (Losses) in 2015 due to Business Displacement for Construction (Mandatory) ...............................................5-975-58 Alternative B4: Direct Annual Property Tax Impacts (Losses) .................5-985-59 Alternative B4: Residential Units to be Acquired (2015) .........................5-1005-60 Average Annual Employment in the City of Warwick (1980 - 2010) .....5-1035-61 Approved and Permitted New Development and Estimated Job Capacity ....................................................................................................5-1045-62 Maximum Potential Cumulative Job Impacts due to Construction-Related Acquisitions (Mandatory) by Alternative B2 and B4..................5-1045-63 Alternatives B2 and B4: Direct and Indirect Economic Impacts(Gains) in the City of Warwick.....................................................................5-1075-64 Alternatives B2 and B4: Total Economic Impacts (Gains) inRhode Island ...................................................................................................5-1075-65 Summary of Direct and Indirect Impacts to Employment in theCity of Warwick .............................................................................................5-1085-66 2020 No-Action Alternative Current Part 150 VLAP ImpactsAffecting Environmental Justice Populations ............................................5-110Table of Contents and Acronyms x July 2011\\mawatr\ev\09228.00\reports\<strong>FEIS</strong>_Final_July_2011\<strong>PVD</strong>_00_TOC_JUL_2011.doc
T.F. <strong>Green</strong> <strong>Airport</strong> <strong>Improvement</strong> <strong>Program</strong>Environmental Impact Statement and Final Section 4(f) EvaluationTable No. Description Page5-67 Alternative B2: Land Acquisition and Noise Impacts Affecting Environmental Justice Populations .............................................................5-1115-68 Alternative B4: Land Acquisition and Noise Impacts Affecting Environmental Justice Populations .............................................................5-1125-69 Summary of Impacts to Affordable and Subsidized Low- andModerate-Income Housing...........................................................................5-1175-70 Alternatives B2 and B4 Compared to the No-Action Alternative: 2015, 2020, and 2025 AADT Summary ........................................................5-1435-71 Alternatives B2 and B4 Compared to the No-Action Alternative: 2015, 2020, and 2025 VMT/VHT Summary................................................5-1445-72 Alternatives B2 and B4 Compared to the No-Action Alternative: 2015, 2020, and 2025 Changes to Peak Hour Traffic Operations(Level of Service) ...........................................................................................5-1455-73 Summary of Air Quality Significance Thresholds.....................................5-1495-74 Air Quality Assessment Models ..................................................................5-1515-75 No-Action Alternative: Operational Emissions Inventory.......................5-1545-76 No-Action Alternative: Atmospheric Dispersion Analysis Results..............................................................................................................5-1555-77 No-Action Alternative: CO “Hot-Spot” Analysis MaximumConcentration Results....................................................................................5-1555-78 No-Action Alternative: Operational Emissions of HAPs .........................5-1565-79 Alternative B2: Operational Emissions Inventory .....................................5-1575-80 Alternative B2: Atmospheric Dispersion Analysis Results ......................5-1585-81 Alternative B2: CO “Hot-Spot” Analysis Maximum Concentration Results..............................................................................................................5-1585-82 Alternative B2: Operational Emissions of HAPs .......................................5-1595-83 Alternative B4: Operational Emissions Inventory .....................................5-1605-84 Alternative B4: Atmospheric Dispersion Analysis Results ......................5-1615-85 Alternative B4: CO “Hot-Spot” Analysis MaximumConcentration Results....................................................................................5-1615-86 Alternative B4: Operational Emissions of HAPs .......................................5-1625-87 Alternative B2: Construction Year and Maximum Construction Emissions Inventory ......................................................................................5-1635-88 Alternative B4: Maximum Construction Emissions Inventory................5-1645-89 Operational Emissions General Conformity Summaries..........................5-1655-90 Construction Emissions General Conformity Summaries........................5-1665-91 Operational and Construction Emissions General ConformitySummaries.......................................................................................................5-167Table of Contents and Acronyms xi July 2011\\mawatr\ev\09228.00\reports\<strong>FEIS</strong>_Final_July_2011\<strong>PVD</strong>_00_TOC_JUL_2011.doc
T.F. <strong>Green</strong> <strong>Airport</strong> <strong>Improvement</strong> <strong>Program</strong>Environmental Impact Statement and Final Section 4(f) EvaluationTable No. Description Page5-92 Air Emissions Inventory Summary – Operational ....................................5-1695-93 Atmospheric Dispersion Analysis Summary .............................................5-1695-94 CO “Hot-Spot” Analysis Summary .............................................................5-1705-95 Air Emissions Inventory Summary – Maximum ConstructionEmissions.........................................................................................................5-1705-96 Projected Future Noise Impacts to Historical Properties .........................5-1765-97 Summary of Direct and Indirect Impacts to Historical andArchaeological Resources .............................................................................5-1795-98 Section 4(f) Historical Properties Day-Night Average Sound Levels .....5-1845-99 Section 4(f) Public Parks and Recreation Areas Day-Night NoiseLevels ...............................................................................................................5-1855-100 Alternative B2: Summary of Impacted Wetland Functions and Values ...5-1955-101 Alternative B2: Wetland Impacts by <strong>Program</strong> Element............................5-1965-102 Alternative B2: Federal Wetland Areas Impacted .....................................5-1975-103 Alternative B2: State Regulated Freshwater Wetland Types Impacted ....5-1975-104 Alternative B4: Summary of Impacts to Wetland Functions and Values ....5-1995-105 Alternative B4: Wetland Impacts by <strong>Program</strong> Element............................5-1995-106 Alternative B4: Federal Wetland Impact.....................................................5-2015-107 Alternative B4: State Regulated Freshwater Wetland Impact..................5-2015-108 Alternatives B2 and B4: Areas of Federal Wetland and Waterway Impacts .........................................................................................5-2045-109 Alternatives B2 and B4: Additional State-Regulated Perimeter and Riverbank Wetland Impacts .........................................................................5-2045-110 No-Action and Alternatives B2 and B4: <strong>Program</strong> Elements by Drainage Area.................................................................................................5-2125-111 Annual Pollutant Loading by Drainage Area(No-Action Alternative) ...............................................................................5-2135-112 Impervious Surfaces by Drainage Area (Alternative B2) ........................5-2145-113 Alternative B2: Impervious Roadway and Parking Areas by Drainage Area.................................................................................................5-2155-114 Annual Pollutant Loading by Drainage Area1 (Alternative B2) ............5-2165-115 Alternative B2 and Alternative B4 Anticipated Annual Deicing Fluid Usage .....................................................................................................5-2165-116 Impervious Surfaces by Drainage Area (Alternative B4) ........................5-2175-117 Alternative B4: Impervious Roadway and Parking Areas by Drainage Area.................................................................................................5-2185-118 Annual Pollutant Loading by Drainage Area (Alternative B4) ..............5-2195-119 Comparison of Impervious Surface Changes.............................................5-223Table of Contents and Acronyms xii July 2011\\mawatr\ev\09228.00\reports\<strong>FEIS</strong>_Final_July_2011\<strong>PVD</strong>_00_TOC_JUL_2011.doc
T.F. <strong>Green</strong> <strong>Airport</strong> <strong>Improvement</strong> <strong>Program</strong>Environmental Impact Statement and Final Section 4(f) EvaluationTable No. Description Page5-120 Comparison of Pollutant Loading Changes ...............................................5-2245-121 Alternative B2: Impacts to Aquatic Habitats..............................................5-2305-122 Alternative B2: Impacts to Terrestrial Habitats..........................................5-2315-123 Alternative B4: Impacts to Aquatic Habitats..............................................5-2335-124 Alternative B4: Impacts to Terrestrial Habitats..........................................5-2335-125 Alternatives B2 and B4: Summary of Impacts to Important BioticCommunities...................................................................................................5-2385-126 Alternatives B2 and B4: Summary of Impacts toEstimated Floodplains ...................................................................................5-2475-127 Direct and Indirect Impacts to Farmland of Statewide Importance........5-2595-128 Alternatives B2 and B4: Comparison of Environmental Consequences,Hazardous Materials, and Solid Waste.......................................................5-2655-129 No-Action Alternative and Alternatives B2 and B4: Distances andHeights of Approach Lighting .....................................................................5-2725-130 Future Estimated Annual Energy Consumption by Source Categoryand Alternative...............................................................................................5-2795-131 Significant Impacts: Summary Comparison of the SignificantImpacts of Alternatives B2 and B4 Prior to Mitigation .............................5-2826-1 Summary of Potential Proposed Mitigation for Significant Impacts ..........6-36-2 Summary of Potential Mitigation for Compliance with OtherRequirements......................................................................................................6-46-3 Alternative B4: Summary of Mitigation for Significant Noise Impacts ......6-96-4 Noise Compatibility Measures.......................................................................6-126-5 Alternative B4: Residential Units Eligible for Participation in aVoluntary Land Acquisition <strong>Program</strong> under Part 150................................6-136-6 Alternative B4: Residential Units Newly Eligible for Participation in aFuture Sound Insulation <strong>Program</strong> for Noise Mitigation under Part 150 ....6-146-7 Alternative B4: Summary of Potential Noise Barriers.................................6-156-8 Alternative B4: Summary of Adverse Effects to Historical and Archaeological Resources ...............................................................................6-226-9 Alternative B4: Summary of Impacts to Historical Cemeteries .................6-246-10 Alternative B4: Wetland Functions and Values Impacted..........................6-266-11 Alternative B4: Potential Wetland Mitigation Sites - Functions andValues ................................................................................................................6-276-12 Alternative B4: Wetland Mitigation Estimated Acreage.............................6-326-13 Alternative B4: Potential Stormwater Control Measures ...........................6-346-14 Alternative B4: Required Stormwater Storage Volume ..............................6-35Table of Contents and Acronyms xiii July 2011\\mawatr\ev\09228.00\reports\<strong>FEIS</strong>_Final_July_2011\<strong>PVD</strong>_00_TOC_JUL_2011.doc
T.F. <strong>Green</strong> <strong>Airport</strong> <strong>Improvement</strong> <strong>Program</strong>Environmental Impact Statement and Final Section 4(f) EvaluationTable No. Description Page6-15 Potential Stormwater Control Measures Operations andMaintenance Procedures.................................................................................6-366-16 Alternative B4: Summary of Construction Period Mitigation Measures .......6-406-17 Alternative B4: Summary of Proposed Mitigation Implementationand Monitoring for Significant Impacts........................................................6-426-18 Alternative B4: Summary of Proposed Mitigation for Compliancewith Other Requirements................................................................................6-436-19 Alternative B2: Wetland Functions and Values Impacted..........................6-486-20 Alternative B2: Potential Wetland Mitigation Sites - Functions andValues ................................................................................................................6-496-21 Alternative B2: Wetland Mitigation Estimated Acreage.............................6-506-22 Alternative B2: Summary of Proposed Mitigation Implementationand Monitoring for Significant Impacts........................................................6-546-23 Alternative B2: Summary of Proposed Mitigation Implementation and Monitoring for Mitigation for Compliance withOther Requirements.........................................................................................6-557-1 Potential Replacement Options for Recreational Facilities.........................7-207-2 Summary of Use and Mitigation of Section 4(f) Propertiesby Alternative ...................................................................................................7-218-1 EIS Public Outreach and Review .....................................................................8-48-2 Coordination Group Meetings .........................................................................8-88-3 Section 106 Consultation .................................................................................8-108-4 Local Coordination Meetings .........................................................................8-138-5 T.F. <strong>Green</strong> <strong>Airport</strong> <strong>Improvement</strong> <strong>Program</strong> Possible Permits andApprovals..........................................................................................................8-148-6 Locations for Public Review of the EIS .........................................................8-15Table of Contents and Acronyms xiv July 2011\\mawatr\ev\09228.00\reports\<strong>FEIS</strong>_Final_July_2011\<strong>PVD</strong>_00_TOC_JUL_2011.doc
T.F. <strong>Green</strong> <strong>Airport</strong> <strong>Improvement</strong> <strong>Program</strong>Environmental Impact Statement and Final Section 4(f) EvaluationList of ChartsChart No. Description Page2-1 Los Angeles Area - T.F. <strong>Green</strong> Origin and Destination Passengers..........2-132-2 San Francisco Bay Area - T.F. <strong>Green</strong> Origin and Destination Passengers2-152-3 Seattle - T.F. <strong>Green</strong> Origin and Destination Passengers .............................2-172-4 Las Vegas – T.F. <strong>Green</strong> Origin and Destination Passengers ......................2-182-5 Range of Runway Length Requirements for Non-stop West Coast-CapableAircraft...............................................................................................................2-263-1 Alternative Screening Process ..........................................................................3-53-2 Level 5 Alternatives Screening Process ........................................................3-17List of FiguresVolume 2Figure No.Description1-1 Project Location1-2 Project Vicinity1-3 Existing <strong>Airport</strong> Facilities1-4 Existing Terminal Area2-1 Eastern New England <strong>Airport</strong> Catchment Areas2-2 New England <strong>Airport</strong> Usage by Ground Origin (FY 2004)2-3 <strong>Airport</strong> Use by Passengers Originating in T.F. <strong>Green</strong> Catchment Area2-4 Runway 16-34 Runway Safety Areas2-5 Existing and Possible New Non-Stop (Long-Haul) Destinations withPrimary Runway LengtheningTable of Contents and Acronyms xv July 2011\\mawatr\ev\09228.00\reports\<strong>FEIS</strong>_Final_July_2011\<strong>PVD</strong>_00_TOC_JUL_2011.doc
T.F. <strong>Green</strong> <strong>Airport</strong> <strong>Improvement</strong> <strong>Program</strong>Environmental Impact Statement and Final Section 4(f) EvaluationFigure No.Description3-1 Screening Level I - Candidate Alternatives: Study Area3-2 Screening Level I - Candidate Alternatives: Other <strong>Airport</strong>s Considered3-3 Potential New <strong>Airport</strong> Locations3-4 Proposed <strong>Program</strong> Elements3-5 No-Action Alternative and Alternative B1 (Conceptual Layouts)3-6 Alternatives B2 and B4 (Conceptual Layouts)3-7 Alternatives B3 North and South (Conceptual Layouts)3-8 Level 5 Alternative B3 South and Alternative B4 Comparison of 2020 NoiseContours3-9 Level 5 Alternative B3 South and Alternative B4 Winslow Park Impacts3-10 Alternative B4 Construction Phasing 2012-20133-11 Alternative B4 Construction Phasing 2014-20153-12 Alternative B4 Construction Phasing 2016-20173-13 Alternative B4 Construction Phasing 2018-20193-14 Alternative B4 Construction Phasing 2020-20214-1 2004 Flight Tracks4-2 Noise Measurement and Cargo Noise Prediction Sites4-3 2004 Day-Night Noise Level (DNL) Contours4-4 Part 150 Properties: Sound Insulated and Voluntary Land Acquisition4-5 Non-residential Noise-Sensitive Locations within the 2004 DNL 60 dBContour4-6 Generalized Land Use 20044-7 Zoning Districts 20044-8 Generalized Land Use 2004 and Non-Residential Noise-Sensitive Locationswithin the 2004 DNL 65 dB Contour4-9 Non-Residential Noise-Sensitive Land Uses: Schools, Places of Worship,Nursing Homes, and Libraries 20044-10 <strong>Airport</strong>-Related Businesses 20044-11 Employment in the Study Area and State of Rhode Island (by sector)4-12 Subsidized Housing 20044-13 Baseline Environmental Justice Populations4-14 Surface Transportation Study Area4-15 <strong>Airport</strong> Parking Facilities4-16 Dispersion Modeling Receptors and Air Quality Monitoring Sites4-17 Air Quality Analysis IntersectionsTable of Contents and Acronyms xvi July 2011\\mawatr\ev\09228.00\reports\<strong>FEIS</strong>_Final_July_2011\<strong>PVD</strong>_00_TOC_JUL_2011.doc
T.F. <strong>Green</strong> <strong>Airport</strong> <strong>Improvement</strong> <strong>Program</strong>Environmental Impact Statement and Final Section 4(f) EvaluationFigure No.Description4-18 RIDEM Permanent Air Monitoring Station Locations4-19 Historic, Architectural, Archaeological and Cultural Resources Areas ofPotential Effect (APE)4-20 Cultural Resources within the Areas of Potential Effect (APE)4-21 Area of Potential Effect for the Phase I(c) Archaeological Survey4-22 Study Area Wetlands4-23 Project Area Wetlands4-24 Regional Surface Water Resources4-25 Buckeye Brook, Warwick Pond, and Tuscatucket Brook Drainage Areas4-26 Groundwater Resources4-27 <strong>Airport</strong> Drainage Areas with Stormwater Collection Systems4-28 Study Area Natural Communities4-29 Project Area Natural Communities4-30 1% Annual Chance Floodplain4-31 Coastal Resources4-32 RICRMC Jurisdictional Areas4-33 Prime Farmland Soils4-34 Potential Sources of Soil and Groundwater Contamination4-35 Oil and Hazardous Material Management Areas at T.F. <strong>Green</strong> <strong>Airport</strong>4-36 Truk Away Landfill4-37 Existing Lighting and Navigation Aids5-1 No-Action Alternative: Conceptual Layout5-2 Alternatives B2 and B4: Conceptual Layouts5-3 Alternative B2: Modeled Flight Tracks – Northflow5-4 Alternative B2: Modeled Flight Tracks – Southflow5-5 Alternative B4: Modeled Flight Tracks – Northflow5-6 Alternative B4: Modeled Flight Tracks – Southflow5-7 No-Action Alternative: Comparison of 2015, 2020 and 2025 Noise Contours5-8 Completed and Current Part 150 Voluntary Land Acquisition <strong>Program</strong>s andResidential Sound Insulation <strong>Program</strong>5-9 Non-Residential Noise-Sensitive Locations above the 2025 DNL 60 dB Contour:All Alternatives5-10 Alternative B2 and No-Action Alternative: Comparison of 2015 Noise Contours5-11 Alternative B2 and No-Action Alternative: Comparison of 2020 and 2025 NoiseContours5-12 Alternative B2: Areas of Significant Noise Exposure 2020 and 2025Table of Contents and Acronyms xvii July 2011\\mawatr\ev\09228.00\reports\<strong>FEIS</strong>_Final_July_2011\<strong>PVD</strong>_00_TOC_JUL_2011.doc
T.F. <strong>Green</strong> <strong>Airport</strong> <strong>Improvement</strong> <strong>Program</strong>Environmental Impact Statement and Final Section 4(f) EvaluationFigure No.Description5-13 Alternative B4 and No-Action Alternative: Comparison of 2015 Noise Contours5-14 Alternative B4: Areas of Significant Noise Exposure 20155-15 Alternative B4 and No-Action Alternative: Comparison of 2020 and 2025 NoiseContours5-16 Alternative B4: Areas of Significant Noise Exposure 2020 and 20255-17 No-Action Alternative: Noise Contours and Generalized Land Use5-18 Alternative B2: 2015, 2020 and 2025 DNL Noise Contours with Generalized LandUse5-19 <strong>FEIS</strong> Alternatives: Property Acquisition and Sound Insulation: South5-20 <strong>FEIS</strong> Alternatives: Property Acquisition and Sound Insulation: North5-21 Alternative B4: 2015 DNL Noise Contours with Generalized Land Use5-22 Alternative B4: 2020 and 2025 DNL Noise Contours with Generalized Land Use5-23 No-Action Alternative: Noise Contours and Generalized Zoning 2015, 2020, and20255-24 Alternative B2: Noise Contours and Generalized Zoning 2015, 2020 and 20255-25 Alternative B4: Noise Contours and Generalized Zoning 20155-26 Alternative B4: Noise Contours and Generalized Zoning 2020 and 20255-27 <strong>FEIS</strong> Alternatives: Land Acquisition Impacts to Environmental JusticeCommunities: North5-28 <strong>FEIS</strong> Alternatives: Land Acquisition Impacts to Environmental JusticeCommunities: South5-29 <strong>FEIS</strong> Alternatives: 2015, 2020, and 2025 Significant Noise Impacts toEnvironmental Justice Communities: North5-30 <strong>FEIS</strong> Alternatives: 2015, 2020, and 2025 Significant Noise Impacts toEnvironmental Justice Communities: South5-31 <strong>FEIS</strong> Alternatives: Impacts to Historic Properties and Warwick HistoricCemeteries within the Direct Impacts APE: North5-32 <strong>FEIS</strong> Alternatives: Impacts to Historic Properties and Warwick HistoricCemeteries within the Direct Impacts APE: South5-33 Alternative B2: Historic Properties Noise Impacts 2020 and 20255-34 Alternative B4: Historic Properties Noise Impacts 20155-35 Alternative B4: Historic Properties Noise Impacts 2020 and 20255-36 Alternative B2: Public Parks and Recreation Areas - Noise and Land AcquisitionImpacts5-37 Alternative B4: Public Parks and Recreation Areas - Noise and Land AcquisitionImpacts 2015Table of Contents and Acronyms xviii July 2011\\mawatr\ev\09228.00\reports\<strong>FEIS</strong>_Final_July_2011\<strong>PVD</strong>_00_TOC_JUL_2011.doc
T.F. <strong>Green</strong> <strong>Airport</strong> <strong>Improvement</strong> <strong>Program</strong>Environmental Impact Statement and Final Section 4(f) EvaluationFigure No.Description5-38 Alternative B4: Public Parks and Recreation Areas - Noise and Land AcquisitionImpacts 2020 and 20255-39 <strong>FEIS</strong> Alternatives: Impacts to Wetlands and Waterways: North5-40 <strong>FEIS</strong> Alternatives: Impacts to Wetlands and Waterways: South5-41 Cumulative Impacts to Wetlands5-42 No-Action Alternative: Future Drainage Areas, Potential BMPs, and Outfalls5-43 Alternatives B2 and B4: Future Drainage Areas, Potential BMPs, and Outfalls5-44 <strong>FEIS</strong> Alternatives: Impacts to Fish, Wildlife, and Plants: North5-45 <strong>FEIS</strong> Alternatives: Impacts to Fish, Wildlife, and Plants: South5-46 <strong>FEIS</strong> Alternatives: Impacts to 1% Annual Chance Floodplain5-47 Cumulative Impacts to Historic and Existing Floodplains5-48 <strong>FEIS</strong> Alternatives: Impacts to Farmlands of Statewide Importance5-49 <strong>FEIS</strong> Alternatives: Potential Hazardous Materials and Solid Waste Impacts5-50 <strong>FEIS</strong> Alternatives: Proposed Lighting6-1 Main Avenue Roadway Noise Mitigation6-2 Potential Compensatory Wetland Mitigation Sites6-3 Wetland Mitigation Site 1 South of Runway 34, Warwick6-4 Wetland Mitigation Site 2 Culvert Replacement Lakeshore Drive, Warwick6-5 Wetland Mitigation Site 3 Lakeshore Drive, Warwick6-6 Wetland Mitigation Site 6 Wetland Creation, Lydick Ave Warwick6-7 Wetland Mitigation Site 8 Three Ponds Marsh Preservation, Warwick6-8 Wetland Mitigation Site 12 Conimicut Point Marsh Preservation, Warwick7-1 Section 4(f) Resources7-2 Aerial View of Eligible <strong>Airport</strong> Historic District7-3 Winslow Park Facilities7-4 <strong>FEIS</strong> Alternatives: Impacts to Historic Properties7-5 Hangar No. 1 / Object Free Area7-6 <strong>FEIS</strong> Alternatives: Winslow Park Impacts7-7 Integrated Cargo Facility Sites (Shown with Alternative B2)7-8 Section 4(f) Alternatives Analysis for Alternative B4 Cargo Options7-9 Potential Winslow Park Relocation Sites7-10 Cedar Swamp Road Site Plan7-11 Strawberry Field Road Site PlanTable of Contents and Acronyms xix July 2011\\mawatr\ev\09228.00\reports\<strong>FEIS</strong>_Final_July_2011\<strong>PVD</strong>_00_TOC_JUL_2011.doc
T.F. <strong>Green</strong> <strong>Airport</strong> <strong>Improvement</strong> <strong>Program</strong>Environmental Impact Statement and Final Section 4(f) EvaluationThis Page Intentionally Left BlankTable of Contents and Acronyms xx July 2011\\mawatr\ev\09228.00\reports\<strong>FEIS</strong>_Final_July_2011\<strong>PVD</strong>_00_TOC_JUL_2011.doc
T.F. <strong>Green</strong> <strong>Airport</strong> <strong>Improvement</strong> <strong>Program</strong>Environmental Impact Statement and Final Section 4(f) EvaluationAcronyms A – (300)AADAADTACACHPACIACMACRPAEEAGLAIPAIR-21ALPALPAALSF-2AMASSAMFAMTRAKAOMSAPEAPMAPUARFFASDE-XASR-9ASTATCAirbus – (model)Annualized Average Delay per Aircraft OperationAverage Annual Daily TrafficAdvisory CircularAdvisory Council on HistoricPreservation<strong>Airport</strong>s Council InternationalAsbestos-Containing Materials<strong>Airport</strong> Cooperative Research<strong>Program</strong>Federal Aviation AdministrationOffice of Energy and EnvironmentAbove Ground Level<strong>Airport</strong> <strong>Improvement</strong> <strong>Program</strong>Wendell H. Ford Aviation Investmentand Reform Act of the 21st Century<strong>Airport</strong> Layout PlanAirline Pilots AssociationApproach Lighting System<strong>Airport</strong> Movement Area SafetySystemAirfield Maintenance FacilityNational Railroad PassengerCorporationAircraft Operations MonitoringSystemArea of Potential EffectAutomated People MoverAircraft Auxiliary Power Unit<strong>Airport</strong> Rescue and Fire Fighting<strong>Airport</strong> Surveillance DetectionEquipment<strong>Airport</strong> Surveillance RadarAboveground Storage TankAir Traffic ControlATCTATOB – (747)BMPBODBRACCAACBRACDACEQCFRcfsCOCODCRJCTCTASCWACWCSCZMCZMACZMPCZARAdBdBADEISDFWDNLAir Traffic Control TowerFAA Air Traffic OrganizationBoeing – (model)Best Management PracticesBiochemical Oxygen DemandBase Realignment and ClosureClean Air ActCoastal Barrier Resources ActContinuous Descent ArrivalCouncil on Environmental QualityCode of Federal RegulationsCubic feet per secondCarbon MonoxideChemical Oxygen DemandCanadair Regional JetConnecticutCenter Tracon Automation SystemClean Water ActRhode Island’s ComprehensiveWildlife Conservation StrategyCoastal Zone ManagementCoastal Zone Management ActCoastal Zone Management <strong>Program</strong>Coastal Zone Management ActReauthorization AmendmentsDecibelHourly A-weighted equivalent soundlevel in decibelsDraft Environmental ImpactStatementRhode Island Division of Fish andWildlifeDay-Night Average Sound LevelTable of Contents and Acronyms xxi July 2011\\mawatr\ev\09228.00\reports\<strong>FEIS</strong>_Final_July_2011\<strong>PVD</strong>_00_TOC_JUL_2011.doc
T.F. <strong>Green</strong> <strong>Airport</strong> <strong>Improvement</strong> <strong>Program</strong>Environmental Impact Statement and Final Section 4(f) EvaluationDODODDOIDOTEDMSEISEJEMASEOEPAESADissolved OxygenUnited States Department of DefenseUnited States Department of theInteriorUnited States Department ofTransportationEmissions and Dispersion ModelingSystemEnvironmental Impact StatementEnvironmental JusticeEngineered Materials ArrestingSystemExecutive OrderUnited States EnvironmentalProtection AgencyEndangered Species ActFAA Federal Aviation Administration<strong>FEIS</strong> Final Environmental ImpactStatementFEMA Federal Emergency ManagementAgencyFHWA Federal Highway AdministrationFHWA NAC Federal Highway AdministrationNoise Abatement CriteriaFICAN Federal Interagency Committee onAviation NoiseFICON Federal Interagency Committee onNoiseFIRM Flood Insurance Rate MapFPPA Farmland Protection Policy ActFRA Federal Railroad AdministrationftFeetGAGISGPSGSEGSPHAPHCMHDTRHIRLHMMHHNMGeneral AviationGeographic Information SystemGlobal Positioning SystemGround Support EquipmentGross State ProductHazardous Air PollutantHighway Capacity ManualHigh Density Traffic <strong>Airport</strong>s RuleHigh Intensity Runway LightsHarris Miller Miller & Hanson, Inc.Helicopter Noise ModelHUDHVACRIIFRIMCINMIPLAASLAXLBPLCCLGALEDLEDPALEEDL maxLOSLUSTL&WCFMAMAGLEVMALSRMOAMOUMPOMPUMSAMSLµg/m 3MUTCDNAAQSNASNASAUnited States Department of Housingand Urban DevelopmentHeating, Ventilation, AirConditioning, and RefrigerationSystemsInterstateInstrument Flight RuleInstrument MeteorologicalConditionsIntegrated Noise Model<strong>Improvement</strong> <strong>Program</strong>Local Area Augmentation SystemLos Angeles International <strong>Airport</strong>Lead-Based PaintLow Cost CarriersLaGuardia <strong>Airport</strong>Light Emitting DiodeLeast Environmentally DamagingPracticable AlternativeLeadership in Energy andEnvironmental DesignMaximum Noise LevelLevel of ServiceLeaking Underground Storage TanksLand and Water Conservation FundsMassachusettsMagnetically Levitating TrainMedium Intensity Approach LightingSystemMemorandum of AgreementMemorandum of UnderstandingMetropolitan Planning OrganizationMaster Plan UpdateMetropolitan Statistical AreaMean Sea LevelMicrograms per cubic meterManual on Uniform Traffic ControlDevicesNational Ambient Air QualityStandardsNational Airspace SystemNational Aeronautics and SpaceAdministrationTable of Contents and Acronyms xxii July 2011\\mawatr\ev\09228.00\reports\<strong>FEIS</strong>_Final_July_2011\<strong>PVD</strong>_00_TOC_JUL_2011.doc
T.F. <strong>Green</strong> <strong>Airport</strong> <strong>Improvement</strong> <strong>Program</strong>Environmental Impact Statement and Final Section 4(f) EvaluationNATANAVAIDSNBNCPNDNLNEPANERASPNFIPNHLNITHPONLRNMFSNONO 2NOAANOINOMSNO xNPDESNPIASNPLNPRMNPSNRCSNRHPNWRNYOAGOEPOFAOGACOHMOPSNETORDOSHANational Air Toxics AssessmentNavigational AidsNorthboundNoise Compatibility PlanNight-time Day-Night AverageSound LevelNational Environmental Policy ActNew England Regional <strong>Airport</strong>System PlanNational Flood Insurance <strong>Program</strong>National Historic LandmarkNarragansett Indian Tribe HistoricPreservation OfficeNoise Level ReductionNational Marine Fisheries ServiceNitric OxideNitrogen DioxideNational Oceanic and AtmosphericAdministrationNotice of IntentNoise and Operation MonitoringSystemNitrogen OxidesNational Pollutant DischargeElimination SystemNational Plan of Integrated <strong>Airport</strong>SystemsNational Priorities ListNotice of Proposed RulemakingNational Park ServiceNatural Resources ConservationServiceNational Register of Historic PlacesNational Wildlife RefugeNew YorkOfficial Airline GuideOperational Evolution PlanObject Free AreaOpen graded asphaltic concreteOil and/or Hazardous MaterialsAir Traffic Operations NetworkDatabaseChicago/O’Hare International<strong>Airport</strong>Occupational Safety and HealthAdministrationOSTPAHPANYNJPAPIPCBPFCPHLPMPM 10PM 2.5ppmRAILSREILRIRIACRICRMCRIDEMRIDLTRIDOARIDOHRIDOTRIHPHCRIPDESRIPTARISHPORJRNAVRNPRODROFARPATRPZOffice of the Secretary ofTransportationPolycyclic Aromatic HydrocarbonPort Authority of New York and NewJerseyPrecision Approach Path IndicatorPolychlorinated BiphenylPassenger Facility ChargesPhiladelphia International <strong>Airport</strong>Particulate MatterParticulate Matter of 10 microns andsmallerParticulate Matter of 2.5 microns andsmallerParts per millionRunway Alignment Indicator LightsRunway Edge Indicator LightsRhode IslandRhode Island <strong>Airport</strong> CorporationRhode Island Coastal ResourcesManagement CouncilRhode Island Department ofEnvironmental ManagementRhode Island Department of Laborand TrainingRhode Island Department ofAdministrationRhode Island Department of HealthRhode Island Department ofTransportationRhode Island Historic Preservationand Heritage CommissionRhode Island Pollution DischargeElimination SystemRhode Island Public TransitAuthorityRhode Island State HistoricPreservation OfficeRegional JetArea NavigationRequired Navigation PerformanceRecord of DecisionRunway Object Free AreaRNP Parallel Approach TransitionRunway Protection ZoneTable of Contents and Acronyms xxiii July 2011\\mawatr\ev\09228.00\reports\<strong>FEIS</strong>_Final_July_2011\<strong>PVD</strong>_00_TOC_JUL_2011.doc
T.F. <strong>Green</strong> <strong>Airport</strong> <strong>Improvement</strong> <strong>Program</strong>Environmental Impact Statement and Final Section 4(f) EvaluationRSARSIPSACSAMPSBSELSFOSHPOSIDSIPSO 2SPCCSRSSASWPPPTATAAMTAFTAMISTARTDMTIPTMDLTOFATMATRBRunway Safety AreaResidential Sound Insulation <strong>Program</strong>Study Advisory CommissionSpecial Area Management PlanSouthboundSound Exposure LevelSan Francisco International <strong>Airport</strong>State Historic Preservation OfficeStandard Instrument DepartureState Implementation PlanSulfur DioxideSpill Prevention, Containment, andControlState RouteSole Source AquiferStormwater Pollution Prevention PlanTime AboveTotal Airspace and <strong>Airport</strong> ModelerTerminal Area ForecastTotal <strong>Airport</strong> ManagementInformation SystemsTonnage Per Area RatioTransportation Demand ManagementTransportation <strong>Improvement</strong><strong>Program</strong>Total Maximum Daily LoadTaxiway Object Free AreaTraffic Management AdvisorTransportation Research BoardTR-55TRACONU.S.U.S.C.UPSUSACEUSDAUSFWSUSGSUSPSUSTVASIVFRVHBVHTVLAPVMCVMPVMTVOCWAASWHCWSRAWSRDTechnical Release 55 Model for UrbanHydrologyTerminal Radar Approach ControlUnited States of AmericaUnited States CodeUnited Parcel ServiceUnited States Army Corps ofEngineersUnited States Department ofAgricultureUnited States Fish and WildlifeServiceUnited States Geological SurveyUnited States Postal ServiceUnderground Storage TanksVisual Approach Slope IndicatorsVisual Flight RuleVanasse Hangen Brustlin, Inc.Vehicle Hours TraveledVolunteer Land Acquistion <strong>Program</strong>Visual Meteorological ConditionsVegetation Management PlanVehicle Miles TraveledVolatile Organic CompoundWide Area Augmentation SystemWarwick Historic CemeteriesWild and Scenic Rivers ActWarwick Station RedevelopmentDistrictTable of Contents and Acronyms xxiv July 2011\\mawatr\ev\09228.00\reports\<strong>FEIS</strong>_Final_July_2011\<strong>PVD</strong>_00_TOC_JUL_2011.doc
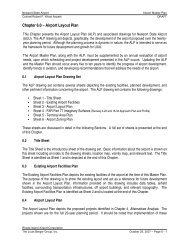
T.F. <strong>Green</strong> <strong>Airport</strong> <strong>Improvement</strong> <strong>Program</strong>Environmental Impact Statement and Final Section 4(f) Evaluation1Introduction and Background1.1 IntroductionThe Rhode Island <strong>Airport</strong> Corporation (RIAC) is proposing a program of improvements at Theodore Francis<strong>Green</strong> <strong>Airport</strong> (T.F. <strong>Green</strong> <strong>Airport</strong> or ‘the <strong>Airport</strong>’) to enhance safety at the airport and to enhance the efficiencyof the <strong>Airport</strong> and the New England Regional <strong>Airport</strong> System. As the lead federal agency, in compliance withthe National Environmental Policy Act of 1969 (NEPA), 1,2,3,4 the Federal Aviation Administration (FAA) hasdetermined that it was necessary to prepare a Draft Environmental Impact Statement (DEIS) because of thepotential for significant environmental impacts associated with the proposed T.F. <strong>Green</strong> <strong>Airport</strong> <strong>Improvement</strong><strong>Program</strong>. The DEIS was filed in July 2010 and a subsequent Final Environmental Impact Statement (<strong>FEIS</strong>) ispresented herein. This document also includes a final Department of Transportation (DOT) Section 4(f)Resources evaluation. 5 This chapter provides an overview of the components of the T.F. <strong>Green</strong> <strong>Airport</strong><strong>Improvement</strong> <strong>Program</strong>, including a description of the <strong>Airport</strong>’s history and rationale for proposing the<strong>Improvement</strong> <strong>Program</strong>. An overview of the process that was followed in preparing this <strong>FEIS</strong> and a descriptionof the contents of this <strong>FEIS</strong> is provided.1.2 Proposed T.F. <strong>Green</strong> <strong>Airport</strong> <strong>Improvement</strong> <strong>Program</strong>RIAC is proposing a program of improvements for T.F. <strong>Green</strong> <strong>Airport</strong> in Warwick, Rhode Island, the purpose ofwhich is to provide facilities that would conform to current FAA airport design standards to enhance airportsafety and efficiency of the <strong>Airport</strong> as well as the New England Regional <strong>Airport</strong> System to more fully meet thecurrent and anticipated demand for aviation services. The T.F. <strong>Green</strong> <strong>Airport</strong> <strong>Improvement</strong> <strong>Program</strong> evaluatedin this <strong>FEIS</strong> includes safety projects (enhance Runway 16-34 Runway Safety Areas (RSAs); removal ofHangar No. 1; relocate Taxiway C;) and efficiency projects (extend Runway 5-23; expand passenger terminal1 National Environmental Policy Act of 1969, as amended.2 Federal Aviation Administration Order 1050.1E, Change 1, Environmental Impacts: Policies and Procedures, U.S. Department of Transportation, March 20,2006.3 FAA Order 5050.4B, National Environmental Policy Act (NEPA) Implementing Instructions for <strong>Airport</strong> Actions, FAA, United States Department ofTransportation, April 28, 2006.4 Environmental Desk Reference for <strong>Airport</strong> Actions, FAA, October 5, 2007.5 U.S. Department of Transportation Act of 1966, Section 4(f), 49 U.S.C., section 303(c).Chapter 1 – Introduction and Background 1-1 July 2011\\mawatr\ev\09228.00\reports\<strong>FEIS</strong>_Final_July_2011\<strong>PVD</strong>_CH01_Introduction_JUL_2011.doc
T.F. <strong>Green</strong> <strong>Airport</strong> <strong>Improvement</strong> <strong>Program</strong>Environmental Impact Statement and Final Section 4(f) Evaluationand parking facilities; construct new ground support equipment facilities, new belly cargo facility and new fuelfarm facilities; construct a new Integrated Cargo Facility; and reconfigure terminal access roadways).T.F. <strong>Green</strong> <strong>Airport</strong> is a critical economic driver for the City of Warwick, the State of Rhode Island, and theNew England region. Despite the current economic downturn, anticipated long-term increases in passengerdemand and aircraft operations require local and regional improvements at our nation’s airports to meetexisting and long-term needs. Long-term forecasts anticipate continued growth in air passenger traffic atT.F. <strong>Green</strong> <strong>Airport</strong> and the New England region. Anticipated air passenger demand at the <strong>Airport</strong> is predictedto reach approximately 5.8 million passengers by 2020 and 6.5 million passengers by 2025 (refer to Chapter 2,Purpose and Need, for the passenger and operations forecasts).The proposed airport enhancements, including extending primary Runway 5-23 to allow for non-stop flights tothe West Coast, have the potential to serve an additional approximately 767,800 passengers a year by 2020. Thiswould result in additional economic benefits, including new jobs, increased on- and off-<strong>Airport</strong> spending andbusiness revenues, and increased state tax revenue. The extension of Runway 5-23 would enhance the efficiencyof both T.F. <strong>Green</strong> <strong>Airport</strong> and the New England regional system.Based on the environmental impact analysis conducted in support of this <strong>FEIS</strong>, the T.F. <strong>Green</strong> <strong>Airport</strong><strong>Improvement</strong> <strong>Program</strong> Alternatives would result in significant environmental impacts; however, the analysisshows that there is a range of reasonable mitigation opportunities to address those impacts.T.F. <strong>Green</strong> <strong>Airport</strong> is owned by the State of Rhode Island and operated by RIAC. Designated by the FAA as amedium-hub 6 commercial service airport, in 2010 T.F. <strong>Green</strong> <strong>Airport</strong> served approximately 3.9 million enplanedand deplaned passengers with approximately 220 daily aircraft operations (an aircraft landing or departure). 7The <strong>Airport</strong> plays a vital role in fulfilling anticipated local, New England regional, and national demands ofbusiness and leisure travel, as well as providing air cargo service capacity for the eastern New England region.According to a 2006 Economic Impact Study, 8 T.F. <strong>Green</strong> <strong>Airport</strong> is a critical catalyst for economic growth in theState of Rhode Island, generating directly and indirectly approximately $1.96 billion in economic activity and$603.9 million in earnings. The <strong>Airport</strong> provides over 2,000 jobs directly; and indirectly supports hotels, rentalcar agencies, parking facilities, gas stations, and other travel-related businesses in the host city of Warwick.T.F. <strong>Green</strong> <strong>Airport</strong> occupies 1,100 acres of land and is located in the dense, urban City of Warwick, RhodeIsland, six miles south of the City of Providence (Figures 1-1 and 1-2). T.F. <strong>Green</strong> <strong>Airport</strong> is generally boundedby <strong>Airport</strong> Road to the north, Industrial Drive to the east/southeast, Main Avenue (State Route 113) to thesouth, and Post Road (U.S. Route 1) to the west. The <strong>Airport</strong> is accessible via several major regional and nationalroadways, including Interstate Highways I-95 and I-295, U.S. Route 1, and State Routes 10 and 37. The mainaccess entry to the <strong>Airport</strong> is off Post Road. Warwick Pond, Buckeye Brook, and associated wetland systems arelocated north and east of the <strong>Airport</strong> property. Adjacent land uses include residential development to the6 The FAA defines a medium hub airport as a commercial service airport with more than 10,000 passenger boardings each year, handling 0.25 to 1 percent of thecountry's annual passenger boardings (accessed at www.faa.gov/airports/planning_capacity/passenger_allcargo_stats/categories/ on April 5, 2010).7 T.F. <strong>Green</strong> <strong>Airport</strong> – Monthly <strong>Airport</strong> Passenger Activity Summary, Rhode Island <strong>Airport</strong> Corporation, December 2010.8 Rhode Island <strong>Airport</strong> Economic Impact Study Update 2006, Rhode Island <strong>Airport</strong> Corporation, 2006.Chapter 1 – Introduction and Background 1-2 July 2011\\mawatr\ev\09228.00\reports\<strong>FEIS</strong>_Final_July_2011\<strong>PVD</strong>_CH01_Introduction_JUL_2011.doc
T.F. <strong>Green</strong> <strong>Airport</strong> <strong>Improvement</strong> <strong>Program</strong>Environmental Impact Statement and Final Section 4(f) Evaluationsouthwest, west, southeast, and east; commercial and industrial development along Post Road and <strong>Airport</strong>Road; and industrial development along Industrial Drive.The <strong>Airport</strong> also is accessible via Rhode Island Public Transit Authority (RIPTA) and the Massachusetts BayTransportation Authority (MBTA) bus lines and the new InterLink facility, formerly known as the IntermodalStation, which opened on October 27, 2010. InterLink offers multiple transportation functions, including: RIPTAbus service; MBTA commuter train service traveling between Warwick, Providence, and Boston; a consolidatedcar rental facility, and parking (for commuter rail service only); and a direct pedestrian link to the <strong>Airport</strong>terminal. The rail platform is integrated with a consolidated rental car facility that houses airport rental caroperations. The six-level parking garage includes approximately 640 spaces for short-term rail commuterparking and an equivalent of approximately 2,500 spaces for rental car operators. Bus pulloffs for RIPTAIntercity bus Route #8 are provided on Jefferson Boulevard. The planned Warwick Station RedevelopmentDistrict (WSRD), which surrounds the InterLink, includes approximately 1.5 million gross square feet consistingof approximately 640,000 square feet of office uses, 640,000 square feet of hotel/conference uses, and 220,000square feet of convenience retail/entertainment uses, subject to City approval. 9The <strong>Airport</strong> has two runways: the primary runway, Runway 5-23 (7,166 feet), and the secondary runway,Runway 16-34 (6,081 feet) (Figure 1-3). T.F. <strong>Green</strong>’s 352,000 square foot passenger terminal building contains theticketing, baggage claim, and surface transportation areas; security services; Federal Inspection Services;concessions area; two concourses with passenger hold rooms; 22 commercial air service gates with 16 jetbridges; and RIAC’s administrative offices (Figure 1-4). The existing terminal facility provides approximately16,000 square feet of passenger processing and support space per aircraft gate position. These facilities includeall areas required to process the movement of commercial airline passengers and their baggage as well asproviding convenience and comfort in terms of concessions, restrooms, and building mechanical systems. Inaddition to the terminal, airport facilities include hangars, a fuel farm, air cargo, ground service equipment(GSE) facilities, an aircraft rescue and fire fighting facility, three on-<strong>Airport</strong> parking garages (Garage A,Garage B, and Garage C) and two parking lots (Hourly Lot D and Long-Term Lot E) with a total capacity of8,422 spaces. All of these assets are located on State of Rhode Island property.1.3 T.F. <strong>Green</strong> <strong>Airport</strong> <strong>Improvement</strong> <strong>Program</strong> Background and HistoryIn recognizing the importance of protecting the environment, the U.S. Congress passed NEPA in 1969. NEPArequires federal agencies to analyze and consider alternatives to, and the environmental impacts of, majorfederal actions; to disclose and consider mitigation for significant impacts; and to provide interested partieswith an opportunity to participate in the environmental review process. FAA approval of changes to theT.F. <strong>Green</strong> <strong>Airport</strong> Layout Plan (ALP) 10 and subsequent federal funding through the <strong>Airport</strong> <strong>Improvement</strong><strong>Program</strong> (AIP) are federal actions requiring compliance with NEPA. RIAC cannot undertake any new physicalimprovements until they are approved and depicted on an updated ALP. When selecting a preferred9 The Warwick Station Redevelopment District development program has been expanded from 1.1 million gross square feet (gsf) to 1.5 million gsf, accordingto the City of Warwick Planning Department (correspondence dated February 2011).10 An <strong>Airport</strong> Layout Plan is a planning document for airports and is required for all public airports that receive state or federal funding. It shows existingconditions, near-term and long-term airport development. The latest FAA-approved <strong>Airport</strong> Layout Plan for T.F. <strong>Green</strong> <strong>Airport</strong> is dated April 18, 2002.Chapter 1 – Introduction and Background 1-3 July 2011\\mawatr\ev\09228.00\reports\<strong>FEIS</strong>_Final_July_2011\<strong>PVD</strong>_CH01_Introduction_JUL_2011.doc
T.F. <strong>Green</strong> <strong>Airport</strong> <strong>Improvement</strong> <strong>Program</strong>Environmental Impact Statement and Final Section 4(f) Evaluationalternative, the FAA considers the alternative that best meets the purpose and need of the Proposed Action. TheFAA also considers its statutory mission and environmental, technical, and economic factors.RIAC is responsible for developing, maintaining, and operating the <strong>Airport</strong> to ensure that it functions safelyand efficiently as Rhode Island’s primary commercial passenger airport. RIAC also conducts planning efforts toassist in identifying the facility needs and enhancements that will allow T.F. <strong>Green</strong> <strong>Airport</strong> to functionaccording to its role in the region. In the New England Regional <strong>Airport</strong> System Plan (NERASP), the FAA hasidentified the <strong>Airport</strong> as an integral component of the Rhode Island, New England region, and national airtransportation networks. 11The improvement concepts comprising the T.F. <strong>Green</strong> <strong>Airport</strong> <strong>Improvement</strong> <strong>Program</strong> were identified in amaster planning process. The environmental review process, of which this <strong>FEIS</strong> is a part, was initiated shortlyafter the master plan concepts were identified. The <strong>FEIS</strong> provides a context in which to evaluate theenvironmental consequences of the proposed enhancements. The timeline of the stages of the process include:• 1999 to 2002 – Master Plan Update prepared• 2002 – NEPA Process and EIS initiated• 2003 –Short-term and long-term operations (for improving efficiencies, including a runway extension up to9,500 feet) revisited and EIS postponed• 2004 – Master Plan Supplement prepared• 2005 – NEPA process and EIS re-initiated• 2010 – DEIS published• 2011 – <strong>FEIS</strong> published• 2011 – Record of Decision issued (pending)In 1999, RIAC began preparing an update to the <strong>Airport</strong>’s Master Plan. The goal of the process was to conductan assessment of the impact of the facility and infrastructure enhancements required to meet safetyrequirements and accommodate the anticipated demand at T.F. <strong>Green</strong> <strong>Airport</strong> (throughout a 20-year planningperiod through 2020). The Master Plan Update, released in 2002, evaluated the existing infrastructure andfacilities at T.F. <strong>Green</strong> <strong>Airport</strong> with consideration of current and anticipated airport activity and marketdemand. The Master Plan Update effort identified facility deficiencies and presented an improvement strategythat would allow T.F. <strong>Green</strong> <strong>Airport</strong> to accommodate the anticipated levels of aviation activity and relatedfunctions and to enhance the overall safety and efficiency of the <strong>Airport</strong>.Following the completion of the 2002 T.F. <strong>Green</strong> Master Plan Update, the FAA determined it necessary toprepare an EIS for many of the proposed Master Plan improvement projects because of potential environmentalimpacts (including wetlands and community disruption from the potential relocation of a portion ofU.S. Route 1). The FAA initiated the NEPA process and the preparation of an EIS, which included publicscoping and agency coordination (meetings held on July 25, 2002). At that time, the proposed project elementsonly addressed runway length needs for the short-term. In 2003, the EIS was put on hold to address longer-term11 The New England Regional <strong>Airport</strong> System Plan, New England <strong>Airport</strong> Coalition, Fall 2006, Page 16.Chapter 1 – Introduction and Background 1-4 July 2011\\mawatr\ev\09228.00\reports\<strong>FEIS</strong>_Final_July_2011\<strong>PVD</strong>_CH01_Introduction_JUL_2011.doc
T.F. <strong>Green</strong> <strong>Airport</strong> <strong>Improvement</strong> <strong>Program</strong>Environmental Impact Statement and Final Section 4(f) Evaluationoptions for improving efficiencies (including a runway extension up to 9,500 feet). In 2004, the T.F. <strong>Green</strong>Master Plan project considerations were supplemented to include a longer runway. The EIS, reinitiated in 2005,evaluated and assessed impacts of projects identified in the March 2004 T.F. <strong>Green</strong> Master Plan Supplement.The 2005 NEPA process resumed with the February 8, 2005 public scoping meeting and continues through thisfiling. Key changes to the previous 2002 EIS scope include an expanded area of study, updated analysis yearsand forecasts, and responses to regulatory changes.The 2004 T.F. <strong>Green</strong> Master Plan Supplement forms the starting point for identifying the preliminary list ofproposed projects that are the subject of this <strong>FEIS</strong> and that RIAC is proposing to undertake over the next severalyears to enhance safety and efficiency to meet anticipated demand through 2020. The T.F. <strong>Green</strong> <strong>Airport</strong><strong>Improvement</strong> <strong>Program</strong> that is the subject of this <strong>FEIS</strong> consists of key elements with the following needs:• Safety Enhancement Elements Enhance airfield safety by upgrading the crosswind Runway 16-34 RSAs to meet current FAArequirements 12Demolish Hangar No. 1 to remove an airspace penetrationRelocate Taxiway C to increase the current lateral separation between Runway 16-34 and Taxiway C tomeet current FAA standard criteria• Efficiency Enhancement Elements Extend primary Runway 5-23 to fulfill airport system needs and accommodate existing and anticipateddemand for commercial non-stop service to the West Coast Add up to seven additional commercial service gates to enhance passenger processing efficiency 13Relocate and replace existing belly cargo facility to accommodate space needsReconfigure the on-airport roadway system to improve traffic flowProvide additional passenger and employee parking facilities to meet seasonal needsExpand the airport fuel storage facility to maintain an on-airport fuel supply of five to seven daysProvide additional GSE facilities for maintenance and storage to meet current space needsExpand the Integrated Cargo Facilities to meet anticipated demandThe FAA prepared the DEIS, published in July 2010, to identify the potential environmental effects associatedwith the construction and operation of potential improvements to T.F. <strong>Green</strong> <strong>Airport</strong>. A joint public hearingwith the U.S. Army Corps of Engineers (USACE) was held on the DEIS on August 17, 2010 at the CommunityCollege of Rhode Island-Knight Campus Auditorium. The public hearing was an opportunity for members ofthe public to provide comments on the DEIS. Approximately 380 people attended and 50 spoke and/or12 Improving the Runway 16-34 RSA would require shifting or relocating navigational aids that support that runway.13 Since the DEIS, the need for commercial service gates has been changed from “8” to “up to 7” gates taking anticipated passenger demand into account.Chapter 1 – Introduction and Background 1-5 July 2011\\mawatr\ev\09228.00\reports\<strong>FEIS</strong>_Final_July_2011\<strong>PVD</strong>_CH01_Introduction_JUL_2011.doc
T.F. <strong>Green</strong> <strong>Airport</strong> <strong>Improvement</strong> <strong>Program</strong>Environmental Impact Statement and Final Section 4(f) Evaluationsubmitted written comments. All oral comments presented in person at the public hearing were recorded by astenographer and a transcript of comments was prepared. Appendix A, Responses to Comments, includes copiesof all comments received on the DEIS, as well as responses to each individual comment.After receiving all of the comments on the DEIS raised by stakeholders in the NEPA process, as well as thepublic, the FAA prepared and issued this <strong>FEIS</strong>, which incorporates and addresses these comments as well asidentifies the Preferred Alternative, the Environmentally Preferable Alternative, RIAC’s Proposed Action, andan appropriate range of mitigation measures. Based upon the information in this <strong>FEIS</strong>, the FAA will issue aRecord of Decision (ROD) that documents findings, projected environmental impacts, and mitigation measuresto reduce any potential environmental effects. The ALP would be updated and approved by the FAA afterissuance of the ROD.Since the preparation of the T.F. <strong>Green</strong> <strong>Airport</strong> NEPA process resumed in 2005, there has been changes in landuse in the <strong>Airport</strong> study area and passenger activity levels at the <strong>Airport</strong> have declined. Changes at T.F. <strong>Green</strong><strong>Airport</strong> include the construction of an Airfield Maintenance Facility, a Compressed Natural Gas (CNG) Station,and a parallel Taxiway M. In the areas surrounding the airport, RIAC has continued its Part 150 NoiseCompatibility <strong>Program</strong> (NCP) 14 and acquired eligible residential properties that are impacted by aircraft noise.The acquisition phase of eligible residential properties was completed in 2009 (referred to as the Completed Part150 Voluntary Land Acquisition <strong>Program</strong>, or VLAP). In early 2010, RIAC continued the Part 150 NCP based onthe updated Noise Exposure Map (NEM) (accepted by the FAA on July 27, 2010; referred to as the Current Part150 VLAP). Also in 2010, InterLink, located west of the airport entrance and Post Road, was completed. The newfacility provides direct pedestrian access from the T.F. <strong>Green</strong> terminal to MBTA commuter line, RIPTA Intercitybus lines (in addition to bus lines that run directly to and from the airport terminal), and new consolidatedrental car facilities.Additionally, <strong>Airport</strong> operations and the condition of aviation industry as a whole fluctuates with changes inthe national and regional economies. Since 2005, airline business models have also shifted. Low-cost carriers(LCCs) are strong in today’s national aviation market, and legacy air carriers are restructuring and cutting costs sothat their business models are likely to become more in line with those of the LCCs. The future competitionbetween the legacy air carriers and LCCs will add to the volatility of the market as well as influence fare structuresand air service choices.Since the aviation activity forecast was originally prepared in 2004, the national and global economic recessionoccurred in 2008-2009 and affected overall aviation demand. FAA Orders 5050.4B and 1050.1E require that thesponsor and FAA consider new information regarding national, regional or site specific aviation trends thatcould affect the project purpose and need developed for the EIS after the start of the NEPA process. Indicatorsof aviation trends include the annual terminal area forecast (TAF) for the airport, the FAA National AerospaceForecast, regional-specific economic trends, regional airport system factors, and site-specific restraints togrowth.14 Voluntary Land Acquisition <strong>Program</strong> (VLAP) implemented according to the requirements of 14 CFR Part 150, <strong>Airport</strong> Noise Compatibility Planning.Chapter 1 – Introduction and Background 1-6 July 2011\\mawatr\ev\09228.00\reports\<strong>FEIS</strong>_Final_July_2011\<strong>PVD</strong>_CH01_Introduction_JUL_2011.doc
T.F. <strong>Green</strong> <strong>Airport</strong> <strong>Improvement</strong> <strong>Program</strong>Environmental Impact Statement and Final Section 4(f) EvaluationFollowing the issuance of the DEIS in July 2010, the FAA monitored aviation activity and determined that actualand forecasted operations and passenger levels continued to decline at T.F. <strong>Green</strong> <strong>Airport</strong>. It then compared theDEIS aviation activity forecasts with the Draft 2010 TAF for reasonable consistency. This check was performeddue to the rapid changes in the aviation industry. The FAA determined that while the changes did not affect theproject purpose and need, the DEIS forecast was not within the percentage difference criteria. Rather thanresolve the differences FAA updated the forecast. 15 Therefore, the <strong>FEIS</strong> analysis was revised using a No-ActionAlternative forecast based on the Draft TAF (October 2010; see Appendix E.1, Updated Forecast of Aviation Activity) ,which was the latest forecast information available at the time the <strong>FEIS</strong> analysis was performed and was consideredto reflect the recent aviation trends. 16As described in Appendix E.1, Updated Forecast of Aviation Activity, recent and historical trends in the actualnumber of operations at T.F. <strong>Green</strong> <strong>Airport</strong> (based on FAA Air Traffic Control Tower data) suggest that theassumptions used in the 2010 <strong>FEIS</strong> No-Action Forecast (based on the 2010 Draft TAF) are reasonable and thatthe <strong>FEIS</strong> forecast remains within acceptable limits of the 2010 Draft TAF.Appendix E.1, Updated Forecast of Aviation Activity, outlines the forecasting assumptions, methodology, andresults. All adjustments to forecasts used in this EIS took into account variations in anticipated demand relativeto specific aircraft operators identified in the TAF (air carrier, scheduled air taxi, unscheduled air taxi, generalaviation, and military), as described further in Section 3.9.2, <strong>FEIS</strong> Impact Analysis. The 2010 <strong>FEIS</strong> No-ActionForecast shows that operations without the runway extension decreased. The 2010 <strong>FEIS</strong> Forecast for the No-Action Alternative serves as the base forecast for the <strong>FEIS</strong> environmental analysis. Added to this is theIncremental Build Alternative Forecast, which accounts for the additional operations and passengers anticipatedwith the proposed extension of Runway 5-23. The 2010 <strong>FEIS</strong> Total Build Alternative Forecast includes the base2010 <strong>FEIS</strong> No-Action Alternative Forecast and the Incremental Build Alternative Forecast.The forecasted flights associated with the runway extension remained as anticipated in the DEIS becausehistorical regional demand (from T.F. <strong>Green</strong> and Logan <strong>Airport</strong>s) for West Coast service has remained relativelyconstant despite the recent economic downturn and its effect on passenger demand in general. Additionally, atthe time of the forecast update the FAA released a new version of FAA’s Integrated Noise Model (INM 7.0b). 17FAA’s INM is the preferred model for assessing the noise impacts of airport development and determining thesignificance of changes in exposure. Because of anticipated changes based on the revised forecast and a newversion of the model, the FAA determined it was prudent to revise analysis of relevant areas of environmentaland social resources and report on the new analysis in this <strong>FEIS</strong>.The FAA also considered other relevant changed conditions in the EIS analyses under the No-ActionAlternative and Alternatives B2 and B4. In addition, the on-<strong>Airport</strong> projects that were planned at the start of the15 FAA Order 5050.4B and the FAA Master Plan Advisory Circular 150/5070-6B, state that EIS forecasts should be reasonably consistent with the FAA’s TAF.This is defined as within 10 percent of the TAF for the 5-year analytical period and within 15% for the 10-year analytical period. Forecasts not meeting thesecriteria require consultation to resolve differences.16 The Final 2010 TAF became available during the latter stages of the <strong>FEIS</strong> analysis, and differed from the Draft 2010 with lower short-term forecasts.However, FAA evaluated the most recent aviation activity counts recorded by the Air Traffic Control Tower, which were consistent with the Draft 2010 TAF(see Appendix E.1, Updated Forecast of Aviation Activity).17 The latest version, INM version 7.0b, was used to produce DNL 75 dB, DNL 70 dB, DNL 65 dB, and DNL 60 dB contours as well as modeled levels atspecific noise sensitive sites for this analysis.Chapter 1 – Introduction and Background 1-7 July 2011\\mawatr\ev\09228.00\reports\<strong>FEIS</strong>_Final_July_2011\<strong>PVD</strong>_CH01_Introduction_JUL_2011.doc
T.F. <strong>Green</strong> <strong>Airport</strong> <strong>Improvement</strong> <strong>Program</strong>Environmental Impact Statement and Final Section 4(f) EvaluationEIS such as the Airfield Maintenance Facility are now included in the No-Action Alternative analysis conditions.Land acquisition conducted under the Current Part 150 VLAP was updated prior to filing this report and isassumed to be completed by 2015. Anticipated vehicular traffic from InterLink is included in the surfacetransportation analyses. Other likely commercial developments in the City of Warwick are also factored into the<strong>FEIS</strong>. The Baseline Condition described in Chapter 4, Affected Environment, generally represents conditions in2004, with updates where appropriate. Alternatives B2 and B4 are compared to the No-Action Alternative in2015, 2020, and 2025 (as presented in Chapter 5, Environmental Consequences).Since the DEIS, the FAA also identified further wetland impact minimization opportunities and modified thedesign at the Runway 34 End. Impacts to wetlands were reduced by re-examining the location of the PerimeterRoad on the east side of Runway 34 along with the design requirements for the particular type of glide slopeantennae; a critical part of the system that allows aircraft to make instrument landings on the runway. Thisresulted in a further reduction of wetland impact, which is analyzed and reported in this <strong>FEIS</strong>.1.4 Final Section 4(f) and 6(f) EvaluationSection 4(f) of the U.S. Department of Transportation (DOT) Act of 1966 requires DOT agencies to consider impactsits projects will have on certain public resources. These resources, now collectively referred to as Section 4(f)resources, include publicly owned parks, recreation areas, wildlife or waterfowl refuges, or historical propertiesof national, state, or local significance. Similarly, Section 6(f) of the Land and Water Conservation Fund Act of 1964requires that the conversion of lands or facilities acquired or improved with Land and Water Conservationfunds be coordinated with the Department of the Interior. This document includes an evaluation for Section 4(f)and Section 6(f) properties that could be impacted by the T.F. <strong>Green</strong> <strong>Airport</strong> <strong>Improvement</strong> <strong>Program</strong>. It includesan alternatives analysis to avoid use of protected properties, and mitigation measures that would be employedto minimize harm to these properties (see Chapter 7, Final Section 4(f)/Section 6(f) Evaluation).1.5 Reader’s Guide to the Final Environmental Impact StatementThis section describes the contents of the five volumes of the <strong>FEIS</strong>.1.5.1 <strong>FEIS</strong> Volumes 1 and 2Volume 1 of this <strong>FEIS</strong> contains: the purpose and need for the Project (Chapter 2); the alternatives analysis(Chapter 3); documentation of the affected environment (Chapter 4); an evaluation of the environmentalimpacts of the proposed alternatives (Chapter 5); and the proposed mitigation for Alternative B4, as theidentified Preferred Alternative, and Alternative B2 for all significant environmental impacts (Chapter 6). Alsoin Volume 1, Chapter 7, Final Section 4(f)/Section 6(f) Evaluation, assesses the impacted parks, recreation areas,and historical resources, and <strong>Chapters</strong> 8, 9, 10, and 11 provide an overview of the NEPA-required and othercoordination and consultation efforts undertaken as part of this <strong>FEIS</strong>, the list of preparers, a list of recipients towhich this <strong>FEIS</strong> was distributed, and references, respectively. Volume 2 contains all graphics and figuresreferenced in Volume 1. The following sections describe in more detail the contents of the Volume 1 chapters. Toassist the reader, a list of acronyms is provided after the Table of Contents.Chapter 1 – Introduction and Background 1-8 July 2011\\mawatr\ev\09228.00\reports\<strong>FEIS</strong>_Final_July_2011\<strong>PVD</strong>_CH01_Introduction_JUL_2011.doc
T.F. <strong>Green</strong> <strong>Airport</strong> <strong>Improvement</strong> <strong>Program</strong>Environmental Impact Statement and Final Section 4(f) EvaluationChapter 2, Purpose and NeedThis chapter presents the Purpose and Need statement for the proposed enhancements at T.F. <strong>Green</strong> <strong>Airport</strong>.Chapter 3, Alternatives AnalysisThis chapter contains a detailed description of the No-Action Alternative and the eleven individual safety andefficiency elements that comprise the <strong>Improvement</strong> <strong>Program</strong>. A comprehensive six-level screening andevaluation process narrowed the alternative configurations of the program elements down to two:Alternative B2 and Alternative B4. In accordance with NEPA requirements, the No-Action Alternative providesa base scenario against which the impacts of the proposed Alternatives are compared. 18Chapter 4, Affected EnvironmentThis chapter describes the environment in which the <strong>Improvement</strong> <strong>Program</strong> would occur – the BaselineCondition. The Baseline Condition was documented for each environmental resource category, as specified inFAA Order 1050.1E, to provide a context for understanding the impacted resources and to familiarize the readerwith the geography, land use, demographics and economics, and the physical and natural environment. TheBaseline Condition is based on data from 2004 and has been updated with more current information, wherereadily available.Chapter 5, Environmental ConsequencesThis chapter describes the environmental consequences of the Alternatives (No-Action, B2, and B4) for eachapplicable environmental resource category, as specified in FAA Order 1050.1E. The environmental effects(beneficial or adverse) are identified by comparing the proposed Alternatives to the No-Action Alternative inthe same analysis year.Chapter 6, MitigationThis chapter describes the measures considered to minimize, avoid, and/or mitigate potential adverse impactsfrom Alternative B2 and Alternative B4, as identified in Chapter 5. The mitigation measures are presented asthose required to mitigate significant impacts and those proposed to mitigate other impacts. Significant impactswere determined based on guidance for significant adverse effects provided in FAA Order 1050.1E. Otherimpacts were determined based on additional impact analyses as required by local, state, and/or federalregulations, including the short-term construction impacts of Alternatives B2 and B4.Chapter 7, Final Section 4(f)/Section 6(f) EvaluationThis chapter describes U.S. Department of Transportation Act of 1966 Section 4(f) and Land and Water ConservationFund Act Section 6(f) resources within the Study Area that would be impacted by the Build Alternatives. Thischapter includes an alternatives analysis to avoid use of Section 4(f) or Section 6(f) resources, and discussesmitigation measures that could be employed to minimize any identified impacts to protected properties.18 According to FAA Order 1050.1E, Environmental Impacts: Policies and Procedures, NEPA requires a comparison of the future No-Action and future BuildAlternatives to determine those impacts that would be attributed to the proposed project.Chapter 1 – Introduction and Background 1-9 July 2011\\mawatr\ev\09228.00\reports\<strong>FEIS</strong>_Final_July_2011\<strong>PVD</strong>_CH01_Introduction_JUL_2011.doc
T.F. <strong>Green</strong> <strong>Airport</strong> <strong>Improvement</strong> <strong>Program</strong>Environmental Impact Statement and Final Section 4(f) EvaluationChapter 8, Consultation and CoordinationThis chapter summarizes the public involvement process in which federal, state, and local agencies, electedofficials, members of the public, and other interested entities participated. In addition to providing a descriptionof the public outreach and consultation process, this chapter also discusses possible required permits associatedwith the T.F. <strong>Green</strong> <strong>Airport</strong> <strong>Improvement</strong> <strong>Program</strong>.Chapter 9, List of PreparersThis <strong>FEIS</strong> was prepared by the FAA in coordination with RIAC. Technical analyses and documents wereprepared by a team of technical consultants under direction of the FAA. The entities involved with thepreparation of technical analyses and documents, including the personnel and their individual areas ofresponsibility and years of experience are listed in this chapter.Chapter 10, Distribution ListThis chapter lists the federal, state, and city agencies as well as interested parties to which this <strong>FEIS</strong> and FinalSection 4(f) and 6(f) Evaluation was distributed, in accordance with FAA regulations.Chapter 11, ReferencesThis chapter documents the primary references for each chapter of this <strong>FEIS</strong>.Copies of the Executive Summary, <strong>FEIS</strong> as well as the July 2010 DEIS Volumes and technical reports areavailable at Warwick and Cranston libraries and at www.vhb.com/pvd/eis. Information on the EIS is alsoavailable on RIAC’s website at www.pvdairport.com.1.5.2 <strong>FEIS</strong> Volumes 3, 4, and 5Volumes 3 and 4 include the responses to comments on the DEIS (Appendix A) in which all comments receivedon the DEIS have been reproduced with individual responses. Volume 5 includes the federal register notices(Appendix B), key correspondence with regulatory agencies (Appendix C), and materials presented to thepublic (Appendix D). Volume 5 also presents detailed <strong>FEIS</strong> technical analyses supporting purpose and need andalternatives (Appendix E), noise (Appendix F), social and socioeconomic, environmental justice, and children’shealth and safety risks (Appendix G), surface transportation (Appendix H), historic, architectural,archaeological, and cultural resources (Appendix I), Section 4(f) and Section 6(f) (Appendix J), water quality(Appendix K), floodplains (Appendix L), and hazardous materials, solid waste, and pollution prevention(Appendix M).The appendices provide only new and updated technical information since the publication of the DEIS inJuly 2010. The DEIS, provided on the enclosed DVD, contains corresponding appendices and/or technicalreports describing significant technical information pertaining to the project’s purpose and need andalternatives analysis. Reviewers should consult both the DEIS and <strong>FEIS</strong> for full documentation of each topic.Chapter 1 – Introduction and Background 1-10 July 2011\\mawatr\ev\09228.00\reports\<strong>FEIS</strong>_Final_July_2011\<strong>PVD</strong>_CH01_Introduction_JUL_2011.doc
T.F. <strong>Green</strong> <strong>Airport</strong> <strong>Improvement</strong> <strong>Program</strong>Environmental Impact Statement and Final Section 4(f) Evaluation1.5.3 Supporting DEIS Technical ReportsTechnical reports that support the analysis and findings of the DEIS are incorporated by reference into thisdocument and are available on the <strong>FEIS</strong> DVD. CDs are available upon request. Printed copies are available onrequest from the FAA and are part of the agency's Administrative Record. The technical reports include theregulatory context, affected environment, environmental consequences findings for various alternativesscreening levels prior to the <strong>FEIS</strong> analysis, and technical data such as model outputs or tables of findings. Thetechnical reports that were provided as part of the DEIS include:• Noise;• Compatible Land Use;• Social and Socioeconomic, and Environmental Justice, Children’s Health and Safety Risks;• Surface Transportation;• Air Quality;• Historic, Architectural, Archaeological, and Cultural Resources;• Section 4(f) and Section 6(f) Resources• Wetlands and Waterways;• Water Quality;• Fish, Wildlife and Plants;• Floodplains;• Coastal Resources;• Farmlands;• Hazardous Materials and Solid Waste; and• Light Emissions and Visual Environment.The DEIS Technical Reports are provided as part of the <strong>FEIS</strong> DVD. To obtain a CD or printed copy of a DEISTechnical Report, email tfgreen@vhb.com or contact FAA Project Manager, Richard Doucette, at 781-238-7613,or richard.doucette@faa.gov.Chapter 1 – Introduction and Background 1-11 July 2011\\mawatr\ev\09228.00\reports\<strong>FEIS</strong>_Final_July_2011\<strong>PVD</strong>_CH01_Introduction_JUL_2011.doc
T.F. <strong>Green</strong> <strong>Airport</strong> <strong>Improvement</strong> <strong>Program</strong>Environmental Impact Statement and Final Section 4(f) EvaluationThis Page Intentionally Left BlankChapter 1 – Introduction and Background 1-12 July 2011\\mawatr\ev\09228.00\reports\<strong>FEIS</strong>_Final_July_2011\<strong>PVD</strong>_CH01_Introduction_JUL_2011.doc
T.F. <strong>Green</strong> <strong>Airport</strong> <strong>Improvement</strong> <strong>Program</strong>Environmental Impact Statement and Final Section 4(f) Evaluation2Purpose and Need2.1 Purpose and Need OverviewAs the operator of T.F. <strong>Green</strong> <strong>Airport</strong> and five other state-owned airports in Rhode Island, RIAC continually plansfor the development of its facilities to meet aviation and passenger demand. RIAC’s regular planning activities,including the T.F. <strong>Green</strong> <strong>Airport</strong> <strong>Improvement</strong> <strong>Program</strong>, are consistent with its mission statement, which is toprovide safe, efficient, and convenient air transportation for the region, while providing economic opportunitybalanced with environmental stewardship sensitive to the community.Planning for the T.F. <strong>Green</strong> <strong>Airport</strong> <strong>Improvement</strong> <strong>Program</strong> began approximately ten years ago by RIAC undermuch different airline operating conditions and anticipated aviation demand scenarios. As a result, the proposedproject has been refined through the sponsor’s planning process and the FAA’s EIS process to account for changingmarket conditions and needs of the traveling public.T.F. <strong>Green</strong> <strong>Airport</strong> functions as a critical component within the Rhode Island, New England region, and nationalair transportation networks. T.F. <strong>Green</strong> <strong>Airport</strong> is the primary commercial passenger airport for Rhode Island,southeastern Massachusetts, and eastern Connecticut, and is one of three major airports serving the eastern NewEngland region along with Boston-Logan International <strong>Airport</strong> (Logan <strong>Airport</strong>) in Massachusetts, andManchester-Boston Regional <strong>Airport</strong> (Manchester <strong>Airport</strong>) in New Hampshire. Logan <strong>Airport</strong> functions as theprimary gateway in the New England region for international and domestic, long-haul 19 passengers, whileT.F. <strong>Green</strong> and Manchester <strong>Airport</strong>s serve as regional airports. 20Many of the T.F. <strong>Green</strong> <strong>Airport</strong> <strong>Improvement</strong> <strong>Program</strong> plan elements are needed to enhance safety, or to enhancethe efficiency of the <strong>Airport</strong> due to overall aviation (aircraft operations and passenger) demand. However, the roleof T.F. <strong>Green</strong> <strong>Airport</strong> in the New England Regional <strong>Airport</strong> System plays a critical part in defining the need forsome of the proposed T.F. <strong>Green</strong> <strong>Airport</strong> <strong>Improvement</strong> <strong>Program</strong> plan elements. Within the eastern New Englandregion in particular, T.F. <strong>Green</strong>, Logan, and Manchester <strong>Airport</strong>s provide different air services but have19 For the purposes of this <strong>FEIS</strong>, “long-haul” refers to U.S. West Coast and international (except eastern Canada) air service.20 For the purposes of this <strong>FEIS</strong>, “regional airports” refers to commercial service airports in New England other than Logan International <strong>Airport</strong> (consistent withthe New England Regional <strong>Airport</strong> System Plan, 2006).Chapter 2 – Purpose and Need 2-1 July 2011\\mawatr\ev\09228.00\reports\<strong>FEIS</strong>_Final_July_2011\<strong>PVD</strong>_CH02_P&N_JUL_2011.doc
T.F. <strong>Green</strong> <strong>Airport</strong> <strong>Improvement</strong> <strong>Program</strong>Environmental Impact Statement and Final Section 4(f) Evaluationoverlapping service areas. The FAA and the various airport operators have conducted studies to guide properdevelopment of the regional airport system in order to avoid an “over-reliance” 21 on Logan <strong>Airport</strong> and addressaircraft delays 22 at the major Boston airport. Within the New England region, passenger choice of airports isdetermined primarily by proximity. Other factors include airport congestion, ease of access, lower airline fares,and availability of non-stop flights. 23Recent evidence shows a considerable decrease in passengers using connecting flights between T.F. <strong>Green</strong> <strong>Airport</strong>and specific West Coast markets (where no non-stop, service is available) when new low-cost carrier (LCC)non-stop service has been initiated from Logan <strong>Airport</strong>. The efficiency of the New England Regional <strong>Airport</strong>System depends in part on the ability of RIAC to minimize passenger migration from T.F. <strong>Green</strong> <strong>Airport</strong> to Logan<strong>Airport</strong> to the greatest extent practical. This is consistent with the Logan <strong>Airport</strong> Airside <strong>Improvement</strong>s PlanningProject EIS 24 , FAA’s Record of Decision on the Logan <strong>Airport</strong> Airside <strong>Improvement</strong>s Planning Project EIS, 25 and theNew England Regional <strong>Airport</strong> System Plan (NERASP). 26 Although there remains strong demand for West Coastservice from the overlapping T.F. <strong>Green</strong> and Logan <strong>Airport</strong> service areas, the airfield facilities at T.F. <strong>Green</strong> <strong>Airport</strong>must be enhanced to more fully optimize the potential for airlines to initiate non-stop service.A summary of the T.F. <strong>Green</strong> facility requirements that are discussed in detail in Section 2.3 is provided inTable 2-1. As determined by the facility requirements, the purpose of the T.F. <strong>Green</strong> <strong>Airport</strong> <strong>Improvement</strong><strong>Program</strong> is to:• Enhance <strong>Airport</strong> safety.• Enhance the efficiency of the <strong>Airport</strong> and the New England Regional <strong>Airport</strong> System, to more fully meet thecurrent and anticipated demand for aviation services.21 Logan International <strong>Airport</strong> Airside <strong>Improvement</strong>s Planning Project EIS, Boston, Massachusetts; FAA, New England Region; 2002.22 Record of Decision; Airside <strong>Improvement</strong>s Planning Project; Logan International <strong>Airport</strong>, Boston, Massachusetts; FAA, New England Region, August 2, 2002,page 6.23 The New England Regional <strong>Airport</strong> System Plan, Draft Technical Paper II-1: Survey Methodology, October 2004.24 Logan International <strong>Airport</strong> Airside <strong>Improvement</strong>s Planning Project EIS, Boston, Massachusetts; FAA, New England Region; 2002.25 Record of Decision; Airside <strong>Improvement</strong>s Planning Project; Logan International <strong>Airport</strong>, Boston, Massachusetts; FAA, New England Region, August 2, 2002,page 6.26 The New England Regional <strong>Airport</strong> System Plan, New England <strong>Airport</strong> Coalition, Fall 2006, page 30.Chapter 2 – Purpose and Need 2-2 July 2011\\mawatr\ev\09228.00\reports\<strong>FEIS</strong>_Final_July_2011\<strong>PVD</strong>_CH02_P&N_JUL_2011.doc
T.F. <strong>Green</strong> <strong>Airport</strong> <strong>Improvement</strong> <strong>Program</strong>Environmental Impact Statement and Final Section 4(f) EvaluationTable 2-1Summary of T.F. <strong>Green</strong> <strong>Airport</strong> Facility RequirementsArea of Need Facility Requirement JustificationSafety Runway 16-34 Safety Areas (RSAs) andpavement rehabilitationRSAs: FAA Advisory Ci rcular (AC) 150/5300-13, Change 15, Ai rportDesign; 14 CFR Part 139, Certification of <strong>Airport</strong>s, Section139.309;Public Law 109-115; FAA Order 5200.8, Runway Safety Area<strong>Program</strong>Rehabilitati on of Runway 16-34 pavementTaxiway C RelocationFAA AC 150/5300-13 – separation requirements between runwaysand taxiwaysRemoval of Hangar No. 1FAA AC 150/5300-13 – runway obstacle free area requirements;14 CFR Part 77, Objects Affecting Navigable Ai rspace – obstructionto air navigationEfficiency Primary Runway 5-23 l engthening Enhance effici ency of New England Regional Ai rport System, tomore fully meet the current and anticipated demand for aviationservicesAdditional air carrier gatesForecast enplaned passengersTerminal concourse expansionForecast enplaned and deplaned passengersBelly cargo facili ty replacement Accommodate proposed termi nal and apron expansi on and existingspace needsIntegrated cargo facili ty expansi on Existing and antici pated cargo demandGround Support Equipment maintenancefacility expansionExisting and antici pated air carri er and commuter aircraft demandFuel Farm expansi on Existing and antici pated commerci al aircraft demandTerminal Loop Roadway i mprovements Deteriorating traffic conditi onsLong-term parking facility expansi on Antici pated passenger and employee parki ng demandSources: Federal Aviation Administration Advisory Circular 150/5300-13, <strong>Airport</strong> Design; 14 CFR Part 139, Certification of <strong>Airport</strong>s; Public Law 109-115, Transportation,Treasury, Housing and Urban Development, the Judiciary, the District of Columbia, and Independent Agencies Appropriations Act, 2006, November 30, 2005; FAAOrder 5200.8, Runway Safety Area <strong>Program</strong>; 14 CFR Part 77, Objects Affecting Navigable Airspace; T.F. <strong>Green</strong> <strong>Airport</strong> Master Plan Update, Landrum & Brown, Inc.,2002; T.F. <strong>Green</strong> <strong>Airport</strong> Master Plan Supplement, Landrum & Brown, Inc., 2004; The New England Regional <strong>Airport</strong> System Plan, New England <strong>Airport</strong> Coalition,Fall 2006; Record of Decision; Airside <strong>Improvement</strong>s Planning Project; Logan International <strong>Airport</strong>, Boston, Massachusetts; FAA, New England Region,August 2, 2002; Vanasse Hangen Brustlin, 2011.2.2 <strong>Airport</strong> BackgroundT.F. <strong>Green</strong> <strong>Airport</strong> is owned by the State of Rhode Island, and operated by RIAC, a quasi-state corporation. RIACalso operates the five other state-owned airports in Rhode Island. The development of alternatives for theT.F. <strong>Green</strong> <strong>Airport</strong> <strong>Improvement</strong> <strong>Program</strong> is motivated by, and consistent with, RIAC’s mission statement, whichis to provide safe, efficient, and convenient air transportation for the region, while providing economicopportunity balanced with environmental stewardship sensitive to the community.Chapter 2 – Purpose and Need 2-3 July 2011\\mawatr\ev\09228.00\reports\<strong>FEIS</strong>_Final_July_2011\<strong>PVD</strong>_CH02_P&N_JUL_2011.doc
T.F. <strong>Green</strong> <strong>Airport</strong> <strong>Improvement</strong> <strong>Program</strong>Environmental Impact Statement and Final Section 4(f) Evaluation2.2.1 Passenger and Aircraft ActivityLow cost carriers (LCCs) have had an influential role on the passenger demand at T.F. <strong>Green</strong> <strong>Airport</strong> and theNew England region. Between 1990 and 2004, air passenger traffic at T.F. <strong>Green</strong> <strong>Airport</strong> grew 132 percent from2.4 million passengers 27 in 1990 to 5.5 million in 2004. 28 After a decrease in aviation passenger demand nationwidedue to economic conditions in 2008-2009, refined long-term forecasts continue to anticipate modest growth in airpassenger traffic at T.F. <strong>Green</strong> <strong>Airport</strong> and the New England region. Air passenger demand at the <strong>Airport</strong> ispredicted to reach approximately 5.8 million passengers by 2020, which is consistent with FAA aviation forecastsavailable at the time of the <strong>FEIS</strong> analysis. 292.2.1.1 Role of Low Cost Carriers at T.F. <strong>Green</strong> <strong>Airport</strong>Southwest Airlines’ inauguration of LCC services from T.F. <strong>Green</strong> <strong>Airport</strong> in 1996 caused a period of increasedgrowth of air traffic. This initially resulted both from the capture of passengers who had previously usedLogan <strong>Airport</strong> and shifted to T.F. <strong>Green</strong> <strong>Airport</strong> to take advantage of the lower fares offered by the LCC, andthrough altogether new traffic generated by the so-called “Southwest effect”. The key concept of the “Southwesteffect” is that when a LCC enters a market, the market itself changes, and demand usually grows dramatically dueto the introduction of lower airfares that induces passenger demand for recreational and other discretionary travelas well as some additional business travel.However, the recent increase in LCC service, 30 coupled with new non-stop West Coast market offerings by LCCs atLogan <strong>Airport</strong>, and competition for legacy carriers 31 has caused shifts in air traffic from T.F. <strong>Green</strong> <strong>Airport</strong>. Forexample, some passengers are choosing to fly out of Logan <strong>Airport</strong> instead of T.F. <strong>Green</strong> <strong>Airport</strong> to take advantage ofnon-stop flights to specific markets, even though some of these passengers live within T.F. <strong>Green</strong> <strong>Airport</strong>’s primaryservice or catchment area. Also, in May 2011 Southwest Airlines finalized its acquisition of AirTran Airways, anotherLCC that provides service at Logan <strong>Airport</strong>. However, it is unclear at this time how the merger would affectSouthwest Airlines service at T.F. <strong>Green</strong> or Logan <strong>Airport</strong>s.While LCCs are very strong in today’s national market, legacy air carriers are restructuring and cutting costs so thattheir business models are likely to become more in line with those of the LCCs. The anticipated competition betweenthe legacy carriers and LCCs will add to the volatility of the market, influence low fares, and service choices. Federallaw allows air carriers’ access to commercial service markets of their choice, where appropriate facilities are available.Because the business models of the airlines are in constant flux, an airport must remain flexible in the types offacilities it provides to accommodate various aircraft types and routes for air carriers.2.2.1.2 ForecastsAviation activity forecasts are the basis for determining facility requirements and evaluation of potentialdevelopment alternatives. Forecasts are based on a variety of factors, including historical trends, examination ofexisting and anticipated economic, technological, and other operating considerations. They reflect an expertise andinformed context for projecting anticipated demand levels in order to conduct appropriate mid- and long-term27 The term “passengers” refers to enplaned (departing) and deplaned (arriving) passengers.28 T.F. <strong>Green</strong> <strong>Airport</strong> – Monthly <strong>Airport</strong> Passenger Activity Summary, Rhode Island <strong>Airport</strong> Corporation, December 2004.29 Draft Terminal Area Forecasts, FAA, 2010 (see Appendix E.1, Updated Forecast of Aviation Activity). 30 LCCs operating at Logan include Southwest Airlines, JetBlue, AirTran Airways, Spirit Airlines, and Virgin America.31 Legacy carriers are airlines that flew interstate routes prior to the Airline Deregulation Act of 1978.Chapter 2 – Purpose and Need 2-4 July 2011\\mawatr\ev\09228.00\reports\<strong>FEIS</strong>_Final_July_2011\<strong>PVD</strong>_CH02_P&N_JUL_2011.doc
T.F. <strong>Green</strong> <strong>Airport</strong> <strong>Improvement</strong> <strong>Program</strong>Environmental Impact Statement and Final Section 4(f) Evaluationfacility improvement planning and development. Aviation activity forecasts were prepared for T.F. <strong>Green</strong> <strong>Airport</strong>as part of a strategic master planning process to guide anticipated development at the <strong>Airport</strong>. The forecast andsubsequent development of alternatives to address facility needs are initial steps in the planning process. Thesesteps are designed to allow RIAC to respond adequately with new efficiency-related facilities (e.g., automobileparking facilities) to be implemented when they are necessary as the anticipated aviation demand materializes,and not after the fact when demand already exceeds capacity, resulting in operating inefficiencies. <strong>Airport</strong> safetyprojects, such as those comprising part of the T.F. <strong>Green</strong> <strong>Airport</strong> <strong>Improvement</strong> <strong>Program</strong>, do not rely on existing orforecast aviation demand levels for justification. The need for airport safety-related projects is based on meetingFAA airport design standards.The original forecast of aviation activity developed for this EIS was based on realistic assumptions andmethodologies at the time it was developed in 2004. FAA Orders 5050.4B and 1050.1E require the use of the latestavailable planning information at the time the NEPA process starts. The FAA confirmed that the original EISforecast developed in 2004 was consistent with the latest published FAA Terminal Area Forecast (TAF) when theEIS process began in 2005. 32 The forecast was demand-oriented because it considered the availability of servicesfrom the <strong>Airport</strong> as well as the two other major airports serving the eastern New England region (Logan andManchester <strong>Airport</strong>s), and the differences in ticket prices and services offered at the three airports. The forecastalso represented the aircraft operational demand and passenger demand with T.F. <strong>Green</strong> <strong>Airport</strong>’s currentfacilities. The forecast estimated that total passengers using T.F. <strong>Green</strong> <strong>Airport</strong> would increase from 5.5 million in2004 to approximately 9 million by 2020 (and 10.4 million by 2025). Aircraft operations were predicted to increasefrom 121,428 in 2004 to 152,275 by 2020 (and 164,035 by 2025).Since the aviation activity forecast was originally prepared in 2004, the national and global economic recessionoccurred in 2008-2009 and affected overall aviation demand. FAA Orders 5050.4B and 1050.1E require that thesponsor and FAA consider new information regarding national, regional or site specific aviation trends that couldaffect the project purpose and need developed for the EIS after the start of the NEPA process. Indicators of aviationtrends include the annual TAF for the airport, the FAA National Aerospace Forecast, regional-specific economictrends, regional airport system factors, and site-specific restraints to growth.In 2009, the FAA revised the DEIS analysis using a No-Action Alternative forecast consistent with the most recent FAATAF at that time (published in December 2008). 33 After the DEIS was issued in July 2010, actual (historical) andshort-term forecast aviation activity continued to decline. Therefore, the FAA revised the <strong>FEIS</strong> analysis using aNo-Action Alternative forecast based on the Draft 2010 TAF (October 2010; see Appendix E.1, Updated Forecast ofAviation Activity) , which was the latest forecast information available at the time the <strong>FEIS</strong> analysis was performed andwas considered to reflect the recent aviation trends. 34 The <strong>FEIS</strong> forecast is based on the 2010 Draft TAF plus anadditional ten percent for each aircraft operator category and is referred to as the 2010 <strong>FEIS</strong> No-Action Forecast.32 The Notice of Intent to Prepare and Environmental Impact Statement was published in the Federal Register on January 19, 2005.33 The 2010 No-Action Alternative <strong>FEIS</strong> Forecast is within 10 percent of FAA TAF passenger forecast (see Appendix E.1, Updated Forecast of Aviation Activity).34 The 2010 Final TAF became available during the latter stages of the <strong>FEIS</strong> analysis, and differed from the Draft 2010 with lower short-term forecasts. However,FAA evaluated the most recent aviation activity counts recorded by the Air Traffic Control Tower, which were consistent with the 2010 Draft TAF (seeAppendix E.1, Updated Forecast of Aviation Activity).Chapter 2 – Purpose and Need 2-5 July 2011\\mawatr\ev\09228.00\reports\<strong>FEIS</strong>_Final_July_2011\<strong>PVD</strong>_CH02_P&N_JUL_2011.doc
T.F. <strong>Green</strong> <strong>Airport</strong> <strong>Improvement</strong> <strong>Program</strong>Environmental Impact Statement and Final Section 4(f) EvaluationAs described in Appendix E.1, Updated Forecast of Aviation Activity, recent and historical trends in the actualnumber of flights at T.F. <strong>Green</strong> <strong>Airport</strong> (based on FAA Air Traffic Control Tower data) suggest that theassumptions used in the 2010 <strong>FEIS</strong> No-Action Forecast (based on the 2010 Draft TAF) are reasonable and that the<strong>FEIS</strong> forecast remains within acceptable limits of the 2010 Draft TAF.Appendix E.1, Updated Forecast of Aviation Activity, outlines the forecasting assumptions, methodology, and results.All adjustments to forecasts used in this EIS took into account variations in forecast demand relative to specificaircraft operators identified in the TAF (air carrier, scheduled air taxi, unscheduled air taxi, general aviation, andmilitary), as described further in Section 3.9.2, <strong>FEIS</strong> Impact Analysis. Table 2-2 summarizes the 2010 <strong>FEIS</strong> Forecastfor the No-Action Alternative, which serves as the base forecast for the <strong>FEIS</strong> environmental analysis, and theIncremental Build Alternative Forecast, which accounts for the additional operations and passengers anticipatedwith the proposed runway extension. The 2010 <strong>FEIS</strong> Total Build Alternative Forecast includes the base 2010 <strong>FEIS</strong>No-Action Alternative Forecast and the Incremental Build Alternative Forecast.Table 2-22010 <strong>FEIS</strong> No-Action Alternative and Build Forecast SummaryNo-Action Incremental Build Total BuildAircraft Annual Aircraft Annual Aircraft AnnualYear Operations 1 Passengers Operations 1 Passengers Operations 1 Passengers2004 2 121,428 5,509,186 n/a n/a n/a n/a2015 3 93,500 5,274,876 4 8,760 765,727 102,260 6,040,6032020 99,330 5,844,797 4 8,784 5 767,825 5 108,114 6,612,6222025 105,551 6,519,307 4 8,760 5 831,935 6 114,311 7,351,242n/a = not applicable; 2004 represents existing conditions prior to the implementation of any potential Build Alternative.Sources: 2004 aircraft operations and passengers data provided from T.F. <strong>Green</strong> <strong>Airport</strong> – Monthly <strong>Airport</strong> Passenger Activity Summary, RIAC, December 2004;Forecast aircraft operations and passengers adjusted by Vanasse Hangen Brustlin (2010) from FAA’s Draft Terminal Area Forecast, TAF (2010). Refer toAppendix E.1, Updated Forecast of Aviation Activity.1 Total aircraft operations equal all arrivals and departures.2 Actual recorded operations and passenger activity levels provided from T.F. <strong>Green</strong> <strong>Airport</strong> – Monthly <strong>Airport</strong> Passenger Activity Summary, RIAC, December 2004.3 Only the extension to Runway 5-23 for Build Alternative B4 would be implemented by 2015. Build Alternative B2 would be implemented in 2020. The facilityrequirements analysis provided in this chapter only considers the 2015 implementation of the Build Alternative.4 FAA’s TAF only reports passenger enplanements, which can be doubled for an estimate of total passengers.5 There are slightly more operations and passengers annually in 2020, due to one additional day associated with the leap year.6 Higher load factors are expected in 2025 compared to 2015.Notwithstanding the economic downturn, the FAA determined that there remains current and anticipated demandfor commercial non-stop service to West Coast markets from T.F. <strong>Green</strong> <strong>Airport</strong> based on the fact that regionaldemand (T.F. <strong>Green</strong> and Logan <strong>Airport</strong>s) for service to the three largest markets has not changed in the samemanner as overall aviation activity at T.F. <strong>Green</strong> <strong>Airport</strong> since the time the forecast was originally developed. Asshown in Table 2-3, the total number of origin and destination (O&D) 35 passengers between T.F. <strong>Green</strong> and Logan<strong>Airport</strong>s has decreased by 1 percent to the Los Angeles area, and increased by 8.6 percent and 20.2 percent to theSan Francisco Bay area and Seattle, respectively. This demonstrates that demand (including T.F. <strong>Green</strong> and Logan<strong>Airport</strong>s) between these West Coast markets has outpaced overall passenger demand from T.F. <strong>Green</strong> <strong>Airport</strong>.35 Passengers that either board (enplane) or deplane at a particular stop, as distinct from those remaining on the plane to go to another destination.Chapter 2 – Purpose and Need 2-6 July 2011\\mawatr\ev\09228.00\reports\<strong>FEIS</strong>_Final_July_2011\<strong>PVD</strong>_CH02_P&N_JUL_2011.doc
T.F. <strong>Green</strong> <strong>Airport</strong> <strong>Improvement</strong> <strong>Program</strong>Environmental Impact Statement and Final Section 4(f) EvaluationTable 2-3Total Origin and Destination (O&D) Passengers between T.F. <strong>Green</strong> and Logan <strong>Airport</strong>s(combined) and West Coast U.S. MarketsMarket 2004 2010 Percent ChangeLos Angeles Area 1 1,274,270 1,262,059 -1.0%San Francisco Bay Area 2 1,147,981 1,246,582 8.6%Seattle 329,359 395,970 20.2%Sources: Airline Origin and Destination Survey (DB1B): Market, Bureau of Transportation Statistics, 2011; compiled byVanasse Hangen Brustlin, 2011.1 Includes LAX, Long Beach, John Wayne-Orange County, Ontario, and Burbank-Bob Hope <strong>Airport</strong>s. Non-stop LCC service (JetBlue Airways) was started from Logan<strong>Airport</strong> to Long Beach <strong>Airport</strong> in 2004. Additional non-stop LCC service (JetBlue Airways and Virgin America) started from Logan <strong>Airport</strong> to LAX in 2009.2 Includes San Francisco, Oakland, and Norman Y. Mineta San Jose International <strong>Airport</strong>s. Non-stop LCC service (JetBlue Airways) was started from Logan <strong>Airport</strong> toOakland in 2004. Additional non-stop LCC service (Virgin America) started from Logan <strong>Airport</strong> to SFO in 2009.The 2010 aviation activity forecast does not take into account any increased demand related to the opening of theInterLink, formerly known as the Intermodal Station, and direct connection to the Northeast Rail Corridor.However, the effect of the InterLink was considered in the ground access analysis and the anticipated airportparking requirements. InterLink opened in October 2010 with an elevated people mover directly connected to theT.F. <strong>Green</strong> <strong>Airport</strong> terminal complex. One of the primary transportation purposes of InterLink is “to relieve peakhour congestion on the I-95 corridor in the Providence metropolitan area.” 36 Congestion relief on area roadwaysand convenient availability of another mode of transportation will serve to enhance airport access and reduceoverall travel times, which is an important consideration for passengers when selecting which airport to use. 372.2.2 Role of T.F. <strong>Green</strong> <strong>Airport</strong> in Rhode Island and the New England RegionT.F. <strong>Green</strong> <strong>Airport</strong> plays an important function in meeting the state and New England region demands forbusiness and leisure travel, as well as providing air cargo capacity for Rhode Island and southeasternNew England.2.2.2.1 Rhode Island RoleThe FAA defines an airport’s service level and role by the type of public service the airport provides to itscommunity. As published in the National Plan of Integrated <strong>Airport</strong> Systems (NPIAS), 38 the FAA definedT.F. <strong>Green</strong> <strong>Airport</strong> as a public-use, primary medium-hub commercial service airport, and the only airport in RhodeIsland capable of operating as a primary commercial aviation facility. The <strong>Airport</strong> serves as the national andinternational gateway for residents of the state.Rhode Island’s prosperity depends, in part, on access to air transportation facilities and the provision ofcomprehensive service levels to sustain and stimulate economic growth. According to a 2006 Economic ImpactStudy, the <strong>Airport</strong> directly and indirectly generates $1.96 billion in regional economic activity and $603.9 million inearnings annually. 39 The study found that T.F. <strong>Green</strong> <strong>Airport</strong> employs approximately 21,850 individuals including36 Environmental Assessment for the Warwick Intermodal Station at T.F. <strong>Green</strong> <strong>Airport</strong>, Rhode Island Department of Transportation, Page ES-2.37 The New England Regional <strong>Airport</strong> System Plan, New England <strong>Airport</strong> Coalition, Fall 2006, Page 16.38 The NPIAS identifies more than 3,400 existing and proposed airports that are significant to national air transportation and thus eligible to receive federal grantsunder the <strong>Airport</strong> <strong>Improvement</strong> <strong>Program</strong> (AIP). It also includes estimates of the amount of AIP money needed to fund infrastructure development projects thatwill bring these airports up to current design standards and add capacity to congested airports.39 Rhode Island <strong>Airport</strong> Economic Impact Study Update 2006, Rhode Island <strong>Airport</strong>s Corporation, 2006.Chapter 2 – Purpose and Need 2-7 July 2011\\mawatr\ev\09228.00\reports\<strong>FEIS</strong>_Final_July_2011\<strong>PVD</strong>_CH02_P&N_JUL_2011.doc
T.F. <strong>Green</strong> <strong>Airport</strong> <strong>Improvement</strong> <strong>Program</strong>Environmental Impact Statement and Final Section 4(f) Evaluation1,277 Warwick residents (3.2 percent of total city employment). In 2005, the City of Warwick collected nearly$11.5 million from airport-related tax receipts and other services.2.2.2.2 New England Regional <strong>Airport</strong> System Plan (NERASP) FindingsT.F. <strong>Green</strong> <strong>Airport</strong> is a critical component of the New England regional aviation system, as one of three majorairports serving eastern New England along with Logan and Manchester <strong>Airport</strong>s. While these three airports areinter-linked, having overlapping service areas, they attract different shares of the eastern New England aviationmarket, depending on their proximity to population centers, the air services offered, competitive fares, andfacilities available.The Logan <strong>Airport</strong> Airside <strong>Improvement</strong>s Planning Project EIS (2002) noted the overlapping service areas of thearea airports and the need to relieve demand on services at Logan <strong>Airport</strong>:“Increasing the utilization of outlying airports and rail as alternatives to using Logan <strong>Airport</strong> areessential goals for accommodating continued growth in the region’s long-term demand andreducing the region’s over-reliance on Logan <strong>Airport</strong>.” 40The FAA’s ROD on the Logan <strong>Airport</strong> Airside <strong>Improvement</strong>s Planning Project EIS recommended an evaluation ofthe roles that T.F. <strong>Green</strong> and Manchester <strong>Airport</strong>s could perform to assume greater market shares of passengers andaircraft operations in order to address aircraft delays at Logan <strong>Airport</strong>. 41Federal, state, and local transportation agencies are collaborating to develop and evaluate regional transportationoptions that will better distribute air traffic in the New England Region. The FAA New England Regional Officehas been an active partner in regional aviation planning in New England. The NERASP 42 represents the mostrecent effort to study the performance and interaction of the New England Region <strong>Airport</strong> System with the goal ofestablishing a viable, balanced, and integrated system of airports.The NERASP included an extensive aviation forecast for New England as a whole, incorporating regional forecastsfor domestic scheduled passengers, international scheduled passengers, general aviation, air charter, and air cargo.In order to determine how overall regional numbers break down into specific forecasts for each airport, FAAconducted an extensive air passenger survey. The NERASP found that the T.F. <strong>Green</strong> <strong>Airport</strong> market “isapproaching the size that could support non-stop service to the West Coast and select destinations in Canada, theCaribbean, and North Atlantic Europe.” The T.F. <strong>Green</strong> <strong>Airport</strong> market consists of the overlapping service areawith Logan <strong>Airport</strong>, therefore demand for services – in particular non-stop West Coast service – must be viewed ina regional context to ensure efficiency of the New England Regional <strong>Airport</strong> System to the greatest extent practicaland avoid an over-reliance on Logan <strong>Airport</strong>.40 Logan International <strong>Airport</strong> Airside <strong>Improvement</strong>s Planning Project EIS, Boston, Massachusetts; FAA, New England Region; 2002.41 Record of Decision; Airside <strong>Improvement</strong>s Planning Project; Logan International <strong>Airport</strong>, Boston, Massachusetts; FAA, New England Region, August 2, 2002,page 6.42 The NERASP was prepared by the New England <strong>Airport</strong> Coalition in 2006, a collaboration of 11 of the region’s major airports , the six New England stateaviation agencies (including RIAC), the Massachusetts Port Authority, the New England Council, and the FAA.Chapter 2 – Purpose and Need 2-8 July 2011\\mawatr\ev\09228.00\reports\<strong>FEIS</strong>_Final_July_2011\<strong>PVD</strong>_CH02_P&N_JUL_2011.doc
T.F. <strong>Green</strong> <strong>Airport</strong> <strong>Improvement</strong> <strong>Program</strong>Environmental Impact Statement and Final Section 4(f) EvaluationThe NERASP air passenger survey also found that airport proximity is the largest single factor in passenger airportselection. Passenger proximity is represented by a catchment area that extends from an airport to the point wheretravel times to an adjacent airport are equal. The catchment areas for airports in the eastern New England regionare shown in Figure 2-1. If proximity were the only factor in choosing an airport, then all passengers originatingwithin each airport’s catchment area would use that airport exclusively.However, there are a number of factors other than proximity that passengers consider when selecting an airport touse. The NERASP air passenger survey noted that New England air passengers also consider:• <strong>Airport</strong> congestion,• Ease of access,• Lower airline fares, and• Availability of non-stop flights.These findings are consistent with surveys of airport usage across the country 43 in which airport choice for businesspassengers is driven mainly by the availability of non-stop flights, more convenient flight times, and greater flightfrequency. For a business traveler, increased travel time results in decreased productivity. Leisure passengers selectairports mainly because of lower air fares and the availability of non-stop flights. The balance of cost versus traveltime depends on the passenger’s total available leisure time. For example, the importance of travel time increases asthe leisure time is reduced (i.e., a week-long vacation versus a weekend vacation). The greatest effect on scheduledtravel time occurs when there is an airline connection required to arrive at the final destination. Non-stop flightsgreatly reduce travel times and increase likelihood of unscheduled travel delays.As a result of the many factors that affect the choice of airports by passengers, the NERASP air passenger survey 44found that the largest New England airports, including Logan and T.F. <strong>Green</strong> <strong>Airport</strong>s, have substantiallyoverlapping service areas. An airport’s service area is where passengers originate from to use the airport. Anairport’s service area in a multi-airport metropolitan system such as eastern New England extends past itscatchment area (Figure 2-1). Figure 2-2 shows the location of originating passengers from New England for each ofthe region’s airports in 2004. As shown in the figure, there is substantial overlap of passenger originating locationsfor T.F <strong>Green</strong> (<strong>PVD</strong>), Logan (BOS), and Manchester (MHT) <strong>Airport</strong>s.Leakage occurs when passengers choose to use an airport (or airports) outside the catchment area in which theyare located. According to the NERASP passenger survey, in 2004 approximately 34 percent of the air passengersoriginating within the T.F. <strong>Green</strong> <strong>Airport</strong> catchment area used Logan <strong>Airport</strong>; 59 percent used T.F. <strong>Green</strong> <strong>Airport</strong>;five percent used Bradley <strong>Airport</strong>; and the remaining passengers used Manchester <strong>Airport</strong> and other airports inNew England as shown in Figure 2-3. Therefore, one-third of all air passengers that originated locally in theT.F. <strong>Green</strong> <strong>Airport</strong> catchment area used Logan <strong>Airport</strong> in 2004. Conversely, only approximately five percent of airpassengers originating in the Logan <strong>Airport</strong> catchment area used T.F. <strong>Green</strong> <strong>Airport</strong>.43 Passenger Air Service Development Techniques, <strong>Airport</strong> Cooperative Research <strong>Program</strong> (ACRP) Report 18, Transportation Research Board (TRB), 2009.44 According to the NERASP’s Draft Technical Paper II-1: Survey Methodology (October 2004), a total of 18,527 passenger surveys were completed in Spring2004 at ten airports in the New England Region (including 2,710 passenger surveys completed at T.F. <strong>Green</strong> <strong>Airport</strong>). Survey questions included thepassenger’s flight information, local address the passenger’s trip was started from, number of times particular New England airports have been used in the pastyear, and total household income.Chapter 2 – Purpose and Need 2-9 July 2011\\mawatr\ev\09228.00\reports\<strong>FEIS</strong>_Final_July_2011\<strong>PVD</strong>_CH02_P&N_JUL_2011.doc
T.F. <strong>Green</strong> <strong>Airport</strong> <strong>Improvement</strong> <strong>Program</strong>Environmental Impact Statement and Final Section 4(f) EvaluationThe NERASP addresses specific challenges related to leakage from airports’ catchment areas “to be addressed inorder to secure high quality air transportation across New England:”• Provide airline services close to centers of passenger demand. The study identifies areas where services can beenhanced to reduce “leakage” from airport catchment areas, including the need to develop facilities to supportnon-stop flights from T.F. <strong>Green</strong> and Manchester <strong>Airport</strong>s to West Coast destinations. 45 The NERASP notesthat airlines have been reluctant to use Manchester (primary runway extended to 9,250 feet in 2003) toaccomplish this “if they cannot match the service at Providence [T.F. <strong>Green</strong>].” 46• Enhance the reliability of scheduled airline service for all airports in New England. To relieve demand and avoidcongestion at Logan <strong>Airport</strong>, reliable service must be provided at other airports in the region. Therefore,leakage into Logan <strong>Airport</strong> must be minimized from the catchment areas for T.F. <strong>Green</strong>, Manchester,Worcester, and Portland <strong>Airport</strong>s. 47From an airport perspective, increased passenger leakage from its catchment area results in lost local economicopportunities. The positive economic impacts of an airport on its local community can decrease if air passengerleakage to another airport continues to occur. In the case of T.F. <strong>Green</strong> <strong>Airport</strong>, RIAC is not fulfilling its mission(“providing economic opportunity”) if leakage to another airport continues to increase.2.2.2.3 T.F. <strong>Green</strong> <strong>Airport</strong> Role within the New England Regional <strong>Airport</strong> SystemFrom a regional airport system perspective, leakage from the T.F. <strong>Green</strong> <strong>Airport</strong> catchment area results inincreased demand and congestion at Logan <strong>Airport</strong>. Increased congestion at Logan <strong>Airport</strong> results in aircraft andair passenger delays that are costly but unnecessary where complementary services can be provided at othersurrounding regional airports. An over-reliance on Logan <strong>Airport</strong> decreases the efficiency of the regional airportsystem due to congestion and delays at the region’s primary airport facility.The rate of passenger leakage from the T.F. <strong>Green</strong> <strong>Airport</strong> catchment area has increased in the last decade due toease of access to Logan <strong>Airport</strong> with the opening of the Ted Williams Tunnel connection to Interstate 90 for alltraffic in Boston (2003), and the introduction of LCCs such as JetBlue Airways (2004), Virgin America (2009), andSouthwest Airlines (2009) at Logan <strong>Airport</strong>. The expansion of LCC service has resulted in air fare reductions atLogan <strong>Airport</strong>, eliminating the competitive advantage that T.F. <strong>Green</strong> and Manchester <strong>Airport</strong>s had in the past.Combined passenger share for T.F. <strong>Green</strong> and Manchester <strong>Airport</strong>s has fallen from 28 percent of all passengers(using the three area airports in 2002-2003) to 23 percent in 2009. 48 Further evidence of the recent trend of airpassengers choosing Logan <strong>Airport</strong> instead of T.F. <strong>Green</strong> <strong>Airport</strong> is reflected in Moody’s Investors Service outlookfor RIAC’s revenue bonds. Moody’s identified significant increased regional competition from Logan <strong>Airport</strong> asone of the major challenges for T.F. <strong>Green</strong> <strong>Airport</strong>. However, Moody’s affirmed RIAC’s bond rating by noting that45 The New England Regional <strong>Airport</strong> System Plan, New England <strong>Airport</strong> Coalition, Fall 2006, Page 30.46 Ibid.47 Ibid.48 Living in the shadow of Logan, Boston Globe, Johnston Chase, Katie, March 21, 2010, page B-1.Chapter 2 – Purpose and Need 2-10 July 2011\\mawatr\ev\09228.00\reports\<strong>FEIS</strong>_Final_July_2011\<strong>PVD</strong>_CH02_P&N_JUL_2011.doc
T.F. <strong>Green</strong> <strong>Airport</strong> <strong>Improvement</strong> <strong>Program</strong>Environmental Impact Statement and Final Section 4(f) Evaluationthe <strong>Airport</strong> “remains relatively competitive for Southern New England passengers due to the airport'sconvenience, ease of use, low parking rates, and relatively lower air fares on key routes.” 49The efficiency of the New England Regional <strong>Airport</strong> System depends in part on the ability of the regional airports,especially T.F. <strong>Green</strong> and Manchester <strong>Airport</strong>s, to minimize leakage to Logan <strong>Airport</strong> to the greatest extentpractical. This is consistent with the Logan <strong>Airport</strong> Airside <strong>Improvement</strong>s Planning Project EIS 50 , FAA’s Record ofDecision on the Logan <strong>Airport</strong> Airside <strong>Improvement</strong>s Planning Project EIS 51 , and the NERASP. 522.2.2.4 Examples of Current Leakage from T.F. <strong>Green</strong> <strong>Airport</strong> to Logan <strong>Airport</strong>Specific markets at T.F. <strong>Green</strong> <strong>Airport</strong> that have experienced leakage are West Coast destinations. Evidence ofleakage has occurred when non-stop service 53 to these markets (particularly service by LCCs) was started fromLogan <strong>Airport</strong>. Currently, all air travel from T.F. <strong>Green</strong> <strong>Airport</strong> to West Coast markets requires an airportconnection, 54 which increases travel time for passengers.To demonstrate the occurrence of leakage, the historical origin and destination (O&D) traffic between T.F. <strong>Green</strong><strong>Airport</strong> and representative examples of the highest O&D markets on the West Coast (the Los Angeles area,San Francisco Bay area, and Seattle) was examined. O&D traffic represents the beginning “origin” and final“destination” of air passengers, regardless of any airline connections in between. O&D passenger traffic betweenT.F. <strong>Green</strong> <strong>Airport</strong> and all of the West Coast markets show an increase in passengers starting in 1997, whichcorresponds with the introduction of LCC service at the <strong>Airport</strong> by Southwest Airlines. T.F. <strong>Green</strong> <strong>Airport</strong> O&Ddata between 1993 and 2010 were evaluated and is described in the following sections for representative WestCoast markets. O&D data between T.F. <strong>Green</strong> <strong>Airport</strong> and Las Vegas (the farthest non-stop destination currentlyserved from T.F. <strong>Green</strong> <strong>Airport</strong>) were also evaluated to determine the leakage potential when all three eastern NewEngland region airports offer non-stop LCC service to the same destination (of relatively long distance).Although there are a number of reasons for overall fluctuations in passenger traffic (such as national economicconditions), passenger traffic between T.F. <strong>Green</strong> <strong>Airport</strong> and these markets reduced dramatically when newnonstop service was introduced from Logan <strong>Airport</strong> by LCCs. It is important to note that the ease of access toLogan <strong>Airport</strong> was improved in 2003 with the opening of the Ted Williams Tunnel connection to Interstate 90.Although ease of access is a consideration in the choice of airline service and airports in a multi-airport region,both business and leisure passengers consider the availability of non-stop flights one of the most important factorsin choosing airline service. 55This analysis with data through 2010 shows a continuation of the same trend that was documented in the DEIS(with data through 2009). The connecting passengers between T.F. <strong>Green</strong> <strong>Airport</strong> and the specific West Coast49 Moody’s revises from negative to stable the outlook on Rhode Island <strong>Airport</strong>’s revenue bonds; A2 rating affirmed. Moody’s Investors Service, April 6, 2010.50 Logan International <strong>Airport</strong> Airside <strong>Improvement</strong>s Planning Project EIS, Boston, Massachusetts; FAA, New England Region; 2002.51 Record of Decision; Airside <strong>Improvement</strong>s Planning Project; Logan International <strong>Airport</strong>, Boston, Massachusetts; FAA, New England Region, August 2, 2002, page 6.52 The New England Regional <strong>Airport</strong> System Plan, New England <strong>Airport</strong> Coalition, Fall 2006, page 30.53 Non-stop service includes any flight that does not have intermediate stops. Non-stop airline service reduces travel times, which is an important factor inbusiness and leisure passenger behavior.54 A connecting flight includes an intermediate stop at another airport, where the passenger may have to change planes.55 Passenger Passenger Air Service Development Techniques, <strong>Airport</strong> Cooperative Research <strong>Program</strong> (ACRP) Report 18, Transportation Research Board (TRB),2009.Chapter 2 – Purpose and Need 2-11 July 2011\\mawatr\ev\09228.00\reports\<strong>FEIS</strong>_Final_July_2011\<strong>PVD</strong>_CH02_P&N_JUL_2011.doc
T.F. <strong>Green</strong> <strong>Airport</strong> <strong>Improvement</strong> <strong>Program</strong>Environmental Impact Statement and Final Section 4(f) Evaluationmarkets evaluated (Los Angeles area, San Francisco Bay area, and Seattle) continued to decrease one to threepercent from the analysis presented in the DEIS, while passengers traveling between Boston and the same WestCoast markets on non-stop flights have increased by about the same amount compared to the DEIS analysis.Los Angeles AreaThe O&D passenger traffic between T.F. <strong>Green</strong> <strong>Airport</strong> and the Los Angeles area, and the direct 56 passenger trafficbetween Logan <strong>Airport</strong> and the same market for 1993 through 2010 are shown in Chart 2-1. Air passengers access theLos Angeles market by using the five commercial service airports: Los Angeles International (LAX), Long Beach(LGB), John Wayne-Orange County, Ontario, and Burbank-Bob Hope <strong>Airport</strong>s. LAX has the highest level of O&Dtraffic for an airport that does not receive non-stop service from T.F. <strong>Green</strong> <strong>Airport</strong>. 57From 1997 (the first full year of Southwest Airlines service at T.F. <strong>Green</strong> <strong>Airport</strong>) through 2003, the average number ofannual O&D passengers between T.F. <strong>Green</strong> <strong>Airport</strong> and the Los Angeles area was 212,603. Although legacy aircarriers such as United and American Airlines offered non-stop service from Logan <strong>Airport</strong> to Los Angeles duringthis time, the introduction of non-stop LCC service by JetBlue in 2004 from Logan <strong>Airport</strong> to Long Beach <strong>Airport</strong>contributed to a 24 percent one-year decrease (2003 to 2004) of T.F. <strong>Green</strong> <strong>Airport</strong> O&D passengers in the Los Angelesarea market. New non-stop LCC service is noted in Chart 2-1 and indicated by the dashed lines. In 2009, both JetBlueand Virgin America introduced non-stop flights from Logan <strong>Airport</strong> to LAX, providing eastern New England regionair travelers more options for non-stop service to the Los Angeles area.From 2004 through 2010, the average annual O&D passengers between T.F. <strong>Green</strong> <strong>Airport</strong> and the Los Angelesarea market dropped to 141,108, which is a 34 percent decrease from the average annual O&D traffic between thetwo markets from 1997 through 2003. During the same period, direct passengers 58 between Logan <strong>Airport</strong> and theLos Angeles area market increased by 57 percent.56 Direct flights include either non-stop flights or flights that stop but some passengers do not disembark the aircraft. Therefore, direct air passengers include nonstopair passengers.57 Airline Origin and Destination Survey (DB1B): Market, Bureau of Transportation Statistics, 2010 and 2011.58 Direct passengers include those on non-stop flights and on a flight with one or more intermediate stops but no change of aircraft (with the same flight number).Chapter 2 – Purpose and Need 2-12 July 2011\\mawatr\ev\09228.00\reports\<strong>FEIS</strong>_Final_July_2011\<strong>PVD</strong>_CH02_P&N_JUL_2011.doc
T.F. <strong>Green</strong> <strong>Airport</strong> <strong>Improvement</strong> <strong>Program</strong>Environmental Impact Statement and Final Section 4(f) EvaluationChart 2-1Los Angeles Area – Logan (BOS) and T.F. <strong>Green</strong> <strong>Airport</strong>s Origin and Destination PassengersChapter 2 – Purpose and Need 2-13 July 2011\\mawatr\ev\09228.00\reports\<strong>FEIS</strong>_Final_July_2011\<strong>PVD</strong>_CH02_P&N_JUL_2011.doc
T.F. <strong>Green</strong> <strong>Airport</strong> <strong>Improvement</strong> <strong>Program</strong>Environmental Impact Statement and Final Section 4(f) EvaluationSan Francisco Bay AreaThe O&D passenger traffic between T.F. <strong>Green</strong> <strong>Airport</strong> and the San Francisco Bay area, and the direct passengertraffic between Logan <strong>Airport</strong> and the same market for calendar years 1993 through 2010 is shown in Chart 2-2.Air passengers access the San Francisco Bay Area by using three commercial service airports: San FranciscoInternational, Oakland International, and Norman Y. Mineta San Jose International <strong>Airport</strong>s. San FranciscoInternational has the ninth highest level of O&D traffic for an airport that does not receive non-stop service fromT.F. <strong>Green</strong> <strong>Airport</strong>. 59From 1997 (the first full year of Southwest Airlines service at T.F. <strong>Green</strong> <strong>Airport</strong>) through 2003, an average of145,510 O&D passengers traveled between T.F. <strong>Green</strong> <strong>Airport</strong> and the San Francisco Bay area airports per year.Many of the legacy air carriers such as United and American Airlines have offered non-stop service between Logan<strong>Airport</strong> and San Francisco International <strong>Airport</strong>. New non-stop LCC service is noted in Chart 2-2 and indicated bythe dashed lines. In 2004, non-stop LCC service to the San Francisco Bay Area from Logan <strong>Airport</strong> was initiatedwhen JetBlue Airways began non-stop service from Logan <strong>Airport</strong> to Oakland International <strong>Airport</strong> (OAK). In2005, JetBlue introduced non-stop service to Norman Y. Mineta San Jose International <strong>Airport</strong> (SJC), which thecarrier temporarily discontinued in late 2008 (citing high fuel prices) and resumed in 2010. In 2007, JetBlue begannon-stop service to San Francisco International <strong>Airport</strong> (SFO), which the carrier also discontinued in late 2008(again citing high fuel prices) and resumed in 2010. In 2009, Virgin America introduced non-stop flights fromLogan <strong>Airport</strong> to San Francisco International <strong>Airport</strong>.From 2003 to 2004 (when non-stop LCC service to the San Francisco Bay Area was introduced from Logan<strong>Airport</strong>), passengers traveling between T.F. <strong>Green</strong> <strong>Airport</strong> and the San Francisco Bay Area airports decreased by26 percent. From 2004 through 2010, the number of average annual O&D passengers between T.F. <strong>Green</strong> <strong>Airport</strong>and the San Francisco Bay area airports dropped to 90,457, which is a 38 percent decrease from the seven-yearaverage of 145,510 O&D passengers between 1997 and 2003. The average annual number of direct passengersbetween Logan <strong>Airport</strong> and the San Francisco Bay Area market between the periods of 1997-2003 and 2004-2010increased by approximately 29 percent.59 Airline Origin and Destination Survey (DB1B): Market, Bureau of Transportation Statistics, 2010 and 2011.Chapter 2 – Purpose and Need 2-14 July 2011\\mawatr\ev\09228.00\reports\<strong>FEIS</strong>_Final_July_2011\<strong>PVD</strong>_CH02_P&N_JUL_2011.doc
T.F. <strong>Green</strong> <strong>Airport</strong> <strong>Improvement</strong> <strong>Program</strong>Environmental Impact Statement and Final Section 4(f) EvaluationChart 2-2San Francisco Bay Area – Logan (BOS) and T.F. <strong>Green</strong> <strong>Airport</strong>s Origin and DestinationPassengersChapter 2 – Purpose and Need 2-15 July 2011\\mawatr\ev\09228.00\reports\<strong>FEIS</strong>_Final_July_2011\<strong>PVD</strong>_CH02_P&N_JUL_2011.doc
T.F. <strong>Green</strong> <strong>Airport</strong> <strong>Improvement</strong> <strong>Program</strong>Environmental Impact Statement and Final Section 4(f) EvaluationSeattleThe O&D passenger traffic between T.F. <strong>Green</strong> <strong>Airport</strong> and Seattle-Tacoma International <strong>Airport</strong> (SEA), and thedirect passenger traffic between Logan <strong>Airport</strong> and the same market for calendar years 1993 through 2010 is shownin Chart 2-3. Air passengers travel between T.F. <strong>Green</strong> <strong>Airport</strong> and SEA by connecting through legacy carrier hubairports or with connecting service on Southwest Airlines.From 1997 through 2005, an average of 66,652 annual O&D passengers traveled between T.F. <strong>Green</strong> <strong>Airport</strong> andSEA. New non-stop LCC service is noted in Chart 2-3 and indicated by the dashed line. In November 2005, nonstopLCC service between Logan <strong>Airport</strong> and SEA was initiated by JetBlue Airways.Chart 2-3 shows a decline beginning in 2006 in passengers traveling between T.F. <strong>Green</strong> <strong>Airport</strong> and SEA. From2005 to 2006, O&D passenger traffic between the two airports decreased by 22 percent. From 2006 through 2010,the number of average annual O&D passengers between T.F. <strong>Green</strong> <strong>Airport</strong> and SEA dropped to 46,172, which is a31 percent decrease from the nine-year average of 66,652 O&D passengers between 1997 and 2005. The chart alsoshows an increase in the average annual number of direct passengers between Logan <strong>Airport</strong> and SEA between theperiods of 1997-2005 and 2006-2010 by approximately 79 percent, after new non-stop LCC service was initiated.Las VegasThe longest distance non-stop market currently served from T.F. <strong>Green</strong> <strong>Airport</strong> is Las Vegas (via SouthwestAirlines). Air passengers traveled between Las Vegas (LAS) and T.F. <strong>Green</strong> <strong>Airport</strong> with connecting flight serviceuntil November 2005, when Southwest Airlines introduced non-stop service. JetBlue Airways also introducednon-stop service between Las Vegas and Logan <strong>Airport</strong> in 2005. In 2003, Southwest Airlines introduced non-stopservice between Las Vegas and Manchester <strong>Airport</strong> (MHT).The historical O&D passenger data between Las Vegas and T.F. <strong>Green</strong> <strong>Airport</strong>, and the direct passenger trafficbetween Logan <strong>Airport</strong> and the same market is shown in Chart 2-4. New non-stop LCC service is noted in Chart 24 and indicated by the dashed lines. The chart shows that with non-stop LCC service from each of the three easternNew England region airports to the same western U.S. destination, the T.F. <strong>Green</strong> <strong>Airport</strong> O&D passengersremained relatively constant while minimizing leakage to Logan <strong>Airport</strong>.The average annual number of direct passengers between T.F. <strong>Green</strong> <strong>Airport</strong> and Las Vegas between the periods of1997-2004 and 2005-2010 increased by approximately 20 percent, while the average annual number of directpassengers between Logan <strong>Airport</strong> and Las Vegas between the same periods increased by approximately22 percent. These increases demonstrate that if both T.F. <strong>Green</strong> and Logan <strong>Airport</strong>s (and even Manchester <strong>Airport</strong>)each offer non-stop service to the same market, leakage can be contained and growth in passenger demand can berealized at both airports.Chapter 2 – Purpose and Need 2-16 July 2011\\mawatr\ev\09228.00\reports\<strong>FEIS</strong>_Final_July_2011\<strong>PVD</strong>_CH02_P&N_JUL_2011.doc
T.F. <strong>Green</strong> <strong>Airport</strong> <strong>Improvement</strong> <strong>Program</strong>Environmental Impact Statement and Final Section 4(f) EvaluationChart 2-3Seattle (SEA) – Logan (BOS) and T.F. <strong>Green</strong> <strong>Airport</strong>s Origin and Destination PassengersChapter 2 – Purpose and Need 2-17 July 2011\\mawatr\ev\09228.00\reports\<strong>FEIS</strong>_Final_July_2011\<strong>PVD</strong>_CH02_P&N_JUL_2011.doc
T.F. <strong>Green</strong> <strong>Airport</strong> <strong>Improvement</strong> <strong>Program</strong>Environmental Impact Statement and Final Section 4(f) EvaluationChart 2-4PassengersLas Vegas (LAS) – Logan (BOS) and T.F. <strong>Green</strong> (<strong>PVD</strong>) <strong>Airport</strong>s Origin and DestinationChapter 2 – Purpose and Need 2-18 July 2011\\mawatr\ev\09228.00\reports\<strong>FEIS</strong>_Final_July_2011\<strong>PVD</strong>_CH02_P&N_JUL_2011.doc
T.F. <strong>Green</strong> <strong>Airport</strong> <strong>Improvement</strong> <strong>Program</strong>Environmental Impact Statement and Final Section 4(f) EvaluationSummary of Regional Role and Existing Leakage from T.F. <strong>Green</strong> <strong>Airport</strong> to Logan <strong>Airport</strong>Table 2-4 provides a summary of the number of average O&D passengers between the markets described in thissection for two distinct periods: when Southwest Airlines initiated service at T.F. <strong>Green</strong> <strong>Airport</strong> (first full calendaryear of 1997) to the time prior to the start of non-stop LCC service from Logan <strong>Airport</strong> (Los Angeles and SanFrancisco Bay areas in 2004; Seattle and Las Vegas in 2005), and after non-stop LCC service was started from Logan<strong>Airport</strong> to the latest O&D data available (2010). In each instance, leakage of the O&D passengers from T.F. <strong>Green</strong><strong>Airport</strong> to Logan <strong>Airport</strong> is evident except for the Las Vegas example, in which non-stop LCC service is providedfrom T.F. <strong>Green</strong> <strong>Airport</strong>. In each example, as new non-stop LCC service was offered from Logan <strong>Airport</strong>, thenon-stop passengers at Logan <strong>Airport</strong> increased substantially, while the O&D passengers at T.F. <strong>Green</strong> <strong>Airport</strong>decreased substantially.The change in total average annual O&D passengers between T.F. <strong>Green</strong> <strong>Airport</strong> and all markets is provided inTable 2-4 to provide context relative to the economic downturn that started in 2008. The overall change in averageannual O&D passengers considers the same time periods as evaluated for each market. For example, averageannual O&D passengers between the Los Angeles area and T.F. <strong>Green</strong> <strong>Airport</strong> dropped by 33.6 percent from theperiod of 1997-2004 (after introduction of Southwest Airlines at T.F. <strong>Green</strong> <strong>Airport</strong> and before non-stop LCCservice from Logan <strong>Airport</strong>) to 2005-2010 (after LCC service from Logan <strong>Airport</strong>), while the average annual O&Dpassengers between T.F. <strong>Green</strong> <strong>Airport</strong> and all markets decreased by 1.5 percent in the same periods.Table 2-4Average Origin and Destination (O&D) Passengers between T.F. <strong>Green</strong> <strong>Airport</strong> andWest Coast U.S. Markets (including Las Vegas)MarketT.F. <strong>Green</strong> <strong>Airport</strong>Avg. Annual O&DPassengers –Before Non-stop LCCService fromLogan <strong>Airport</strong> 1Los Angeles Area 4212,603San Franci sco Bay Area 5 145,510T.F. <strong>Green</strong> <strong>Airport</strong>Avg. Annual O&DPassengers –After Non-stop LCCService fromLogan <strong>Airport</strong>141,10890,457Percent Change-33.6%-37.8%Total Avg. Annual O&DPassengers betweenT.F. <strong>Green</strong> <strong>Airport</strong> andAll Markets –Percent Change 2-1.5%-1.5%Logan <strong>Airport</strong> -PercentChange in Avg. AnnualDirect Passengers 3Seattle 6 66,652 46,172 -30.7% -9.1% +78.8%Las Vegas 7 100,128 120,015 +19.9% -9.1% +21.5%Sources: Airline Origin and Destination Survey (DB1B): Market, Bureau of Transportation Statistics, 2011; compiled by Vanasse Hangen Brustlin, 2011.1 Starting in 1997, the year after Southwest Airlines commenced service at T.F. <strong>Green</strong> <strong>Airport</strong> (which resulted in substantially increased passenger totals fromprevious years at the <strong>Airport</strong>).2 Calculated based on same periods considered for each market; all markets include West Coast destinations and all other markets with O&D passengers fromT.F. <strong>Green</strong> <strong>Airport</strong>.3 Percent change from 1997 to the period after non-stop LCC service was initiated from Logan <strong>Airport</strong>.4 Includes LAX, Long Beach, John Wayne-Orange County, Ontario, and Burbank-Bob Hope <strong>Airport</strong>s; non-stop LCC service (JetBlue Airways) was started from Logan<strong>Airport</strong> to Long Beach <strong>Airport</strong> in 2004. Additional non-stop LCC service (JetBlue Airways and Virgin America) started from Logan <strong>Airport</strong> to LAX in 2009.5 Includes San Francisco, Oakland, and Mineta-San Jose International <strong>Airport</strong>s; non-stop LCC service (JetBlue Airways) was started from Logan <strong>Airport</strong> to Oakland in2004. Additional non-stop LCC service (Virgin America) started from Logan <strong>Airport</strong> to SFO in 2009.6 Non-stop LCC service (JetBlue Airways) was started from Logan <strong>Airport</strong> in November 2005.7 Non-stop LCC service (JetBlue Airways) was started from Logan <strong>Airport</strong> in May 2005; non-stop LCC service (Southwest Airlines) was started from T.F. <strong>Green</strong> <strong>Airport</strong> inNovember 2005.+56.6%+28.7%Chapter 2 – Purpose and Need 2-19 July 2011\\mawatr\ev\09228.00\reports\<strong>FEIS</strong>_Final_July_2011\<strong>PVD</strong>_CH02_P&N_JUL_2011.doc
T.F. <strong>Green</strong> <strong>Airport</strong> <strong>Improvement</strong> <strong>Program</strong>Environmental Impact Statement and Final Section 4(f) EvaluationT.F. <strong>Green</strong> <strong>Airport</strong> has not adequately served its role within the regional airport system due to the increasedleakage of air passengers from T.F. <strong>Green</strong> <strong>Airport</strong> to Logan <strong>Airport</strong> since 2004. Reduction of leakage from airportcatchment areas is needed “to secure high quality air transportation across New England” according to theNERASP. 60 Reliable non-stop service (specifically to West Coast markets where leakage to Logan <strong>Airport</strong> isoccurring) must be provided from T.F. <strong>Green</strong> <strong>Airport</strong> to relieve demand and avoid congestion at Logan <strong>Airport</strong>. 61Continued leakage from T.F. <strong>Green</strong> <strong>Airport</strong> will increase congestion at Logan <strong>Airport</strong> and decrease the efficiencyof the New England Regional <strong>Airport</strong> System.2.3 T.F. <strong>Green</strong> <strong>Airport</strong> Facility RequirementsRIAC undertakes regular planning efforts to identify specific airport facility needs that would ensure T.F. <strong>Green</strong><strong>Airport</strong> meets all applicable airport design standards and operates efficiently while fulfilling its role in the NewEngland Regional <strong>Airport</strong> System. These planning efforts assist RIAC with fulfilling part of its mission ofproviding “safe, efficient, and convenient air transportation” for the region.Figure 1-3 depicts the existing T.F. <strong>Green</strong> <strong>Airport</strong> facilities. In 1999, RIAC initiated preparation of an update to the<strong>Airport</strong>’s Master Plan. The goal of the process was to address the facility and infrastructure improvementsrequired to meet safety and efficiency requirements, and accommodate projected aviation demand atT.F. <strong>Green</strong> <strong>Airport</strong> (throughout a 20-year planning period through 2020). The 2002 T.F. <strong>Green</strong> <strong>Airport</strong> Master PlanUpdate evaluated the existing infrastructure and facilities at the <strong>Airport</strong> with consideration to current andanticipated <strong>Airport</strong> activity and market demand. These studies identified multiple deficiencies and presented arecommended improvement strategy to accommodate the projected levels of aviation activity and related <strong>Airport</strong>functions, in addition to enhancing the overall safety and efficiency of operating conditions.In the 2002 T.F. <strong>Green</strong> <strong>Airport</strong> Master Plan Update RIAC conducted a detailed demand and capacity analysis andidentified the short-term facility requirements needed to meet anticipated demand at the <strong>Airport</strong>. The analysisidentified a series of projects that addressed airfield, airport operational support, terminal area, and surfacetransportation facilities requirements for the short-term including extension of Runway 5-23 to 7,500 feet. RIACrevisited the planning assumptions (including the aviation forecasts provided in the 2002 T.F. <strong>Green</strong> <strong>Airport</strong>Master Plan Update) and prepared a T.F. <strong>Green</strong> <strong>Airport</strong> Master Plan Supplement (March 2004) that addressedlonger-term needs at the <strong>Airport</strong>. The recommendations in the 2004 T.F. <strong>Green</strong> <strong>Airport</strong> Master Plan Supplementincluded extending Runway 5-23 to a total length of 9,500 feet.The 2004 T.F. <strong>Green</strong> <strong>Airport</strong> Master Plan Supplement provides the preliminary list of proposed projects that RIACcould undertake to ensure that it operates safely and efficiently into at least the next decade. The T.F. <strong>Green</strong><strong>Airport</strong> <strong>Improvement</strong> <strong>Program</strong> that is the subject of this EIS evaluates appropriate project elements that emergedfrom the Master Plan process based on the <strong>Airport</strong>’s safety and efficiency needs. A discussion of the needed safetyand efficiency enhancement elements are detailed in the following sections.60 The New England Regional <strong>Airport</strong> System Plan, New England <strong>Airport</strong> Coalition, Fall 2006, page 30.61 Ibid.Chapter 2 – Purpose and Need 2-20 July 2011\\mawatr\ev\09228.00\reports\<strong>FEIS</strong>_Final_July_2011\<strong>PVD</strong>_CH02_P&N_JUL_2011.doc
T.F. <strong>Green</strong> <strong>Airport</strong> <strong>Improvement</strong> <strong>Program</strong>Environmental Impact Statement and Final Section 4(f) Evaluation2.3.1 Safety NeedsSeveral of the facilities at T.F. <strong>Green</strong> <strong>Airport</strong> do not meet current FAA airport design standards. 62 These include theRunway Safety Areas (RSAs) at each end of Runway 16-34, the separation between Taxiway C and Runway 16-34,and Hangar No. 1 which penetrates the Runway 16-34 Object Free Area (OFA) and 14 CFR Part 77 airspacesurfaces. The FAA airport design standards should be met to the greatest extent practicable to enhance the safetyof airfield operations.2.3.1.1 Runway 16-34The RSAs associated with Runway 16-34 do not meet current FAA airport design standards for an <strong>Airport</strong>Reference Code (ARC) C-IV 63 facility. The RSA surrounds the paved runway surface, with the purpose ofenhancing aircraft safety by providing a graded, well-drained area that can support aircraft that undershoot,overrun, or deviate from the runway, without causing injury to its occupants or structural damage to the aircraft. 64The size of the RSA is dependent on the type of aircraft using the airport. A 1,000-foot standard for the length ofRSAs has been developed to maintain a level of safety for larger and faster aircraft, such as those which arecurrently operating at the <strong>Airport</strong>.The established design standards dictate that the RSA for Runway 16-34 must extend 1,000 feet beyond eachrunway end at a width of 500 feet. The existing Runway 16 RSA is 180 feet long and 500 feet wide, while the RSAassociated with the Runway 34 End is 200 feet long and 500 feet wide. The existing perimeter road currentlypenetrates the Runway 34 End RSA. Figure 2-4 illustrates the existing nonstandard Runway 16-34 RSAs.The RSAs must be upgraded at both runway ends to meet FAA standards through either construction of the fullRSAs (500 feet wide and extending 1,000 feet beyond each runway end), or through providing an equivalent levelof safety as defined by FAA through the use of an Engineered Material Arresting System (EMAS). In November2005, the U.S. Congress required that all 14 C.F.R. Part 139 65 airport sponsors (including RIAC) enhance passengersafety by improving their RSAs by 2015 and that FAA report annually on its progress toward improving RSAs.In addition to the RSA deficiencies, rehabilitation of the Runway 16-34 pavement is needed to maintain the safetyof the runway. A pavement evaluation in 2001 noted that the runway pavement has exceeded its anticipated20-year useful life. Runway 16-34 was last rehabilitated in 1978. The 2002 T.F. <strong>Green</strong> <strong>Airport</strong> Master Plan Updaterecommended reconstructing Runway 16-34 by 2004. A pavement overlay project was undertaken in 2004 toprovide a short-term fix to the rapidly deteriorating condition of the runway. Continued deterioration of therunway can result in foreign object debris (FOD) from broken pavement pieces on the runway. Rehabilitation ofRunway 16-34 pavement is needed to avoid unsafe occurrences of FOD on the airfield and to extend the useful lifeof the runway.62 FAA Advisory Circular 150/5300-13, Change 15.63 According to FAA Advisory Circular 150/5300-13, <strong>Airport</strong> Design, Change 15, the <strong>Airport</strong> Reference Code (ARC) is a coding system used to relate airportdesign criteria to the operational and physical characteristics of the airplanes intended to operate at the airport.64 FAA Advisory Circular 150/5300-13, Change 15.65 14 CFR. Part 139 defines airports that conduct commercial passenger flight operations and must comply with standards contained therein.Chapter 2 – Purpose and Need 2-21 July 2011\\mawatr\ev\09228.00\reports\<strong>FEIS</strong>_Final_July_2011\<strong>PVD</strong>_CH02_P&N_JUL_2011.doc
T.F. <strong>Green</strong> <strong>Airport</strong> <strong>Improvement</strong> <strong>Program</strong>Environmental Impact Statement and Final Section 4(f) Evaluation2.3.1.2 Taxiway CThe centerline of Taxiway C is 300 feet from the centerline of Runway 16-34. FAA design standards for ARC C-IVfacilities require 400 feet of lateral separation between the centerlines of runways and their associated paralleltaxiways to enhance the safety of airfield operations. 66 The existing separation does not meet current FAA airportdesign standards. Therefore, a separation of an additional 100 feet needs to be provided between Taxiway C andRunway 16-34 to meet current FAA airport design standards.2.3.1.3 Hangar No. 1Hangar No. 1 is located within the Runway 16-34 OFA. The runway OFA is an area on the ground centered on therunway centerline free of objects, except for objects that need to be located within the runway OFA for airnavigation (navigational aids) or aircraft ground maneuvering purposes (airfield signage). 67 FAA AdvisoryCircular 150/5300-13, Change 15, section 307 states that “the runway OFA clearing standard requires clearing theOFA of above ground objects protruding above the runway safety area edge elevation.” Hangar No. 1 protrudesabove the runway safety area edge elevation within the Runway 16-34 OFA, and needs to be removed to meetcurrent FAA airport design standards and enhance the safety of airfield operations.The 2002 T.F. <strong>Green</strong> <strong>Airport</strong> Master Plan Update and subsequent airspace studies 68 also identified Hangar No.1 as anobstruction to air navigation according to 14 CFR Part 77, Objects Affecting Navigable Airspace. This regulationestablishes protected airspace surfaces around airports to protect navigable airspace from objects and otherobstructions surrounding airports. Hangar No. 1 penetrates the Part 77 primary and transitional surfaces. 692.3.2 Efficiency NeedsAs an airport proprietor and operator of one of the three major commercial airports within the eastern NewEngland Region, RIAC’s mission is to provide efficient and convenient facilities to accommodate air transportationdemand within its catchment area. However, several of the <strong>Airport</strong>’s facilities are inadequate in meeting current oranticipated needs, including the terminal complex, cargo facilities, access roadways, parking facilities, and fuelfarm. Inadequate facilities result in inefficient airfield, landside, and terminal operations at the <strong>Airport</strong>. Upgradedfacilities are needed to address these inadequacies.Airlines and other aircraft operators can be retained or attracted to the <strong>Airport</strong> with efficient facilities, which servesRIAC’s mission by providing economic opportunities for the region. In addition, adequate airfield facilities atT.F. <strong>Green</strong> <strong>Airport</strong> (in the form of primary runway length) are critical to reduce leakage of passengers to Logan<strong>Airport</strong> and ensure the efficiency of the New England Regional <strong>Airport</strong> system. The need for adequate primaryrunway length is defined by a specific market segment - regional passenger demand for non-stop service to WestCoast markets.66 FAA Advisory Circular 150/5300-13, Change 15.67 Ibid, page 2.68 Draft Request for Aeronautical Study for T.F. <strong>Green</strong> <strong>Airport</strong>, Edwards and Kelcey, August 15, 2005.69 According to 14 CFR Part 77, the primary surface is centered on the runway centerline, extends 200 feet past the runway end, and its width is 1,000 feet (withthe type of approach instrumentation on Runway 16-34). The transitional surface starts at the end of the primary surface area and extends at a 7:1 slope to thenext protected airspace surface.Chapter 2 – Purpose and Need 2-22 July 2011\\mawatr\ev\09228.00\reports\<strong>FEIS</strong>_Final_July_2011\<strong>PVD</strong>_CH02_P&N_JUL_2011.doc
T.F. <strong>Green</strong> <strong>Airport</strong> <strong>Improvement</strong> <strong>Program</strong>Environmental Impact Statement and Final Section 4(f) EvaluationEase of access (travel times) is an important factor that New England air passengers consider when selecting anairport to use. 70 The NERASP found that “passengers are averse to lengthy and unpredictable delays in allsegments of their air travel” and that “if an airport can demonstrate greater reliability and predictability of allportions of the air trip, they may be able to significantly influence the passenger’s choice of airports.” 71 An airpassenger’s trip time includes traveling to an airport, parking an automobile (or picking up or dropping off arental car), accessing the terminal, and navigating within the concourse and gate areas. Although RIAC cannotcontrol all unforeseen delays in travel due to weather or other reasons, it can control the type of facilities at the<strong>Airport</strong> that enhance efficiency by reducing passenger travel times to the greatest extent practicable.As described in Section 2.2.1.2, Forecasts, the forecasts of aviation demand have been adjusted during the course ofthis EIS process to reflect recent aviation trends for the future No-Action Alternative. As a result, those<strong>Improvement</strong> <strong>Program</strong> components associated with overall aircraft operations and passenger demand atT.F. <strong>Green</strong> <strong>Airport</strong> have been adjusted where necessary from the original Master Plan recommendations and DEIS.Requirements of the terminal complex, cargo facilities, access roadways, parking facilities, and the fuel farm aredefined primarily by overall aircraft operational or passenger demand (existing or forecast) at T.F. <strong>Green</strong> <strong>Airport</strong>.Where applicable, facility requirements are presented for the 2010 <strong>FEIS</strong> No-Action Alternative and the BuildAlternative Forecasts, which adds the Incremental Build Alternative Forecast to the No-Action Alternative Forecast(see Table 2-2).2.3.2.1 Primary Runway LengthThe ability of an airport to function efficiently and to meet current and anticipated demand depends on theavailability of airport infrastructure (runways and taxiways) to accommodate air carrier operations and passengerdemand. Airfield modifications, including runway enhancements, typically improve the efficiency of the airportitself. However, the primary runway length of airports in a regional multi-airport system such as in New Englandcan affect the efficiency of the system. The efficiency of the New England Regional <strong>Airport</strong> System depends in parton the ability of the regional airports, especially T.F. <strong>Green</strong> and Manchester <strong>Airport</strong>s, to minimize leakage ofpassengers to Logan <strong>Airport</strong> to the greatest extent practical. The proposed T.F. <strong>Green</strong> <strong>Airport</strong> <strong>Improvement</strong><strong>Program</strong> includes extending primary Runway 5-23 to accommodate non-stop flights to the West Coast.As described in Section 2.2.2.4, evidence has shown that air passengers between T.F. <strong>Green</strong> <strong>Airport</strong> and specificWest Coast markets have decreased when new non-stop LCC service has been initiated from Logan <strong>Airport</strong> (andairport access has been enhanced with the opening of the Ted Williams Tunnel connection to Interstate 90 in 2003).Specific West Coast markets have experienced leakage from T.F. <strong>Green</strong> <strong>Airport</strong> when new non-stop LCC servicewas initiated from Logan <strong>Airport</strong> (Charts 2-1, 2-2, and 2-3). However, evidence has also shown that when non-stopLCC service is offered from both airports (and even Manchester <strong>Airport</strong>) to the western U.S. leakage can becontained and air passenger demand can grow at both facilities (Chart 2-4).Airline behavior is not directly controlled by FAA or RIAC since the passage of the Airline Deregulation Act of1978 (92 Statute 1705 (1995)). <strong>Airport</strong> sponsors, such as RIAC, are responsible for providing airport facilities toallow and attract airline service. Therefore, RIAC has only limited control over some of the factors affecting70 The New England Regional <strong>Airport</strong> System Plan, New England <strong>Airport</strong> Coalition, Fall 2006, page 16.71 Ibid, page 11.Chapter 2 – Purpose and Need 2-23 July 2011\\mawatr\ev\09228.00\reports\<strong>FEIS</strong>_Final_July_2011\<strong>PVD</strong>_CH02_P&N_JUL_2011.doc
T.F. <strong>Green</strong> <strong>Airport</strong> <strong>Improvement</strong> <strong>Program</strong>Environmental Impact Statement and Final Section 4(f) Evaluationpassenger leakage to other airports, such as flight availability, lower fares, and airline flight times. The mostcommon competitive challenges that cause leakage from one airport to another are: 72• Proximity to legacy carrier hub, 73• Proximity to an airport served by an LCC, 74 and• Physical limitations, including runway length.<strong>Airport</strong> physical limitations that affect leakage and are within RIAC’s control include ease of access (within theairport boundary, including parking facilities), passenger facilities and amenities (terminal building), and airfieldfacilities (such as runway length) to accommodate airline services. Recent examples of projects by RIAC atT.F. <strong>Green</strong> <strong>Airport</strong> to enhance the accessibility and attractiveness to New England air passengers include the BruceSundlun Terminal Building (opened in 1996), Terminal <strong>Improvement</strong> Project (2006-2008; included expansion ofsecurity screening, improved exit lanes and created in-line bag screening, and InterLink (opened in 2010).Proposed projects that would enhance efficiency and ease of access for passengers at T.F. <strong>Green</strong> <strong>Airport</strong> that areconsidered in this <strong>FEIS</strong> include terminal complex, roadway, and parking improvements.The other regional airport in eastern New England, Manchester <strong>Airport</strong>, has enhanced its accessibility andattractiveness to New England air passengers since 2000 by completing passenger terminal and parking garageimprovements. Manchester <strong>Airport</strong> also extended its primary runway from 7,000 feet to 9,250 feet in 2003 toaccommodate air cargo demand. Although T.F. <strong>Green</strong> <strong>Airport</strong> has substantially more passengers than Manchester(4.4 million versus 3.3 million in fiscal year 2009 75 ), the ability to accommodate non-stop service to the West Coastis restricted by the length of the primary runway (7,166 feet) at T.F. <strong>Green</strong> <strong>Airport</strong>. The NERASP considered thisdisparity in primary runway lengths provided by these two “alternate” airports in the Boston metropolitan regionand found that airlines preferred to provide similar services from Manchester and T.F. <strong>Green</strong> <strong>Airport</strong>s (as evidentin Southwest Airlines’ similar non-stop service from T.F. <strong>Green</strong> and Manchester <strong>Airport</strong>s to Las Vegas):“Manchester and Providence have similar relationships with Logan in that they function asalternative bases for airlines that compete for passengers from the greater Boston metropolitan area.Airlines prefer to match services from both airports. Inadequate facilities in one location can impedeservice development at both.” 76T.F. <strong>Green</strong> <strong>Airport</strong> could enhance the efficiency of the New England Regional <strong>Airport</strong> System by providing alonger primary runway length for airlines to offer non-stop West Coast service. This would decrease the leakagerate and relieve air passenger demand and aircraft congestion at Logan <strong>Airport</strong>.As discussed in Section 2.2.2.2, New England Regional <strong>Airport</strong> System Plan (NERASP) Findings, T.F. <strong>Green</strong> and Logan<strong>Airport</strong>s have overlapping service areas. Historical data shows that passengers that have traditionally chosenT.F. <strong>Green</strong> <strong>Airport</strong> have increasingly chosen to use Logan <strong>Airport</strong> to reach West Coast destinations directly with72 Passenger Air Service Development Techniques, <strong>Airport</strong> Cooperative Research <strong>Program</strong> Report 18, Transportation Research Board, 2009, Page 48.73 Logan <strong>Airport</strong> serves as a “focus city” and an international gateway airport for American Airlines, a legacy air carrier.74 Logan <strong>Airport</strong> is served by the following LCC - AirTran, JetBlue, Virgin America, and Southwest Airlines. Manchester <strong>Airport</strong> is served by Southwest Airlines.75 Final Terminal Area Forecasts, FAA, 2010.76 The New England Regional <strong>Airport</strong> System Plan, New England <strong>Airport</strong> Coalition, Fall 2006, Page 11.Chapter 2 – Purpose and Need 2-24 July 2011\\mawatr\ev\09228.00\reports\<strong>FEIS</strong>_Final_July_2011\<strong>PVD</strong>_CH02_P&N_JUL_2011.doc
T.F. <strong>Green</strong> <strong>Airport</strong> <strong>Improvement</strong> <strong>Program</strong>Environmental Impact Statement and Final Section 4(f) Evaluationnonstop LCC service rather than using connecting airline service from T.F. <strong>Green</strong> <strong>Airport</strong>. The number of dailynon-stop flights between T.F. <strong>Green</strong> <strong>Airport</strong> (with a longer primary runway length) and West Coast destinationswas originally forecast as 16 in 2004. Although total passengers at T.F. <strong>Green</strong> <strong>Airport</strong> have decreased by 29 percentbetween 2004 and 2010, 77 it is still reasonable to project passenger demand for 16 non-stop daily West Coast flightswith an extended primary runway at T.F. <strong>Green</strong> <strong>Airport</strong>. During the same time period, the total number of O&Dpassengers between T.F. <strong>Green</strong> and Logan <strong>Airport</strong>s has decreased by 1 percent to the Los Angeles area, andincreased by 8.6 percent and 20.2 percent to the San Francisco Bay area and Seattle, respectively, as shownpreviously in Table 2-3. This demonstrates that regional demand (including T.F. <strong>Green</strong> and Logan <strong>Airport</strong>s)between these West Coast markets has outpaced overall passenger demand from T.F. <strong>Green</strong> <strong>Airport</strong> only.Therefore, the unique demand for service to these markets is not affected by a decrease in overall operations.Additional analysis of forecast non-stop West Coast service based on historical average O&D passenger activityand an allocation of passengers based on catchment area is provided in Appendix E.2, Evaluation of PotentialNon-stop West Coast Flights. 78 This appendix also evaluates the characteristics of a similar regional airport system insoutheast Florida.Based on the destinations currently served by airlines operating at the <strong>Airport</strong>, as shown on Figure 2-5, the <strong>Airport</strong> isoperating as a short- and medium-haul airport. The aircraft types that serve the <strong>Airport</strong> are primarily narrow-body jetaircraft and turboprop. While there are some limited wide-body aircraft operations at T.F. <strong>Green</strong> <strong>Airport</strong>, these aretypically used for select niche markets with trip lengths that either do not require full fuel loads or are based onreduced operational payload (fewer passengers or less belly cargo). With such a reduced payload or fuel requirement,wide-body aircraft can operate on a shorter runway than would otherwise be required by the same aircraft operatingwith full fuel loads or payloads that would be typical of longer trip lengths.The longest non-stop route currently served from T.F. <strong>Green</strong> <strong>Airport</strong> is Las Vegas, Nevada (2,053 nautical miles) bySouthwest Airlines, an LCC. As indicated previously in this chapter, LCCs have had an influential role on thepassenger demand at T.F. <strong>Green</strong> <strong>Airport</strong> and the region. LCCs, such as Southwest and JetBlue, typically cater tocustomers who are driven by price, which typically confines them to short-haul operations. However, more and moreLCCs are modifying their business models to include long-haul service but only to the largest markets (such as theeastern New England region and greater Boston) where the airport infrastructure can support non-stop service andthey can meet demand with lower long-haul fares. FAA recognizes that the trend to longer trip lengths willcontinue in the future. 79 Because of frequently changing airline business models, airports must remain flexible andhave the ability to meet anticipated industry demands. Non-stop long-haul service to the West Coast by LCCs hasrecently increased at Logan <strong>Airport</strong>, which has appropriate airport infrastructure (with a primary runway length of10,083 feet) to accommodate non-stop West Coast service (see Figure 2-5).Chart 2-5 depicts the required runway lengths for the forecast aircraft fleet mix that are capable of operating nonstopfrom T.F. <strong>Green</strong> <strong>Airport</strong> to West Coast markets using methodologies detailed in FAA’s Advisory77 Rhode Island <strong>Airport</strong> Corporation, 2011, http://www.pvdairport.com/main.aspx?guid=3E497897-BB63-4982-8CAE-6B1F686C4836.78 These additional non-stop flights to the West Coast are included in the assessment of the environmental consequences associated with the Build Alternatives.See Chapter 5, Environmental Consequences.79 FAA Aerospace Forecast: Fiscal Years 2010-2030, Table 15, FAA Office of Aviation Policy and Plans, 2010.Chapter 2 – Purpose and Need 2-25 July 2011\\mawatr\ev\09228.00\reports\<strong>FEIS</strong>_Final_July_2011\<strong>PVD</strong>_CH02_P&N_JUL_2011.doc
T.F. <strong>Green</strong> <strong>Airport</strong> <strong>Improvement</strong> <strong>Program</strong>Environmental Impact Statement and Final Section 4(f) EvaluationCircular 150/5325-4B, Runway Length Requirements for <strong>Airport</strong> Design (see Appendix E.3, Comparison of Actual andForecast Airline Fleet Mix). Chart 2-5 includes a range of required runway lengths, because within each aircraft type,there are a variety of potential aircraft configurations and engine types made available by the manufacturer for useby an operator. Any of these variations can have an impact on the weight or thrust capacity of the aircraft which inturn affect the runway length requirements of a particular aircraft type. This analysis demonstrates that the currentprimary runway length at T.F. <strong>Green</strong> <strong>Airport</strong> does not provide adequate flexibility for airlines to provide non-stopservice to the West Coast with the forecast fleet of aircraft capable of serving that distance, and limits the efficiencyof existing airline operations. The alternatives screening and analysis process identifies the recommended andappropriate runway length to which Runway 5-23 should be extended (Chapter 3, Alternatives Analysis).Chart 2-5Range of Runway Length Requirements for Non-stop West Coast-Capable AircraftAssumptions:1 Based on methodology provided in FAA Advisory Circular 150/5325-4B, Runway Length Requirements for Aircraft Design, 2005.2 Data obtained from aircraft planning manuals provided by aircraft manufacturers.3 Average hot day (86°F), sea level, maximum takeoff weight, 2,300 nautical mile trip distance (T.F. <strong>Green</strong> <strong>Airport</strong> to West Coast destination).4 Shaded area depicts range of possible required runway lengths for each type of aircraft. (Actual required runway length will vary based on specificversion of aircraft series, engine type, and use of winglets.)5 Only aircraft that are included in the T.F. <strong>Green</strong> <strong>Airport</strong> forecast fleet mix and are capable of traveling non-stop to the West Coast from T.F. <strong>Green</strong> <strong>Airport</strong>(2,300 nautical miles) are included in this chart.Chapter 2 – Purpose and Need 2-26 July 2011\\mawatr\ev\09228.00\reports\<strong>FEIS</strong>_Final_July_2011\<strong>PVD</strong>_CH02_P&N_JUL_2011.doc
T.F. <strong>Green</strong> <strong>Airport</strong> <strong>Improvement</strong> <strong>Program</strong>Environmental Impact Statement and Final Section 4(f) EvaluationRIAC, as the airport operator, needs to maintain flexibility in its facilities in order to service the demand of thetraveling public safely and efficiently. If there are a limited number of airlines that can serve a particular route dueto a unique combination of aircraft and engine types, it is less likely that the <strong>Airport</strong> will be able to reliably servethat market. Likewise, if an airline is limited in the number of aircraft configurations that it can use to serve aparticular market, it limits the flexibility for that airline to substitute other aircraft as scheduling, weather delays,and maintenance requirements may warrant. A longer primary runway not only benefits service to long-haulmarkets, but also medium- and short-haul markets. For example, an airline that is currently serving a particularmarket with a regional jet may be able to serve that same route with a larger narrowbody jet that requires greaterrunway length, thereby offering greater schedule flexibility. This flexibility creates less inherent business risk to anairline that initiates service to a new market.Lengthening the primary runway (Runway 5-23) would provide flexibility to airlines as they change fleet mixesand provide the opportunity for air carriers to initiate non-stop service to West Coast markets (such as theLos Angeles area, San Francisco Bay area, and Seattle) and potentially trans-Atlantic destinations in the future(such as London and southern destinations in the Caribbean) as an alternate option to Logan <strong>Airport</strong>. 80 Without anextended primary runway, RIAC’s air service development opportunities are restricted due to unaddressedphysical airfield limitations. As a result, leakage from the T.F. <strong>Green</strong> <strong>Airport</strong> catchment area to Logan <strong>Airport</strong> willcontinue. Continued leakage of passengers to Logan <strong>Airport</strong> will result in decreased efficiency of the New EnglandRegional <strong>Airport</strong> System as a whole and limit RIAC’s ability to meet its mission.2.3.2.2 Terminal ComplexThe existing passenger terminal at the <strong>Airport</strong> provides a total of 352,000 square feet of passenger processing facilities.Figure 1-4 depicts the existing terminal area at T.F. <strong>Green</strong> <strong>Airport</strong>. This area includes 22 gates with 16 jet bridges.Additional support space includes passenger ticketing, public circulation and support, passenger departure lounges,concessions, passenger security checkpoints, baggage handling, and airline administrative support. Based upon theforecast increase in passenger volumes and the evolution of the fleet mix to include larger and longer-range aircraft,future modifications to the facilities associated with the terminal complex will be required to enhance efficiency andpassenger convenience. Terminal complex facilities that would require modifications based on passenger demandduring the planning period include aircraft gates, concourse area, terminal apron and taxilanes, and the central heatingand cooling plant. These facilities are described further in this section.GatesThere are currently 22 gates at T.F. <strong>Green</strong> <strong>Airport</strong>. Based on the analysis in the 2002 T.F. <strong>Green</strong> <strong>Airport</strong> Master PlanUpdate, projected total gate requirements were expected to reach 40 gates by 2020. 81 The 2002 T.F. <strong>Green</strong> <strong>Airport</strong>Master Plan Update passenger gate requirements were developed for long-term planning purposes and the exacttiming of construction would be determined based on actual passenger demand.80 The New England Regional <strong>Airport</strong> System Plan, New England <strong>Airport</strong> Coalition, Fall 2006, page 1.81 T.F. <strong>Green</strong> <strong>Airport</strong> Master Plan Update. Landrum & Brown, Inc., 2002.Chapter 2 – Purpose and Need 2-27 July 2011\\mawatr\ev\09228.00\reports\<strong>FEIS</strong>_Final_July_2011\<strong>PVD</strong>_CH02_P&N_JUL_2011.doc
T.F. <strong>Green</strong> <strong>Airport</strong> <strong>Improvement</strong> <strong>Program</strong>Environmental Impact Statement and Final Section 4(f) EvaluationThe Master Plan Update used the following methods to estimate future gate requirements:• Annual Enplaned Passengers per Gate Method• Annual Departures per Gate Method• Percent Increase in Annual Operations MethodNone of these methods take into account changes in gate utilization, airline gate use characteristics, gate leasingarrangements, or fleet mix through 2025; therefore they only indicate potential need based on simple assumptionsof gate demand. Detailed passenger terminal planning will be required to define the exact number and type ofgates needed to meet anticipated airline and passenger demand.The analysis indicates that up to 26 gates could be needed by 2020 (four more gates than currently provided at the<strong>Airport</strong>), and up to 29 gates could be needed by 2025 (seven more gates than currently provided at the <strong>Airport</strong>)when taking into account the Incremental Build Alternative Forecast added to the 2010 <strong>FEIS</strong> No-Action AlternativeForecast. Since up to seven additional gates may be required within the EIS timeframe with the proposed runwayextension, it is reasonable to assess the impacts of seven additional gates.Annual Enplaned Passengers per Gate MethodThis method applies the ratio of annual enplaned passengers per gate for the existing EIS year (125,209 annualpassenger enplanements per gate based on 2004) to the EIS future study years, and assumes that the current usageand utilization of the gates will remain constant over the EIS study timeframe. Table 2-5 shows the results of theanalysis of the annual passenger enplanements per gate method using the 2010 <strong>FEIS</strong> Forecasts (No-ActionAlternative and the Build Forecast). Based on the 2010 <strong>FEIS</strong> No-Action Alternative Forecast and the 2010 BuildAlternative Forecast, the analysis using this method shows that 23 to 26 gates could be needed by 2020 and 26 to 29gates would be needed by 2025.Chapter 2 – Purpose and Need 2-28 July 2011\\mawatr\ev\09228.00\reports\<strong>FEIS</strong>_Final_July_2011\<strong>PVD</strong>_CH02_P&N_JUL_2011.doc
T.F. <strong>Green</strong> <strong>Airport</strong> <strong>Improvement</strong> <strong>Program</strong>Environmental Impact Statement and Final Section 4(f) EvaluationTable 2-5Annual Enplaned Passengers per Gate Method – 2010 <strong>FEIS</strong> No-Action Alternative andBuild Alternative Forecasts2010 <strong>FEIS</strong> No-ActionForecast Enplaned Build Forecast Enplaned Passenger Enplanements Estimated GateYear Passengers 1 Passengers 2 per Gate Requirement 32004 2,754,593 n/a 125,209 22 42015 2,637,438 3,020,302 125,209 21-242020 2,922,399 3,306,311 125,209 23-262025 3,259,654 3,675,621 125,209 26-29n/a = not applicable; 2004 represents existing conditions prior to the implementation of any potential Build Alternative.Sources: Vanasse Hangen Brustlin (2010).1 Forecast based on existing infrastructure and facilities at T.F. <strong>Green</strong> <strong>Airport</strong>.2 Forecast includes 2010 <strong>FEIS</strong> No-Action Alternative Forecast and Incremental Build Alternative Forecast. The extension to Runway 5-23 for Alternative B4 would be implemented by 2015. Alternative B2, including extending Runway 5-23, would be implemented by 2020. The facility requirements analysis provided in thischapter only considers the 2015 implementation of the Build Alternatives (see Table 2-2).3 Includes range from 2010 <strong>FEIS</strong> No-Action Forecast to <strong>FEIS</strong> Build Forecast in the future years.4 There are currently 22 gates at the terminal.Annual Departures per Gate MethodThis method applies the ratio of annual departures per gate for the existing EIS year (1,841 annual air carrier andcommuter aircraft departures per gate based on 2004) to the EIS future study years, and assumes that the currentusage and utilization of the gates will remain constant over the EIS study timeframe. Table 2-6 shows the results ofthe analysis of the annual departures per gate method using the 2010 <strong>FEIS</strong> Forecast. The analysis using this methodshows that additional gates may not be required during the EIS study years.Table 2-6Annual Departures per Gate Method – 2010 <strong>FEIS</strong> No-Action Alternative and Build AlternativeForecasts2010 <strong>FEIS</strong> No-Action <strong>FEIS</strong> Build Forecast AirForecast Air Carrier and Carrier and CommuterCommuter Airline Airline Departures 2 Estimated GateYear Departures 1 Operations per Gate Requirement 32004 40,496 n/a 1,841 22 22015 32,659 37,039 1,841 18-202020 34,708 39,100 1,841 19-212025 36,921 41,301 1,841 20-22n/a = not applicable; 2004 represents existing conditions prior to the implementation of any potential Build Alternative.Sources: Vanasse Hangen Brustlin (2010).1 Forecast based on existing infrastructure and facilities at T.F. <strong>Green</strong> <strong>Airport</strong>; includes Air Carrier and scheduled air taxi departures.2 Forecast includes 2010 <strong>FEIS</strong> No-Action Alternative Forecast and Incremental Build Alternative Forecast. The extension to Runway 5-23 for Alternative B4 would beimplemented by 2015. Alternative B2, including extending Runway 5-23, would be implemented by 2020. The facility requirements analysis provided in this chapteronly considers the 2015 implementation of the Build Alternatives (see Table 2-2).3 Includes range from 2010 <strong>FEIS</strong> No-Action Forecast to <strong>FEIS</strong> Build Forecast in the future years.4 There are currently 22 gates at the terminal.Chapter 2 – Purpose and Need 2-29 July 2011\\mawatr\ev\09228.00\reports\<strong>FEIS</strong>_Final_July_2011\<strong>PVD</strong>_CH02_P&N_JUL_2011.doc
T.F. <strong>Green</strong> <strong>Airport</strong> <strong>Improvement</strong> <strong>Program</strong>Environmental Impact Statement and Final Section 4(f) EvaluationPercent Increase in Annual Operations MethodThis method assumes that the number of gates needed will increase at the same rate as the anticipated increase inannual passenger operations for either the 2010 <strong>FEIS</strong> No-Action Alternative Forecast or the 2010 <strong>FEIS</strong> BuildAlternative Forecast through 2025. This method does not take into account changes in fleet mix, which couldchange gate usage. Table 2-7 shows the results of the analysis of the percent increase in annual operations methodusing both forecasts. The analysis using this method shows that additional gates may not be required during theEIS study years.Table 2-7Percent Increase in Annual Operations Method – 2010 <strong>FEIS</strong> No-Action Alternative and BuildAlternative Forecasts2010 <strong>FEIS</strong> No-Action ForecastAir Carrier and Commuter AirlineYear Operations 1 Percent Change Estimated Gate Requirement2004 80,991 - 22 22015 65,317 -19.4% 182020 69,416 6.3% 202025 73,8426.4% 22<strong>FEIS</strong> Build Alternative ForecastAir Carrier and Commuter AirlineYear Operations 3 Percent Change Estimated Gate Requirement2004 80,991 - 22 22015 74,077 -8.5% 202020 78,200 5.6% 212025 82,602 5.6% 22Sources: Vanasse Hangen Brustlin (2010).1 Forecast based on existing infrastructure and facilities at T.F. <strong>Green</strong> <strong>Airport</strong>; includes Air Carrier and scheduled Air Taxi operations.2 There are currently 22 gates at the terminal building.3 Forecast includes 2010 <strong>FEIS</strong> No-Action Alternative Forecast and Incremental Build Alternative Forecast. The extension to Runway 5-23 for Alternative B4 would be implemented by 2015. Alternative B2, including extending Runway 5-23, would be implemented by 2020. The facility requirements analysis provided in thischapter only considers the 2015 implementation of the Build Alternatives (see Table 2-2); includes Air Carrier and scheduled Air Taxi operations.ConcourseThe existing terminal building provides approximately 352,000 square feet, including the concourse, or16,000 square feet of passenger-processing facilities per gate. The 2002 T.F. <strong>Green</strong> <strong>Airport</strong> Master Plan Updateindicates that an appropriate number of square feet per gate should approach 20,000 square feet to accommodatethe projected total annual passengers and the increased use of larger aircraft. Based on this ratio, there is currentlya total deficiency of nearly 90,000 square feet. The 2002 T.F. <strong>Green</strong> <strong>Airport</strong> Master Plan Update also states that“annual activity exceeding six million passengers will trigger the need for initial terminal expansion toapproximately 500,000 square feet of building.” 82 The 2010 <strong>FEIS</strong> No-Action Alternative Forecast indicates that the<strong>Airport</strong> would reach six million annual passengers between 2020 and 2025 (Table 2-2). Incremental increases in82 T.F. <strong>Green</strong> <strong>Airport</strong> Master Plan Update, Landrum & Brown, Inc., 2002, Page III-32.Chapter 2 – Purpose and Need 2-30 July 2011\\mawatr\ev\09228.00\reports\<strong>FEIS</strong>_Final_July_2011\<strong>PVD</strong>_CH02_P&N_JUL_2011.doc
T.F. <strong>Green</strong> <strong>Airport</strong> <strong>Improvement</strong> <strong>Program</strong>Environmental Impact Statement and Final Section 4(f) Evaluationpassenger demand due to the proposed runway extension could result in an earlier need for the proposedconcourse expansion. Additional concourse area could require an upgraded or new central heating and coolingplant facility. Passenger convenience would be enhanced through increased passenger throughput efficiency withconcourse facilities that match passenger demand levels.Additional gates would require modifications to terminal apron and connecting taxilanes. The addition of aircraftgates based on passenger demand would enhance the efficiency of the aircraft-terminal-passenger interface.2.3.2.3 CargoAir cargo encompasses both air freight and air mail. T.F. <strong>Green</strong> <strong>Airport</strong> has two major classes of air freightoperators serving both forms of air cargo. Integrated cargo airlines such as Federal Express and UPS operateall-cargo aircraft to their hubs in Memphis, TN, and Louisville, KY, respectively. Passenger airlines also carry cargoin the aircraft bellies during regularly scheduled flights. Adequate facilities to ensure efficient ground movements,storage, and aircraft loading and unloading are critical to air cargo operations.Belly CargoTwo facilities currently accommodate belly cargo operations at the <strong>Airport</strong>: the shared belly cargo and GSEmaintenance building south of the terminal, and the U.S. Postal Service (USPS) facility adjacent to the belly cargoand GSE maintenance building. The existing belly cargo and GSE maintenance building would be demolished toaccommodate the proposed terminal and apron expansion, requiring that the belly cargo facilities be replaced.Therefore, space currently available for handling belly cargo would need to be replaced and sized appropriately toaccommodate anticipated belly cargo demand requirements. It is anticipated that as total airport operations andaverage aircraft size continue to increase throughout the planning period, belly cargo capacity would also increase.Integrated CargoThe Integrated Cargo facilities currently have 19,400 square feet of available building space. The 2002 T.F. <strong>Green</strong><strong>Airport</strong> Master Plan Update developed a maximum tonnage per area ratio (TAR) 83 based on industry standards atthat time and on discussions with integrated cargo carrier representatives to determine the amount of requiredbuilding space to accommodate dedicated air cargo operations at the <strong>Airport</strong>. Current trends in the air cargoindustry reflect a range in the TAR based on the level of automation in the cargo facility. For example, currently aTAR of 0.5 is used for planning facilities that would accommodate lower levels of automation (mostly manual) anda TAR of 1.0 is used to accommodate average levels of automation. 84 It is anticipated that the T.F. <strong>Green</strong> <strong>Airport</strong> aircargo facility would be within this range of TAR values. It is not anticipated that a sophisticated sort facility withhigh levels of automation will be needed at the <strong>Airport</strong> as each of the current cargo carriers use off-<strong>Airport</strong> sortingfacilities.The industry accepted range of space requirements was applied to the 2010 <strong>FEIS</strong> No-Action Forecast and the analysis isshown in Table 2-8. Building space requirements of between 25,369 square feet and 50,738 square feet would be neededby 2020, which is between approximately 6,000 and 31,000 square feet greater than existing cargo facilities at the <strong>Airport</strong>.This range of potential air cargo facility requirements is consistent with the findings in the Master Plan Update, which83 T.F. <strong>Green</strong> <strong>Airport</strong> Master Plan Update, Landrum & Brown, Inc., 2002, Page III-49.84 <strong>Airport</strong> Development Reference Manual, 9 th Edition, January 2004, IATA, Montreal, Canada.Chapter 2 – Purpose and Need 2-31 July 2011\\mawatr\ev\09228.00\reports\<strong>FEIS</strong>_Final_July_2011\<strong>PVD</strong>_CH02_P&N_JUL_2011.doc
T.F. <strong>Green</strong> <strong>Airport</strong> <strong>Improvement</strong> <strong>Program</strong>Environmental Impact Statement and Final Section 4(f) Evaluationestimated that a facility with 49,200 square feet would be needed by 2020. The incremental increase in forecastoperations and passengers associated with the proposed runway extension would not affect the integrated cargodemand at T.F. <strong>Green</strong> <strong>Airport</strong>.Corresponding aircraft apron and landside facilities (truck and auto parking) would be needed to match the capacity ofthe integrated cargo carrier building in the future.Table 2-8Integrated Cargo Carrier Building Facility Requirements2010 <strong>FEIS</strong> No-ActionYearForecast Tons of AirFreight and Air Mail(U.S. tons) TAR Value Range 1 Building Area Requiredwith TAR Value Range(sq. ft.)Range of Surplus (Deficit)(sq. ft.)2004 17,682 0.5-1.0 17,682 – 35,364 1,718 – (15,964)2015 22,576 0.5-1.0 22,576 – 45,152 (3,176) – (25,752)2020 25,369 0.5-1.0 25,369 – 50,738 (5,969) – (31,338)2025 28,793 0.5-1.0 28,793 – 57,586 (9,393) – (38,186)Sources: <strong>Airport</strong> Development Reference Manual, 9 th Edition, January 2004, IATA; Vanasse Hangen Brustlin (2010).Note: There is no anticipated increase in the tons of air freight and air mail due to the proposed runway extension, therefore only the 2010 <strong>FEIS</strong> No-Action Alternative Forecast is considered in this analysis.1 TAR based on industry standards for low to average levels of cargo facility automation from the International Air Transport Association (IATA).2.3.2.4 Support FacilitiesSeveral support facilities are currently undersized or would require upgrading to accommodate forecastoperational demand, and others would be impacted by proposed terminal and apron improvements. Supportfacilities provide services to ensure efficient operations to all aircraft operators using an airport.Ground Support Equipment MaintenanceThe existing belly cargo and GSE maintenance functions are operating in a shared facility, totaling ninemaintenance bays and 14,900 square feet. Continued growth in GSE maintenance activities is expected as a resultof the anticipated new entrant air carriers, the addition of terminal gates, shifts in the fleet mix, and increased dailydeparture activity, all of which will require additional equipment. Table 2-9 shows the GSE maintenance facilityrequirements analysis using methodology consistent with the 2002 T.F. <strong>Green</strong> <strong>Airport</strong> Master Plan Update and updatedto reflect the 2010 <strong>FEIS</strong> No-Action and Build Alternatives Forecasts. Based on the updated analysis, the <strong>Airport</strong> will needup to 944 square feet of additional space by 2020 and 2,713 square feet of additional space (including one additionalmaintenance bay) by 2025. The updated facility requirements analysis does not include GSE from Northstar Aviationand from the integrated cargo carriers. 85Fuel FarmThe existing fuel farm has a total Jet A fuel storage capacity of 300,000 gallons in six 50,000-gallon above-ground storagetanks. The 2002 T.F. <strong>Green</strong> <strong>Airport</strong> Master Plan Update determined anticipated fuel requirements based on peak monthaverage day (PMAD) demand, which was 491 gallons per operation in 2000. The 2002 T.F. <strong>Green</strong> <strong>Airport</strong> Master PlanUpdate shows that a capacity of nearly 735,000 gallons will be required by 2020. Applying the same methodology used85 According to the 2002 T.F. <strong>Green</strong> Master Plan Update, Northstar Aviation, and the integrated cargo carriers conduct their own GSE maintenance at their ownfacilities, or utilize a maintenance company located in Hangar No. 2 at the <strong>Airport</strong>.Chapter 2 – Purpose and Need 2-32 July 2011\\mawatr\ev\09228.00\reports\<strong>FEIS</strong>_Final_July_2011\<strong>PVD</strong>_CH02_P&N_JUL_2011.doc
T.F. <strong>Green</strong> <strong>Airport</strong> <strong>Improvement</strong> <strong>Program</strong>Environmental Impact Statement and Final Section 4(f) Evaluationin the 2002 T.F. <strong>Green</strong> <strong>Airport</strong> Master Plan Update, a separate analysis was conducted with the 2004 EIS Forecast 86 andhas been updated to reflect the 2010 <strong>FEIS</strong> No-Action and Build Alternatives Forecast demand levels, as shown inTable 2-10. The analysis indicates that there was an existing shortfall of approximately 128,000 gallons in the <strong>Airport</strong>’sthree-day Jet A fuel storage capacity in 2004. Although anticipated commercial service aircraft operations activity hasdeclined recently, as reflected in the latest EIS forecast revisions, up to 110,000 gallons of additional capacity by 2020 andup to approximately 135,000 gallons of additional capacity are needed by 2025.Table 2-9GSE Maintenance Building Requirements– 2010 <strong>FEIS</strong> No-Action Alternative and BuildAlternative Forecasts2010 <strong>FEIS</strong> No-Action Forecast Total Motorized Maintenance Building Requirements Surplus (Deficit)Year Cumulative GSE Growth Rate 1 GSE Units Bays 2 Square Feet 3 Bays Square Feet2004 4 — 70 9 15,700 0 (800)2015 (15.5)% 60 8 13,925 1 9752020 10.3% 67 9 15,656 0 (756)2025 12.6% 76 10 17,425 (1) (2,525)<strong>FEIS</strong> Build Alternative Forecast Total Motorized Maintenance Building Requirements Surplus (Deficit)Year Cumulative GSE Growth Rate 1,5 GSE Units Bays 2 Square Feet 3 Bays Square Feet2004 4 — 70 9 15,700 0 (800)2015 (0.6)% 70 9 15,700 0 (800)2020 10.1% 77 9 15,844 0 (944)2025 11.1% 86 10 17,613 (1) (2,713)Sources: T.F. <strong>Green</strong> <strong>Airport</strong> Master Plan Update, Landrum & Brown, Inc., 2002, Page III-68; Vanasse Hangen Brustlin (2010).1 Growth rate based on gate growth percentage (Annual Enplaned Passengers per Gate Method, which produced most demanding gate requirements results), plus combined aircarrier and commuter daily departure growth, multiplied by a diversity factor of 0.65).2 A single maintenance bay can typically service a fleet of 8-12 motorized GSE units on a single work shift basis. This analysis assumes that each bay would accommodate 8.25GSE units on average, which is consistent with the 2002 T.F. <strong>Green</strong> <strong>Airport</strong> Master Plan Update.3 Square footage requirements based on 1,280 square feet per bay for bay and support space, added to 15 square feet per GSE unit for storage, plus a 25 percent gross-up factor,which includes some inefficiency in dividing up space among tenants.4 A total of 9 bays and 14,900 square feet were available in 2004.5 Forecast includes 2010 <strong>FEIS</strong> No-Action Alternative Forecast and Incremental Build Alternative Forecast. The extension to Runway 5-23 for Alternative B4 would beimplemented by 2015. Alternative B2, including extending Runway 5-23, would be implemented by 2020. The facility requirements analysis provided in this chapteronly considers the 2015 implementation of the Build Alternatives (see Table 2-2).86 Existing and Future Fuel Demand and Fuel Farm Storage Capacity Expansion Analysis, T.F. <strong>Green</strong> <strong>Airport</strong>; Final Technical Report, Vanasse Hangen Brustlin,Inc. April 13, 2007, Page 16.Chapter 2 – Purpose and Need 2-33 July 2011\\mawatr\ev\09228.00\reports\<strong>FEIS</strong>_Final_July_2011\<strong>PVD</strong>_CH02_P&N_JUL_2011.doc
T.F. <strong>Green</strong> <strong>Airport</strong> <strong>Improvement</strong> <strong>Program</strong>Environmental Impact Statement and Final Section 4(f) EvaluationTable 2-10Jet A Fuel Farm Demand and Capacity Requirements – 2010 <strong>FEIS</strong> No-Action Alternative andBuild Alternative Forecast2010 EIS No-Action Alternative Peak Month PMAD Jet A Three-day Jet A FuelForecast Annual Commercial Commercial Aircraft PMAD Commercial Fuel Demand Supply Demand DeficitYear Aircraft Operations 1 Operations 2 Aircraft Operations 3 (gallons) 4 (gallons) 5 (gallons)2004 85,166 8,006 267 142,765 428,295 (128,295)2015 68,484 6,438 215 115,004 345,012 (45,012)2020 73,007 6,863 229 122,492 367,476 (67,476)2025 77,841 7,317 244 130,516 391,548 (91,548)<strong>FEIS</strong> Build Alternative Peak Month PMAD Jet A Three-day Jet AForecast Annual Commercial Commercial Aircraft PMAD Commercial Fuel Demand Fuel Supply Demand DeficitYear Aircraft Operations 1,5 Operations 2 Aircraft Operations 3 (gallons) 4 (gallons) (gallons)2004 85,166 8,006 267 142,765 428,295 (128,295)2015 77,244 7,261 242 129,446 388,338 (88,338)2020 81,791 7,688 256 136,934 410,802 (110,802)2025 86,601 8,141 271 144,958 434,874 (134,874)Sources: Existing and Future Fuel Demand and Fuel Farm Storage Capacity Expansion Analysis, T.F. <strong>Green</strong> <strong>Airport</strong>; Final Technical Report, Vanasse Hangen Brustlin, Inc.April 13, 2007; Vanasse Hangen Brustlin (2010).Note: PMAD is Peak Month Average Day.1 Includes Air Carrier and Air Taxi aircraft operations.2 Based on 9.4 percent of the total annual commercial aircraft operations. The 9.4 percent is the historical percentage of the peak month operations for years 2003-2005.3 The peak month average day (PMAD) commercial aircraft operations is the peak month commercial aircraft operations divided by 30 days.4 The PMAD Jet A fuel demand is based on a ratio of 534.9 gallons per PMAD aircraft operation, and was derived from actual data in 2005.5 Forecast includes 2010 <strong>FEIS</strong> No-Action Alternative Forecast and Incremental Build Alternative Forecast. The extension to Runway 5-23 for Alternative B4 would beimplemented by 2015. Alternative B2, including extending Runway 5-23, would be implemented by 2020. The facility requirements analysis provided in this chapteronly considers the 2015 implementation of the Build Alternatives (see Table 2-2).The existing GSE maintenance facility is deficient under both existing and the 2010 <strong>FEIS</strong> No-Action and BuildAlternative Forecast conditions in 2020 and 2025. A new or updated GSE maintenance facility is needed to repairand maintain vehicles involved in airfield operations.The existing storage capacity is inadequate for existing or anticipated fuel needs, and does not meet industrystandards for processing procedures and fuel settling times, resulting in a maximum throughput for a fuel farmwith a given storage capacity. Additional storage capacity is needed to increase throughput and ensure efficientfueling operations at the <strong>Airport</strong>.2.3.2.5 RoadwaysThe existing Terminal Loop Roadway experiences excessive peak hour delays as a result of deficiencies associatedwith the internal signalized intersection:• Re-circulating terminal traffic from the airport loop road destined for the curb front must pass through thesignalized intersection;• The inefficient approach geometry results in poor signal equipment placement and direction, whichcontributes to driver error and delay;• The high number of signal phases increases overall cycle length;• Eastbound approach lanes from the short-term parking lot to the signalized intersection operate in excess ofcapacity. Substandard roadway geometry and sight distance also contribute to the breakdown in traffic flowChapter 2 – Purpose and Need 2-34 July 2011\\mawatr\ev\09228.00\reports\<strong>FEIS</strong>_Final_July_2011\<strong>PVD</strong>_CH02_P&N_JUL_2011.doc
T.F. <strong>Green</strong> <strong>Airport</strong> <strong>Improvement</strong> <strong>Program</strong>Environmental Impact Statement and Final Section 4(f) Evaluationon this portion of the Terminal Loop Roadway during peak periods. Insufficient site distance could contributeto safety concerns on the terminal roadways;• The lack of available right-of-way and location of structural supports for the upper level departure roadwayconstrain capacity improvements at the existing signalized intersection;• The substandard weave distance between the short-term parking lot exit and the intersection conflicts with themovement of re-circulating traffic;• Extended queue lengths on the loop roadway impair the performance of the short-term parking lot exit lanesand plaza, creating extended queues in the short-term parking lot;• The insufficient weave length between the intersection and the terminal curb front adversely affects safety; and,• Recirculating traffic on the Terminal Loop Roadway system has the potential to create an unsafe condition,particularly with drivers unfamiliar with the <strong>Airport</strong> and its environs.Without improvements to the system of roadways that provide access to the terminal area for the traveling public,non-airport related local traffic patterns would continue to be impacted by the <strong>Airport</strong>'s operation, traffic flowsand peaking characteristics and ultimately negatively impact vehicular movement on area roadways. Specifically,the current traffic conditions (categorized as unstable traffic flow with traffic demand approaching or at roadwaycapacity) are expected to deteriorate further in the future. Delays would become more pronounced and would besustained over a longer period of time. A progressive failure in traffic conditions would exacerbate delays alongthe southern portion of the Terminal Loop Roadway.2.3.2.6 Parking FacilitiesThere are two types of public parking facilities at most airports in U.S., including T.F. <strong>Green</strong> <strong>Airport</strong>: short-termand long-term parking. Short-term parking generally consists of vehicles parking for less than five hours andusually includes acquaintances picking up or dropping off air passengers. Long-term parking is for longer stays,including overnight parking and is generally less expensive on a per-hour basis than short-term parking.Passengers that drive to the <strong>Airport</strong> themselves and employees working a minimum of eight-hour shifts typicallywould park in long-term parking areas. Currently, most T.F. <strong>Green</strong> <strong>Airport</strong> employees park in the long-termparking areas; however, some park in the short-term area. A total of 591 on-airport short-term parking spaces areavailable in Hourly Lot D (surface lot directly across from the passenger terminal). This is adequate for theshort-term parking needs of T.F. <strong>Green</strong> <strong>Airport</strong> throughout the planning period with the 2010 <strong>FEIS</strong> No-ActionForecast. 87To maintain efficient and convenient air transportation, which includes the ease of use and access associated withautomobile parking, RIAC must consolidate <strong>Airport</strong> employee parking in the long-term parking area. Therefore, theemployee parking demand must be considered with passenger demand to determine long-term parking requirementsat the <strong>Airport</strong>. Table 2-11 shows the anticipated long-term parking requirements at T.F. <strong>Green</strong> <strong>Airport</strong> using a ratio of2.5 passenger parking spaces per 1,000 annual passenger enplanements, and a ratio of 0.5 employee parking spacesper 1,000 passenger enplanements (consistent the 2002 T.F. <strong>Green</strong> <strong>Airport</strong> Master Plan Update). 88 Based on the87 T.F. <strong>Green</strong> <strong>Airport</strong> Master Plan Update, Landrum & Brown, Inc., 2002, Page III-42.88 Ibid, Page III-45.Chapter 2 – Purpose and Need 2-35 July 2011\\mawatr\ev\09228.00\reports\<strong>FEIS</strong>_Final_July_2011\<strong>PVD</strong>_CH02_P&N_JUL_2011.doc
T.F. <strong>Green</strong> <strong>Airport</strong> <strong>Improvement</strong> <strong>Program</strong>Environmental Impact Statement and Final Section 4(f) Evaluationpassenger and <strong>Airport</strong> employee demand levels, T.F. <strong>Green</strong> <strong>Airport</strong> will need up to 1,440 spaces by 2020 and2,548 spaces by 2025.Table 2-11 Long-Term Passenger and <strong>Airport</strong> Employee Parking Requirements at T.F. <strong>Green</strong> <strong>Airport</strong> –2010 <strong>FEIS</strong> No-Action Alternative and Build Alternative ForecastsYear2010 <strong>FEIS</strong> No-Action Alternative ForecastAnnual Passenger Enplanements 1Available Long-TermParking Spaces 2Passenger 3 and <strong>Airport</strong> Employee 4 Demand(parking spaces)Difference(parking spaces)2004 2,754,593 8,330 8,318 +122015 2,637,438 8,479 7,913 +5662020 2,922,399 8,479 8,767 -2882025 3,259,654 8,479 9,779 -1,300YearBuild Alternative ForecastAnnual Passenger Enplanements 1,5Available Long-TermParking Spaces 2Passenger 3 and <strong>Airport</strong>Employee 4 Demand(parking spaces)Difference(parking spaces)2004 2,754,593 8,330 8,318 +122015 3,020,302 8,479 9,061 -5822020 3,306,311 8,479 9,919 -1,4402025 3,675,621 8,479 11,027 -2,548Sources: Vanasse Hangen Brustlin, 2010; T.F. <strong>Green</strong> <strong>Airport</strong> Master Plan Update, Landrum & Brown, Inc., 2002, Pages III-44 and III-45.1 Passenger enplanements equal half of Total Passengers (Table 2-2). Based on 2010 <strong>FEIS</strong> No-Action Alternative Forecast.2 Based on 4,580 spaces in Long-Term Lot E, 1,500 spaces in Garage A, 750 spaces in Garage B, and 1,500 spaces in Garage C; available parking spaces increase by 2015 because rental car companies have relocated from Garage A to the InterLink (149 parking spaces).3 Ratio of passenger parking demand equals 2.5 parking spaces per 1,000 annual passenger enplanements.4 Ratio of airport employee parking demand equals 0.5 parking spaces per 1,000 annual passenger enplanements (consistent with the 2002 T.F. <strong>Green</strong> <strong>Airport</strong> MasterPlan Update); calculations for year 2004 airport employee parking demand considers all airport employees using the long-term parking facilities.5 Forecast includes 2010 <strong>FEIS</strong> No-Action Alternative Forecast and Incremental Build Alternative Forecast. The extension to Runway 5-23 for Alternative B4 would beimplemented by 2015. Alternative B2, including extending Runway 5-23, would be implemented by 2020. The facility requirements analysis provided in this chapteronly considers the 2015 implementation of the Build Alternatives (see Table 2-2).Without parking improvements, roadway capacity would be unnecessarily degraded as airport employees andcustomers re-circulate through the roadway system in competition for available parking spaces. This would add tocongestion, and could possibly reduce the safety and efficiency of traffic operations, since drivers would belooking for parking as well as navigating the roadways. If no parking capacity is added, it is possible thatadditional privately operated remote lots would be developed off the airport resulting in lost revenueopportunities for the <strong>Airport</strong>.The long-term passenger requirements shown in Table 2-11 does not take into account the capacity of off-airportparking facilities that RIAC does not control. Also, the long-term parking requirements do not take into accountany effect the InterLink may have on T.F. <strong>Green</strong> <strong>Airport</strong> on-airport parking demands. Parking at the InterLink isintended for the daily rail and bus commuter users, and is not intended for airport or overnight parking. Dailyrates are $6.75, and there is a $30 nightly surcharge for overnight parking. By comparison, long-term parking atT.F. <strong>Green</strong> <strong>Airport</strong> costs just $15 to$18 per day (and $60 per week). Therefore, a financial incentive exists to keeplong-term parking demand at T.F. <strong>Green</strong> <strong>Airport</strong>.Chapter 2 – Purpose and Need 2-36 July 2011\\mawatr\ev\09228.00\reports\<strong>FEIS</strong>_Final_July_2011\<strong>PVD</strong>_CH02_P&N_JUL_2011.doc
T.F. <strong>Green</strong> <strong>Airport</strong> <strong>Improvement</strong> <strong>Program</strong>Environmental Impact Statement and Final Section 4(f) Evaluation2.4 Summary of the Purpose and Need for the T.F. <strong>Green</strong> <strong>Airport</strong> <strong>Improvement</strong> <strong>Program</strong>RIAC has conducted extensive planning efforts to identify and, where appropriate, implement facilityrequirements at T.F. <strong>Green</strong> <strong>Airport</strong> to provide “safe, efficient, and convenient air transportation” for the region.RIAC’s airport planning efforts identified a number of safety and efficiency enhancements that are needed as partof the T.F. <strong>Green</strong> <strong>Airport</strong> <strong>Improvement</strong> <strong>Program</strong>.The 2002 T.F. <strong>Green</strong> <strong>Airport</strong> Master Plan Update and the 2004 T.F. <strong>Green</strong> <strong>Airport</strong> Master Plan Supplementidentified three airfield facilities that do not meet current FAA airport design guidelines and therefore need to beupgraded:• Runway 16-34 RSA – The RSAs associated with Runway 16-34 do not meet current FAA airport designstandards. The Runway 16-34 pavement is in poor condition and needs to be rehabilitated to avoid unsafeoccurrences of FOD on the airfield.• Taxiway C - The separation of Taxiway C and Runway 16-34 does not meet current FAA airport designstandards. Taxiway C needs to be moved 100 feet farther from Runway 16-34 (total of 400 feet) to meet thecurrent design standards and enhance the safety of airfield operations.• Hangar No. 1 – Hangar No.1 is located within the Runway 16-34 OFA and penetrates a protected airspacesurface. The hangar needs to be removed from its current location to meet current FAA airport designstandards and remove an obstruction to air navigation.RIAC’s planning efforts have also identified facilities in the T.F. <strong>Green</strong> <strong>Airport</strong> landside, passenger terminal, andairfield areas that need to be enhanced for the efficiency of passenger movements getting to the terminal and withinthe terminal; of airfield operations; and, of passenger air service within the New England Regional <strong>Airport</strong> System.Although the scale of some of these projects have been adjusted during the planning and EIS process to reflect morecurrent market conditions, the FAA has confirmed the need for each of the proposed efficiency-related enhancementsby considering the 2010 <strong>FEIS</strong> No-Action and Incremental Build Alternative Forecasts in all relevant demand analyses.<strong>Airport</strong> facility enhancements needed for the efficiency of passenger movements include:• Passenger terminal complex - Based upon the anticipated increase in passenger volumes and the evolution ofthe fleet mix to include larger and longer-range aircraft, future modifications to the facilities associated withthe terminal complex will be required to enhance efficiency and passenger convenience. Terminal complexfacilities that would need modifications include up to an additional seven aircraft gates, concourse area,terminal apron and taxilanes, and the central heating and cooling plant.• Roadways - The existing Terminal Loop Roadway experiences excessive peak hour delays as a result ofdeficiencies associated with the internal signalized intersection. Enhancements to the roadways that provideaccess to the terminal area are needed to enhance the existing level of service of the roadway system and avoidfurther deterioration in the roadway system level of service.Chapter 2 – Purpose and Need 2-37 July 2011\\mawatr\ev\09228.00\reports\<strong>FEIS</strong>_Final_July_2011\<strong>PVD</strong>_CH02_P&N_JUL_2011.doc
T.F. <strong>Green</strong> <strong>Airport</strong> <strong>Improvement</strong> <strong>Program</strong>Environmental Impact Statement and Final Section 4(f) Evaluation• Parking facilities – The current capacity of the <strong>Airport</strong>’s long-term passenger and airport employee parkingfacilities is sufficient for current demand. However, additional parking capacity must be provided toaccommodate anticipated passenger and airport employee demand by 2020.Airfield facilities needed to enhance the efficiency of airfield operations include:• Primary Runway Length – Reducing passenger leakage to Logan <strong>Airport</strong> would enhance the efficiency of the NewEngland Regional <strong>Airport</strong> System by “reducing the region’s over-reliance on Logan <strong>Airport</strong>.” 89 The primarycompetitive challenge that is within RIAC’s control to reduce leakage is inadequate primary runway length. The rangeof runway lengths required for non-stop service to West Coast markets by aircraft capable of providing the servicefrom T.F. <strong>Green</strong> <strong>Airport</strong> far exceed the existing primary runway length at the <strong>Airport</strong> (Chart 2-5). The primary runwaylength at T.F. <strong>Green</strong> <strong>Airport</strong> needs to be extended to an appropriate length that would allow airline service to reducepassenger leakage to Logan <strong>Airport</strong> by accommodating non-stop airline service to West Coast markets. A longerprimary runway not only benefits service to long-haul markets, but also medium- and short-haul markets.• Air cargo facilities - Two facilities currently accommodate belly cargo operations at the <strong>Airport</strong>. The existingbelly cargo and GSE maintenance building would be demolished to accommodate the proposed terminal andapron expansion, requiring that the belly cargo facilities be replaced. The Integrated Cargo facilities currentlyhave 19,400 square feet of available building space. Based on current industry standards, a facility sized betweenapproximately 18,000 and 35,000 square feet is needed to accommodate existing demand in 2004, and betweenapproximately 25,000 and 51,000 square feet to accommodate demand by 2020. A replacement facility for handlingbelly cargo will be needed and the integrated cargo facility is currently undersized. The efficiency of air cargofacilities will decrease in the future if additional capacity is not provided at the <strong>Airport</strong>.• Support facilities - The existing belly cargo and GSE maintenance functions are operating in a shared facility.The existing belly cargo and GSE maintenance building would be demolished to accommodate the proposedterminal and apron expansion, requiring that the GSE maintenance facilities be replaced. In addition, new GSEmaintenance facilities are needed to accommodate potential new entrant air carriers, the addition of terminalgates, shifts in the fleet mix, and increased daily departure activity. Demand for Jet A fuel exceeds the existingfuel farm’s capacity to receive, process, store, and deliver fuel. The existing fuel farm does not meet industrystandards for processing procedures and fuel settling times. Additional Jet A fuel storage capacity is needed toincrease throughput and ensure efficient fueling operations at the <strong>Airport</strong>.89 Logan International <strong>Airport</strong> Airside <strong>Improvement</strong>s Planning Project EIS, Boston, Massachusetts; FAA, New England Region; 2002.Chapter 2 – Purpose and Need 2-38 July 2011\\mawatr\ev\09228.00\reports\<strong>FEIS</strong>_Final_July_2011\<strong>PVD</strong>_CH02_P&N_JUL_2011.doc
T.F. <strong>Green</strong> <strong>Airport</strong> <strong>Improvement</strong> <strong>Program</strong>Environmental Impact Statement and Final Section 4(f) Evaluation3Alternatives Analysis3.1 IntroductionThis chapter describes the development, selection, and levels of screening of the range of alternativesconsidered to meet the Purpose and Need of the T.F. <strong>Green</strong> <strong>Airport</strong> <strong>Improvement</strong> <strong>Program</strong>, in accordance withFAA Order 1050.1E. It outlines the screening process used to identify which of those alternatives are reasonableand feasible and which should be eliminated from further evaluation or considered for further analysis. Thisscreening process is summarized in Section 3.2, Alternatives Screening Process, and discussed in detail inSections 3.3 through 3.8 of this chapter. Section 3.9, <strong>FEIS</strong> Analysis – Final Alternatives, the Preferred Alternative, andthe Environmentally Preferable Alternative, summarizes the environmental impacts of the alternatives thatemerged from the Level 1 through Level 6 screening process and describes the selection of the PreferredAlternative. More detailed description of the alternatives screening is included in DEIS Appendix E, AlternativesAnalysis, and a more detailed analysis of the environmental impacts of the proposed alternatives are included inChapter 5, Environmental Consequences. Sources cited in this chapter are provided in Chapter 11, References.The T.F. <strong>Green</strong> <strong>Airport</strong> <strong>Improvement</strong> <strong>Program</strong> contains various elements that are designed to meet thePurpose and Need, as defined in Chapter 2, Purpose and Need. Each program element addresses a specific safetyenhancement or efficiency enhancement need, and each program element could advance independently fromother program elements. The program elements were identified from a much larger project listing that wasdeveloped through the T.F. <strong>Green</strong> <strong>Airport</strong> Master Plan effort (2002 T.F. <strong>Green</strong> Master Plan Update and the2004 T.F. <strong>Green</strong> Master Plan Supplement) for the <strong>Airport</strong>’s projected 20-year facility requirements. The thoroughsix-level DEIS screening process narrowed the field of alternatives to two Build Alternatives (Alternatives B2and B4) and the no build or No-Action Alternative. The CEQ regulations that implement NEPA (40 CFR Parts1500-1508) state that the alternatives section is the heart of an EIS. 90 Those regulations and accompanyingguidance require that a federal decision-maker, in this case the FAA:• Develop and describe the range of alternatives capable of achieving the Purpose and Need (1505.1(e)),including alternatives not within the jurisdiction of the lead agency, and a No-Action Alternative(1502.14(d)); and90 Regulations for Implementing the Provisions of the NEPA, 40 CFR parts 1500-1508 Council on Environmental Quality.Chapter 3 – Alternatives Analysis 3-1 July 2011\\mawatr\ev\09228.00\reports\<strong>FEIS</strong>_Final_July_2011\<strong>PVD</strong>_CH03_Alternatives_JUL_2011.doc
T.F. <strong>Green</strong> <strong>Airport</strong> <strong>Improvement</strong> <strong>Program</strong>Environmental Impact Statement and Final Section 4(f) Evaluation• Rigorously explore and objectively evaluate these alternatives, and provide reasons why the federal entity(FAA) eliminated certain alternatives from further study.There are a set of terms used during the NEPA process including the Preferred Alternative, EnvironmentallyPreferable Alternative, and Proposed Action. These terms are defined below and used throughout this <strong>FEIS</strong>.• Preferred Alternative - CEQ regulations require the lead agency to identify its preferred alternative in theDEIS or <strong>FEIS</strong> (40 CFR section 1502.14(e)). The FAA is responsible for identifying the alternative that itbelieves would fulfill the agency’s mission and responsibilities and would meet the Purpose and Need,giving consideration to economic, environmental, technical, and other factors. 91• Environmentally Preferable Alternative - CEQ guidance encourages the lead agency to identify theenvironmentally preferable alternative in the EIS. CEQ regulations require the lead agency to identify it atthe time of its decision (40 CFR section 1505.2(b)). 92 In the ROD, the FAA will identify all alternativesconsidered by the agency in reaching its decision, and will specify the alternative which is considered toenvironmentally preferable. Preferences among alternatives based on relevant factors including economicand technical consideration and agency statutory mission will also be discussed. The EnvironmentallyPreferable Alternative may not meet the Purpose and Need.• Proposed Action - The lead agency is required to identify in the EIS the solution that airport sponsor andthe lead agency are proposing to solve the problem(s) they are facing.The initial evaluation of the T.F. <strong>Green</strong> <strong>Airport</strong> <strong>Improvement</strong> <strong>Program</strong> alternatives determined their ability to meetthe Project’s Purpose and Need, and determined if they are reasonable and feasible to implement. The safetycomponent of the Purpose and Need is focused strictly on physical enhancements to T.F. <strong>Green</strong> <strong>Airport</strong> itself, andcannot be met by off-<strong>Airport</strong> solutions. The off-<strong>Airport</strong> and non-construction alternatives considered in this analysisfocus on efficiency enhancement aspects of the Purpose and Need. See DEIS Appendix E, Alternatives Analysis, for thedetailed evaluation of the alternatives screening process summarized in Section 3.2, Alternatives Screening Process. Aniterative process was used to identify, screen, and refine the alternatives that were advanced into subsequentscreening analysis centering on the environmental consequences analysis (see Chapter 5, Environmental Consequences).This methodology progressively applied detailed evaluation factors to identify the ability of each alternative to meetthe following general performance measures:• Meets the Purpose and Need – the alternative enhances the safety and efficiency of the <strong>Airport</strong> and theNew England Regional <strong>Airport</strong> system.• Reasonable and Feasible – the alternative is practical and feasible from the technical and economicstandpoint and using common sense, rather than simply desirable from the standpoint of the applicant, orsponsor.91 CEQ Memorandum: Questions and Answers About the NEPA Regulations, 48 Fed Reg. 18026, March 23, 1981, as amended, 51 Fed Reg 15618 (Apr. 25, 1986).Question 4a.92 Ibid. Question 8b, FAA Order 1050.1E, Par. 506e.Chapter 3 – Alternatives Analysis 3-2 July 2011\\mawatr\ev\09228.00\reports\<strong>FEIS</strong>_Final_July_2011\<strong>PVD</strong>_CH03_Alternatives_JUL_2011.doc
T.F. <strong>Green</strong> <strong>Airport</strong> <strong>Improvement</strong> <strong>Program</strong>Environmental Impact Statement and Final Section 4(f) Evaluation3.2 Alternatives Screening ProcessThe DEIS presented six alternative screening levels and this <strong>FEIS</strong> reviews the impacts of the final two BuildAlternatives (Alternatives B2 and B4). The overall intent of the first three screening levels for potential projectelements was to identify alternatives that could, at an initial concept level, feasibly and reasonably fulfill thePurpose and Need. During the DEIS phase of the NEPA process, Level 1 of the Alternatives Screening evaluatednine airports other than T.F. <strong>Green</strong>, three non-aviation and non-construction alternatives, and 28 CandidateAlternatives for program elements for various T.F. <strong>Green</strong> <strong>Airport</strong> enhancements. Level 2 considered thoseindividual program elements that would meet the Purpose and Need. Level 3 evaluated different combinations ofprogram elements. Together, screening Levels 4, 5, and 6 evaluated ten on-<strong>Airport</strong> <strong>Improvement</strong> <strong>Program</strong>s, eachmade up of the specific safety and efficiency projects. The screening took into account considerations such assafety, operational efficiency, environmental impacts, and costs based on more detailed design concepts.Ultimately this screening process provided the necessary context for selection of a Preferred Alternative by theFAA. The <strong>FEIS</strong> analysis updated the DEIS Level 6 screening, re-analyzed the alternatives based on the revised No-Action forecast, and identified the Preferred Alternative. The process that was followed is summarized below, andis also shown in Chart 3-1.• DEIS Level 1 Screening - Candidate Alternatives (Section 3.3 of this chapter) – This analysis identified areasonable range of alternatives and evaluated the ability of each alternative to reasonably or practicablymeet the Purpose and Need of the T.F. <strong>Green</strong> <strong>Airport</strong> <strong>Improvement</strong> <strong>Program</strong>. The analysis included a rangeof on- and off-<strong>Airport</strong> alternatives, including non-construction alternatives identified through the NEPAscoping process and by the FAA and RIAC. Alternatives that did not meet the Purpose and Need of theT.F. <strong>Green</strong> <strong>Airport</strong> <strong>Improvement</strong> <strong>Program</strong> totally or in substantial part were eliminated from furtherconsideration in this level of screening. Only individual program elements that would meet the Purposeand Need were carried forward.• DEIS Level 2 Screening – Preliminary Alternatives (Section 3.4 of this chapter) – The alternative individualprogram elements brought forward from Level 1 analysis were evaluated in greater detail. The Level 2screening refined and further screened the alternatives retained from Level 1, and eliminated anyalternatives that, on more detailed evaluation, were found either to be not feasible, unreasonable, or unableto meet the Purpose and Need. Upon completion of a Draft Alternatives Analysis Chapter, state and federalagencies, the City of Warwick and members of the public raised issues that resulted in an additional Level 2round of screening that included a preliminary wetland and stream bed impact analysis. The SupplementalAlternatives Analysis 93 provides the results of this additional analysis.• DEIS Level 3 Screening –<strong>Airport</strong> <strong>Improvement</strong> <strong>Program</strong> Alternatives Analysis (Section 3.5 of this chapter)The Level 3 screening developed and evaluated combinations of on-<strong>Airport</strong> program elements (particularlythe Runway 16-34 and Runway 5-23 enhancements) that collectively form the T.F. <strong>Green</strong> <strong>Airport</strong><strong>Improvement</strong> <strong>Program</strong> Alternatives. These alternatives were screened to determine whether they would bereasonable and feasible and should be retained for detailed environmental analysis. After the Level 3screening, four alternatives were carried forward.93 See DEIS Appendix E, Alternatives Analysis Supporting Attachment E.A.2, Supplemental Alternatives Analysis, Section 3.4.Chapter 3 – Alternatives Analysis 3-3 July 2011\\mawatr\ev\09228.00\reports\<strong>FEIS</strong>_Final_July_2011\<strong>PVD</strong>_CH03_Alternatives_JUL_2011.doc
T.F. <strong>Green</strong> <strong>Airport</strong> <strong>Improvement</strong> <strong>Program</strong>Environmental Impact Statement and Final Section 4(f) Evaluation• DEIS Level 4 Screening – Refined Combined Alternatives (Section 3.6 of this chapter) – The Level 4screening refined the four Level 3 alternatives and added one additional alternative. Five on-<strong>Airport</strong>alternatives (<strong>Improvement</strong> <strong>Program</strong> Options A through E) were thus evaluated to determine if they werereasonable and feasible based on safety, environmental impacts, and cost and if they should be retained fordetailed environmental analysis. These <strong>Improvement</strong> <strong>Program</strong> (IP) Options were a combination of theeleven projects identified in the Purpose and Need facilities analysis.• DEIS Level 5 Screening – Further Refined Build Alternatives (Section 3.7 of this chapter) – The Level 5Screening modified the alternative advanced from the Level 4 Screening into Alternative B1 (runwayextension to 9,350 feet) and identified additional alternatives including Alternative B2 (runway extension to8,700 feet to the north), Alternatives B3 North and South (runway extensions to 8,300 feet), andAlternative B4 (runway extension to 8,700 feet to the south). Alternatives B1 and B3 North and South wereeliminated from further evaluation.• DEIS Level 6 Screening – DEIS Final Alternatives (Section 3.8 of this chapter) - The Level 6 Screeningcompared the remaining alternatives (Alternatives B2 and B4) with the No-Action Alternative. It alsoutilized an additional forecast scenario (2009 DEIS Forecast).• <strong>FEIS</strong> Analysis – Final Alternatives, the Preferred Alternative, and the Environmentally PreferableAlternative (Section 3.9 of this chapter) – The FAA performed updated environmental analyses in the <strong>FEIS</strong>with a forecast scenario consistent with the Draft 2010 TAF. 94 The FAA compared Alternatives B2 and B4with the No-Action Alternative to evaluate the Preferred Alternative identified in the DEIS (Alternative B4).The FAA also modified the design of Alternatives B2 and B4 to further minimize impacts to naturalresources.• The Preferred Alternative is identified and described in Section 3.9.4 of this chapter. RIAC confirmed thatAlternative B4 is its Proposed Action.94 The FAA also conducted an analysis while preparing the <strong>FEIS</strong> and confirmed that the actual aircraft activity counts from the Air Traffic Control Tower(ATCT) in 2010 agree with the Draft 2010 TAF for the same period. See Final 2010 TAF Analysis Memorandum in Section E.1, Updated Forecast ofAviation Activity of Appendix E, Purpose and Need and Alternatives Analysis.Chapter 3 – Alternatives Analysis 3-4 July 2011\\mawatr\ev\09228.00\reports\<strong>FEIS</strong>_Final_July_2011\<strong>PVD</strong>_CH03_Alternatives_JUL_2011.doc
T.F. <strong>Green</strong> <strong>Airport</strong> <strong>Improvement</strong> <strong>Program</strong>Environmental Impact Statement and Final Section 4(f) EvaluationChart 3-1Alternatives Screening Process* Documented in detail in Section 3.7, Level 5 Screening – Further Refined Alternatives.Chapter 3 – Alternatives Analysis 3-5 July 2011\\mawatr\ev\09228.00\reports\<strong>FEIS</strong>_Final_July_2011\<strong>PVD</strong>_CH03_Alternatives_JUL_2011.doc
T.F. <strong>Green</strong> <strong>Airport</strong> <strong>Improvement</strong> <strong>Program</strong>Environmental Impact Statement and Final Section 4(f) Evaluation3.3 Level 1 Screening – Candidate AlternativesThe Level 1 Screening analyzed a series of potential on-<strong>Airport</strong> construction program element alternatives,off-<strong>Airport</strong> construction, and non-construction alternatives. The screening criteria consisted of the performancefactors, design standards, service levels, and administrative issues that were used to qualitatively assesswhether an alternative may meet the Purpose and Need. The screening criteria were derived from the CEQregulations and are in two groups. 95 The first set of criteria is related directly to the Purpose and Need andfocuses on the safety, efficiency, operational, and technical aspects and meeting demands of theT.F. <strong>Green</strong> <strong>Airport</strong> service area. The second set addressed whether an alternative is reasonable and feasible. Thegeographic area analyzed in the Level 1 Screening is the T.F. <strong>Green</strong> <strong>Airport</strong> service area (Figure 3-1). The servicearea is based on the demographic and economic characteristics of the area and associated demand for air travel.3.3.1 Candidate Alternative: Greater Use of Other <strong>Airport</strong>sThis alternative considered the use of the following nine airports located throughout southeastern New England(Figure 3-2) and the ability of each to adequately meet the Purpose and Need of the T.F. <strong>Green</strong> <strong>Airport</strong><strong>Improvement</strong> <strong>Program</strong>:• Logan International <strong>Airport</strong>, Boston, MA• Bradley International <strong>Airport</strong>, Windsor Locks, CT• Worcester Regional <strong>Airport</strong>, Worcester, MA• New Bedford Regional <strong>Airport</strong>, New Bedford, MA• Groton-New London <strong>Airport</strong>, Groton, CT• Laurence G. Hanscom Field, Bedford, MA• Quonset <strong>Airport</strong>, North Kingstown, RI• North Central <strong>Airport</strong>, Smithfield, RI• Otis Air National Guard Base, Falmouth, MAThe analysis evaluated the current and anticipated role of each airport, airport facilities, planned expansionprojects, and the expansion potential of each airport. Based on the deficiencies and constraints associated witheach of these airports, the Greater Use of Other <strong>Airport</strong>s alternative would not adequately fulfill the Purposeand Need because none of these airports would be able to provide the appropriate facilities. This alternativewould not support the goals and objectives of the NERASP in addressing regional aviation needs. Therefore,this alternative and each of the individual airports examined were eliminated from further consideration.3.3.2 Candidate Alternative: Develop a New <strong>Airport</strong>This alternative examined the potential for the identification of a suitable site within the T.F. <strong>Green</strong> <strong>Airport</strong>service area for a replacement airport capable of accommodating the Purpose and Need of the T.F. <strong>Green</strong><strong>Airport</strong> <strong>Improvement</strong> <strong>Program</strong>. The FAA’s 2000 Aviation Capacity Enhancement Plan views construction ofnew airports primarily as a means of increasing aviation system capacity, and not for meeting the facility95 40 CFR section1502.14.Chapter 3 – Alternatives Analysis 3-6 July 2011\\mawatr\ev\09228.00\reports\<strong>FEIS</strong>_Final_July_2011\<strong>PVD</strong>_CH03_Alternatives_JUL_2011.doc
T.F. <strong>Green</strong> <strong>Airport</strong> <strong>Improvement</strong> <strong>Program</strong>Environmental Impact Statement and Final Section 4(f) Evaluationrequirements for specific market demands. Any new airport must serve as a complete replacement forT.F. <strong>Green</strong> <strong>Airport</strong> and its service area.The total area that would be adequate for a replacement airport is approximately 6,000 acres (9.45 square miles),based on current FAA airport design standards 96 to replace existing facilities now serving T.F. <strong>Green</strong> <strong>Airport</strong>and facilities to accommodate anticipated growth potential. The identification of potential areas within thesearch area focused within a one-hour drive from the Providence metropolitan area population center located inproximity to major highway access corridors. The following site constraints were used as geographic informationsystem (GIS) mapping layers to identify incompatible areas for airport development:• High population density (more than 800 people per square mile)• Rivers, streams, and water bodies• Topography (greater than five percent slope)• Protected Open Space (Designated Parks and Wildlife Refuges)• Roadways and Railroads• WetlandsAs shown in Figure 3-3, two potential areas for a new airport were identified: one of these sites was located inMassachusetts; and one site was located in Rhode Island. The Massachusetts site was eliminated from furtherconsideration based on the findings of the 1990 Second Major <strong>Airport</strong> Study 97 that concluded there were nosuitable sites for a major new airport in Massachusetts. The Rhode Island site would have extensive wetlandsimpacts (filling) that would result from constructing a new airport. This analysis demonstrated that there are nosuitable sites within the study area that could be constructed without environmental impacts substantially inexcess of the environmental impacts likely to result from any of the on-<strong>Airport</strong> alternatives. Therefore, thedevelopment of a new airport alternative was eliminated from further evaluation.3.3.3 Candidate Alternative: Other Modes of TransportationThis alternative examined the use of other (non-aviation) modes of transportation to reasonably and feasiblymeet the Purpose and Need by providing an alternative form of transportation to air passengers who otherwisewould use the <strong>Airport</strong> to fulfill their non-stop West Coast travel needs from the Providence metropolitan area.The efficiency purpose of the T.F. <strong>Green</strong> <strong>Airport</strong> <strong>Improvement</strong> <strong>Program</strong>, relative to the need for longer primaryrunway length, is to meet the need for non-stop West Coast service to accommodate the T.F. <strong>Green</strong> <strong>Airport</strong>catchment area 98 and, thereby, enhance the efficiency of the New England Regional <strong>Airport</strong> System. Railalternatives do not enhance aviation system efficiency in the medium and long-haul markets. Travel times andfrequencies for medium and long-haul markets are considered to be too long and too few to be reasonable andfeasible alternative to commercial air service. The overall cost of rail travel is not competitive with air travel.Passenger rail service has been eliminated from further review since it would not meet the service demands ofT.F. <strong>Green</strong> <strong>Airport</strong> or otherwise achieve the Purpose and Need. Highway transportation does not enhance96 FAA Advisory Circular 150/5300-13, <strong>Airport</strong> Design, U.S. Government Printing Office, Washington, DC, September 29, 2006. Change 10.97 Second Major <strong>Airport</strong> Study, Massachusetts Aeronautics Commission, 1990. (A separate siting study was conducted in 1990 by the MassachusettsAeronautics Commission to determine whether a potential site for a second major airport existed in eastern Massachusetts as a replacement for Logan.)98 A catchment area extends from an airport to the point where travel times to an adjacent airport are equal.Chapter 3 – Alternatives Analysis 3-7 July 2011\\mawatr\ev\09228.00\reports\<strong>FEIS</strong>_Final_July_2011\<strong>PVD</strong>_CH03_Alternatives_JUL_2011.doc
T.F. <strong>Green</strong> <strong>Airport</strong> <strong>Improvement</strong> <strong>Program</strong>Environmental Impact Statement and Final Section 4(f) Evaluationaviation system efficiency in the medium and long-haul markets. Highway travel times for medium and longhaulmarkets are too long to be a reasonable and feasible alternative to commercial air service. Highwaytransportation has been eliminated from further review since it does not meet the service demands of T.F. <strong>Green</strong><strong>Airport</strong> or otherwise achieve the Purpose and Need.3.3.4 Candidate Alternative: Non-Construction AlternativesThese alternatives examined the feasibility of new technologies in meeting the Purpose and Need of theT.F. <strong>Green</strong> <strong>Airport</strong> <strong>Improvement</strong> <strong>Program</strong>. The alternatives evaluated were new communication technologiesand new aircraft technologies. Two-way video technology has been available for nearly 30 years, with limitedimpact on the transportation industry, although recent improvements in the affordability, quality, and speed oftransmission have made video-conferencing a more accepted alternative to face-to-face meetings.Telecommunications and video conferencing do not reduce the current and anticipated demand for long-haulcommercial air service to the West Coast. Telecommunication and video conferencing will not enhance theefficiency of the airport system, and these new technologies have been eliminated from further review. Newtechnological improvements in aircraft design were considered to determine their viability in enhancing airportsafety or meeting anticipated demand at T.F. <strong>Green</strong> <strong>Airport</strong>. New aircraft technology includes features that aretypically intended to improve aircraft performance, improve fuel efficiency, and reduce operating costs. Whilenew technology has improved the performance characteristics and range of certain aircraft types operating inthe fleet at T.F. <strong>Green</strong> <strong>Airport</strong>, the present runway length does not allow most aircraft at their maximum grosstakeoff weight to reach West Coast markets. Without a lengthened runway, new aircraft technology, by itself,cannot meet anticipated demand at T.F. <strong>Green</strong> <strong>Airport</strong> and thus cannot meet the Purpose and Need. For thesereasons, new aircraft technologies as an alternative to construction have been eliminated from further review.3.3.5 Candidate Alternative: On-<strong>Airport</strong> AlternativesOn-<strong>Airport</strong> Candidate Alternatives program elements were developed and analyzed to address safety andefficiency needs at T.F. <strong>Green</strong> <strong>Airport</strong>. The concepts for several of the on-<strong>Airport</strong> Candidate Alternatives arevariations of those that were assessed in the 2002 T.F. <strong>Green</strong> Master Plan Update and the 2004 T.F. <strong>Green</strong> MasterPlan Supplement. The On-<strong>Airport</strong> Candidate Alternatives were evaluated with respect to current FAA airportdesign criteria. The most important FAA design standards deal with the safety areas listed in Table E.3-3 ofDEIS Appendix E, Alternatives Analysis. The FAA received input from state and federal agencies, the City ofWarwick, and the public on the preliminary findings of the Draft Alternatives Analysis Chapter. 99 Based on thatinput, the elements that were re-evaluated include the on-<strong>Airport</strong> roadways, off-<strong>Airport</strong> roadways, structuredparking, fuel farm expansion, Integrated Cargo Facility, and Runway 5-23 extension and safety areas. There-evaluations of these program elements are included in this chapter, and additional information is provided inDEIS Appendix E, Alternatives Analysis, Supporting Attachment E.A.1, Runway Length Analysis and SupportingAttachment E.A.2a, Supplemental Analysis. Figure 3-4 identifies the proposed on-<strong>Airport</strong> development candidatealternatives. Table 3-1 presents a summary of the results of the Level 1 Screening Candidate Alternatives thatsuccessfully passed the screening requirements and were evaluated as Preliminary Alternatives in the Level 2Screening (Section 3.4).99 The FAA received input through formal agency and city review of the draft chapter as well as oral and written public input received at public meetings in 2006.Chapter 3 – Alternatives Analysis 3-8 July 2011\\mawatr\ev\09228.00\reports\<strong>FEIS</strong>_Final_July_2011\<strong>PVD</strong>_CH03_Alternatives_JUL_2011.doc
T.F. <strong>Green</strong> <strong>Airport</strong> <strong>Improvement</strong> <strong>Program</strong>Environmental Impact Statement and Final Section 4(f) EvaluationTable 3-1Level 1 Screening Results: On-<strong>Airport</strong> Candidate AlternativesCandidate AlternativesDescriptionMeets Purposeand NeedReasonableand FeasibleCarriedForwardEnhance Runway 16-34 Runway Safety Areas 1Option 1Reduce runway lengthOption 2Shift runway to north, add full RSAs, avoid Buckeye BrookOption 3Shift runway to south, add full RSAs, avoid <strong>Airport</strong> RoadOption 4Shift runway slightly north, add full RSAsOption 5Shift runway slightly north, add full RSAs, reduce Buckeye Brook impactsYesYesYesYesYesNoNoYesNoYesNoNoYesNoYesRelocate Taxiway C Relocate Taxiway C to provide 400-foot separation Yes Yes YesDemolish Hangar No. 1 Demolish Hangar No. 1 to remove Part 77 penetration Yes Yes YesExpand Passenger Terminal Add 8 terminal gates Yes Yes YesConstruct New Ground SupportEquipment FacilityConstruct new facility in the South Service Area Yes Yes YesConstruct New Belly Cargo Facility Construct new facility in the South Service Area Yes Yes YesConstruct New Fuel FarmOption 1Option 2Construct new fuel facility adjacent to existing fuel storage facilityConstruct new fuel facility in the South Service AreaYesYesYesYesNoYesConstruct New Integrated Cargo Facility 2Option 1Option 2Option 3West of Warwick PondWest of southern portion of Taxiway CNorth of north apronYesYesYesYesYesYesYesYesYesExpand Automobile Parking FacilitiesOption 1Option 2Option 3Option 4Expand short-term parking associated with roadway improvementsDevelop parking north of existing garagesConstruct three-story garage at current long-term parking lotConstruct six-story garage at current long-term parking lotYesYesYesYesYesYesYesYesYesNoYesNoReconfigure Terminal Access RoadwaysOption 1Option 2Option 3Option 4Construct loop ramps to connect <strong>Airport</strong> Connector with Post Road;internal circulation improvementsOptimize existing Post Road signalized intersections; internalcirculation improvementsProvides direct access from the <strong>Airport</strong> Connector to Long-TermParking; internal circulation improvements; new signal on Post RoadConstruct loop ramps to connect <strong>Airport</strong> Connector with Post Road;internal circulation improvements; Provides direct access from the<strong>Airport</strong> Connector to Long-Term ParkingYesNoYesYesYesNoYesYesNoNoYesNoExtend Runway 5-23 1Option 1Option 2Option 3Option 4Shift and extend runway to the south; avoids <strong>Airport</strong> RoadShift and extend runway to the north; avoids Main AvenueExtend runway north and southExtend runway north and south, shifted more to south than Option 3avoids Buckeye Brook1 Includes relocating navigational aids.2 An off-airport option of locating the new Integrated Cargo Facility at Quonset <strong>Airport</strong> was examined and determined to be infeasible (DEIS Appendix E,Alternatives Analysis, Section E.4.4, Efficiency Enhancement Elements, and Supporting Attachment E.A.3, Supplemental Integrated Air Cargo Analysis).YesYesYesYesYesYesNoYesYesYesNoYesChapter 3 – Alternatives Analysis 3-9 July 2011\\mawatr\ev\09228.00\reports\<strong>FEIS</strong>_Final_July_2011\<strong>PVD</strong>_CH03_Alternatives_JUL_2011.doc
T.F. <strong>Green</strong> <strong>Airport</strong> <strong>Improvement</strong> <strong>Program</strong>Environmental Impact Statement and Final Section 4(f) Evaluation3.3.6 Summary of Level 1 Screening ResultsThe Level 1 Screening of Candidate Alternatives described in this section found that:• None of the options examined under Greater Use of Existing <strong>Airport</strong>s alternative met the Purpose and Needof the T.F. <strong>Green</strong> <strong>Airport</strong> <strong>Improvement</strong> <strong>Program</strong>. In addition, none of these options were reasonable andfeasible.• The Develop a New <strong>Airport</strong> alternative does not meet the Purpose and Need, and is not reasonable andfeasible.• The options considered under the Other Non-Aviation Modes of Transportation alternative do not meet thePurpose and Need.• The New Aviation Technology alternative does not meet the Purpose and Need.• The On-<strong>Airport</strong> Enhancements alternative meets the Purpose and Need, and the selected optionsconsidered are reasonable and feasible to implement.Based on this analysis, reasonable on-<strong>Airport</strong> enhancements were advanced to the Level 2 Screening asPreliminary Alternatives.3.4 Level 2 Screening – Preliminary AlternativesSelected Candidate Alternatives advanced from the Level 1 Screening were refined and all program elementswere evaluated in the Level 2 Screening based on whether the alternative enhanced airfield safety and theefficiency of the airfield and facilities. <strong>Program</strong> elements that were not feasible or reasonable, and did not meetthe Purpose and Need were eliminated. The following project elements intended to address existing safetyconcerns at T.F. <strong>Green</strong> <strong>Airport</strong> were carried forward for Level 2 screening analysis:• Enhance Runway 16-34 RSAs (including relocating navigational aids)• Relocate Taxiway C• Demolish Hangar No. 1The following project elements intended to address existing or anticipated facility deficiencies at the T.F. <strong>Green</strong><strong>Airport</strong> were carried forward for Level 2 screening analysis:• Extend Runway 5-23 to 9,350 feet (including relocation of navigational aids)• Expand passenger terminal• Construct new ground support equipment facility• Construct new belly cargo facility• Construct new fuel farm• Construct new Integrated Cargo Facility• Expand automobile parking facilities• Reconfigure terminal access roadwaysChapter 3 – Alternatives Analysis 3-10 July 2011\\mawatr\ev\09228.00\reports\<strong>FEIS</strong>_Final_July_2011\<strong>PVD</strong>_CH03_Alternatives_JUL_2011.doc
T.F. <strong>Green</strong> <strong>Airport</strong> <strong>Improvement</strong> <strong>Program</strong>Environmental Impact Statement and Final Section 4(f) EvaluationDEIS Appendix E, Alternatives Analysis provides a full description of the project elements evaluated under theLevel 2 Screening.3.4.1 Refinement of AlternativesSelected Candidate Alternatives that could meet FAA’s standard design criteria were refined based onevaluation of FAA safety requirements, size and design requirements, and through consideration of physicalconstraints.3.4.1.1 Runway Safety Area RefinementsThe FAA’s objective is to improve existing, physically constrained runways in order to enhance operationalsafety. The FAA encourages the design of new runway extensions to incorporate the full 1,000-foot turf RSA, inorder to conform to the design requirements. In certain circumstances such as when there are severe physicalconstraints, and when it is impractical to provide a full 1,000-foot RSA, FAA Order 5200.8 and FAA AdvisoryCircular (AC) 150/5220-22A establish a procedure that enables the consideration of EMAS as an option to provideequivalent levels of safety. EMAS is a soft concrete material that can safely decelerate an aircraft to a complete stopwith minimal damage if the aircraft overshoots the runway. It is typically placed within a 500-foot wide safety areathat extends 600 feet beyond the end of the runway, and allows for a standard RSA that is less than 1,000-feet long.The use of EMAS was considered for the RSAs for each of the runway ends of Runway 16-34 and Runway 5-23.3.4.1.2 Runway 5-23 Extension Runway Length RefinementsBased on the standard methodology for determining the recommended runway length provided in FAAAC 150/5325-4B, a primary runway length of 10,700 feet is recommended at T.F. <strong>Green</strong> <strong>Airport</strong>. 100 However,because of surrounding land use, environmental, and infrastructure constraints, a 10,700-foot runway isimpractical to implement at T.F. <strong>Green</strong> <strong>Airport</strong>. Therefore, an “operationally preferred” 101 runway length of9,350 feet was identified using a modified methodology provided in FAA AC 150/5325-4B. The operationallypreferred runway length considered reductions in belly cargo weight for aircraft types that demand longerrunways. DEIS Appendix E, Alternatives Analysis Attachment E.A.1, Runway Length Analysis provides a detaileddiscussion of the methodology used to determine the operationally preferred runway length.3.4.1.3 Supporting Off-<strong>Airport</strong> Roadway RefinementsThe Runway 16-34 Safety options and the Runway 5-23 Extension options would impact Post Road,<strong>Airport</strong> Road, or Main Avenue due to off-<strong>Airport</strong> roadway configurations. Options for maintaining traffic flowand continuity on each of these roadways were evaluated, and options were eliminated if they were found to be not reasonable or feasible.• Post Road is a densely-developed north-south urban roadway. Preliminary Alternatives evaluated forPost Road included constructing a tunnel, realigning the road, or constructing the road in a new location.These options were found to not be reasonable and feasible due to excessive property, business, and trafficimpacts. Therefore the Preliminary Alternatives involving realignment of Post Road were eliminated fromfurther consideration.100 Based on the runway length requirements of the B767-300 (the <strong>Airport</strong>’s critical design aircraft) according to the aircraft manufacturer’s specifications manual.101 “Operationally preferred” runway length refers to an adjustment in the recommended runway length due to extenuating circumstances (such as surroundingland use, environmental, and infrastructure constraints) that still meets the runway length needs of the existing and future fleet mix.Chapter 3 – Alternatives Analysis 3-11 July 2011\\mawatr\ev\09228.00\reports\<strong>FEIS</strong>_Final_July_2011\<strong>PVD</strong>_CH03_Alternatives_JUL_2011.doc
T.F. <strong>Green</strong> <strong>Airport</strong> <strong>Improvement</strong> <strong>Program</strong>Environmental Impact Statement and Final Section 4(f) Evaluation• <strong>Airport</strong> Road is an east-west urban roadway with commercial development at the east and west ends. Itconnects Post Road with Warwick Avenue at Hoxsie Four Corners. Preliminary Alternatives evaluated for<strong>Airport</strong> Road included constructing a tunnel, realigning a portion of the road, or constructing the entireroad in a new location. This evaluation found that placing <strong>Airport</strong> Road in a tunnel is not reasonable andfeasible due to the elevation of Buckeye Brook and the wetland impact and engineering obstacles.Realigning or relocating the road are reasonable and feasible options, and were evaluated in further steps ofthe alternatives analysis.• Main Avenue is an east-west urban roadway that connects Post Road with Warwick Avenue. Developmentalong Main Avenue is primarily residential. Preliminary Alternatives evaluated for Main Avenue incombination with a 9,350-foot Runway 5-23 included constructing a tunnel, realigning a portion of the road,or relocating the entire road. The evaluation found that placing Main Avenue in a tunnel would be feasiblefrom a constructability perspective, while the realignment or relocation of Main Avenue to accommodate a9,350 feet Runway 5-23 would require constructing a new interchange with Post Road Extension and result insignificant community disruption south of the <strong>Airport</strong>. At this screening level, placing Main Avenue in a tunnelwas a reasonable and feasible option, and was evaluated in further steps of the alternatives analysis.Refer to DEIS Appendix E, Alternatives Analysis, for detailed description of these refinements.3.4.2 Summary of Level 2 Screening ResultsDetailed screening criteria were used in the Level 2 Screening to determine the reasonableness and feasibility of theoptions that were refined to develop the Preliminary Alternatives. CEQ requires that an EIS describe the project’sapproaches to avoid, minimize, or mitigate environmental and cultural impacts to the extent practicable. At this stagein the analysis, a qualitative assessment of the land use and community, roadway, wetland and water course impactswas conducted, and options were identified that would either avoid or minimize impacts to these resources. Theresults of the Level 2 Screening of the Preliminary Alternatives are provided in Table 3-2.Chapter 3 – Alternatives Analysis 3-12 July 2011\\mawatr\ev\09228.00\reports\<strong>FEIS</strong>_Final_July_2011\<strong>PVD</strong>_CH03_Alternatives_JUL_2011.doc
T.F. <strong>Green</strong> <strong>Airport</strong> <strong>Improvement</strong> <strong>Program</strong>Environmental Impact Statement and Final Section 4(f) EvaluationTable 3-2Level 2 Screening Results: Preliminary AlternativesAlternativeDescriptionMeetsPurposeand NeedReasonableandFeasibleCarriedForwardEnhance Runway 16-34 Runway Safety Areas 1Option 2AShifts runway to north with EMAS at 34 EndYesYesYesOption 2BShift runway to north with EMAS at both endsYesYesYesOption 3Shift runway to south, add full RSAs, avoid <strong>Airport</strong> RoadYesYesYesOption 3AShift runway to south with full RSA on the north and EMAS on the southYesYesYesOption 3BShift runway to south with EMAS on both endsYesYesYesOption 5Shift runway slightly north, add full RSAs, reduce Buckeye Brook impactsYesYesYesOption 5AShift runway slightly north, add full RSA on the north end and EMAS on the south endYesYesYesOption 5BShift runway slightly north, add EMAS on both endsYesNoNoOption 5CShift runway slightly north, add full RSA on the south end and EMAS on the north endYesYesYesRelocate Taxiway C Relocate Taxiway C to provide 400-foot separation Yes Yes YesDemolish Hangar No. 1 Demolish hangar to remove Part 77 penetration Yes Yes YesExpand Passenger Terminal Add 8 terminal gates Yes Yes YesConstruct New Ground Support Equipment Facility Construct new facility in the South Service Area Yes Yes YesConstruct New Belly Cargo Facility Construct new facility in the South Service Area Yes Yes YesConstruct New Fuel FarmOption 2 Construct new fuel facility in the South Service Area Yes Yes YesConstruct New Integrated Cargo FacilityOption 1West of Warwick PondYesYesYesOption 2West of southern portion of Taxiway CYesYesYesExpand Automobile Parking FacilitiesOption 3 Construct three-story garage at current long-term parking lot Yes Yes YesReconfigure Terminal Access RoadwaysOption 3Provides direct access from the <strong>Airport</strong> Connector to Long-Term Parking;internal circulation improvements; new signal on Post RoadYes Yes YesExtend Runway 5-23 to a total of 9,350 feet1Option 1Shift and extend runway to the south; avoids <strong>Airport</strong> RoadYesYesYesOption 2Shift and extend runway to the north; avoids Main AvenueYesYesYesOption 2AHold runway 5 End threshold and extend runway to the north; avoids Main AvenueYesYesYesOption 4Shift runway north and south, avoids Buckeye BrookYesYesYesOption 4AShift runway north and south, with EMAS on both endsYesYesYesOption 4BShift runway north and south, with a full 1,000-foot RSA on the south endand EMAS on the north endNote: Preliminary Alternatives are described in detail in DEIS Appendix E, Alternatives Analysis.1 Includes relocating navigational aids.YesYesYesChapter 3 – Alternatives Analysis 3-13 July 2011\\mawatr\ev\09228.00\reports\<strong>FEIS</strong>_Final_July_2011\<strong>PVD</strong>_CH03_Alternatives_JUL_2011.doc
T.F. <strong>Green</strong> <strong>Airport</strong> <strong>Improvement</strong> <strong>Program</strong>Environmental Impact Statement and Final Section 4(f) Evaluation3.5 Level 3 Screening - <strong>Airport</strong> <strong>Improvement</strong> <strong>Program</strong> (IP) AlternativesThe Level 3 Screening developed combinations of these options, identified the connected actions that would berequired for implementation, and identified a range of T.F. <strong>Green</strong> <strong>Airport</strong> <strong>Improvement</strong> <strong>Program</strong> (IP) Options.In accordance with NEPA Orders the No-Action Alternative was also developed for comparison purposes inorder to identify potential environmental impacts of the IP Options.The IP Options (described more fully in DEIS Appendix E, Alternatives Analysis) were developed in an iterativeprocess of combining Runway 16-34 Options with Runway 5-23 Options, assessing the impacts to wetlands, localroads, residential neighborhoods, and commercial development, and identifying the appropriate <strong>Airport</strong> Roadrelocation or realignment option. This analysis identified five IP Options (described in this section and evaluatedunder the Level 4 Screening process, Section 3.6). The IP Options provide a full range of alternatives that not onlymeet the Purpose and Need but also bracket the potential environmental impacts of the T.F. <strong>Green</strong> <strong>Airport</strong><strong>Improvement</strong> <strong>Program</strong> in order to allow comparative analysis and assessment of the program elements. 102 Table 3-3presents the results of the Level 3 Screening of the IP Options that were advanced to the Level 4 Screening.Table 3-3Level 3 Screening Results: IP OptionsIPOption Runway 16-34 Runway 5-23Impacts toMain AvenueImpacts to<strong>Airport</strong> RoadImpacts toLand UsesImpacts toBuckeye BrookImpacts toWetlandsA Option 3 Option 1 Tunnels Avoids <strong>Airport</strong> Road Substantial impacts to Impacts south Substantial impacts on YesShift runway to south, Shift and extend Main Avenue <strong>Green</strong>wood neighborhood; Avoids north Runway 34 Endfull RSAs at both ends runway to the south, and to commercial uses at Postfull RSAs at both endsand <strong>Airport</strong> Road IntersectionB Option 2A Option 2A Avoids Relocates <strong>Airport</strong> Substantial impacts to Spring Impacts north, Substantial impacts on YesShifts runway to north, Hold runway 5 End Main Avenue Road <strong>Green</strong> neighborhood Avoids south Runway 23 End,EMAS at Runway 34 threshold and extend Moderate impacts onEnd; full RSA at runway to the north, Runway 34 EndRunway 16 End full RSAs at both endsC Option 5C Option 4 Tunnels Relocates west end Substantial impacts to Avoids Moderate impacts on YesShift runway slightly Shift runway north Main Avenue of <strong>Airport</strong> Road <strong>Green</strong>wood neighborhood, Runway 34 Endnorth, EMAS at and south, full RSAs at and commercial uses betweenRunway 16 End; full RSA both endsrailroad and Post Road inat Runway 34 EndLincoln Park areaD Option 5 Option 1 Tunnels Relocates east end Substantial impacts to Avoids Moderate impacts on YesShift runway slightly Shift and extend Main Avenue of <strong>Airport</strong> Road <strong>Green</strong>wood neighborhood; and Runway 23 Endnorth, full RSAs at runway to the south, limited area of commercial usesboth ends full RSAs at both ends between railroad and PostRoadE Option 3B Option 4A Tunnels Relocates east end Substantial impacts to Avoids Moderate impacts on YesShift runway to south,EMAS at both endsShift runway northand south, EMAS atboth endsMain Avenue of <strong>Airport</strong> Road <strong>Green</strong>wood neighborhood; andresidences to Bellevue Ave tonorthRunway 23 End,Moderate impacts onRunway 34 EndNo- Existing Existing No No Includes Completed and No No YesActionCurrent Part 150 VLAPCarriedForward102 Some Level 2 Preliminary Alternatives, such as Runway 16-34 Option 2B, were found to be reasonable and feasible and would meet the purpose and need,but were not included in the IP Options because they did not provide the best fit or had similar impacts and/or benefits to other Preliminary Alternatives thatwere advanced to Level 3.Chapter 3 – Alternatives Analysis 3-14 July 2011\\mawatr\ev\09228.00\reports\<strong>FEIS</strong>_Final_July_2011\<strong>PVD</strong>_CH03_Alternatives_JUL_2011.doc
T.F. <strong>Green</strong> <strong>Airport</strong> <strong>Improvement</strong> <strong>Program</strong>Environmental Impact Statement and Final Section 4(f) Evaluation3.6 Level 4 Screening - Refined Combined AlternativesThe Level 4 Screening process included two steps: advancing each of the five IP Options to a 30 percentengineering design level in order to more accurately evaluate the full range of environmental impacts; andassess practicability based on construction logistics and cost. The design was conducted to a level at which thelimit of impact and areas of pavement could be calculated. As noted in Section 3.5, each of the IP Options meetsthe purpose to the same degree. Each of the IP Options includes all of the T.F. <strong>Green</strong> <strong>Airport</strong> <strong>Improvement</strong><strong>Program</strong> elements and a proposed extension of Runway 5-23 to 9,350 feet. In the Level 4 Screening, FAA andRIAC evaluated each of the IP Options to determine whether it would be practicable on the basis of:• The impacts to the aquatic ecosystem; 103• Other significant adverse environmental consequences;• Operational safety; and• Cost.A major cost item was the construction of the Main Avenue tunnel, which was estimated to be approximately$112 million, and was included in all IP Options except for IP Option B. FAA determined that puttingMain Avenue in a tunnel, although constructible, would not be practicable for public safety considerations 104and cost. Therefore, all IP Options with the Main Avenue tunnel were eliminated from further consideration.The only IP Option that does not include a Main Avenue tunnel was IP Option B, which moved forward in thealternatives consideration.Of the three Integrated Cargo Facility site locations, Site 3 was operationally preferred and would not impactwetlands, and thus was retained for further environmental analysis. Refer to DEIS Appendix E, AlternativesAnalysis for the full Level 4 Screening practicability analysis.Based on the Level 4 screening analysis, FAA dismissed four of the Level 4 Alternatives (IP Options A, C, D,and E) from further consideration because they would not be practicable to construct based on environmentalimpacts, community impacts, and cost. 105 Integrated Cargo Facility Sites 1 and 2 were eliminated from furtheranalysis because they would not be practicable to construct due to airside operational safety concerns. Inaddition Site 1 would impact wetlands. The Site 3 location of the Integrated Cargo Facility was carried forward.Table 3-4 summarizes the results of the Level 4 screening analysis.The No-Action Alternative and IP Option B were carried forward into the Level 5 screening because based on theLevel 4 screening, they were found to be practicable and IP Option B would meet the project Purpose and Need.Within the Level 5 screening process, four steps were undertaken as described in the following section.103 Impacts to the aquatic ecosystem were used as a screening criteria because the Clean Water Act protects these resources and a permit from the USACEwould be required if the IP Options would significantly impact wetlands.104 Currently, the Rhode Island Department of Transportation (RIDOT) does not own or operate any tunnels, and expressed concern about public safety.105 For cost and impacts of the Level 4 Alternatives, see DEIS Appendix E, Alternatives Analysis Tables E.6-1 and E.6-2.Chapter 3 – Alternatives Analysis 3-15 July 2011\\mawatr\ev\09228.00\reports\<strong>FEIS</strong>_Final_July_2011\<strong>PVD</strong>_CH03_Alternatives_JUL_2011.doc
T.F. <strong>Green</strong> <strong>Airport</strong> <strong>Improvement</strong> <strong>Program</strong>Environmental Impact Statement and Final Section 4(f) EvaluationTable 3-4 Summary of Level 4 Screening Analysis 1Results ofAnalysisRationaleIP Option A Eliminated Not practicable due to the cost and public safety risks associated with placing Main Avenue in a tunnel.Maximum impact to Buckeye Brook (south) wetlands.IP Option B Retained Practicable, minimizes impacts to Buckeye Brook (south) wetlands. Lowest cost to construct.IP Option C Eliminated Not practicable due to the cost and public safety risks associated with placing Main Avenue in a tunnel.IP Option D Eliminated Not practicable due to the cost and public safety risks associated with placing Main Avenue in a tunnel.IP Option E Eliminated Not practicable due to the cost and public safety risks associated with placing Main Avenue in a tunnel.Integrated Cargo Facility Site 1 Eliminated Not practicable because of airside operational safety concerns and impacts to wetlands.Integrated Cargo Facility Site 2 Eliminated Not practicable because of airside operational safety concerns.Integrated Cargo Facility Site 3 Retained Practicable; no impacts to wetlands or to operational safety.1 Under IP Options A through E, Runway 5-23 was extended to 9,350 feet.3.7 Level 5 Screening – Further Refined AlternativesTo minimize the substantial community and wetland impacts identified in the Level 4 Screening Step,additional versions of IP Option B were developed to include shorter Runway 5-23 lengths. An additionalrunway length and utility analysis was conducted to evaluate options with a shorter extension to Runway 5-23 tothe north and south (Alternatives B2 and B4 to 8,700 feet; and Alternative B3 North and South to 8,300 feet).Chart 3-2 and the following provide a summary of the Level 5 screening steps:• Level 5 Step 1 – IP Option B modified, additional runway length and utility analysis, Alternatives B2 and B3North developed, and Alternative B3 North eliminated.• Level 5 Step 2 – New phasing prioritizes the safety enhancement elements.• Level 5 Step 3 – Alternatives B4 and B3 South developed, Alternative B3 South eliminated, and comparativeenvironmental impact analysis of Alternatives B1, B2, and B4.• Level 5 Step 4 – Alternative B1 eliminated and Alternatives B2 and B4 retained for Level 6 screening.IP Option B1 (shown as Alternative B1 in Figure 3-5) was developed in the Level 3 screening to avoid impacts toMain Avenue and minimize impacts to residential communities and natural resources south of the <strong>Airport</strong>.Runway 5-23 would be extended north approximately 2,200 feet for a total of 9,350 feet. The Runway 5-23 extensionwould require a full relocation of <strong>Airport</strong> Road. 106 IP Option B1 shifts Runway 16-34 north along its centerlineapproximately 400 feet to accommodate the enhanced RSAs on the Runway 16 and 34 Ends and minimize impacts tonatural resources on the Runway 34 End. 107 <strong>Airport</strong> Road would be fully relocated from Warwick Avenue toPost Road with a direct connection to Route 37 to accommodate the Runway 5-23 extension and the Runway 16-34106 At the time this Alternative was developed, the FAA guidance was to avoid roadways (especially new roadway alignments) within RPZs. Options for keepingthe Fully Relocated <strong>Airport</strong> Road outside of the Runway 23 End RPZ were evaluated, but were not practicable due to the substantial increase in landacquisition and likely traffic impacts. The IP Option B1 Fully Relocated <strong>Airport</strong> Road alignment would improve the east-west traffic flow in Warwick, while thenorthern alignment would likely exacerbate the existing traffic problems on Main Avenue.107 It was assumed for all Build Alternatives that the obstructions on the Runway 16 End in the Ann & Hope parking lot would be removed prior to the runway coming on-line.Chapter 3 – Alternatives Analysis 3-16 July 2011\\mawatr\ev\09228.00\reports\<strong>FEIS</strong>_Final_July_2011\<strong>PVD</strong>_CH03_Alternatives_JUL_2011.doc
T.F. <strong>Green</strong> <strong>Airport</strong> <strong>Improvement</strong> <strong>Program</strong>Environmental Impact Statement and Final Section 4(f) EvaluationChart 3-2Level 5 Alternatives Screening ProcessChapter 3 – Alternatives Analysis 3-17 July 2011\\mawatr\ev\09228.00\reports\<strong>FEIS</strong>_Final_July_2011\<strong>PVD</strong>_CH03_Alternatives_JUL_2011.doc
T.F. <strong>Green</strong> <strong>Airport</strong> <strong>Improvement</strong> <strong>Program</strong>Environmental Impact Statement and Final Section 4(f) Evaluationsafety enhancements. This IP Option would use EMAS on the Runway 34 End. The Integrated Cargo Facility wouldbe constructed west of the Runway 23 End with roadway access from existing <strong>Airport</strong> Road.During the Level 5 Screening process, the FAA evaluated the utility and preliminary environmental impacts offive alternatives, Alternatives B1, B2, B3 North, B3 South and B4. Ultimately, the FAA eliminatedAlternatives B1, B3 North and B3 South from further study. This section details the process moving from Level 5to a Level 6 screening.3.7.1 Level 5 Screening Step 1 – Runway 5-23 Length ModificationsAlthough identified as the only Level 4 Alternative that would be practicable to construct, IP Option B andspecifically the extension of Runway 5-23, would have the most impact to wetlands north of <strong>Airport</strong> Road comparedto the other Level 4 Alternatives. Approximately 12 acres of wetlands would be impacted including relocating thechannels of Buckeye Brook and the Spring <strong>Green</strong> Pond outlet. This alternative and would require acquisition of thehighest number of residential (334 to 339) and commercial (75) parcels when compared to the other alternativesunder consideration. Due to wetland, residential, and commercial impacts as well as concerns raised by RIAC,various coordinating federal, state, and tribal entities and City of Warwick officials, the FAA re-evaluated theextension parameters for Runway 5-23. The development of Runway 5-23 length modifications was conductedwithin the context of four objectives:• Avoid tunneling or major relocation of Main Avenue; 108• Avoid impacts to the Buckeye Brook stream channel north of <strong>Airport</strong> Road;• Maintain appropriate runway safety area and other runway safety requirements (i.e., object free areas,protection zones) according to FAA standards; and,• Reduce the number of parcels to be acquired.Considering the physical constraints noted above, alternate runway layouts were developed. The determinationof whether each Runway 5-23 length modification could still meet the Purpose and Need is evaluated further inthis section.• Alternative B2 – Extend Runway 5-23 North and South to a total of 8,700 FeetAlternative B2 (Figure 3-6) extended the Runway 23 End as far north as possible without impacting BuckeyeBrook, and identified design modifications at the Runway 5 End that could allow the runway to beextended to the south. It would be possible to raise the grade of the Runway 5 End by six feet. This wouldavoid impacts to Main Avenue, would allow Main Avenue to remain outside of the Runway Object FreeArea, and would still provide sufficient clearance for departing and arriving aircraft. The maximum runwaylength that could be achieved by this modification is 8,700 feet. Runway 5-23 would be extendedapproximately 600 feet north and 930 feet south for a total of 8,700 feet. Fully Relocated <strong>Airport</strong> Road wasdesigned to remain outside of the Runway 23 End RPZ in compliance with FAA guidance at that time. TheRunway 16-34 safety enhancements, Fully Relocated <strong>Airport</strong> Road, and the Integrated Cargo Facility wouldbe the same as Alternative B1. EMAS would be used on the Runway 23, 5, and 34 Ends.108 Major relocation would consist of relocating Main Avenue entirely off RIAC-owned property.Chapter 3 – Alternatives Analysis 3-18 July 2011\\mawatr\ev\09228.00\reports\<strong>FEIS</strong>_Final_July_2011\<strong>PVD</strong>_CH03_Alternatives_JUL_2011.doc
T.F. <strong>Green</strong> <strong>Airport</strong> <strong>Improvement</strong> <strong>Program</strong>Environmental Impact Statement and Final Section 4(f) Evaluation• Alternative B3 North – Extend Runway 5-23 North to a total of 8,300 FeetAlternative B3 North (Figure 3-7) includes a runway extension that would extend Runway 5-23 as far northas possible without impacting the stream channel of Buckeye Brook. The maximum runway length possiblegiven these constraints is 8,300 feet. The runway extension would be located on airport property, but wouldstill require the full relocation of <strong>Airport</strong> Road. Fully Relocated <strong>Airport</strong> Road was designed to remainoutside of the Runway 23 End RPZ in compliance with FAA guidance at that time. Runway 5-23 would beextended approximately 600 feet north and 530 feet south to a total length of 8,300 feet by shifting therunway thresholds both north and south. The Runway 16-34 safety enhancements, Fully Relocated <strong>Airport</strong>Road, and the Integrated Cargo Facility would be the same as Alternative B1 and B2. EMAS would be usedat the Runway 23 and 34 Ends.The difference between the 8,300-foot and 8,700-foot runway alignments described above occurs entirely at theRunway 5 End. Alternatives B2 and Alternative B3 North are shown in Figures 3-6 and 3-7.Step 1 of this screening process focuses on an analysis of runway length. The 9,350-foot option is represented byAlternative B1, the 8,700-foot option is represented by Alternative B2, and the 8,300-foot option is representedby Alternative B3 North. The 8,300 South Configuration (Alternative B3 South) is a more recent variation andwas not evaluated in Step 1 of the Level 5 screening process.3.7.1.1 Runway Length Analysis: Comparison of Alternatives B2 and B3 NorthFrom an airport planning perspective, the utility of a runway system must be viewed in terms of the entirecurrent and anticipated fleet mix of aircraft. In the case of T.F. <strong>Green</strong> <strong>Airport</strong>, RIAC has proposed enhancementsthat would accommodate demand for non-stop passenger airline services to West Coast markets to enhance theefficiency of the New England Regional <strong>Airport</strong> System (by reducing leakage from the T.F. <strong>Green</strong> catchmentarea to Logan; see Sections 2.2.2.4 and 2.3.2.1 for further details). The proposed enhancements would also offerflexibility for airlines to provide their current service with a variety of aircraft types. As noted in the NERASP,“it is important that airport facilities maintain the ability to accommodate and quickly adjust to increases indemand in order to support cycles of economic expansion. This requires leading rather than reacting topassenger requirements.” 109FAA’s Advisory Circular (AC) 150/5325-4B, Runway Length Requirements for <strong>Airport</strong> Design, provides guidance todetermine recommended runway lengths based on the critical aircraft type. For airport projects receiving federalfunding, the use of the AC is mandatory. 110 The goal of the FAA guidance is “to construct an available runwaylength for new runways or extensions to existing runways that is suitable for the forecasted critical designairplanes.” 111 The critical design aircraft type is the one that meets the “substantial use threshold” 112 and require thelongest runway length at maximum certificated takeoff weight. Planning for runway length requirements basedon the most demanding aircraft (in terms of departure runway length requirements) allows an airport to offer the109 The New England Regional <strong>Airport</strong> System Plan, New England <strong>Airport</strong> Coalition, 2006, Page 19.110 FAA Advisory Circular 150/5325-4B, Runway Length Requirements for <strong>Airport</strong> Design; the use of FAA AC 150/5325-4B to determine appropriate runwaylengths is also recommended in FAA AC 150/5070-6B, Change 1, <strong>Airport</strong> Master Plans, section 805.b(3), May 1, 2007.111 Ibid, Page 1.112 500 or more annual existing or anticipated itinerant operations at the airport (landings and takeoffs are considered as separate operations).Chapter 3 – Alternatives Analysis 3-19 July 2011\\mawatr\ev\09228.00\reports\<strong>FEIS</strong>_Final_July_2011\<strong>PVD</strong>_CH03_Alternatives_JUL_2011.doc
T.F. <strong>Green</strong> <strong>Airport</strong> <strong>Improvement</strong> <strong>Program</strong>Environmental Impact Statement and Final Section 4(f) Evaluationgreatest flexibility and operational efficiency to accommodate anticipated airline service. The analysis aims toaccommodate as many aircraft as possible without weight reductions to ensure sound investment in runwayinfrastructure.As part of the planning process under Step 1 of the Level 5 screening, a runway length analysis was undertakento determine whether, and to what extent, an 8,300 or 8,700-foot runway as compared to a 9,350-foot runwaywould meet the Purpose and Need, and whether it would be practicable to construct. The analysis determinedthe following comparative factors between the different runway lengths:• Number of aircraft that could operate; and,• Construction costs.Aircraft AccommodatedBased on the determination of possible runway length options and physical constraints of the <strong>Airport</strong>, thenumber of different aircraft types that could be accommodated by these revised runway options was evaluated.Two different payload, or aircraft weight, scenarios were examined:• Maximum gross takeoff weight; and,• Belly cargo payload reductions.Maximum Gross Takeoff WeightIn general, the flexibility of the airfield to accommodate various aircraft types that are capable of operating nonstopto West Coast destinations at maximum gross takeoff weight decreases as the length of the proposed runwayextension decreases. Airlines prefer to have the ability to operate at maximum gross takeoff weight as much aspossible because it represents a full passenger and belly cargo load, thereby maximizing the profitability of eachflight. To ensure sound investment in runway infrastructure, FAA guidance recommends that airports provideadequate runway lengths to accommodate aircraft operations without weight penalties or reductions.The runway length analysis relies on the best publicly available data, which is the aircraft manufacturers’ (suchas Boeing and Airbus) airport planning manuals, to determine runway length requirements. FAA guidance 113states that “the guidelines, the airplane performance data curves and tables, and the referenced airplanemanufacturer manuals are not to be used as a substitute for flight planning calculations as required by airplaneoperating rules.” Air carriers determine runway length requirements and weight restrictions at their owndiscretion. Therefore, runway length requirements calculated for flight planning purposes may differ fromthose produced for airport design purposes using the FAA AC guidance.A total of seven aircraft models in the forecast fleet mix are capable of flying non-stop to West Coast markets fromT.F. <strong>Green</strong> <strong>Airport</strong>, or approximately 2,300 nautical miles (Chart 2-5). Variations of the general aircraft types that113 FAA Advisory Circular 150/5325-4B, Runway Length Requirements for <strong>Airport</strong> Design.Chapter 3 – Alternatives Analysis 3-20 July 2011\\mawatr\ev\09228.00\reports\<strong>FEIS</strong>_Final_July_2011\<strong>PVD</strong>_CH03_Alternatives_JUL_2011.doc
T.F. <strong>Green</strong> <strong>Airport</strong> <strong>Improvement</strong> <strong>Program</strong>Environmental Impact Statement and Final Section 4(f) Evaluationinclude engine types and winglets yield a total of 26 specific aircraft types that are capable of non-stop West Coastservice. 114 These aircraft are considered “West Coast-capable” aircraft for the purposes of this EIS.As shown in Table 3-5, 23 of the 26 West Coast-capable aircraft could operate on a 9,350-foot runway atmaximum gross takeoff weight. At a runway length of 8,700-feet, 21 of the 26 West Coast-capable aircraft couldbe accommodated at maximum gross takeoff weight. At a runway length of 8,300 feet, 20 of the 26 WestCoast-capable aircraft could operate at maximum gross takeoff weight.Table 3-5Number of West Coast-Capable Aircraft Accommodated on Various Runway LengthsNumber of West Coast-Capable AircraftMaximum Gross Takeoff WeightRunway Length (no weight penalties) Belly Cargo Weight Penalties9,350 feet (Alternative B1) 23 268,700 feet (Alternative B2) 21 238,300 feet (Alternative B3 North) 20 217,166 feet (No-Action Alternative, Existing Runway Length) 11 11Source: FAA Advisory Circular 150/5325-4B, Runway Length Requirements for <strong>Airport</strong> Design.Notes: If air carriers using these aircraft opt to operate with passenger payload penalties, they may be able to operate at shorter runway lengths. For example, some ofthe aircraft that could operate on a 9,350-foot runway at maximum gross takeoff weight (no weight penalties) may opt to operate on an 8,700-foot runway withsome passenger payload penalties.The analysis presented in this table considers all aircraft in the current and forecast fleet mix at T.F. <strong>Green</strong> <strong>Airport</strong> that are capable of operating non-stop to theWest Coast (approximately 2,300 nautical miles) from T.F. <strong>Green</strong> <strong>Airport</strong> (See DEIS Supporting Attachment E.A.1, Runway Length Analysis, in DEIS Appendix E,Alternatives Analysis).Belly Cargo Payload ReductionsFAA cannot predict how much of a weight reduction (in cargo or passengers) an air carrier would be willing totake in order to operate on a particular runway length. If they have to take any weight off, however, it wouldfirst be belly cargo. 115 The 2008 supplemental analysis of the utility of different runway lengths in the future atT.F. <strong>Green</strong> considered belly cargo payload reductions to reduce aircraft operational weight. A payloadreduction, or “penalty”, results in lost economic revenue opportunities for airlines. Belly cargo penalties on apassenger air carrier aircraft are not as detrimental as passenger payload reductions. Although most passengerairlines carry cargo, it is not a principal source of revenue and therefore can be reduced without substantiallyimpacting airline revenue.The 2008 supplemental analysis considered the removal of belly cargo (not associated with passenger baggage)to reduce aircraft weight and allow for the use of shorter runway lengths. When the belly cargo is removed fromaircraft, the 9,350 feet runway could accommodate all 26 West Coast-capable aircraft, the 8,700 feet runway114 Some of these 26 specific aircraft types are not within the fleets of the air carriers that currently operate at T.F. <strong>Green</strong> <strong>Airport</strong>. However, all of the 26 specificaircraft types are still considered in this analysis because they are still in production, available for purchase/lease, or used by other air carriers. Therefore, any ofthese 26 specific aircraft types could be used by an air carrier to conduct non-stop West Coast service from T.F. <strong>Green</strong> <strong>Airport</strong> in the future.115 According to telephone interviews with airlines operating at T. F. <strong>Green</strong> <strong>Airport</strong> (including Southwest Airlines on April 10, 2006 and United Airlines on April 13,2006; see Supporting Attachment E.A.2a), if payload reductions are required, cargo would be the first category of payload to be removed from the aircraft tomeet payload capacity.Chapter 3 – Alternatives Analysis 3-21 July 2011\\mawatr\ev\09228.00\reports\<strong>FEIS</strong>_Final_July_2011\<strong>PVD</strong>_CH03_Alternatives_JUL_2011.doc
T.F. <strong>Green</strong> <strong>Airport</strong> <strong>Improvement</strong> <strong>Program</strong>Environmental Impact Statement and Final Section 4(f) Evaluationcould accommodate 23 West Coast-capable aircraft, and the 8,300 feet runway could accommodate 21 WestCoast-capable aircraft.Construction CostsAn estimate of construction costs concluded that the 9,350-foot runway option would cost approximately$195 million, compared with $127 million for the 8,700-foot option and $112 million for the 8,300-foot option. 116Most of the cost differential would be associated with land acquisition for construction and mitigation.Summary of the Level 5 Screening Runway Length AnalysisThe purpose of the Runway 5-23 extension is to “enhance the efficiency of the <strong>Airport</strong> and the New EnglandRegional <strong>Airport</strong> System, to more fully meet the current and anticipated demand for aviation services.” Thegoal of the runway extension is to maximize the operational flexibility of the airport to the greatest practicalextent to allow non-stop West Coast passenger airline service with a variety of aircraft types. Airlines prefer tohave the ability to operate at maximum gross takeoff weight, or as close as practicable, as much as possiblebecause it represents a full passenger and cargo load, thereby maximizing the profitability of each flight.The flexibility of the airfield to accommodate various aircraft types that are capable of operating non-stop to WestCoast destinations at maximum gross takeoff weight decreases as the length of the proposed runway extensiondecreases. Therefore, the flexibility of Alternative B3 North is less than Alternative B2 because it would be able toaccommodate one less West Coast capable aircraft than Alternative B2 at maximum gross takeoff weight, andtwo fewer aircraft with reductions in belly cargo payload. Alternative B3 North would also cost $15 million, orapproximately 12 percent, less than Alternative B2 and result in substantially similar environmental impacts.RIAC considered that an 8,700 foot runway would accommodate a substantially greater percentage of WestCoast capable aircraft and passengers than an 8,300 foot runway, with only slightly higher costs and residentialparcel acquisitions. 117 Based on the implications of the passenger differential, The RIAC Board decided not tosupport Alternative B3 North because it would decrease the likelihood that an airline would choose tocommence non-stop West Coast service from T.F. <strong>Green</strong> <strong>Airport</strong>. The RIAC Board resolution on May 30, 2007states that “an 8300 foot Runway 5-23 conceptual option will not produce the level of service benefits sought tobe achieved through the <strong>Airport</strong> <strong>Improvement</strong> <strong>Program</strong> as generally stated in the EIS Purpose and NeedStatement and will provide only limited potential environmental and costs savings benefits over those providedby an 8700 foot Runway 5-23 alternative.” 118An 8,700-foot runway maximizes the flexibility of the airfield within the constraints surrounding the <strong>Airport</strong>,and meets the Purpose and Need of the proposed T.F. <strong>Green</strong> <strong>Airport</strong> <strong>Improvement</strong> <strong>Program</strong> by enhancing theefficiency of the <strong>Airport</strong> and the New England Regional <strong>Airport</strong> System, to more fully meet the current andanticipated demand for aviation services. Therefore, Alternative B2 was advanced to the Level 5 environmentalconsequences screening step. Conversely, FAA determined that Alternative B3 North (extending Runway 5-23 to116 The feasibility of modifying Alternative B3 North (by keeping the Runway 23 threshold in place, extending the Runway 5 end, and using EMAS) to avoidrelocation of <strong>Airport</strong> Road and Main Avenue was evaluated to determine if construction costs could be reduced substantially. However, this modificationwould not be feasible due to the engineering challenges of the grade change in the vicinity of <strong>Airport</strong> Road.117 See May 11, 2007: RIAC Retreat presentation materials regarding runway length analyses in <strong>FEIS</strong> Appendix E.4, RIAC Decision Documents.118 See May 30, 2007: Minutes of Meeting, RIAC Board of Directors in <strong>FEIS</strong> Appendix E.4, RIAC Decision Documents.Chapter 3 – Alternatives Analysis 3-22 July 2011\\mawatr\ev\09228.00\reports\<strong>FEIS</strong>_Final_July_2011\<strong>PVD</strong>_CH03_Alternatives_JUL_2011.doc
T.F. <strong>Green</strong> <strong>Airport</strong> <strong>Improvement</strong> <strong>Program</strong>Environmental Impact Statement and Final Section 4(f) Evaluation8,300 feet) would not meet the Purpose and Need as fully as Alternative B2 because it would not enhance theefficiency of the New England Regional <strong>Airport</strong> System as greatly as an alternative with a 8,700-foot runwayextension and RIAC determined it was not practicable to justify the financial investment. Therefore, FAA didnot advance Alternative B3 North further in the alternatives screening process.3.7.2 Level 5 Screening Step 2 - Modifications to Alternatives B1 and B2 PhasingAfter establishing the costs in Step 1 of the Level 4 screening, the FAA and RIAC examined the availability offederal funding and determined that it may not be feasible to implement all safety and efficiency elements of theT.F. <strong>Green</strong> <strong>Airport</strong> <strong>Improvement</strong> <strong>Program</strong> concurrently by 2012, as previously planned. 119 Further, due to afederal deadline for all commercial airports in the U.S. to enhance RSAs to FAA standards by September 2015,the safety enhancement elements of the T.F. <strong>Green</strong> <strong>Airport</strong> <strong>Improvement</strong> <strong>Program</strong> were prioritized.Alternatives B1 (Figure 3-5; referred to as IP Option B in Level 4) and B2 were designed to a conceptual level andunderwent detailed environmental consequences evaluation to assess impacts to natural resources, communitydisruption, residential land acquisition, and the impacts to businesses. The Level 5 analysis was based on the DEISforecast prepared in 2004. 120 Alternative B1 would require a higher number of land acquisitions for constructioncompared to Alternative B2; however, both alternatives would require a significant number of residential andcommercial land acquisitions for construction. Alternatives B1 and B2 would impact the <strong>Airport</strong> Plaza parcel on thecorner of Post Road and <strong>Airport</strong> Road, which contains approximately 23 community-supporting businesses and theirassociated jobs. In terms of wetland impacts, Alternative B1 would have more wetland impacts at 20.2 acres, comparedto Alternative B2, where the total wetland impacts would be substantially lower at 8.6 acres. 1213.7.3 Level 5 Screening Step 3 - Development of Alternatives B4 and B3 SouthDue to the significant impacts associated with the other alternatives, an additional alternative, Alternative B4,was developed during the Level 5 screening process. It represents a refinement of alternatives that wasidentified to avoid impacts associated with Alternatives B1 and B2. Another Alternative, Alternative B3 South,with a runway extension to 8,300 feet, was also developed and analyzed Step 3 of the Level 5 Screening. Thefollowing section describes the identification and development Alternative B4 and Alternative B3 South andprovides a summary of the alternatives that underwent conceptual 30 percent design and a detailedenvironmental impact analysis in Step 3 of Level 5 (Alternatives B1, B2, and B4).3.7.3.1 Development of Alternative B4In 2008, after a review of impacts to natural resources and community disruption for Alternatives B1 and B2,and in response to stakeholder concerns, in Step 2 of the Level 5 Screening, RIAC initiated a study to determineif another option could be developed that would limit community disruption and environmental impacts. Thisstudy led to the development of Alternative B4 and Alternative B3 South (see Chart 3-2). Alternative B4(Figure 3-6) was developed to:119 As part of the Level 5 Analysis, RIAC and FAA reconsidered the phasing program in light of federal funding availability in 2009. See DEIS Appendix E,Alternatives Analysis, Section E.7.3.1, Development of Alternative B4. FAA and RIAC previously determined that the projects would be constructed by 2012in the Level 4 analysis.120 The Level 6 environmental consequences analysis is based on a 2009 forecast for 2020 that is consistent with the FAA’s 2008 TAF.121 The wetland impacts presented here (Table 3-10) were based on the design of Alternatives B1 and B2 as originally conceived (prior to the development ofAlternative B4). As Alternative B4 was developed, opportunities to minimize impacts to natural resources were identified. These changes were then carriedback into Alternatives B1 and B2 in an effort to minimize the impacts of all alternatives. Therefore, the wetland impacts presented here are higher thanthose presented later in Level 5 Screening Step 4, which reflects the minimization efforts.Chapter 3 – Alternatives Analysis 3-23 July 2011\\mawatr\ev\09228.00\reports\<strong>FEIS</strong>_Final_July_2011\<strong>PVD</strong>_CH03_Alternatives_JUL_2011.doc
T.F. <strong>Green</strong> <strong>Airport</strong> <strong>Improvement</strong> <strong>Program</strong>Environmental Impact Statement and Final Section 4(f) Evaluation• Minimize impacts to the residential communities and businesses;• Reduce mandatory land acquisition for construction by limiting construction as much as possible to landlocated south of the Runway 5 End already owned by RIAC;• Avoid the need to tunnel Main Avenue by adding fill to the Runway 5 End and constructing an effectiveand efficient realignment of Main Avenue; and• Minimize impacts to natural resources north of the <strong>Airport</strong> including avoiding impacts to Buckeye Brooksouth and north of the <strong>Airport</strong>.In addition to environmental and community impacts, the FAA also considered construction and landacquisition program costs. 122 The FAA prepared preliminary cost data for Alternatives B1 and B2 based on the30 percent level design drawings and a preliminary estimate of mitigation costs. The FAA estimated that theprogram’s total cost would be over $500 million. A major cost associated with both alternatives was FullyRelocated <strong>Airport</strong> Road, which would cost an estimated $50 million. The FAA worked with the USACE andother federal and state agencies to look at other options to lower environmental impacts and lessen communitydisruption. Alternative B4 would extend Runway 5-23 south approximately 1,530 feet for a total of 8,700 feetand remain within RIAC-owned land. Alternative B4 shifts Runway 16-34 north approximately 100 feet toaccommodate the enhanced RSAs and minimize impacts to businesses on the Runway 16 End and limitmandatory acquisition for construction on the Runway 34 End.The Runway 16-34 safety enhancements would require a partial relocation of <strong>Airport</strong> Road at the intersection ofPost Road and <strong>Airport</strong> Road. <strong>Airport</strong> Road would be partially relocated to the north. Alternative B4 wouldrequire Main Avenue to be realigned to the south at the Runway 5 End. EMAS would be used on the Runway 5,16, and 34 Ends. The Integrated Cargo Facility would consist of a split operation in the vicinity of Site 3including the reuse of existing Hangar No. 2, where cargo operations currently are housed, and a new cargobuilding east of the Runway 16 End. Wetland impacts were minimized at the Airfield Maintenance Facilityaccess road.Key elements of Alternative B4 (all the safety projects as well as the extension of Runway 5-23 and associatedwork) could be completed by the end of 2015. This expedited schedule, proposed by RIAC, would only be possiblefor Alternative B4 because it would require substantially fewer parcels for mandatory land acquisition forconstruction than would be required to construct Alternatives B1 and B2. Some of the benefits associated with anaccelerated schedule would be the earlier realization of important safety and operational benefits, earlierresolution of homeowner uncertainty regarding the necessary associated property acquisitions, shortening theoverall timeframe for community disruption and temporary construction impacts, acceleration of enhancementsthat will accommodate West Coast flights, and earlier realization of attendant revenue and local economic benefits.3.7.3.2 Development of Alternative B3 SouthThe FAA developed a second conceptual layout of an alternative with a Runway 5-23 extension to 8,300 feet toexplore an alternate layout with different impacts and costs than Alternative B3 North. This layout is referred to122 If RIAC applies for a Letter of Intent under the AIP, the FAA will require a benefit-cost-analysis according to FAA Order 5100.38C page 186 b.Chapter 3 – Alternatives Analysis 3-24 July 2011\\mawatr\ev\09228.00\reports\<strong>FEIS</strong>_Final_July_2011\<strong>PVD</strong>_CH03_Alternatives_JUL_2011.doc
T.F. <strong>Green</strong> <strong>Airport</strong> <strong>Improvement</strong> <strong>Program</strong>Environmental Impact Statement and Final Section 4(f) Evaluationas Alternative B3 South. . After the development of Alternative B4, the FAA revisited an alternative with arunway length of 8,300 feet to evaluate if this alternative, with reduced impacts and construction costs, wouldbe retained.With the same general configuration and engineering solution as Alternative B4, Alternative B3 South wouldextend Runway 5-23 to a total of 8,300 feet and would remain on-<strong>Airport</strong> property, but would still require arealignment of Main Avenue within the OFA to allow for sufficient aircraft clearances. For this alternative,Runway 5-23 would be extended approximately 1,100 feet south to a total length of 8,300 feet by shifting theRunway 5 threshold to the south. Alternative B3 South shifts Runway 16-34 north approximately 100 feet toaccommodate the enhanced RSAs and minimize impacts to businesses on the Runway 16 End. TheRunway 16-34 safety enhancements would require a partial relocation of <strong>Airport</strong> Road at the intersection of PostRoad and <strong>Airport</strong> Road. <strong>Airport</strong> Road would be partially relocated to the north. The existing <strong>Airport</strong> Road wouldremain in the Runway 23 End RPZ. EMAS would be used on the Runway 5, 16, and 34 Ends. The Integrated CargoFacility would consist of a split operation in the vicinity of Site 3 including the reuse of existing Hangar No. 2,where cargo operations currently are housed, and a new cargo building east of the Runway 16 End.This section provides a comparison of Alternative B3 South with the other Level 5 Screening Step 3 Alternativesin the following ways:• Runway utility (passengers accommodated);• Potential environmental impacts and costs; and,• Other East Coast airports offering non-stop West Coast service.Comparison of Runway Utility (Passengers Accommodated)Runway utility considers the ability of various runway lengths to accommodate aircraft and passengers inrelation to the construction costs, and can demonstrate whether an alternative is practicable to constructcompared to other runway length alternatives. Passenger payload is the principal source of revenue and is mostimportant to an airline. The operational costs of running an airline are covered by filling airline seats withpaying passengers. The costs for operating an airline are distributed among the total number of seats availablefor all of the aircraft within an airline’s fleet. Therefore, a per-seat operational cost is associated with operationof each flight. Depending on the airline’s operational efficiency, the available seats on each flight must be filledto a certain level in order to ensure that the costs of operating that flight are covered. Thus, the airlines’ decisionto provide non-stop service to the West Coast is dependent on their ability to operate profitably, which isdependent on passenger demand, fleet mix, and airfield limitations (if any).The passenger utility analysis takes a conservative approach by looking at additional passengers for non-stopWest Coast service only and does not include passenger loads to other destinations that could benefit from arunway extension such as Las Vegas and Phoenix. Current operational limitations experienced by airlines atT.F <strong>Green</strong> <strong>Airport</strong> due to the existing primary runway length are not shared with FAA or RIAC. Therefore,additional benefits to current airline operations as a result of the proposed runway extension would exist butcannot be quantified.Chapter 3 – Alternatives Analysis 3-25 July 2011\\mawatr\ev\09228.00\reports\<strong>FEIS</strong>_Final_July_2011\<strong>PVD</strong>_CH03_Alternatives_JUL_2011.doc
T.F. <strong>Green</strong> <strong>Airport</strong> <strong>Improvement</strong> <strong>Program</strong>Environmental Impact Statement and Final Section 4(f) EvaluationThe runway utility analysis considers service to non-stop West Coast markets by the B737-700, B737-800, A319, andA320 aircraft, which is consistent with the detailed fleet mix forecast. Following standard industry practices, aconservative approach was utilized, which analyzed the least performing variant (engine type and wingletconfiguration) to ensure the greatest flexibility to airlines. Although the least performing variant of the B737-700 andB737-800 aircraft types do not exist in the fleets of the airlines that currently operate out of T.F. <strong>Green</strong> <strong>Airport</strong> they arestill considered in this analysis because they are still in production, available for purchase or lease, or used by otherair carriers. Therefore, the least performing variants of these two aircraft types could be used by an air carrier toconduct non-stop West Coast service from T.F. <strong>Green</strong> <strong>Airport</strong> in the future. The analysis also considers payloadreductions of belly cargo before any passenger and baggage payload reductions. According to discussions withseveral airlines operating at T.F. <strong>Green</strong> <strong>Airport</strong>, 123 if payload reductions are required, belly cargo would be the firstcategory of payload to be removed from the aircraft to meet payload capacity. However, if additional payloadreductions are necessary beyond cargo payload reductions, passengers and baggage must be removed.The maximum number of additional passengers that could be accommodated on non-stop West Coast service withAlternatives B1 (9,350 foot runway), Alternatives B2 and B4 (8,700 foot runway), and Alternative B3 South(8,300 foot runway) is provided in Table 3-6. With 9,350 feet of available runway length, some belly cargo payloadwould need to be reduced but no passenger payload reductions would be needed. A maximum total of 9 millionpassengers could be accommodated between 2015 and 2025 with a 9,350 foot runway. A runway length of8,700 feet would result in a maximum annual payload reduction of approximately 64,400 passengers, and couldaccommodate a maximum total of 4.5 million to 8.3 million additional passengers through 2025 (Alternative B4would be implemented five years earlier than Alternative B2). Alternative B3 South, with a runway length of8,300 feet, would result in a maximum annual payload reduction of 120,050 passengers and could accommodate amaximum of 7.7 million passengers through 2025. The difference in maximum annual payload reductions betweenthe 8,700-foot runway alternatives and Alternative B3 South is approximately 55,000 passengers. Passengerpayload penalties could result in a maximum of approximately $13.7 million 124 in lost airline revenue alone 125 peryear for Alternative B3 South when compared to the 8,700-foot runway alternatives (when implemented).FAA cannot predict how much of a passenger payload reduction an air carrier would be willing to toleratewhile starting non-stop West Coast service; therefore this data does not consider an airline decision to not startthe non-stop service due to passenger payload reductions. If airlines decide not to provide non-stop West Coastservice from T.F. <strong>Green</strong> <strong>Airport</strong> because a maximum of approximately 120,050 passengers could not beaccommodated annually (compared to all additional passengers possible), then Alternative B3 South would notenhance the efficiency of the New England Regional <strong>Airport</strong> System as much as Alternative B4, which is part ofthe purpose and need for the proposed <strong>Airport</strong> <strong>Improvement</strong> <strong>Program</strong>.123 <strong>Airport</strong> Station Manager – Southwest Airlines. Telephone Interview. April 10, 2006. <strong>Airport</strong> Station Manager – United Airlines. Telephone Interview. April 13, 2006.124 The affect of the non-stop West Coast flights on airline revenue has not been evaluated for T.F. <strong>Green</strong> <strong>Airport</strong>’s existing West Coast connecting flights. However,as the passenger levels of T.F. <strong>Green</strong> <strong>Airport</strong> to Las Vegas flights demonstrates non-stop service would more likely increase total passenger level to the WestCoast and therefore airline revenue.125 Data provided in this paragraph represents the Incremental Build Alternative Forecast, which applies to both the 2004 aviation activity forecast and the revised2009 aviation activity forecast. Average U.S. airline system passenger revenue per available seat mile (PRASM) for 2008 ($0.107) and the average distancebetween T.F. <strong>Green</strong> and West Coast destinations (2,300 nm) was applied to total passenger reductions required for each runway length. The PRASM data wasobtained from the MIT's Airline Data Project (www.web.mit.edu/airlinedata/www/Revenue&Related.html), which sources US DOT Form 41 via BTS, Schedule T2and P12. These figures do not include lost revenue to the <strong>Airport</strong> from concessions, automobile parking, or Passenger Facility Charges (PFCs).Chapter 3 – Alternatives Analysis 3-26 July 2011\\mawatr\ev\09228.00\reports\<strong>FEIS</strong>_Final_July_2011\<strong>PVD</strong>_CH03_Alternatives_JUL_2011.doc
T.F. <strong>Green</strong> <strong>Airport</strong> <strong>Improvement</strong> <strong>Program</strong>Environmental Impact Statement and Final Section 4(f) EvaluationTable 3-6Level 5 Screening Step 3 — Utility Assessment of Runway 5-23 LengthsRunway Extension Runway Extension to Runway Extension Runway Extensionto 9,350 Feet) 8,700 Feet to 8,300 Feet to 8,700 feet(Alternative B1) (Alternative B2) (Alternative B3 South) (Alternative B4)Additional Passengers AccommodatedYear(with runway extension and cargo or passenger payload reductions, if necessary)2015 820,520 0 700,800 756,2802016 822,768 0 702,720 758,3522017 820,520 0 700,800 756,2802018 820,520 0 700,800 756,2802019 820,520 0 700,800 756,2802020 822,768 758,352 702,720 758,3522021 820,520 756,280 700,800 756,2802022 820,520 756,280 700,800 756,2802023 820,520 756,280 700,800 756,2802024 822,768 758,352 702,720 758,3522025 820,520 756,280 700,800 756,280Total 9.0 million 4.5 million 7.7 million 8.3 millionPercent of Maximum 100% 92% 85% 92%Passengers Accommodatedfor West Coast Non-StopService after ImplementationMaximum Additional Annual $202.2 $186.3 $172.7 $186.3Airline Revenue (estimated inmillions) 1Sources: <strong>FEIS</strong> Appendix E.1, Updated Forecast of Aviation Activity, and DEIS Appendix E, Alternatives Analysis, Supporting Attachment E.A.2b, Supplemental Analysis.Notes: In order to determine the maximum potential for passenger differentials among the alternatives, this analysis assumes a maximum load factor possible given anypotential payload limitations due to runway length available.This table considers a forecast estimate of 16 non-stop West Coast flights per day (with slightly more annually in 2016, 2020, and 2024 due to one additional dayassociated with the leap year). See Section 2.3.2.1, Primary Runway Length of Chapter 2, Purpose and Need.FAA cannot predict how much of a passenger penalty an air carrier would be willing to tolerate while starting non-stop West Coast service; therefore this datadoes not consider an airline decision to not start the non-stop service due to passenger penalties.1 Average U.S. airline system passenger revenue per available seat mile (PRASM) for 2008 ($0.107) and the average distance between T.F. <strong>Green</strong> and WestCoast markets (2,300 nm) was applied to total passengers accommodated by each runway length. The PRASM data was obtained from the MIT Airline DataProject (www.web.mit.edu/airlinedata/www/Revenue&Related.html), which sources US DOT Form 41 via BTS, Schedule T2 and P12.Comparison of Potential Environmental Impacts and CostsConsideration of any runway length alternative less than 9,350 feet must consider not only the constructioncosts and operational utility benefits provided by each runway length, but also the potential environmentalimpacts associated with each runway length alternative. Based on conceptual design, and as shown in Table 3-7,Alternative B3 South Runway 5-23 extension would result in substantially similar noise impacts, Section 4(f)impacts, historical resources impacts, construction impacts and costs, and identical impacts to wetlands andfloodplains as Alternative B4. Table 3-7 summarizes the impacts and construction costs of Alternatives B4 andB3 South.Chapter 3 – Alternatives Analysis 3-27 July 2011\\mawatr\ev\09228.00\reports\<strong>FEIS</strong>_Final_July_2011\<strong>PVD</strong>_CH03_Alternatives_JUL_2011.doc
T.F. <strong>Green</strong> <strong>Airport</strong> <strong>Improvement</strong> <strong>Program</strong>Environmental Impact Statement and Final Section 4(f) EvaluationTable 3-7Level 5 Screening Step 3 - Alternatives B3 South and B4: Summary of Key Impacts and CostsAlternative B3 SouthAlternative B4<strong>Program</strong> Element (2020) (Runway 5-23 8,300 feet) (Runway 5-23 8,700 feet)Business ImpactsImpacts to Businesses and Jobs 10 businesses and their associated 65 jobs 10 businesses and their associated 65 jobsResidential ImpactsResidential Land Acquisition (Mandatory due to Construction) 11 units 11 unitsNoise ImpactsExposed to Significant Noise Levels in 2020 (increase of 24 people, 10 units 47 people, 20 unitsat least DNL 1.5 dB at or above DNL 65 dB) 1Exposed to Noise Greater than DNL 70 dB in 2020 2 235 people, 100 units 263 people, 112 unitsExposed to Noise Between DNL 65 dB and 70 dB in 2020 2 4,862 people, 2,069 units 4,984 people, 2,121 unitsWetland Impacts 3 7.3 acres in one wetland system, no impacts 7.3 acres in one wetland system, noto Buckeye Brookimpacts to Buckeye BrookFloodplain Impacts 4.7 acres 4.7 acresSection 4(f) Resources 4Winslow Field Recreation FacilitiesHistoric Resources ImpactsRPZ impacts four full-sized softball fields, RPZ impacts four full-sized softball fields,clubhouse, two parking lots, soccer fields, clubhouse, two parking lots, soccer fields,and one playground; 3.4 acres of City land; and one playground;10.5 acres of RIAC land 2.7 acres of City land;10.6 acres of RIAC landHangar No. 1 5 Demolish for safety Demolish for safetyHangar No. 2 (Setting) 5 Internal reconfiguration, no adverse effect Internal reconfiguration, no adverse effectand de minimis useand de minimis useRhode Island State <strong>Airport</strong> Terminal Reduction in views, direct impact to Reduction in views, direct impact to(Setting and Landscaping) 6 landscaping landscapingEligible <strong>Airport</strong> Historic District 5 Alter historical configuration of airfield and Alter historical configuration of airfield andremove Hangar No. 1 remove Hangar No. 1Construction and Preliminary Mitigation Costs 7 $471 million $475 millionNotes: This table summarizes the key differences between Alternatives B4 and B3 South using the 2004 DEIS forecast.1 Properties would be eligible for sound insulation. The analysis is based on the DEIS Level 5 aircraft operations and fleet mix, using INM Version 6.0. Some homesexposed to noise levels DNL 65 dB and above may have already received sound insulation treatment under the NCP. Refer to Figure 3-8.2 Properties would be eligible for acquisition under a voluntary land acquisition program. Does not include neighborhood rounding of noise contours identifyingeligible parcels.3 Wetland impacts are associated with the Runway 34 RSA enhancements.4 Refer to Figure 3-9.5 Eligible for listing on the National Register of Historic Places.6 Listed on the National Register of Historic Places.7 Construction costs for Alternative B3 South are less than Alternative B4 due to a shorter runway extension. Mitigation costs would be slightly less due to fewerresidential units to be acquired and sound insulated.Chapter 3 – Alternatives Analysis 3-28 July 2011\\mawatr\ev\09228.00\reports\<strong>FEIS</strong>_Final_July_2011\<strong>PVD</strong>_CH03_Alternatives_JUL_2011.doc
T.F. <strong>Green</strong> <strong>Airport</strong> <strong>Improvement</strong> <strong>Program</strong>Environmental Impact Statement and Final Section 4(f) EvaluationApproximately 10 additional units would be exposed to significant noise levels by Alternative B4 compared toAlternative B3. An additional 12 homes (28 people) would be impacted by DNL 70 dB and above byAlternative B4 compared to Alternative B3. However, this does not take neighborhood rounding into account,and these homes could well be included in a land acquisition program for noise mitigation. An additional52 homes would be exposed to noise levels DNL 65 dB and above, by Alternative B4; however, many of thesecould have already received sound insulation mitigation.Both alternatives have identical wetland impacts, which would total 7.3 acres in one wetland system, with noimpacts to Buckeye Brook. Floodplain impacts for the two Alternatives are identical. The RPZ associated withAlternative B3 South and Alternative B4 would both impact Winslow Park, a Section 4(f) property, and bothwould require removal of four full-sized softball fields, clubhouse, two parking lots, soccer fields, and oneplayground. Both alternatives would have the same impact on historical resources and would requiredemolishing Hangar No. 1 and internal reconfiguration of Hangar No. 2. In addition, Alternative B3 South andAlternative B4 would both reduce views of the Rhode Island State <strong>Airport</strong> Terminal and would have the samedirect impacts to the Terminal’s landscaping.Comparison of Other East Coast <strong>Airport</strong>s Offering Non-Stop West Coast ServiceA review of other East Coast airports’ primary runway lengths provides a general range of lengths required toreasonably accommodate non-stop service to West Coast markets. There are 14 East Coast airports that currentlyoffer regularly scheduled non-stop passenger service to West Coast markets (as of May, 2011). Raleigh-DurhamInternational and Bradley International <strong>Airport</strong>s do not currently offer non-stop West Coast service, however theyare included in this comparison because they have offered seasonal non-stop service within the past year. The lengthof the primary runway at each of these airports is shown in Table 3-8. Aside from Ronald Reagan WashingtonNational <strong>Airport</strong> (DCA), 126 the shortest runway length at East Coast airports that offer non-stop service to West Coastmarkets is 9,000 feet, with the remainder at 9,500 feet or more. Although most of the airports also serveintercontinental destinations (e.g., Europe), which require relatively long runways, two of the airports (Ft. Lauderdaleand Bradley International <strong>Airport</strong>s) do not offer regularly scheduled commercial passenger service to Europe andhave runway lengths of at least 9,000 feet. Although there are a variety of factors considered in determining adequaterunway length (e.g., airfield elevation, temperature), none of the shorter primary runway lengths shown in Table 3-8(with the exception of DCA due to its unique market and service restrictions) deviate substantially from theoperationally preferred runway length of 9,350 feet determined for T.F. <strong>Green</strong> <strong>Airport</strong>.126 While DCA currently provides non-stop service to Los Angeles and Seattle (served by Alaska Airlines with a B737-800 aircraft), its runway length of 6,869’ is very limiting.These non-stop routes are two of only 24 daily flights allowed outside of a 1,250 mile “perimeter” from DCA. Since 1969, the “perimeter rule” has been in place at DCA tocontrol noise and influence air traffic to fly to/from Washington Dulles International <strong>Airport</strong> (located over 20 miles further from the D.C. city-center than DCA). Due to uniqueconditions related to the high demand for non-stop flights from the airport facility closest to Washington DC and the limited supply of flights allowed to be provided by theperimeter rule, airlines can operate profitably even if passenger payload penalties are required due to DCA’s relatively short runway length.Chapter 3 – Alternatives Analysis 3-29 July 2011\\mawatr\ev\09228.00\reports\<strong>FEIS</strong>_Final_July_2011\<strong>PVD</strong>_CH03_Alternatives_JUL_2011.doc
T.F. <strong>Green</strong> <strong>Airport</strong> <strong>Improvement</strong> <strong>Program</strong>Environmental Impact Statement and Final Section 4(f) EvaluationTable 3-8Primary Runway Lengths of East Coast U.S. <strong>Airport</strong>s with Non-Stop Service to the West CoastPrimary Runway Length<strong>Airport</strong>(Feet)John F. Kennedy International <strong>Airport</strong>, NY 14,572Miami International <strong>Airport</strong>, FL 13,000Orlando International <strong>Airport</strong>. FL 12,005Hartsfield-Jackson Atlanta International <strong>Airport</strong>, GA 11,890Washington Dulles International <strong>Airport</strong>, VA 11,501Pittsburgh International <strong>Airport</strong>, PA 11,500Tampa International <strong>Airport</strong>, FL 11,002Newark Liberty International <strong>Airport</strong>, NJ 11,000Philadelphia International <strong>Airport</strong>, PA 10,506Baltimore-Washington International Thurgood Marshall <strong>Airport</strong>, MD 10,502Boston-Logan International <strong>Airport</strong>, MA 10,083Charlotte/Douglas International <strong>Airport</strong>, NC 10,000Raleigh-Durham International <strong>Airport</strong>, NC 1 10,000Bradley International <strong>Airport</strong>, CT 1 9,510Fort Lauderdale-Hollywood International <strong>Airport</strong>, FL 9,000Ronald Reagan Washington National <strong>Airport</strong>, DC 6,869Source: Vanasse Hangen Brustlin, Inc., 2010.1 Although these airports do not receive non-stop West Coast service as of May 2011, seasonal service has been provided as recently as a year ago.3.7.3.3 Summary of Level 5 Screening Step 3If airlines decide not to provide non-stop West Coast service from T.F. <strong>Green</strong> <strong>Airport</strong> because of passengerpayload reductions, then the alternative would not enhance the efficiency of the New England Regional <strong>Airport</strong>System, which is part of the purpose and need for the proposed <strong>Improvement</strong> <strong>Program</strong>. New non-stop airlineservice to the West Coast is less likely with Alternative B3 South due to weight and passenger payloadreductions necessary to operate on the shorter runway. Because the FAA cannot predict how much of a weightreduction (in cargo and passengers) an air carrier would be willing to tolerate in order to operate on a particularrunway length and for runway lengths shorter than the operationally preferred runway length of 9,350 feet, thedifferences in utility (aircraft and passengers accommodated, and construction costs) must be considered. In allaspects considered, Alternative B3 South would provide less flexibility and utility to airlines than AlternativesB2 and B4 for a relatively minor difference in construction costs. Based on the reductions in flexibility and utilityprovided by Alternative B3 South, it is less likely that an airline would initiate service to the West Coast andmeet the purpose and need of the T.F. <strong>Green</strong> <strong>Airport</strong> <strong>Improvement</strong> <strong>Program</strong>.Alternative B3 South Runway 5-23 extension would have substantially similar construction impacts and costs,and identical impacts to wetlands, floodplains, and historical resources as Alternative B4. RIAC evaluated thisadditional analysis and reaffirmed its position in 2010 that a runway length of 8,300 feet for Runway 5-23 wouldnot meet the service benefits sought to be achieved as generally stated in the EIS Purpose and Need statement,Chapter 3 – Alternatives Analysis 3-30 July 2011\\mawatr\ev\09228.00\reports\<strong>FEIS</strong>_Final_July_2011\<strong>PVD</strong>_CH03_Alternatives_JUL_2011.doc
T.F. <strong>Green</strong> <strong>Airport</strong> <strong>Improvement</strong> <strong>Program</strong>Environmental Impact Statement and Final Section 4(f) Evaluationand provide only limited potential environmental and cost savings benefits over an 8,700-foot runway. 127 FAAdid not advance Alternative B3 South further in the alternative screening process because it would result in adecreased likelihood that an airline would choose to commence non-stop West Coast service due to the runwayutility findings presented in this section, and its potential environmental impacts would be substantially similarto Alternative B4.3.7.3.4 Level 5 Alternatives Retained for Detailed Environmental ConsequencesThis section provides a summary of each of the three Level 5 T.F. <strong>Green</strong> <strong>Airport</strong> <strong>Improvement</strong> <strong>Program</strong>Alternatives that underwent detailed environmental consequences impact assessment in support of the Level 5Alternatives Screening. 128 The impacts of each Level 5 Alternative are compared to the No-Action Alternative.Each alternative includes the program elements shown in Table 3-9.As part of the iterative process, Alternatives B1 and B2 were also modified to reduce impacts to naturalresources on the Runway 34 End and to limit mandatory land acquisition. Design changes applied to allalternatives on the Runway 34 End included removing the hold apron, moving the Perimeter Road between theEMAS bed and the runway end, and relocating the Perimeter Road to avoid wetlands near the air traffic controltower. The environmental analysis for the Level 4 Alternatives assumed that land acquisition in the RPZs wouldbe mandatory. The FAA then re-examined the assumptions and determined that properties within theAlternative B1 and B2 Runway 5-23 RPZs and Alternative B4 Runway 5 RPZ would be eligible for voluntaryland acquisition instead of mandatory acquisition. 129 The environmental analysis for the Level 5 Alternativesassumed that both the land acquisition for project-related noise mitigation and clearing of the RPZ would bevoluntary.3.7.4 Level 5 Screening Step 4 – Practicability Analysis of Alternative B1Alternatives B2 and B4 involve reduced wetland impacts as well as fewer land acquisitions and lower costscompared to Alternative B1 and, therefore, were advanced to the Level 6 impact analysis. Alternative B1 waseliminated from further consideration due to high and potentially unmitigatable wetland impacts,socioeconomic impacts due to land acquisition, and construction costs. The following section describes therationale for eliminating Alternative B1.3.7.4.1 Wetland Impacts and Mitigation MeasuresAlternative B1, with 19.0 acres of wetland impacts, would have twice the wetland impacts of Alternatives B2and B4. Alternative B2 would impact a total of 7.5 acres of wetlands with impacts on the Runway 23 End andRunway 34 End. Alternative B4 has the fewest acres of wetland impacts (7.3 acres) and limits the wetlandimpacts to the Runway 34 End only.127 See April 22, 2010 Letter from RIAC to FAA in <strong>FEIS</strong> Appendix E.4, RIAC Decision Documents.128 Alternatives B3 North and South were dismissed prior to the Level 5 detailed environmental analysis because they would not meet the Purpose and Needas fully as the alternatives with longer Runway 5-23 extensions.129 The Alternative B4 Runway 23 End RPZ properties would not be eligible for acquisition because the RPZ remains the same as in the No-Action condition.Chapter 3 – Alternatives Analysis 3-31 July 2011\\mawatr\ev\09228.00\reports\<strong>FEIS</strong>_Final_July_2011\<strong>PVD</strong>_CH03_Alternatives_JUL_2011.doc
T.F. <strong>Green</strong> <strong>Airport</strong> <strong>Improvement</strong> <strong>Program</strong>Environmental Impact Statement and Final Section 4(f) EvaluationTable 3-9Level 5 Build Alternatives Elements Subject to Environmental Consequences AnalysisAlternative B1 Alternative B2 Alternative B4<strong>Program</strong> Element (Runway 5-23 9,350 feet) (Runway 5-23 8,700 feet) (Runway 5-23 8,700 feet)Safety Enhancement Elements(Completed by the end of 2015)Enhance Runway 16-34 Runway SafetyAreas, including:X X XRealign Off-<strong>Airport</strong> RoadwaysPartially Relocated <strong>Airport</strong>Road at Tennessee AvenuePartially Relocated <strong>Airport</strong>Road at Tennessee AvenuePartially Relocated <strong>Airport</strong> Roadat Hasbrouck AvenueRelocate Delivery Drive X X XRelocate Taxiway C X X XDemolish Hangar No. 1 X X XEfficiency Enhancement Elements(Completed by 2020 - exceptions noted)Extend Runway 5-23, including:Extend to 8,700 feetExtend to 9,350 feet Extend to 8,700 feet (Completed by the end of 2015)Realign Off-<strong>Airport</strong> Roadways 1 Fully Relocated Fully Relocated Realigned Main Avenue<strong>Airport</strong> Road <strong>Airport</strong> Road (Completed by the end of 2015)Construct New Integrated Cargo Facility (Site 3) Site 3 Site 3 Split Facility at Site 3Expand Passenger Terminal X X XConstruct New Ground Support EquipmentX X XFacilityConstruct New Belly Cargo Facility X X XConstruct Fuel Farm X X XExpand Automobile Parking Facilities X X XReconfigure Terminal Access Roadways X X XNote: Alternatives B3 North and South were dismissed prior to the environmental analysis in Level 5 Step 3 because they would have substantially similar impacts toAlternatives B2 and B4 but not meet the Purpose and Need as fully as the alternatives with longer Runway 5-23 extensions.X Common program element.1 Runway 16-34 and Runway 5-23 would impact <strong>Airport</strong> Road differently: Runway 16-34 enhancements would result in a partial relocation of the western portion of<strong>Airport</strong> Road north of the Runway 16 End in 2015, whereas Runway 5-23 extension for Alternatives B1 and B2 would result in a full relocation of <strong>Airport</strong> Roadnorth of both Runway ends, connecting from Squantum Drive to Route 37 in 2020. Alternative B4 would not require a full relocation of <strong>Airport</strong> Road.Wetland losses associated with Alternative B1 are substantially greater than for Alternatives B2 and B4.Implementing compensatory wetland mitigation for Alternative B1 would be impracticable because it would bedifficult to acquire the land area necessary to achieve USACE recommended mitigation acreage requirements(47.9 acres for Alternative B1 versus 18.5 acres or 15.1 acres for Alternative B2 or B4, respectively), and becauseof the high land acquisition, construction, and monitoring costs. After investigating wetland mitigationopportunities in the vicinity of the <strong>Airport</strong> it was found that an assemblage of ten or more mitigation siteswould be needed to compensate for wetlands losses associated with Alternative B2 or B4. A compensatorywetland mitigation program for Alternative B1 could require 25 or more sites and several of these sites would ofnecessity be located outside of the project watershed. The analysis further found that the availability ofappropriate mitigation sites in Rhode Island was also limited. This would greatly increase the complexity andcosts of the wetland mitigation program.Chapter 3 – Alternatives Analysis 3-32 July 2011\\mawatr\ev\09228.00\reports\<strong>FEIS</strong>_Final_July_2011\<strong>PVD</strong>_CH03_Alternatives_JUL_2011.doc
T.F. <strong>Green</strong> <strong>Airport</strong> <strong>Improvement</strong> <strong>Program</strong>Environmental Impact Statement and Final Section 4(f) EvaluationIn addition to wetland area, only Alternative B1 extends Runway 5-23 across <strong>Airport</strong> Road and into theheadwaters of Buckeye Brook. Constructing Alternative B1 would result in the loss of 1,793 linear feet of stream(Spring <strong>Green</strong> Brook and portions of Upper Buckeye Brook) that supports an anadromous fish spawning runinto Spring <strong>Green</strong> Pond. Direct impact to this fish run stream is avoided entirely by Alternative B4 and onlyminor impact (142 linear feet of Buckeye Brook would be slightly shifted) by Alternative B2. While it is possibleto design a replacement stream to provide fish passage through Buckeye Brook into Spring <strong>Green</strong> Pond, thisreplacement stream would require extensive and costly excavation and land grading due to the change inelevation between a relocated Spring <strong>Green</strong> Pond outlet and what would be the closest remaining unaltereddownstream reach of Buckeye Brook. Where practicable alternatives exist, federal and state laws andregulations permitting fill of wetlands require an applicant to select an alternative which avoids and minimizesimpacts on wetlands rather than one which proposes to mitigate for greater wetland losses. This is especially thecase when one alternative (Alternative B1) threatens important existing wetland functions and values(i.e., migratory fish passage) which other Build Alternatives avoid.Level 5 screening criteria evaluate the level of environmental impact and the feasibility or practicability of eachalternative, based on the consideration of:• The level of wetland impact both in terms of area and wetland functions and values;• The likely inability to comply with federal and state wetland program regulations to obtain a permit;• The complexity of assembling suitable sites for a compensatory wetland mitigation program; and• The projected land acquisition, construction, and monitoring costs for implementing such a program.By comparing area of wetland and associated wetland services that would be impacted by Alternative B1 witheither Alternative B2 or B4 there is a greater than 60 percent reduction in wetland area impact associated witheither Alternative B2 or B4.3.7.4.2 Socioeconomic ImpactsAlternative B1 would have the greatest impacts to businesses and second greatest impact to jobs throughacquiring 48 businesses and their associated 358 jobs. (In comparison, Alternative B2 would displace45 businesses and 421 jobs and Alternative B4 would displace 10 businesses and 65 jobs.) Alternative B1 wouldhave the greatest impact on the City of Warwick tax base by eliminating $2 million annually, Alternative B2would eliminate $1.5 million annually, and Alternative B4 would eliminate $900,000 annually. Alternative B1would require the most mandatory residential land acquisition (97 units), and when mandatory and voluntaryresidential land acquisition are combined, Alternative B1 would acquire a total of 444 units. Alternative B2would acquire a total of 269 residential units and Alternative B4 would acquire a total of 204 residential units(mandatory and voluntary). When taking tax losses and impacts to businesses, jobs, and residential units intoaccount, Alternative B1 would result in the highest degree of community disruption when compared toAlternatives B2 and B4.Chapter 3 – Alternatives Analysis 3-33 July 2011\\mawatr\ev\09228.00\reports\<strong>FEIS</strong>_Final_July_2011\<strong>PVD</strong>_CH03_Alternatives_JUL_2011.doc
T.F. <strong>Green</strong> <strong>Airport</strong> <strong>Improvement</strong> <strong>Program</strong>Environmental Impact Statement and Final Section 4(f) Evaluation3.7.4.3 Construction CostsAlternatives B1, B2, and B4 would cost between $582 million and $475 million to construct with Alternative B1having the highest and Alternative B4 with the lowest construction costs. Factors contributing to the highconstruction cost of Alternative B1 are Fully Relocated <strong>Airport</strong> Road, the Runway 5-23 extension to 9,350 feet,and extensive land acquisition.3.7.4.4 Summary of Practicability Analysis of Alternative B1Although Alternative B1, with a Runway 5-23 extension to 9,350 feet, most fully meets the Purpose and Need, italso has the greatest impacts to natural resources and the community, and has the highest costs. Mitigation forAlternative B1 adverse environmental impacts would be substantial and likely not possible to mitigate (i.e.,impacts to wetlands).Based on the Level 5 impact analysis of wetlands, Alternative B1 would result in wetland impact more than twoand a half times greater than either Alternative B2 or B4. The selection of Alternative B1 is inconsistent withfederal and state regulations and policies governing federal activities which alter wetlands. It is thereforeunlikely that:• RIDEM would issue a permit for the construction of Alternative B1;• The USACE would identify Alternative B1 as the Least Environmentally Damaging Practicable Alternative(LEDPA); 130 and• Alternative B1 would be found consistent with Executive Order 11990, Protection of Wetlands.Conceptual mitigation opportunities for Alternative B2 and B4 appear practicable. Developing andimplementing a compensatory wetland mitigation program for Alternative B1, even if possible, would besubstantially more costly and difficult to achieve especially given the impact to higher values of wetlands andstreams. Based on these considerations, Alternative B1 is impracticable and is eliminated from furtherconsideration. Therefore, only Alternatives B2 and B4 were carried forward in the Level 6 analysis.3.7.5 Summary of Level 5 ScreeningIn the Level 5 screening, FAA developed and evaluated three alternatives that were modifications of IP Option B (theonly one of the Level 4 Alternatives that would be practicable to construct). Alternative B1 includes an extension ofRunway 5-23 to 9,350 feet. In addition, the FAA evaluated alternatives with Runway 5-23 extensions to 8,700 feet(Alternatives B2 and B4) and 8,300 feet (Alternatives B3 North and South). Alternative B3 North was eliminated inStep 1 of the Level 5 screening because the FAA determined that an 8,300-foot runway would have substantiallysimilar impacts to Alternative B2, but would not meet the Purpose and Need as fully 131 as an alternative with a longerrunway extension and would not be practicable to build based on an evaluation of runway utility.130 The USACE will identify the LEDPA following submission of the Clean Water Act Section 404 permit application. See Chapter 8, Consultation andCoordination, for LEDPA definition.131 Based on an evaluation of passenger penalties that would be required on the aircraft that could be used to offer non-stop West Coast service with runwayimprovements. Aircraft types that are forecast to provide International/Caribbean service would not have the same scale of passenger penalties anticipatedwith the West Coast service.Chapter 3 – Alternatives Analysis 3-34 July 2011\\mawatr\ev\09228.00\reports\<strong>FEIS</strong>_Final_July_2011\<strong>PVD</strong>_CH03_Alternatives_JUL_2011.doc
T.F. <strong>Green</strong> <strong>Airport</strong> <strong>Improvement</strong> <strong>Program</strong>Environmental Impact Statement and Final Section 4(f) EvaluationAs shown in Table 3-7, Alternative B3 South would have substantially similar environmental impacts andconstruction costs as Alternative B4. The physical impacts of construction at the Runway 16, 34, and 23 Endswould be the same as Alternative B4. However, Alternative B4 would realize an additional 400 feet of runwayutility which could accommodate a maximum of approximately 55,000 more potential non-stop West Coastpassengers annually (resulting in $13.7 million more in potential airline revenue annually) than the 8,300-footconfiguration. FAA did not advance Alternative B3 South further in the alternative screening process.As a result of evaluating funding availability, safety enhancements were prioritized over efficiency enhancements.Safety enhancements would be implemented by the end of 2015 whereas efficiency enhancements would beimplemented in 2020 (except in the case of Alternative B4, where the runway extension would also be complete bythe end of 2015). A new roadway element associated with the Runway 16-34 safety enhancements, PartiallyRelocated <strong>Airport</strong> Road, was proposed due to the length of time required to acquire properties associated withFully Relocated <strong>Airport</strong> Road and to limit the period of community disruption also associated with a fullrelocation of <strong>Airport</strong> Road.The FAA evaluated the environmental impacts and construction costs of Alternatives B1, B2, and B4. 132Alternatives B2 and B4 involve mitigatable wetland impacts as well as fewer land acquisitions and lowerconstruction costs compared to Alternative B1 and, therefore, would move forward in the alternatives analysisin the EIS. Table 3-10 summarizes the Level 5 screening.Table 3-10Summary of Level 5 Screening AnalysisResults ofAnalysisRationaleAlternative B1 – 9,350-foot Runway 5-23 Eliminated Not practicable, unmitigatable wetland impacts. Satisfies the Purpose and Need.Alternative B2 – 8,700-foot Runway 5-23 Retained Practicable, minimizes impacts to Buckeye Brook (south and north). Satisfies thePurpose and Need.Alternative B3 North – 8,300-foot Runway 5-23 Eliminated Alternative B3 North has substantially similar impacts to Alternative B2, but doesnot satisfy the Purpose and Need to the same extent as Alternative B2.Alternative B4 – 8,700-foot Runway 5-23 Retained Practicable, avoids impacts to Buckeye Brook (south and north). Satisfies thePurpose and Need.Alternative B3 South – 8,300-foot Runway 5-23 Eliminated Alternative B3 South has substantially similar impacts to Alternative B4, but doesnot satisfy the Purpose and Need to the same extent as Alternative B4.132 The results of this analysis are summarized in Table E.7-8 of DEIS Appendix E, Alternatives Analysis.Chapter 3 – Alternatives Analysis 3-35 July 2011\\mawatr\ev\09228.00\reports\<strong>FEIS</strong>_Final_July_2011\<strong>PVD</strong>_CH03_Alternatives_JUL_2011.doc
T.F. <strong>Green</strong> <strong>Airport</strong> <strong>Improvement</strong> <strong>Program</strong>Environmental Impact Statement and Final Section 4(f) Evaluation3.8 Level 6 Screening – DEIS Final AlternativesThis section contains a summary of the DEIS Level 6 Screening, which includes additional environmentalanalysis of Alternatives B2 and B4 (Chart 3-1). Alternative B4 would have greater aviation benefits, significantlyfewer community impacts, and lower construction costs than Alternative B2.3.8.1 Level 6 Impact AnalysisFollowing the environmental analysis in the Level 5 screening in 2009, the FAA compared the aviation activityforecasts with the 2008 TAF as directed by FAA Order 5050.4B to confirm that the forecast was within 10 to15 percent of the most recent TAF at the time. The FAA performed this comparison due to the longevity of theT.F. <strong>Green</strong> <strong>Airport</strong> <strong>Improvement</strong> <strong>Program</strong> NEPA process and the rapid changes in the aviation industry. TheFAA found that the original 2004 forecast of aircraft operations and passenger enplanements were no longerwithin the FAA consistency criteria. 133 Therefore, the forecast was updated in 2009 to meet FAA requirements.The forecasted base operations without the runway extension would decrease. The forecasted flights associatedwith the runway extension would remain as anticipated in the Level 5 analysis and previous (2004) forecast.Additionally, at the time of the forecast update the FAA released a new version of the noise model (INM 7.0a)and a new version of the air quality model (EDMS version 5.1.2). Because of anticipated changes based on therevised forecast and new versions of the models, the FAA determined it was prudent to revise the Level 5analysis of relevant areas of environmental and social resources. This is documented in the DEIS Level 6Screening.3.8.2 Level 6 Screening – Summary of Environmental ConsequencesThe Level 6 Screening uses the 2009 DEIS Forecast and compares the environmental consequences and benefitsof the No-Action Alternative and Alternatives B2 and B4 for the relevant environmental resource categoriesspecified in FAA Order 1050.1E. DEIS Appendix E, Alternatives Analysis, Section E.8, Level 6 Screening – FinalAlternatives and Selection of the Preferred Alternative, includes a full comparison of the environmental impacts ofthe Level 6 Alternatives B2 and B4, FAA’s identification of Alternative B4 as the Preferred Alternative, andRIAC’s confirmation that Alternative B4 is its Proposed Action.Table 3-11 provides a summary of the Level 6 Alternative B2 and B4 impacts and costs as presented in the DEIS.Section 3.9, <strong>FEIS</strong> Analysis – Final Alternatives, the Preferred Alternative, and the Environmentally PreferableAlternative includes a summary of the <strong>FEIS</strong> analysis, further comparison of Alternatives B2 and B4, and therationale for FAA selecting Alternative B4 as the Preferred Alternative.133 FAA Order 5050.4B states that forecasts should be within 10 percent of the TAF for the 5-year analytical period and within 15 percent for the 10-yearanalytical period.Chapter 3 – Alternatives Analysis 3-36 July 2011\\mawatr\ev\09228.00\reports\<strong>FEIS</strong>_Final_July_2011\<strong>PVD</strong>_CH03_Alternatives_JUL_2011.doc
T.F. <strong>Green</strong> <strong>Airport</strong> <strong>Improvement</strong> <strong>Program</strong>Environmental Impact Statement and Final Section 4(f) EvaluationTable 3-11 DEIS Level 6 Alternatives B2 and B4: Summary of Key Impacts and Costs (2020)Cost/Impact Category Alternative B2 Alternative B4Business Revenue and TaxesBusiness Revenue in the City of Warwick between 2015 and the End of 2020 (gains) $63 million $385 millionBusiness Revenue in Rhode Island between 2015 and the End of 2020 (gains) $136 million $816 millionState Tax Revenue in Rhode Island between 2015 and the End of 2020 (gains) $2 million $13 millionCity of Warwick Tax Base (losses) Annually in 2020 $713,515 $431,072Business ImpactsImpacts to Businesses and Jobs38 businesses and theirassociated 309 jobsResidential ImpactsResidential Land Acquisition (Mandatory due to Construction) 67 units 11 unitsTotal Residential Land Acquisition (Mandatory and Voluntary) 234 units 121 units12 businesses and theirassociated 59 jobsNoise ImpactsExposed to Significant Noise Levels (increase of at least DNL 1.5 dB at or above DNL 65 dB) 1 73 people, 31 units 282 people,120 unitsExposed to Noise Greater than DNL 70 dB 2 73 people, 31 units 35 people, 15 unitsExposed to Noise Between DNL 65 dB and 70 dB 1 2,841 people, 1,209 units 3,074 people, 1,308 unitsChange in Residential Units Exposed to Roadway Traffic Noise Compared to No-Action +56 units -5 unitsWetland Impacts7.5 acres in two wetlandsystems and extendsexisting culvert by 30 linearfeet and shifts 112 linearfeet of Buckeye BrookFloodplain Impacts 3.1 acres 4.7 acres7.3 acres in one wetlandsystem, no impacts toBuckeye BrookHistoric Resources ImpactsHangar No. 1 3 Demolish for safety Demolish for safetyHangar No. 2 (Setting) 3Internal reconfiguration,change in setting, reductionin viewsInternal reconfiguration,no adverse effect andde minimis useRhode Island State <strong>Airport</strong> Terminal (Setting and Landscaping) 4Eligible <strong>Airport</strong> Historic District 3Impact on setting andlandscaping throughreduction in viewsAlter historical configurationof airfield and removeReduction in views, directimpact to landscapingHangar No. 1 Hangar No. 1Alter historical configurationof airfield and removeConstruction and Preliminary Mitigation Costs 5 $530 million $445 millionNotes: This table summarizes the key differences between Alternatives B2 and B4 using the 2009 DEIS Forecast. DEIS Chapter 5, Environmental Consequences,documents the significant impacts of each alternative and compares them to the No-Action Alternative.1 Properties would be eligible for sound insulation.2 Properties would be eligible for acquisition under a voluntary land acquisition program. Under Alternative B2, one additional unit would be eligible to be acquired fornoise mitigation beginning in 2020 as it would be indirectly affected. Under Alternative B4, three additional units would be eligible to be acquired for noise mitigationbeginning in 2020 as they would be indirectly affected. These units would not be directly impacted by Project-related noise levels at or above the DNL 70 dB.3 Eligible for listing on the National Register of Historic Places.4 Listed on the National Register of Historic Places.5 Construction and preliminary mitigation costs are lower than Level 5 Alternatives B2 and B4 due to reduced project-related voluntary land acquisition mitigationfor noise impacts.Chapter 3 – Alternatives Analysis 3-37 July 2011\\mawatr\ev\09228.00\reports\<strong>FEIS</strong>_Final_July_2011\<strong>PVD</strong>_CH03_Alternatives_JUL_2011.doc
T.F. <strong>Green</strong> <strong>Airport</strong> <strong>Improvement</strong> <strong>Program</strong>Environmental Impact Statement and Final Section 4(f) Evaluation3.9 <strong>FEIS</strong> Analysis – Final Alternatives, the Preferred Alternative, and theEnvironmentally Preferable AlternativeThis section contains a summary of the <strong>FEIS</strong> analysis, which includes additional environmental assessment ofAlternatives B2 and B4 with the 2010 <strong>FEIS</strong> Forecast (Chart 3-1). Alternative B4 would have greater aviationbenefits, substantially fewer mandatory land acquisition impacts, lower wetland impacts, and lowerconstruction costs than Alternative B2.3.9.1 Final AlternativesThis section describes the alternatives undergoing detailed analysis in the <strong>FEIS</strong>. These include Alternative B2,Alternative B4, and the No-Action Alternative. The conceptual design of the <strong>FEIS</strong> Alternatives was the same asthe alternatives in the DEIS except for modifications on the Runway 34 End to minimize wetland impacts.Alternative B2Alternative B2 (Figure 3-6) was developed to avoid impacts to Main Avenue and minimize impacts to naturalresources and residential communities south and north of the <strong>Airport</strong>. Runway 5-23 would be extendedapproximately 600 feet north and 930 feet south for a total of 8,700 feet. The Runway 16-34 safety enhancements,Partially Relocated <strong>Airport</strong> Road, Fully Relocated <strong>Airport</strong> Road with associated enhancements toWarwick Avenue, and the Integrated Cargo Facility would be the same as Alternative B1. EMAS would be usedon the Runway 23, 5, and 34 Ends.The construction of Alternative B2 would be phased so that the safety enhancements associated withRunway 16-34 would be completed by the end of 2015, while the efficiency enhancements, including theextension of Runway 5-23, would be completed by 2020. As described above, the elements expected to becompleted by the end of 2015 include:• Runway 16-34 safety areas, taxiways and aprons, navigational aids and lighting, the Runway 16-34Perimeter Road, drainage and utilities, necessary land acquisition, Delivery Drive relocation, and PartiallyRelocated <strong>Airport</strong> Road (to accommodate the Runway 16 End enhancements), including drainage andutilities and necessary land acquisition;• Taxiway C Relocation; and• Hangar No. 1 Demolition.The elements expected to be completed by 2020 include:• Runway 5-23 extension and safety areas, taxiways and aprons, navigational aids and lighting, theRunway 5-23 Perimeter Road, drainage and utilities, necessary land acquisition, and Fully Relocated<strong>Airport</strong> Road (to accommodate the Runway 5-23 extension), including drainage and utilities and necessaryland acquisition;• Runway 5-23 and 16-34 reconstruction and repaving; andChapter 3 – Alternatives Analysis 3-38 July 2011\\mawatr\ev\09228.00\reports\<strong>FEIS</strong>_Final_July_2011\<strong>PVD</strong>_CH03_Alternatives_JUL_2011.doc
T.F. <strong>Green</strong> <strong>Airport</strong> <strong>Improvement</strong> <strong>Program</strong>Environmental Impact Statement and Final Section 4(f) Evaluation• Expanded passenger terminal and gates; new GSE facility; new belly cargo facility; new fuel farm; newIntegrated Cargo Facility; expanded auto parking facilities; and reconfigured terminal access roadways.Alternative B4Section 3.7.3, Level 5 Screening Step 3 - Development of Alternative B4 and B3 South, provides more detail on therationale for developing Alternative B4. Alternative B4 (Figure 3-6) would have fewer mandatory land acquisitionsand reduced construction costs when compared to Alternative B2. Because of the reduced costs, the safety projectsand the extension of Runway 5-23 would be phased so that work can be completed by the end of 2015.Alternative B4 would extend Runway 5-23 south approximately 1,530 feet for a total of 8,700 feet by the end of2015. Alternative B4 shifts Runway 16-34 north approximately 100 feet to accommodate the enhanced RSAs andminimizes impacts to businesses on the Runway 16 End and impacts to natural resources on the Runway 34End. The Runway 16-34 safety enhancements would require a partial relocation of <strong>Airport</strong> Road at theintersection of Post Road and <strong>Airport</strong> Road. <strong>Airport</strong> Road would be partially relocated to the north by the endof 2015. Main Avenue would be shifted to the south at the Runway 5 End by the end of 2015. EMAS would beused on the Runway 5, 16, and 34 Ends. The Integrated Cargo Facility would consist of a split operation in thevicinity of Site 3 including the existing Hangar No. 2, where cargo operations currently are housed, and a newcargo building east of the Runway 16 End.In order to meet the FAA’s deadline that all RSAs be brought up to standard by 2015, as well as to addresscommunity concerns about which houses would be acquired, RIAC is considering ways to move certainprogram elements forward. An expedited schedule is only possible for Alternative B4 because the number ofparcels required for mandatory land acquisition for construction is substantially less than the number of parcelsthat would be required to construct Alternative B2. For Alternative B4 only, it is assumed that constructionwould be phased so that the safety enhancements associated with Runway 16-34 and the Runway 5-23extension would be completed by the end of 2015. Specifically, those elements expected to be completed by theend of 2015 include:• Runway 16-34 safety areas, taxiways, navigational aids and lighting, the Runway 16-34 Perimeter Road,drainage and utilities, land acquisition required for construction, Delivery Drive relocation, and PartiallyRelocated <strong>Airport</strong> Road (to accommodate the Runway 16 End Enhancements), including drainage andutilities and land acquisition required for construction;• Taxiway C Relocation;• Hangar No. 1 demolition; and• Runway 5-23 extension and safety areas, taxiways and aprons, navigational aids and lighting, theRunway 5-23 Perimeter Road, drainage and utilities, land acquisition required for construction, andRealigned Main Avenue (to accommodate lengthening at the Runway 5 End), including drainage andutilities and land acquisition required for construction.The Runway 5-23 and Runway 16-34 reconstruction and repaving and the remaining efficiency enhancementelements should be completed by 2020, including the expanded passenger terminal and gates; new GSE facility;Chapter 3 – Alternatives Analysis 3-39 July 2011\\mawatr\ev\09228.00\reports\<strong>FEIS</strong>_Final_July_2011\<strong>PVD</strong>_CH03_Alternatives_JUL_2011.doc
T.F. <strong>Green</strong> <strong>Airport</strong> <strong>Improvement</strong> <strong>Program</strong>Environmental Impact Statement and Final Section 4(f) Evaluationnew belly cargo facility; new fuel farm; new Integrated Cargo Facility; expanded auto parking facilities; andreconfigured terminal access roadways.No-Action AlternativeThe future No-Action Alternative (Figure 3-5) provides a base scenario for assessing the impacts of theBuild Alternatives being considered. The No-Action Alternative comprises any and all actions that RIACintends to complete, that are independent of the T.F. <strong>Green</strong> <strong>Airport</strong> <strong>Improvement</strong> <strong>Program</strong>, and that would beundertaken whether or not the <strong>Improvement</strong> <strong>Program</strong> moves forward. The No-Action Alternative assumes thatperiodic maintenance and minor modifications needed to maintain safe operations at T.F. <strong>Green</strong> <strong>Airport</strong> wouldbe undertaken. Other planned actions within or near T.F. <strong>Green</strong> <strong>Airport</strong>, by RIAC and by other parties, wouldbe assumed to have occurred prior to constructing the first phase of the <strong>Improvement</strong> <strong>Program</strong> (2015).Figure 3-5 identifies the No-Action <strong>Airport</strong> projects that would change the physical footprint of the <strong>Airport</strong>.These include the following projects:• Airfield Maintenance Facility (AMF) and access roadway (completed 2007)• Full-length parallel Taxiway M supporting Runway 5-23 (completed 2008)• New Deicer Management System on-<strong>Airport</strong> (to be completed by 2015)• Removal of the Winslow Park facilities within the Runway 5 End RPZ• Land acquisition under the Completed and Current Part 150 VLAP• InterLink (completed 2010)3.9.2 <strong>FEIS</strong> Impact AnalysisFollowing the issuance of the DEIS in July 2010, the FAA monitored aviation activity and determined that actualand forecasted operations and passenger levels continued to decline at T.F. <strong>Green</strong> <strong>Airport</strong>. It then compared theDEIS aviation activity forecasts with the Draft 2010 TAF for reasonable consistency This check was performeddue to the rapid changes in the aviation industry. The FAA determined that while the changes did not affect theproject purpose and need, the DEIS forecast was not within the percentage difference criteria. Rather thanresolve the differences FAA updated the forecast. 134 Therefore, the <strong>FEIS</strong> was revised analysis using a No-ActionAlternative forecast based on the Draft TAF (October 2010; see Appendix E.1, Updated Forecast of Aviation Activity) ,which was the latest forecast information available at the time the <strong>FEIS</strong> analysis was performed and was consideredto reflect the recent aviation trends. 135Under this update, the forecasted base operations without the runway extension would decrease. The forecastedflights associated with the runway extension would remain as anticipated in the DEIS. Additionally, at the time ofthe forecast update the FAA released a new version of the noise model (INM 7.0b). Because of anticipated changesbased on the revised forecast and a new version of the model, the FAA determined it was prudent to revise theanalysis of relevant areas of environmental and social resources and report on the new analysis in the <strong>FEIS</strong>.134 FAA Order 5050.4B and the FAA Master Plan Advisory Circular 150/5070-6B, state that EIS forecasts should be reasonably consistent with the FAA’s TAF.This is defined as within 10 percent of the TAF for the 5-year analytical period and within 15 percent for the 10-year analytical period. Forecasts not meetingthese criteria require consultation to resolve differences135 The Final 2010 TAF became available during the latter stages of the <strong>FEIS</strong> analysis, and differed from the Draft 2010 with lower short-term forecasts.However, FAA evaluated the most recent aviation activity counts recorded by the Air Traffic Control Tower, which were consistent with the Draft 2010 TAF(see Appendix E.1, Updated Forecast of Aviation Activity).Chapter 3 – Alternatives Analysis 3-40 July 2011\\mawatr\ev\09228.00\reports\<strong>FEIS</strong>_Final_July_2011\<strong>PVD</strong>_CH03_Alternatives_JUL_2011.doc
T.F. <strong>Green</strong> <strong>Airport</strong> <strong>Improvement</strong> <strong>Program</strong>Environmental Impact Statement and Final Section 4(f) EvaluationThe methodology used to adjust the <strong>FEIS</strong> Forecast considered changes in the individual aircraft operatorcategories within the TAF. The TAF is broken down into the following aircraft operator groups; 136 Air Carrier,Air Taxi, General Aviation, and Military (see Appendix E.1, Updated Forecast of Aviation Activity). Therefore, theforecast adjustments accounted for changing percentages of aircraft operator categories at T.F. <strong>Green</strong> <strong>Airport</strong>over time. Due to the refined adjustment method to take into account aircraft operator category variations, thedifference in total aircraft operations between the Draft 2010 TAF and the 2010 <strong>FEIS</strong> No-Action Forecast isconsistent with FAA criteria.Since the DEIS, the FAA identified further wetland impact avoidance and minimization opportunities andmodified the design at the Runway 34 End. Impacts to wetlands were avoided by re-examining the location ofthe Perimeter Road on the east side of Runway 34 along with the design requirements for the end-fire glideslope antenna; 137 a critical part of the system that allows aircraft to make instrument landings on the runway.Runway 34 is equipped with an end-fire antenna. The imaging type glide slope, which is used at the other threerunways at the <strong>Airport</strong>, has specific site requirements reflected in the previous glide slope area grading designfor Runway 34. Due to the use of an end-fire system at Runway 34, the side slopes along the runway can besteepened beginning at the edge of the RSA. This in turn allowed the Perimeter Road to be shifted closer to theside of Runway 34. This shift brought the Perimeter Road within the glide slope antenna signal zone so the roadwas lowered to prevent vehicles from interfering with the signal. The minimization measures incorporated inthe Runway 34 design presented in this <strong>FEIS</strong> involved steepening the side slopes adjacent to wetlands from theprevious 4:1 gradient to the present 3:1 slopes. This resulted in a further reduction of wetland impact.3.9.3 <strong>FEIS</strong> – Summary of Environmental ConsequencesThis section summarizes and compares the environmental consequences and benefits of the No-Action Alternativeand Alternatives B2 and B4 for the relevant environmental resource categories specified in FAA Order 1050.1E.The environmental impacts described below inform the FAA in its identification of the Preferred Alternative.This section includes a discussion of the environmental impacts of Alternatives B2 and B4; any adverseenvironmental effects that cannot be avoided; the relationship between short-term uses of the human environmentand the maintenance and enhancement of long-term productivity; and any irreversible or irretrievablecommitments of resources that would be involved if the T.F. <strong>Green</strong> <strong>Airport</strong> <strong>Improvement</strong> <strong>Program</strong> isimplemented. Alternatives B2 and B4 would have significant impacts (as significance is defined by FAA) to noise,compatible land use, historical resources, Section 4(f) resources, wetlands, and floodplains. Table 3-12 and thefollowing discussion focuses only on the environmental impacts and program characteristics that differentiate thealternatives from each other and provide a basis for identifying the Preferred Alternative. 138 Some impacts listed inthis section, such as wetlands and floodplains, have been reduced since the DEIS was filed as described inSection 3.9.2, <strong>FEIS</strong> Impact Analysis. A comparison of the <strong>FEIS</strong> and DEIS Level 6 findings is provided in Table 3-13.136 FAA Order JO 7210.3V Change 3 effective Aug 27, 2009 Facility Operation and Administration, Chapter 12, section 12-2-2, Categories of Operations, andAppendix 3.137 The end-fire system is a non-image system, and is designed for use in areas where conformance to the imaging type glide slope criteria is impractical. Endfireantenna systems are intended for runways having a limited amount of flat terrain.138 It would be possible to combine Alternative B2 Runway 5-23 configuration with the Alternative B4 Runway 16-34 configuration, however, this combinationwould still require the partial and full relocations of <strong>Airport</strong> Road. It would be possible to combine the Alternative B2 Runway 16-34 configuration with theAlternative B4 Runway 5-23 configuration, however, this combination would still require the relocation of Main Avenue and partial relocation of <strong>Airport</strong> Road,and would negatively impact <strong>Airport</strong> Plaza and the rental car property north of the intersection of <strong>Airport</strong> and Post Roads.Chapter 3 – Alternatives Analysis 3-41 July 2011\\mawatr\ev\09228.00\reports\<strong>FEIS</strong>_Final_July_2011\<strong>PVD</strong>_CH03_Alternatives_JUL_2011.doc
T.F. <strong>Green</strong> <strong>Airport</strong> <strong>Improvement</strong> <strong>Program</strong>Environmental Impact Statement and Final Section 4(f) EvaluationTable 3-12 <strong>FEIS</strong> Alternatives B2 and B4: Summary of Key Impacts, Revenues, and Costs (2020)Cost/Impact Category Alternative B2 Alternative B4Business Revenue and TaxesBusiness Revenue in the City of Warwick between 2015 and the End of 2020 (gains) $63 million $385 millionBusiness Revenue in Rhode Island between 2015 and the End of 2020 (gains) $136 million $816 millionState Tax Revenue in Rhode Island between 2015 and the End of 2020 (gains) $2 million $13 millionCity of Warwick Tax Base (losses) Annually in 2020 $1,173,997 $567,521Business ImpactsImpacts to Businesses and Jobs38 businesses and theirassociated 309 jobsResidential ImpactsResidential Land Acquisition (Mandatory due to Construction) 67 units 11 unitsTotal Residential Land Acquisition (Mandatory and Voluntary) 237 units 140 units12 businesses and theirassociated 59 jobsNoise ImpactsExposed to Significant Noise Levels174 people, 74 units 409 people,174 units(increase of at least DNL 1.5 dB at or above DNL 65 dB) 1Exposed to Noise Greater than DNL 70 dB 2 35 people, 15 units 47 people, 20 unitsExposed to Noise Between DNL 65 dB and 70 dB 1 2,432 people, 1,035 units 2,632 people, 1,120 unitsChange in Residential Units Exposed to Roadway Traffic Noise Compared to No-Action +102 units 0 unitsWetland Impacts5.8 acres in three areas andextends the existing BuckeyeBrook culvert at Lakeshore Driveby 30 linear feet and shifts andadditional 112 linear feet BuckeyeBrook stream channel.Floodplain Impacts 0.5 acres 2.3 acres5.0 acres at the Runway 34 Endwith no impacts to Buckeye BrookHistoric Resources ImpactsHangar No. 1 3 Demolish for safety Demolish for safetyHangar No. 2 (Setting) 3Rhode Island State <strong>Airport</strong> Terminal 4Eligible <strong>Airport</strong> Historic District 3Internal reconfiguration, change insetting, reduction in viewsChange in setting throughreduction in viewsAlter historical configuration ofairfield and remove Hangar No. 1Internal reconfiguration,no adverse effect and de minimisuseReduction in views, direct impactto landscapingAlter historical configuration ofairfield and remove Hangar No. 1Construction and Preliminary Mitigation Costs 5 $516 million $439 millionNotes: This table summarizes the key differences between Alternatives B2 and B4. Chapter 5, Environmental Consequences, documents the significant impacts of eachalternative and compares them to the No-Action Alternative. Some impacts listed in this section, such as wetlands and floodplains, have been reduced since the DEIS wasfiled as described in Section 3.9.2, <strong>FEIS</strong> Impact Analysis.1 Properties would be eligible for sound insulation.2 Properties would be eligible for acquisition under a voluntary land acquisition program. Under Alternative B2, sixteen additional units (fifteen additional parcels) would beeligible to be acquired for noise mitigation beginning in 2020 as they would be indirectly affected. Under Alternative B4, thirty-five additional units (thirty-six additionalparcels) would be eligible to be acquired for noise mitigation beginning in 2020 as they would be indirectly affected. These units would not be directly impacted byProject-related noise levels at or above the DNL 70 dB.3 Eligible for listing on the National Register of Historic Places.4 Listed on the National Register of Historic Places.5 Construction and preliminary mitigation costs are greater than Level 6 Alternatives B2 and B4 in the DEIS due to increased voluntary land acquisition mitigation areas fornoise impacts.Chapter 3 – Alternatives Analysis 3-42 July 2011\\mawatr\ev\09228.00\reports\<strong>FEIS</strong>_Final_July_2011\<strong>PVD</strong>_CH03_Alternatives_JUL_2011.doc
T.F. <strong>Green</strong> <strong>Airport</strong> <strong>Improvement</strong> <strong>Program</strong>Environmental Impact Statement and Final Section 4(f) Evaluation3.9.3.1 Socioeconomic ImpactsAs documented in Chapter 5, Environmental Consequences, neither Alternative B2 nor B4 would result insignificant adverse socioeconomic impacts. Economic benefits would be derived from on-<strong>Airport</strong> businessactivities, increased visitor spending, and development of spin-off <strong>Airport</strong>-related businesses as a result of theT.F. <strong>Green</strong> <strong>Airport</strong> <strong>Improvement</strong> <strong>Program</strong>. The Runway 5-23 extension for Alternative B4 would be completedfive years in advance of Alternative B2, which would result in 80 percent greater economic gains between 2015and the end of 2020 than Alternative B2 because of the expedited construction schedule. Potential economicgains for Alternative B4 between 2015 and the end of 2020 would total $385 million in business revenues in theCity of Warwick and $816 million for the State of Rhode Island, and $13 million in state tax revenue (sales andincome taxes). This is before Alternatives B2 would begin to generate economic gains due to the runwayextension. By the end of 2020, Alternative B2, potential economic gains would total $63 million in businessrevenues in the City of Warwick and $136 million for the State of Rhode Island, and $2 million in state taxrevenue (sales and income taxes) due to the runway extension being completed by the year 2020.Alternatives B2 and B4 would realize the same projected increases in operations, passengers, and cargo activitydue to extending Runway 5-23 to 8,700 feet. By 2020, each would result in the same anticipated number ofadditional jobs within the City of Warwick and the state, the same increases to personal income and businessrevenue, and the same gains in state sales and income taxes.Alternatives B2 and B4 would impact the City of Warwick tax base annually in 2020 (losses in commercial andresidential property taxes) by $1,173,997 and $567,521, respectively starting in 2020 due to land acquisition(mandatory and voluntary). These losses in property tax revenue represent less than one percent of the City orWarwick’s tax base for 2010 ($204,173,339). Alternative B2 has the greater impacts to businesses and jobsthrough acquiring 38 businesses and their associated loss of 309 jobs. Alternative B4 would impact 12 businessesand their associated 59 jobs.The Alternative B2 Runway 16 End configuration would severely compromise the functioning of the rental carprocessing and maintenance facility east of Post Road, would eliminate the entire <strong>Airport</strong> Plaza shopping centeron the corner of Post Road and <strong>Airport</strong> Road including 23 <strong>Airport</strong> Plaza businesses, and would eliminate otherbusinesses in the vicinity of the Runway 16 End. Altogether, 32 businesses on the Runway 16 End would beacquired. In comparison, the Alternative B4 RSA projects and Partially Relocated <strong>Airport</strong> Road would impact12 businesses. Alternative B2 would require a larger number of mandatory residential land acquisitions(67 units) compared to only 11 units for Alternative B4. Mandatory and voluntary residential land acquisitions,when combined, would total 237 units for Alternative B2 and 140 units for Alternative B4.Fully Relocated <strong>Airport</strong> Road would accommodate the Alternative B2 efficiency enhancement projects andimprove traffic flow, but it would also cause significant impacts to the residential community north of theairport. Between 2015 and 2020, RIAC would have to acquire 66 residential units and four businesses toconstruct Fully Relocated <strong>Airport</strong> Road. The land acquisition for the construction of the road would causefragmentation of the Spring <strong>Green</strong> Neighborhood and significant community disruption. Fully Relocated<strong>Airport</strong> Road would also reduce the Farmland of Statewide Importance north of <strong>Airport</strong> Road by overChapter 3 – Alternatives Analysis 3-43 July 2011\\mawatr\ev\09228.00\reports\<strong>FEIS</strong>_Final_July_2011\<strong>PVD</strong>_CH03_Alternatives_JUL_2011.doc
T.F. <strong>Green</strong> <strong>Airport</strong> <strong>Improvement</strong> <strong>Program</strong>Environmental Impact Statement and Final Section 4(f) Evaluation50 percent. The land acquisition for this program element would remove $233,544 annually from the City ofWarwick property tax base.The construction costs for Fully Relocated <strong>Airport</strong> Road exceed $50 million, which is 10 percent of the total costsfor Alternative B2. Approximately $17 million would go toward land acquisition of the 66 residential units thatwould need to be acquired for the roadway to be constructed. Under Alternative B2, 99 percent of the totalmandatory acquisition of residential units would be due to Fully Relocated <strong>Airport</strong> Road. In contrast, theMain Avenue realignment for Alternative B4 would cost approximately $8 million for land acquisition andconstruction, approximately two percent of the total costs for Alternative B4.3.9.3.2 Noise ImpactsAlternatives B2 and B4 would result in significant noise impacts as defined by FAA Order 1050.1E (increase of atleast DNL 1.5 dB at or above DNL 65 dB). (Chapter 4, Affected Environment, Section 4.2.1, Methodology, provides abackground on noise terminology.) Those housing units exposed to significant noise levels would be eligible fornoise mitigation. As shown in Table 3-12, under Alternative B2, in 2020, 74 housing units (an estimated 174 people)between the DNL 65 and 70 dB contour intervals are projected to experience a significant increase in noise levels(increase of at least DNL 1.5 dB at or above DNL 65 dB) and none would experience a slight to moderate increase(DNL 3.0 dB or more between DNL 60 dB and 65 dB noise levels). In 2025, 49 housing units (an estimated115 people) located between the DNL 65 and 70 dB contours are projected to experience a significant increase innoise levels and none would experience a slight to moderate increase under Alternative B2.Under Alternative B4 in 2015, 432 people and 184 housing units are projected to experience a significant increase innoise levels (increase of at least DNL 1.5 dB at or above DNL 65 dB) and none would experience a slight to moderateincrease (DNL 3.0 dB or more between DNL 60 dB and 65 dB noise levels). In 2020, under Alternative B4, 174 housingunits (an estimate of 409 people) within the DNL 65 and 70 dB contour intervals are projected to experience asignificant increase in noise levels (increase of at least DNL 1.5 dB at or above DNL 65 dB) and none wouldexperience a slight to moderate increase (DNL 3.0 dB or more between DNL 60 dB and 65 dB noise levels). In 2025,108 housing units (an estimated 254 people) between DNL 65 to 70 dB contour intervals are projected to experience asignificant increase and none would experience a slight to moderate increase. 139Alternative B4 would expose a greater number of housing units to aircraft noise levels greater than DNL 70 dBthan Alternative B2 (20 units for Alternative B4 and 15 units for Alternative B2) in 2020. 140 Under Alternative B4,69 residential units would be eligible for acquisition through voluntary participation in a FAA-required noisemitigation land acquisition program and 41 residential units would be eligible under Alternative B2. AlternativeB4 would have the greater number of housing units exposed to sound levels greater than DNL 65 dB, for whichsound insulation mitigation would be available (1,050 for Alternative B2 and 1,140 for Alternative B4). Theprimary reason for the greater noise impacts within DNL 65 dB for Alternative B4 is that the Runway 23 EndRPZ would not be cleared. Alternative B2 could result in 100 units within the Runway 23 RPZ being eligible foracquisition. Alternative B2 would expose 50 more housing units to traffic noise than Alternative B4 due to the139 The FAA reanalyzed Alternative B3 South with a Runway 5-23 extension to 8,300 feet under the <strong>FEIS</strong> forecast conditions and determined that the potentialfor significant noise impacts were substantially the same as Alternative B4. Wetland, floodplain, Section 4(f), and historic resource impacts would be thesame for Alternatives B4 and B3 South. FAA confirmed the dismissal of Alternative B3 South under the <strong>FEIS</strong> conditions.140 The Current Part 150 VLAP has acquired many properties that would have been impacted by Alternative B2.Chapter 3 – Alternatives Analysis 3-44 July 2011\\mawatr\ev\09228.00\reports\<strong>FEIS</strong>_Final_July_2011\<strong>PVD</strong>_CH03_Alternatives_JUL_2011.doc
T.F. <strong>Green</strong> <strong>Airport</strong> <strong>Improvement</strong> <strong>Program</strong>Environmental Impact Statement and Final Section 4(f) Evaluationalignment of Fully Relocated <strong>Airport</strong> Road. The Alternative B2 Fully Relocated <strong>Airport</strong> Road would bisect thedensely residential Spring <strong>Green</strong> Neighborhood.3.9.3.3 Wetland and Floodplain ImpactsAs shown in Table 3-12, Alternatives B2 and B4 would result in significant wetland and floodplain impacts.Alternative B2 would impact a total of 5.8 acres of wetlands, with impacts on the Runway 23 End andRunway 34 End. Alternative B4 has fewer acres of wetland impacts (5.0 acres) than Alternative B2 and limits thewetland impacts to the Runway 34 End only. Alternative B2 would result in a smaller area of floodplain loss (0.5acres) compared to Alternative B4 at 2.3 acres of floodplain impact. All floodplain impacts underAlternatives B2 and B4 could be mitigated.3.9.3.4 Surface Transportation ImpactsNeither Alternative B2 nor B4 would result in significant surface transportation impacts. Under Alternative B2,traffic operations are expected to improve relative to the No-Action Alternative at six intersections in 2020. TheFully Relocated <strong>Airport</strong> Road would provide a better east-west connection through the City, but would requirethat 66 residential units be acquired and cause significant impacts and fragmentation to the Spring <strong>Green</strong>Neighborhood. Under Alternative B4, traffic operations are expected to improve relative to the No-ActionAlternative at eight intersections in 2020. Under Alternative B4, four intersections in 2020 that are projected tooperate at poor traffic conditions under the No-Action Alternative would remain at capacity. Alternative B4does not degrade the level of service at these intersections, but it also does not realize the benefit of regionaltraffic shifts away from the local roadway system that Alternative B2 offers. These shifts cannot occur withoutFully Relocated <strong>Airport</strong> Road.3.9.3.5 Historical Resources and Section 4(f) Resources ImpactsAlternatives B2 and B4 would result in significant historical resources and Section 4(f) resources impacts. Threehistorical properties within the Area of Potential Effect would be impacted including Hangar No. 1,Hangar No. 2, and the Rhode Island State <strong>Airport</strong> Terminal. Each of these properties is a part of the eligibleairport historic district on-<strong>Airport</strong> property. Therefore, an adverse effect to any of these historical propertiesconstitutes an adverse effect to the eligible airport historic district as well. Alternatives B2 and B4 require theremoval of Hangar No. 1 to enhance safety, resulting in an adverse effect to and a Section 4(f) use ofHangar No. 1 and the eligible airport historic district. Alternative B2 would result in a Section 4(f) use ofHangar No. 2 and an adverse effect because the Fully Relocated <strong>Airport</strong> Road would limit the public view andaccess to Hangar No. 2. Both Alternatives B2 and B4 would have minor physical impacts on Hangar No. 2, butwould not adversely affect this resource. Alternative B2 would also result in a Section 4(f) use of Rhode IslandState <strong>Airport</strong> Terminal as a result of the relocation of <strong>Airport</strong> Road to the north, which would affect the historicvantage point of the terminal building and constitute an additional adverse effect. Alternative B4 would have adirect impact on the landscaping along <strong>Airport</strong> Road that is associated with the Rhode Island State <strong>Airport</strong>Terminal resulting in an adverse effect and a Section 4(f) use of this historical property. In addition, underAlternative B4, the split Integrated Cargo Facility would block the public view and access to the Terminal from<strong>Airport</strong> Road. Both Alternatives B2 and B4 would result in a physical use of Winslow Park. Impacts to WinslowPark can be mitigated under both Alternatives B2 and B4 through the replacement of impacted park facilities ata different location.Chapter 3 – Alternatives Analysis 3-45 July 2011\\mawatr\ev\09228.00\reports\<strong>FEIS</strong>_Final_July_2011\<strong>PVD</strong>_CH03_Alternatives_JUL_2011.doc
T.F. <strong>Green</strong> <strong>Airport</strong> <strong>Improvement</strong> <strong>Program</strong>Environmental Impact Statement and Final Section 4(f) EvaluationArchaeological investigations at Warwick Historical Cemetery (WHC) 26, 76, 77, and 78 were completed inApril 2011. The boundaries of WHC 26 and 76 were determined, and the boundaries of WHC 77 and 78 havenot been confirmed. 141 The results of these surveys will assist FAA and RIAC in further consultation with theWarwick Historical Cemetery Commission and the Narragansett Indian Tribe relative to potential impactsresulting from the T.F. <strong>Green</strong> <strong>Airport</strong> <strong>Improvement</strong> <strong>Program</strong> in accordance with Section 106 of the NationalHistoric Preservation Act, as amended, Rhode Island General Law 23-18-1 et seq., and Chapter 12 of the Code ofOrdinances of the City of Warwick.Both Alternatives B2 and B4 would encroach on WHC 26 (located at the Runway 5 End), and the Alternative B4Main Avenue Realignment would also encroach on the 25-foot buffer surrounding WHC 77 (located onresidential property south of Main Avenue). The survey revealed that there are no unmarked graves betweenthe boundary of WHC 77 and Main Avenue. Neither cemetery (WHC 26 nor 77) is eligible for the NationalRegister of Historic Places but they are protected under Rhode Island General Law 23-18-1 et seq., andChapter 12 of the Code of Ordinances of the City of Warwick.WHC 76 is contained within the iron fence that currently defines the cemetery. If the adjacent property isacquired under the Part 150 VLAP and the building is demolished, RIAC will consult with the WarwickHistorical Cemetery Commission and the Narragansett Indian Tribe as the potential impacts will fall within the25-foot buffer.The survey at WHC 78 identified several locations that could be unmarked burials. The presence of unmarkedburials could be confirmed through subsurface investigations if such investigations are approved by propertyowners. Impacts near WHC 78 due to the Alternative B4 Realigned Main Avenue will be within the existingnorthern limits of Main Avenue and therefore may only fall within the 25-foot buffer around the currentlyestablished buffer. Further subsurface investigations may be required and the boundary may require revision.3.9.3.6 Construction Costs and PhasingThe construction and land acquisition costs for Alternatives B2 and B4 are approximately $516 million forAlternative B2 and $439 million for Alternative B4. Construction and land acquisition costs associated withFully Relocated <strong>Airport</strong> Road (Alternative B2) alone are anticipated to be over $50 million (see Table 3-12).Alternative B2 has substantially higher construction costs (an additional $77 million) and greater impacts tocommunity resources (i.e., disruption to community, mandatory relocation of businesses, and mandatoryrelocation of residences) than Alternative B4, but Alternative B2 would improve east-west traffic flow throughthe full relocation of <strong>Airport</strong> Road. Alternative B4 has less impact to wetlands, is less disruptive to residentialproperties and businesses, and has substantially lower construction costs than Alternative B2.Alternative B2 PhasingAlternative B2 safety projects including land acquisition and associated enabling projects would all becompleted by the end of 2015. Land acquisition for Fully Relocated <strong>Airport</strong> Road and the Runway 5-23141 The exact boundaries of WHC 77 and 78 are not confirmed because permission has not been granted to strip top soils around the perimeter of visibleheadstones at these cemeteries. At this time the unconfirmed boundary for WHC 78 is the limits of the designated cemetery lot.Chapter 3 – Alternatives Analysis 3-46 July 2011\\mawatr\ev\09228.00\reports\<strong>FEIS</strong>_Final_July_2011\<strong>PVD</strong>_CH03_Alternatives_JUL_2011.doc
T.F. <strong>Green</strong> <strong>Airport</strong> <strong>Improvement</strong> <strong>Program</strong>Environmental Impact Statement and Final Section 4(f) Evaluationextension would begin in 2015. The land acquisition would be completed and construction would begin in 2017.Between 2017 and 2020, RIAC would construct the efficiency projects including: Runway 5-23 extension andsafety areas, taxiways and aprons, navigational aids and lighting, the Runway 5-23 Perimeter Road, anddrainage and utilities; Fully Relocated <strong>Airport</strong> Road including drainage and utilities; and expanded passengerterminal and gates; new GSE facility; new belly cargo facility; new fuel farm; new Integrated Cargo Facility;expanded auto parking facilities; and reconfigured terminal access roadways.Alternative B4 PhasingFor Alternative B4, safety projects including land acquisition and enabling would, as in Alternative B2, all becompleted by the end of 2015 (see Figures 3-10 through 3-14). Land acquisition for the Runway 5-23 extensionand Realigned Main Avenue would completed by 2014; construction of the Runway 5-23 extension and safetyareas, taxiways and reconfigured aprons, navigational aids and lighting, the Runway 5-23 Perimeter Road, anddrainage and utilities work would be completed by the end of 2015. Between 2016 and 2020 RIAC wouldconstruct the expanded passenger terminal and gates, new GSE facility, new belly cargo facility, new fuel farm,new Integrated Cargo Facility, expanded auto parking facilities, and reconfigured terminal access roadways.Table 3-13 compares the impacts and costs of Alternative B4 as reported in the DEIS and this <strong>FEIS</strong>. As describedabove, the impacts changed between the DEIS and the <strong>FEIS</strong> due to an updated passenger and operationsforecast and new avoidance and minimization measures included in the <strong>FEIS</strong> design.The primary differences in Alternative B4 from the DEIS to this <strong>FEIS</strong> relate to noise impacts, noise mitigation,City of Warwick tax base, wetland impacts, and floodplain impacts. 142 Revised impacts in this <strong>FEIS</strong> are a resultof the updated forecast, a new version of the noise model, and design modifications on the Runway 34 End.The <strong>FEIS</strong> used a more recent version of the noise model than the DEIS (INM 7.0a in the DEIS and 7.0b in this<strong>FEIS</strong>), which resulted in the prediction of higher noise impacts for Alternative B4 in this <strong>FEIS</strong> (see Table 3-13noise impacts showing 282 people exposed to significant noise in 2020 in the DEIS and 409 people in this <strong>FEIS</strong>).As a result of the community comments on the DEIS, the FAA included an additional 26 residential units to theAlternative B4 VLAP for noise mitigation. These 26 units are included in the 140 residential units listed inTable 3-13. Adding these parcels increased the loss to the annual City of Warwick tax base.Refer to Chapter 6, Mitigation, for a summary matrix that shows significant and other impacts associated witheach alternative and the proposed mitigation measures that would be undertaken to address those impacts.142 The FAA implemented further minimization and avoidance measures on the Runway 34 End design that reduced Alternative B4 wetland impacts by2.3 acres and reduced floodplain impacts by 2.4 acres. See Section 3.9.2, <strong>FEIS</strong> Impact Analysis, for additional information on the minimization andavoidance measures.Chapter 3 – Alternatives Analysis 3-47 July 2011\\mawatr\ev\09228.00\reports\<strong>FEIS</strong>_Final_July_2011\<strong>PVD</strong>_CH03_Alternatives_JUL_2011.doc
T.F. <strong>Green</strong> <strong>Airport</strong> <strong>Improvement</strong> <strong>Program</strong>Environmental Impact Statement and Final Section 4(f) EvaluationTable 3-13DEIS and <strong>FEIS</strong> Comparison of Alternative B4 Operations, Passengers, Key Impacts, and CostsDEIS<strong>FEIS</strong>Operations/Passengers/Cost/Impact Category (2009 DEIS Forecast) (2010 <strong>FEIS</strong> Forecast)Operations and PassengersTotal Aircraft Operations in 2020 118,697 operations 108,114 operationsTotal Enplaned-Deplaned Passengers in 2020 7,462,082 passengers 6,612,622 passengersBusiness Revenue and Taxes 1Business Revenue in the City of Warwick between 2015 and the End of 2020 (gains) $385 million $385 millionBusiness Revenue in Rhode Island between 2015 and the End of 2020 (gains) $816 million $816 millionState Tax Revenue in Rhode Island between 2015 and the End of 2020 (gains) $13 million $13 millionCity of Warwick Tax Base (losses) Annually in 2020 $431,072 $567,521Business ImpactsImpacts to Businesses and Jobs 12 businesses and their 12 businesses and theirassociated 59 jobs associated 59 jobsResidential ImpactsResidential Land Acquisition (Mandatory due to Construction) 11 units 11 unitsTotal Residential Land Acquisition (Mandatory and Voluntary) 121 units 140 units 2Noise ImpactsExposed to Significant Noise Levels 282 people,120 units 409 people,174 units(increase of at least DNL 1.5 dB at or above DNL 65 dB) 3Exposed to Noise Greater than DNL 70 dB 4 35 people, 15 units 47 people, 20 unitsExposed to Noise Between DNL 65 dB and 70 dB 3 3,074 people, 1,308 units 2,632 people, 1,120 unitsChange in Residential Units Exposed to Roadway Traffic Noise Compared to No-Action -5 units 0 unitsWetland Impacts 7.3 acres in one wetland 5.0 acres at thesystem, no impacts to Runway 34 End, noBuckeye Brookimpacts to Buckeye BrookHistoric Resources ImpactsHangar No. 1 5 Demolish for safety Demolish for safetyHangar No. 2 5 Internal reconfiguration, Internal reconfiguration,de minimis useRhode Island State <strong>Airport</strong> Terminal (Setting and Landscaping) 6 Reduction in views, direct Reduction in views, directimpact to landscaping impact to landscapingEligible <strong>Airport</strong> Historic District 5 Alter historical Alter historicalconfiguration of airfield and configuration of airfield andremove Hangar No. 1 remove Hangar No. 1Construction and Preliminary Mitigation Costs 7 $445 million $439 millionNotes: This table compares the key differences between Alternative B4 impacts as identified in the DEIS and <strong>FEIS</strong>.1 Business revenue and taxes remained the same in the DEIS and <strong>FEIS</strong> because the project would still generate the same number of additional flights due to the runwayextension. These business revenue and tax values consider the impact of the incremental future build scenario and do not include the No-Action baseline flights.2 Neighborhood rounding was applied in the VLAP for noise mitigation, which increased the number of units in the program.3 Properties would be eligible for sound insulation. The change from the DEIS to the <strong>FEIS</strong> is due to the change in the version of the INM noise model from version7.0a to 7.0b and a small change in INM aircraft input types. These changes all increased noise from these aircraft between INM 7.0a and INM 7.0b on arrival.4 Properties would be eligible for acquisition under a voluntary land acquisition program.5 Eligible for listing on the National Register of Historic Places.6 Listed on the National Register of Historic Places.7 The Alternative B4 construction and preliminary mitigation costs went down in the <strong>FEIS</strong> due to changes in the real estate market, which resulted in reduced land acquisition costs.Chapter 3 – Alternatives Analysis 3-48 July 2011\\mawatr\ev\09228.00\reports\<strong>FEIS</strong>_Final_July_2011\<strong>PVD</strong>_CH03_Alternatives_JUL_2011.doc
T.F. <strong>Green</strong> <strong>Airport</strong> <strong>Improvement</strong> <strong>Program</strong>Environmental Impact Statement and Final Section 4(f) Evaluation3.9.4 The Preferred AlternativeThe FAA, as the lead agency responsible for preparing the EIS and assuring its adequacy, identifiedAlternative B4 as the Preferred Alternative. The FAA selects the alternative that fulfills the agency’s mission andresponsibilities, and that would meet the T.F. <strong>Green</strong> <strong>Airport</strong> <strong>Improvement</strong> <strong>Program</strong>’s Purpose and Need, givingconsideration to economic, environmental, technical, and other factors. As required by the CEQ (40 CFR section1502.14(e)), a lead agency must identify its Preferred Alternative in the <strong>FEIS</strong>, and must identify theEnvironmentally Preferable Alternative (40 CFR section 1505(.2)(b)) at the time of its decision (see Section 3.9.5,The Environmentally Preferable Alternative). RIAC has confirmed that Alternative B4 is its Proposed Action. Thissection includes a summary comparison of impacts of the <strong>FEIS</strong> evaluation of Alternatives B2 and B4 and theidentification of the Preferred Alternative. FAA has completed the appropriate environmental review and thenecessary steps in the NEPA process, including:• Careful consideration of the alternatives and the ability of the alternatives to satisfy the identified Purposeand Need for the T.F. <strong>Green</strong> <strong>Airport</strong> <strong>Improvement</strong> <strong>Program</strong> (40 CFR section 1502.14(e)); and• Evaluation of the potential impacts of the alternatives carried forward.Alternatives B2 and B4 would meet the Purpose and Need and provide the same aviation and communitybenefits. Alternative B2 aviation (safety) benefits would begin in 2015, and socioeconomic benefits would beginin 2020. However, Alternative B2 would have substantially greater impacts to community resources(i.e., disruption to community, mandatory land acquisition of businesses, and mandatory land acquisition ofresidences), and higher construction costs than Alternative B4. Alternative B4 would have greater noise impacts,but would have substantially less mandatory land acquisition for construction. 143 Alternative B4 would alsohave greater floodplain impacts, but fewer wetland impacts.Alternative B4 would meet the Purpose and Need for the T.F. <strong>Green</strong> <strong>Airport</strong> <strong>Improvement</strong> <strong>Program</strong>, providingthe same aviation and community benefits as Alternative B2; however socioeconomic benefits would begin in2015 with the extended Runway 5-23 coming on line. From a constructability perspective, Alternative B4 wouldalso be more feasible to construct than Alternative B2 because it would have lower construction costs by$77 million. The reduced construction cost is partially due to smaller wetland impacts and a lower wetlandmitigation cost when compared to Alternative B2. All significant impacts that would occur under Alternative B4could be mitigated (see Chapter 6, Mitigation). When compared to Alternative B2, Alternative B4 is preferablefor the following reasons:• Alternative B4 would result 80 percent greater economic gains between 2015 and the end of 2020 thanAlternative B2 because of the expedited construction schedule. Potential economic gains for Alternative B4between 2015 and the end of 2020 would total $680 million more for the State of Rhode Island than underAlternative B2.• Alternative B4 would require the acquisition of 97 fewer residential units, all of which are considered“affordable.”143 Many of the units impacted by noise in Alternative B4 would have otherwise been purchased under Alternative B2 for mandatory acquisition forconstruction.Chapter 3 – Alternatives Analysis 3-49 July 2011\\mawatr\ev\09228.00\reports\<strong>FEIS</strong>_Final_July_2011\<strong>PVD</strong>_CH03_Alternatives_JUL_2011.doc
T.F. <strong>Green</strong> <strong>Airport</strong> <strong>Improvement</strong> <strong>Program</strong>Environmental Impact Statement and Final Section 4(f) Evaluation• Alternative B4 would impact 26 fewer businesses.• Alternative B4 would impact 250 fewer jobs, including 50 fewer “most threatened” jobs. 144• Alternative B4 would introduce 782 total jobs in the City of Warwick in 2015. (Alternative B2 would notresult in job growth until 2020.)• Alternative B4 would remove 99 fewer housing units and 26 fewer businesses from the tax role preserving$606,476 more in annual City of Warwick property taxes in 2020.• Alternative B4 would preserve the Spring <strong>Green</strong> Neighborhood because it would not include FullyRelocated <strong>Airport</strong> Road.• Alternative B4 would expose 102 fewer residential units to roadway traffic noise impacts (when comparedto No-Action noise levels).• Alternative B4 would not have an adverse effect on Hangar No. 2.• Alternative B4 would impact 0.8 fewer acres of wetlands and would not impact Buckeye Brook.• Alternative B4 would cost $77 million less to construct and mitigate for impacts.The FAA therefore has identified Alternative B4 as the Preferred Alternative. Alternative B4 would have theleast environmental impacts and all significant impacts could be mitigated. No final FAA decision on thePreferred Alternative and associated mitigation has been or will be made until the issuance of the agency’s RODfollowing the <strong>FEIS</strong>.3.9.5 The Environmentally Preferable AlternativeThe CEQ regulations require that RODs specify the alternative which is considered to be environmentallypreferable. The FAA must identify the alternative that will promote the national environmental policy asexpressed in NEPA's Section 101. Typically, the Environmentally Preferable Alternative is the alternative that“causes the least damage to the biological and physical environment; it also means the alternative which bestprotects, preserves, and enhances historical, cultural, and natural resources.” 145In general, the Environmentally Preferable Alternative is the alternative resulting in the least adverse impact tothe biological and physical environment and which best protects natural and cultural resources. TheEnvironmentally Preferable Alternative is often found to be the No-Action Alternative. Although the FAA hasanalyzed all reasonable steps to minimize harm from significant adverse environmental impacts fromAlternative B4, the FAA recognizes that the No-Action Alternative would impose the least environmentalimpact when compared to the other alternatives. Therefore, the No-Action Alternative is the EnvironmentallyPreferable Alternative. Notably, the No-Action Alternative would avoid the impacts of land acquisition andrelocation of homes and businesses, and impacts on wetlands, floodplains, fish, wildlife, and plants, culturalresources, and water quality. Although the No-Action Alternative results in fewer overall environmentalimpacts, it is not considered a reasonable alternative. The No-Action Alternative is not capable of enhancingairport safety, or enhancing the efficiency of the <strong>Airport</strong> and the New England Regional <strong>Airport</strong> System, tomore fully meet the current and anticipated demand for aviation services. It thus does not meet the Purpose andNeed of the T.F. <strong>Green</strong> <strong>Airport</strong> <strong>Improvement</strong> <strong>Program</strong>.144 Businesses and jobs unlikely to relocate within the City of Warwick due to limited vacant/developable industrial lands.145 Council on Environmental Quality, Executive Office of the President, Forty Most Asked Questions Concerning CEQ's National Environmental Policy ActRegulations March 16, 1981.Chapter 3 – Alternatives Analysis 3-50 July 2011\\mawatr\ev\09228.00\reports\<strong>FEIS</strong>_Final_July_2011\<strong>PVD</strong>_CH03_Alternatives_JUL_2011.doc
T.F. <strong>Green</strong> <strong>Airport</strong> <strong>Improvement</strong> <strong>Program</strong>Environmental Impact Statement and Final Section 4(f) Evaluation4Affected Environment4.1 IntroductionThis chapter describes the characteristics of the environment in which the T.F. <strong>Green</strong> <strong>Airport</strong> <strong>Improvement</strong><strong>Program</strong> Alternatives would occur (the Baseline Condition). The Baseline Condition was documented for eachenvironmental resource category, as specified in FAA Order 1050.1E, to provide a context for understanding theimpacted resources and to familiarize the reader with the geography, land use, demographics and economics,and the physical and natural environment. The Baseline Condition is based on data from 2004 including the2004 EIS Forecast described in Chapter 2, Purpose and Need, and has been updated with more currentinformation, where needed. In accordance with the CEQ regulations implementing NEPA, Alternatives B2 andB4 are compared to the No-Action Alternative in the same analysis year for each environmental resourcecategory to determine the effect (beneficial or adverse) of the alternative. These comparisons are presented inChapter 5, Environmental Consequences.Documentation of the affected environment is provided for the following environmental resources:• Section 4.2, Noise;• Section 4.3, Compatible Land Use;• Section 4.4, Social and Socioeconomic, and Environmental Justice, and Children’s Health and Safety Risks;• Section 4.5, Surface Transportation;• Section 4.6, Air Quality;• Section 4.7, Historic, Architectural, Archaeological, and Cultural Resources;• Section 4.8, Section 4(f) and Section 6(f) Resources;• Section 4.9, Wetlands and Waterways;• Section 4.10, Water Quality;• Section 4.11, Fish, Wildlife and Plants;• Section 4.12, Federal Threatened and Endangered Species;• Section 4.13, Floodplains;• Section 4.14, Coastal Resources;• Section 4.15, Farmlands;• Section 4.16, Hazardous Materials, Pollution Prevention, and Solid Waste;Chapter 4 – Affected Environment 4-1 July 2011\\mawatr\ev\09228.00\reports\<strong>FEIS</strong>_Final_July_2011\<strong>PVD</strong>_CH04_Affected_Env_JUL_2011.doc
T.F. <strong>Green</strong> <strong>Airport</strong> <strong>Improvement</strong> <strong>Program</strong>Environmental Impact Statement and Final Section 4(f) Evaluation• Section 4.17, Light Emissions and Visual Environment; and• Section 4.18, Natural Resources, Energy Supply and Sustainable Design.The environmental resource category of ‘Wild and Scenic Rivers’ is not included in this assessment becausethere are no wild or scenic rivers within the State of Rhode Island, as defined by the Wild and Scenic Rivers Act of1968. 146The Project Area is the same for each category throughout this <strong>FEIS</strong> and is defined as the area where direct,physical impacts to on-airport and surrounding land uses could occur. The Project Area includes the currentT.F. <strong>Green</strong> <strong>Airport</strong> property and land immediately adjacent to the <strong>Airport</strong>. T.F. <strong>Green</strong> <strong>Airport</strong> occupies1,100 acres of land and is generally bounded by <strong>Airport</strong> Road to the north, Industrial Drive to theeast/southeast, Main Avenue (State Route 113) to the south, and Post Road (U.S. Route 1) to the west. The Areaalso includes additional land north of the present airport property, and areas of land west and south of theproperty associated with Runway Protection Zones (RPZs).For each category the baseline environmental conditions within a specific Study Area are examined to provide acontext for evaluating the impacts associated with the T.F. <strong>Green</strong> <strong>Airport</strong> <strong>Improvement</strong> <strong>Program</strong>. For someenvironmental categories (Noise; Social and Socioeconomic; Surface Transportation; Air Quality; Historic,Architectural, Archaeological, and Cultural Resources; Section 4(f) and Section 6(f) Resources; Floodplains;Coastal Resources; Hazardous Materials and Solid Waste), the boundaries of the the Study Area are defined bysets of laws, regulations, or guidance specific to that environmental category.4.2 NoiseThis section briefly summarizes the methodology of conducting the noise evaluation, which is more fullydetailed in DEIS Appendix F.2, Noise Assessment Methodology, and describes the Baseline Condition for noisewithin the <strong>Airport</strong> noise Study Area to provide a context for evaluating the proposed <strong>Improvement</strong> <strong>Program</strong>.The Baseline Condition for noise is also addressed in <strong>FEIS</strong> Section 4.3, Compatible Land Use; Section 4.4, Social andEconomic, and Environmental Justice and Children’s Health and Safety Risks; Section 4.7, Historic, Architectural,Archaeological, and Cultural Resources; and Section 4.8, Section 4(f) and Section 6(f) Resources. This noise assessmentconsiders all sources of airport-related noise, including aircraft noise, ground noise associated with cargooperations, and traffic noise associated with airport-related vehicular traffic.4.2.1 MethodologyThe following briefly describes the key noise terms, the Noise Study Area, and the methodology of the aircraftnoise analysis. Other noise sources evaluated are also discussed. DEIS Appendix F.1, Introduction/Acoustics andNoise Terminology, provides detailed information on acoustics and noise terminology.146 Wild and Scenic Rivers Act of 1968, 16 U.S.C. section 1271 et seq.Chapter 4 – Affected Environment 4-2 July 2011\\mawatr\ev\09228.00\reports\<strong>FEIS</strong>_Final_July_2011\<strong>PVD</strong>_CH04_Affected_Env_JUL_2011.doc
T.F. <strong>Green</strong> <strong>Airport</strong> <strong>Improvement</strong> <strong>Program</strong>Environmental Impact Statement and Final Section 4(f) Evaluation4.2.1.1 Common Noise MetricsCommon metrics used to describe and evaluate aircraft and airport-related noise include:• The Decibel (dB) – The standard unit of measure for sound. It is a logarithmic quantity reflecting the ratio ofthe pressure of the sound source of interest and a reference pressure.• A-Weighted Decibel (dBA) – An important characteristic of sound is its frequency, or "pitch". TheA-weighted level has been adopted as the basic measure of environmental noise by the United StatesEnvironmental Protection Agency (EPA) and by nearly every other federal and state agency concerned withcommunity noise, including the FAA.• Day-Night Average Sound Level (DNL) – A measure of the cumulative noise exposure over a 24-hour day.It is the 24-hour, logarithmic (or energy) average, A-weighted sound pressure level with a 10-dB penaltyapplied to the nighttime event levels that occur between 10:00 PM and 7:00 AM. The DNL is theFAA-defined metric for evaluating noise and land use compatibility.4.2.1.2 Noise Study AreaTo adequately capture the effects of aircraft noise, the Noise Study Area must include not only the immediate<strong>Airport</strong> environs where aircraft flight paths are aligned with the runways, but other potentially affected areasbeyond that, over which aircraft will fly as they follow new or changed flight corridors that join thesurrounding airspace. A circular area with a radius of approximately 27 miles was used to determine the extentof flight track modeling. Figure 4-1 shows the Noise Study Area (the baseline flight tracks in combination withmodeled tracks).4.2.1.3 Noise Analyses ConductedAs required by NEPA and the FAA Order 1050.1E, the noise analysis for the Baseline Condition identifies:• The DNL aircraft noise exposure contours and estimates of associated population within each contourinterval; and• Noise-sensitive receptors.For the purposes of this EIS, the appropriate model is the Integrated Noise Model (INM) which, as required bythe FAA (FAA Order 1050.1E, Appendix A, paragraph 14.2b), was used to produce DNL contours at 75 dB,DNL 70 dB, and DNL 65 dB, and others as needed. 147 Refer to DEIS Appendix F.2, Noise Assessment Methodology,for further details on the INM model used in the noise evaluation.Noise measurements were conducted to provide an understanding of the baseline noise environment at selectedsites and to provide a check that the assumptions used in the noise modeling effort are reasonable. 148 The noisemeasurements provide information on single-event and cumulative noise exposure, and information onbaseline roadway and aircraft operations, all of which are useful in understanding the noise environment at and147 Consistent with FAA policy, the most current release of the model at the time the EIS was initiated, INM Version 6.1, was used for all noise exposure computationsand specific point analyses for the Baseline Condition assessment. The noise analysis conducted to identify noise impacts of the Build Alternatives compared to theNo-Action Alternative included a sensitivity analysis that assesses the results for selected conditions using the most recent version of the INM, Version 7.0a.148 Noise measurement data were obtained from an aircraft short-term noise monitoring program which was performed during August 2005 and from trafficnoise measurements taken on July 22, 2006.Chapter 4 – Affected Environment 4-3 July 2011\\mawatr\ev\09228.00\reports\<strong>FEIS</strong>_Final_July_2011\<strong>PVD</strong>_CH04_Affected_Env_JUL_2011.doc
T.F. <strong>Green</strong> <strong>Airport</strong> <strong>Improvement</strong> <strong>Program</strong>Environmental Impact Statement and Final Section 4(f) Evaluationaround the <strong>Airport</strong> (described below). Figure 4-2 shows the locations of the primary, secondary, and vehiculartraffic noise measurement sites. Refer to DEIS Appendix F.5, Noise Monitoring, for further details on the methodsof these noise measurements, such as site selection and measurement instrumentation.In addition, the Baseline Condition includes supplemental noise analyses that provide a full understanding ofthe noise environment, but are not required by the FAA to evaluate significant impacts. Supplemental noiseanalyses and metrics were included in this EIS because they were requested by the public and agencies duringthe EIS scoping process. The following supplemental analyses and metrics were used to evaluate thealternatives:• Single-Event Noise Analysis – A statistical analysis of single events for individual aircraft operations wasperformed by comparing measured noise levels from aircraft operations – captured by the noise monitorsand correlated with the flight track radar data – to modeled noise levels from the INM.• Cargo-Related Ground Noise Analysis – Noise exposure from cargo operations was predicted usingdetailed descriptions of operations provided by cargo operators, and took into account geometry of thecargo facility, terrain, and average weather conditions.• Vehicular Traffic Noise Analysis – Short-term vehicular traffic noise measurements were conducted atseven sites based on their proximity to noise-sensitive sites (Figure 4-2; shown with an “R” prefix).• Supplemental Aviation Noise Metrics – While not required by the FAA but requested through agency andpublic scoping, supplemental noise metrics were calculated for the Baseline Condition to better describe thenoise environment, in addition to DNL.Refer to DEIS Appendix F, Noise, for further descriptions of the methodology used to conduct the noiseevaluation for this <strong>FEIS</strong>.4.2.1.4 BackgroundThis section provides background on current and past noise abatement and noise compatibility programs atT.F. <strong>Green</strong> <strong>Airport</strong>.Rhode Island <strong>Airport</strong> Corporation’s Noise Abatement <strong>Program</strong> and Noise Compatibility <strong>Program</strong>T.F. <strong>Green</strong> <strong>Airport</strong> was one of the first airports in New England to participate in the FAA’s Noise and Land UseCompatibility <strong>Program</strong>, which is conducted under 14 CFR Part 150. 149, 150 The <strong>Airport</strong>’s first Part 150 Study andNEM were approved by the FAA in 1986. In 1991, the Noise Exposure Map (NEM) was updated and in 1993RIAC’s first Part 150 study update was completed. Both Part 150 studies included aircraft-related noiseabatement measures some of which been adopted and continue to be implemented, and others were notenacted. In 1999, RIAC undertook a complete update of the original Part 150 Study that evaluated theeffectiveness and/or applicability of previously implemented noise abatement and land use compatibilitymeasures, and provided recommendations. During the course of this Part 150 Study update and based on anrevised NEM (dated 2000), 58 additional noise abatement and land use alternatives were evaluated for their149 14 CFR Part 150, <strong>Airport</strong> Noise Compatibility Planning.150 RIAC’s Part 150 NCP was initiated by the 1986 NEM and NCP approval, and includes the1991 NEM update, 1995 NEM update, 2000 NCP revision, 2008NEM update, and 2010 NEM update.Chapter 4 – Affected Environment 4-4 July 2011\\mawatr\ev\09228.00\reports\<strong>FEIS</strong>_Final_July_2011\<strong>PVD</strong>_CH04_Affected_Env_JUL_2011.doc
T.F. <strong>Green</strong> <strong>Airport</strong> <strong>Improvement</strong> <strong>Program</strong>Environmental Impact Statement and Final Section 4(f) Evaluationfeasibility to reduce the effects of noise on surrounding communities. 151 Major elements of the T.F. <strong>Green</strong> <strong>Airport</strong>NCP include:• Airfield: The intersection of Runways 5-23 and 16-34 has been improved and a full parallel taxiway has beenconstructed. These airfield improvements increase efficiency and minimize the amount of aircraft groundmovement and re-positioning, some of which occurred at relatively high power (resulting in relatively highground noise levels).• Flight paths: Noise abatement flight paths have been approved and implemented for all air carrierdepartures. Compliance with these procedures, as reported in the 2010 Fourth Quarter Operations Reports,is 98 to 99 percent for all runways. 152• Ground noise: Aircraft run-up activity is confined to designated locations and times. Auxiliary Power Unitshave been replaced at all but three gates. Restrictions on aircraft re-positioning under power and 180-degreeturns on the runway are in place.• Land Use Measures: Residences exposed to sound levels between DNL 65 dB and DNL 69 dB contour as aresult of Alternatives B2 and B4, would be eligible for sound insulation (discussed further below), 153 andresidences exposed to sound levels of DNL 70 dB and above would be eligible for participation in avoluntary land acquisition program, or VLAP. The residential properties determined to be impacted bynoise from the <strong>Airport</strong> are based on a current NEM. The majority of the impacted residential propertiesidentified under RIAC’s Part 150 NCP are owner-occupied, single-family dwellings.Based on the 2008 NEM update, 285 residential properties (consisting of 280 housing units) were identified aseligible for acquisition most of which were acquired in 2009 (referred to in this <strong>FEIS</strong> as the Completed Part 150VLAP). In early 2010, RIAC continued implementation of its Part 150 NCP based on the 2020 NEM, which wasaccepted by the FAA on July 27, 2010. 154 The 2010 NEM update identified 115 residential parcels as eligible foracquisition of which 70 properties have been acquired as of January 2011 (referred to in this <strong>FEIS</strong> as the CurrentPart 150 VLAP). The Current Part 150 VLAP is scheduled to be complete by 2015 and, therefore, have beentaken into account when determining project-related impacts (see Chapter 5, Environmental Consequences).RIAC Sound Insulation <strong>Program</strong>The RIAC sound insulation program was initiated in 1990 based on the 1986 NEM and NCP, which accountedfor Stage 1 and Stage 2 aircraft in the fleet mix. In 1990, the Noise and Capacity Act was promulgated whichrequired the phase out of noisier Stage 1 and 2 aircraft. 155 As part of the 1999 NCP update, the phased outStage 2 aircraft was no longer modeled as part of the T.F. <strong>Green</strong> <strong>Airport</strong> fleet mix but a substantial number of“recertified” Stage 2 aircraft fitted with engine hushkits were modeled. The 1999 contours were reduced in sizefrom the original version in 1986, reflecting the removal of the Stage 2 aircraft from the fleet mix. The events ofSeptember 11, 2001 and other factors, such as fuel prices have caused the acceleration of the retirement of the151 T.F. <strong>Green</strong> <strong>Airport</strong> FAR Part 150 Study Update, Appendix B, Noise Abatement and Land Use Alternatives, Landrum & Brown, April 2000.152 Permanent Noise Monitoring Act Quarterly Operations Report, 4th Quarter 2010, RIAC. www.pvdairport.com/main.aspx?sec_id=74.153 Includes homes exposed to noise levels up to DNL 69.9 dB.154 The 2020 NEM was derived from the Level 6 2020 No-Action Alternative DNL 70 dB noise contour with additional rounding, as documented in the DEIS.155 When Congress adopted Public Law (PL) 101-508, subtitled the <strong>Airport</strong> Noise and Capacity Act of 1990 (the Act), it required the U.S. Secretary of Transportation toestablish a schedule for the phase-out of Part 36 Stage 2 aircraft by the year 2000. Part 91, set the schedule for conversion of Stage 2 aircraft to meet Stage 3 noiselimits by December 31, 1999, but exempted aircraft less than 75,000 pounds maximum gross takeoff weight (approximate size of a business jet).Chapter 4 – Affected Environment 4-5 July 2011\\mawatr\ev\09228.00\reports\<strong>FEIS</strong>_Final_July_2011\<strong>PVD</strong>_CH04_Affected_Env_JUL_2011.doc
T.F. <strong>Green</strong> <strong>Airport</strong> <strong>Improvement</strong> <strong>Program</strong>Environmental Impact Statement and Final Section 4(f) Evaluationrecertified State 2 aircraft from the fleet mix. This change in fleet mix further reduced the contour size from thatpredicted in the 1999 NCP Update. Thus, homes that may have been acquired or sound insulated at the start ofthe RIAC Part 150 NCP, may no longer fall within impacted noise contours.RIAC Aircraft Operations Monitoring SystemIn 1998, the Rhode Island Legislature enacted Title 1, Aeronautics, Chapter 1-5, Permanent Noise Monitoring Act,which required RIAC to install an Aircraft Operations Monitoring System (AOMS) and to report, on a quarterlybasis, information related to the operation of aircraft at T.F. <strong>Green</strong>. The AOMS tracks flights arriving to anddeparting from the <strong>Airport</strong>. The AOMS has five radar sensors, deployed throughout the State, which receiveinformation from all aircraft with transponders operating within 20 miles of T.F. <strong>Green</strong>. Transponders allow theaircraft to report its location, altitude and identification information. The system records aircraft type, flightnumber, aircraft registration number, altitude, arrival or departure status, and the origin or destination of theflight. RIAC prepares Quarterly Operations Reports, posted on its website, 156 that provide data on:• Activity levels, including: total operations, operations by Part 36 certification (noise classification), late nightoperations (by time, airline and aircraft category);• Adherence to the noise abatement corridors developed in the Part 150 Study, by airline and runway; and• A summary of noise complaints during the period, and comparison to previous quarters.4.2.2 Affected EnvironmentThe noise analysis examined the Baseline Condition for aircraft noise, and vehicular traffic noise. Predicted cargo operations-related ground noise for future year conditions is presented in Chapter 5,Environmental Consequences. 4.2.2.1 Aircraft Noise ExposureAircraft noise exposure is described in terms of the DNL 60, 65, 70, and 75 dB contours for the BaselineCondition aircraft operations, which are shown on Figure 4-3. DNL noise exposure contours are a graphicalrepresentation of how the cumulative exterior noise levels from T.F. <strong>Green</strong> <strong>Airport</strong>’s aircraft operations isdistributed over the surrounding area on an average day of a given year. Both the U.S. Department of Housingand Urban Development (HUD) and the FAA define DNL 65 dB as the threshold of noise incompatibility withresidential land uses. 157, 158 Thus, the DNL 65 dB contour is important for population impact assessments. TheDNL 65 dB contour also forms the basis on which the FAA determines eligibility for sound insulation funding.INM ModelingAircraft noise exposure contours were generated by the INM for 2004 aircraft operations. Figure 4-1 provides asample of the flight tracks modeled for the Baseline Condition. These tracks follow the NCP flight paths but alsoinclude deviations from these paths. The DNL 65 dB contour at T.F. <strong>Green</strong> <strong>Airport</strong> (Figure 4-3) extends mainlyalong the flight track off Runway 5-23. The contour extends northward near Warwick Avenue almost to156 T.F. <strong>Green</strong> <strong>Airport</strong> Noise Management, www.pvdairport.com/main.aspx?sec_id=74, May 2011.157 Environmental Criteria and Standards of the Department of Housing and Urban Development, 24 CFR Part 51; 44 Federal Register 40861,U.S. Department of Housing and Urban Development, Washington, DC, July 12, 1979.158 14 CFR Part 150, <strong>Airport</strong> Noise Compatibility Planning.Chapter 4 – Affected Environment 4-6 July 2011\\mawatr\ev\09228.00\reports\<strong>FEIS</strong>_Final_July_2011\<strong>PVD</strong>_CH04_Affected_Env_JUL_2011.doc
T.F. <strong>Green</strong> <strong>Airport</strong> <strong>Improvement</strong> <strong>Program</strong>Environmental Impact Statement and Final Section 4(f) EvaluationPosnegansett Lake. To the south, it extends across West Shore Road and close to Post Road (U.S. Route 1) in the<strong>Green</strong>wood neighborhood of Warwick. Along Runway 16-34, the DNL 65 dB contour is much closer in to the<strong>Airport</strong> due to its limited runway use. The contour does not extend off <strong>Airport</strong> property to the east, but doesextend to the west across <strong>Airport</strong> Road and to Post Road.There are some areas off-<strong>Airport</strong> that are exposed to noise levels of DNL 70 dB or above. One small area is to thesouth of the <strong>Airport</strong> just off the end of Runway 5 and another area is just to the north of Runway 23. There isalso an area along the east side of the <strong>Airport</strong>, north of Runway 16-34, which is exposed to noise levels ofDNL 70 dB or above under the Baseline Condition.Noise Impacts to Population and HousingThe DNL 60, 65, 70, and 75 dB noise contours are entirely within the City of Warwick. Estimates of the numbersof people and the numbers of housing units within each noise exposure contour are summarized in Table 4-1and the extent of the contours is shown in Figure 4-3.Table 4-12004 Noise-exposed Population and Housing Units in the City of WarwickDNL 75 to DNL 70 to DNL 65 to Total AboveMeasure 80 dB 75 dB 70 dB DNL 65 dBPopulation 0 85 2,982 3,067Housing Units 1 0 36 1,269 1,305Source: HMMH, 2005. U.S. Census Data, 2000. (Although some 2010 census data was released in March 2011, a sufficient level of census data for the <strong>FEIS</strong> analysiswas not released prior to the filing of the <strong>FEIS</strong>.)Based on INM Version 6.1 and the 2004 DNL noise contours.1 Population based on 2000 census data of 2.5 persons per household.Population and housing counts for noise exposure were derived from year 2000 Census Data. 159 Therefore, thesecounts may include properties exposed to noise above DNL 65, 70 and 75 dB that have already been acquired asa result of the Completed Part 150 VLAP (discussed below). There are no publicly subsidized housing unitswithin the Baseline Condition DNL 65 dB noise contour.Based on the 2000 NEM update, RIAC updated its Part 150 program which included a phased VLAP for noisemitigation. The number of residential parcels acquired and residences sound insulated as of December 31, 2004are shown in Table 4-2 and displayed in Figure 4-4.159 This EIS uses the most current U.S. Census data available and appropriate for the community analysis. In general, the 2000 U.S. Census data is the mostcomplete as it includes data from all households that completed census forms that year. Since 2000, the U.S. Census Bureau has prepared a series ofsurveys and estimates. These are not as comprehensive as the 2000 survey, but are still appropriate to use for some analyses. Although some 2010census data was released in March 2011, a sufficient level of census data for the <strong>FEIS</strong> analysis was not released prior to the filing of this <strong>FEIS</strong>.Chapter 4 – Affected Environment 4-7 July 2011\\mawatr\ev\09228.00\reports\<strong>FEIS</strong>_Final_July_2011\<strong>PVD</strong>_CH04_Affected_Env_JUL_2011.doc
T.F. <strong>Green</strong> <strong>Airport</strong> <strong>Improvement</strong> <strong>Program</strong>Environmental Impact Statement and Final Section 4(f) EvaluationTable 4-2City of Warwick Properties (Parcels) in the Completed Part 150 VLAP and ResidentialSound Insulation <strong>Program</strong> as of December 31, 2004 (Baseline Condition) 1DNL 75 to DNL 70 to DNL 65 to Total Above<strong>Program</strong> 80 dB 75 dB 70 dB DNL 65 dBVoluntary Land Acquisition <strong>Program</strong> (VLAP) 0 56 196 252 2,3Residential Sound Insulation <strong>Program</strong> 0 9 861 870 4Source: HMMH, 2005. Based on INM Version 6.1.Note: Parcels are included in the total for the 2004 Noise-Exposed Population and Housing Units.DNL Day Night Average Sound Level.1 Tally used to assess Baseline Condition noise.2 Some parcels fall outside of the Baseline DNL 65 dB and above noise contour because consideration is given to limiting community disruption due to land acquisitions where properties that are not directly impacted by the <strong>Airport</strong>, but are indirectly affected (i.e., majority of the block has been acquired) are eligible for acquisition.3 As of May 2009, all seven phases of the Completed Part 150 VLAP were complete (270 accepted offers).4 These properties have been sound insulated as part of a previous sound insulation effort under the Part 150 NCP.Since the Baseline Condition for noise was assessed in 2004, RIAC has continued with its noise mitigationprogram. Based on the 2008 NEM update, RIAC has identified 285 eligible residential properties (consisting of280 housing units) almost all of which were acquired by 2009 as part of the Completed Part 150 VLAP. Based onthe most recent FAA-accepted 2010 NEM update, RIAC identified an additional 115 eligible residential parcels(consisting of 135 residential units), acquisition of which is anticipated to be complete by 2015. 160 As of January,2011, 70 residential properties (out of the 115) have opted to participate in the Current Part 150 VLAP.Noise Impacts to Non-Residential Noise-Sensitive SitesA total of 23 non-residential noise-sensitive sites were found to experience noise levels of DNL 60 dB or aboveunder the Baseline Condition. These 23 sites consist of places of worship, schools, and two libraries and arelisted in Table 4-3 and shown in Figure 4-5.As of December 2003, 23 non-residential noise-sensitive sites and two places of worship have received soundinsulation. The two sites are Creating Women Ministries (Site PW33) at 19 Etta Street in Warwick, and Baha’iFaith (Site PW39) at 80 Walnut Glen Drive in Warwick. The sound insulation process typically upgrades doors,windows, HVAC systems, and improvements to the ceiling and roof design. Refer to Appendix F.5, EducationalFacility HVAC Report, of this <strong>FEIS</strong> for an assessment of the HVAC upgrades provided to the seven alreadysound insulated schools (six of these sound insulated schools have noise levels at or above 60 dB DNL for thebaseline condition).160 The 2020 NEM was derived from the Level 6 2020 No-Action Alternative contour, as documented in the DEIS.Chapter 4 – Affected Environment 4-8 July 2011\\mawatr\ev\09228.00\reports\<strong>FEIS</strong>_Final_July_2011\<strong>PVD</strong>_CH04_Affected_Env_JUL_2011.doc
T.F. <strong>Green</strong> <strong>Airport</strong> <strong>Improvement</strong> <strong>Program</strong>Environmental Impact Statement and Final Section 4(f) EvaluationTable 4-3Modeled DNL, L max and TA Specified Level for Non-Residential Noise-sensitive Sites withNoise Levels at or above 60 dB DNL for the Baseline ConditionDNL LmaxAnnualAverage Day TA(min)Site 1 Name Address (dB) (dBA) 65 dB 75 dB 85 dBPlaces of WorshipPW002 Saint Barnabas Episcopal Church 3257 Post Road 62 103 19.7 4.6 0.6PW003 Saint Catherine Church 3252 Post Road 62 103 19.1 4.4 0.5PW004 Warwick Central Baptist 3270 Post Road 62 103 19.1 4.3 0.5PW017 Jehovah's Witnesses of Warwick 544 Long Street 66 106 33.5 10.4 1.2PW020 Spring <strong>Green</strong> Memorial Baptist Church 1350 Warwick Avenue 61 108 24.6 4.4 0.2PW033 Creating Women Ministries 3 19 Etta Street 63 97 31.8 7.0 0.6PW034 New Hope Worship Center 205 Hallene Road 65 113 37.3 7.6 1.5PW039 Baha’i Faith 3 80 Walnut Glen Drive 65 103 40.5 10.2 1.0PW040 Calvary Chapel Christian Fellowship 475 Arnold’s Neck Drive 62 104 22.4 5.6 0.6PW042 Apponaug Pentecostal Church 75 Prospect Street 61 101 16.5 3.2 0.4PW043 Temple AM David 40 Gardnier Street 62 - - - Public and Private Schools, Educational Institutions, and Day Care FacilitiesSCH512 Apponaug Christian 75 Prospect Street 62 103 19.9 4.8 0.5SCH517 Holliman School 3 70 Deborah Road 62 104 21.7 4.1 0.5SCH518 Pilgrim High School 3 111 Pilgrim Parkway 64 106 34.3 8.0 0.6SCH523 Saint Rose of Lima 3 200 Brentwood Avenue 61 101 41.4 5.6 0.1SCH524 John Wickes School 3 50 Child Lane 62 100 36.1 7.3 0.2SCH531 New England Institute of Technology 2500 Post Road 60 100 34.2 2.9 0.1SCH540 Spring <strong>Green</strong> Pre-School 4 1350 Warwick Avenue 61 109 24.7 4.4 0.2SCH542 Building Blocks Center 3270 Post Road 62 103 19.1 4.4 0.5SCH547 Westbay Community Action 22 Astral Street 63 105 33.0 6.7 0.6SCH552 Magic Years Child 2890 Post Road 63 107 27.9 7.0 0.5SCH661 A Child's World 4 2800 Post Road 62 108 30.4 6.5 0.3SCH677 Precious Years Day Care 205 Halene Road 60 - - - LibrariesLIB039 Warwick Public Library – Apponaug Branch 3267 Post Road 62 103 19.8 5.0 0.5LIB082 NE Institute of Technology Library 2500 Post Road 60 100 33.6 3.1 0.1Source: HMMH 2005. Based on INM Version 6.1 and the 2004 noise contours.1 See Figure 4-5 for locations.2 All facilities are located in the City of Warwick.3 Sites already sound insulated as part of a previous sound insulation effort under the Part 150 NCP.4 Closed as of February 2011. Confirmed by field check.PW Places of Worship.SCH Public and Private Schools, Educational Institutions, or Day Care Facilities.LIB Libraries.Chapter 4 – Affected Environment 4-9 July 2011\\mawatr\ev\09228.00\reports\<strong>FEIS</strong>_Final_July_2011\<strong>PVD</strong>_CH04_Affected_Env_JUL_2011.doc
T.F. <strong>Green</strong> <strong>Airport</strong> <strong>Improvement</strong> <strong>Program</strong>Environmental Impact Statement and Final Section 4(f) EvaluationNoise Measurements FindingsA short-term noise monitoring program was conducted in August 2005 to provide additional information on thebaseline noise environment in areas surrounding the <strong>Airport</strong> that could experience changes in noise exposure asa result of the potential changes in aircraft altitudes resulting from the Project. Noise measurements wereconducted at 11 sites from August 8, 2005 through August 15, 2005. Four of the short-term measurement siteswere primary sites, which included measurements for a period of 8 days, while seven were secondary sites, atwhich measurements typically were conducted for a period of 24 consecutive hours. Measurements for anadditional secondary site (site S6, located at 148 Grace Street in Cranston) were conducted August 24th andAugust 25th, 2005 and again on May 10th and May 11th, 2006 for a total of 12 measurement sites. Refer toFigure 4-2 for the short-term noise measurement locations. 161 ), 162These noise measurements primarily focused on collecting DNL, hourly noise levels (L eqand single eventnoise levels (SEL/L max) from aircraft operations. Six monitors were used for the noise measurements: fourremained in a fixed location for the full duration of the measurement period while two were used on arotational basis, remaining at each of the secondary sites for a 24-hour period. The primary sites were typicallylocated off the approach ends of the runways. While some of the secondary sites also were located off theapproach ends of the runways, many were located outside the immediate <strong>Airport</strong> area. Table 4-4 summarizesthe measured DNL and L maxat short-term primary and secondary monitoring sites.Single-Event Noise Measurement FindingsApproximately 4,000 single events were captured by the noise monitors. Out of these single events, 1,789 noiseevents could be associated with an aircraft flyover using the flight track radar data, and subsequently matched to amodeled SEL. The remaining single events were not matched to a modeled SEL if the noise event was due tonon-aircraft activity, or the noise event was due to an unidentified aircraft, or an observed (measured) aircraftoperation did not have sufficient flight track information for that operation to be modeled within INM.4.2.2.2 Cargo-Related Ground NoiseUnder Baseline Conditions, noise from cargo activities does not result in significant impacts to nearbyneighborhoods or other noise-sensitive receptors. A discussion of the cumulative noise exposure (DNL) analysisand single-event (L max) analysis are provided in Chapter 5, Environmental Consequences.161 The public were invited to participate in determining the locations for the noise measurement locations. This meeting was held July 11, 2005 from 6:30 PMto 8:30 PM at the Warwick Public Library.162 See Appendix F, Noise, Section F.1.2.1.5 Equivalent Sound Level, Leq for an explanation of L eq.Chapter 4 – Affected Environment 4-10 July 2011\\mawatr\ev\09228.00\reports\<strong>FEIS</strong>_Final_July_2011\<strong>PVD</strong>_CH04_Affected_Env_JUL_2011.doc
T.F. <strong>Green</strong> <strong>Airport</strong> <strong>Improvement</strong> <strong>Program</strong>Environmental Impact Statement and Final Section 4(f) EvaluationTable 4-4Measured DNL for the Short-term Primary 1 and Secondary 2 Noise Measurement SitesSite Address and/or Description DNL (dB) Lmax (dB)Primary SitesP1 155 Gertrude Ave, Warwick 71 104.4P2 137 Glen Drive, Warwick 58 82.7P3 67 Commodore Avenue, Warwick 72 98.6P4 82 Louisiana Avenue, Warwick 56 80.2Secondary SitesS1 49 Winman Court, Warwick 62 88.1S2 65 Alice Avenue, Warwick 60 91.9S3 103 Rosegarden Street, Warwick 68 86.7S4 267 Manolla Avenue, Warwick 58 81.9S5 17 Wilbur Street, Warwick 63 85.1S6 3 148 Grace Street, Cranston 59 93.6S7 276 Spring <strong>Green</strong> Drive, Warwick 60 84.3S8 71 Collingwood Drive, Warwick 59 86.6Source: HMMH, 2005, 2006.Note: Refer to Figure 4-2 for the noise measurement locations.1 Primary sites were in operation for the entire duration of study (August 8, 2005, to August 15, 2005).2 Secondary sites were each in operation for at least a 24-hour duration.3 No data for Site 6 was collected during the initial collection period.DNL Day-Night Average Sound Level.4.2.2.3 Vehicular Traffic NoiseVehicular traffic noise levels for the Baseline Condition were modeled at seven additional sites using anFHWA-approved noise prediction model. As shown in Table 4-5, measured “Traffic-only” (L eq) ranged from alow of 51 dBA along Astral Street in the Hoxsie neighborhood (Site R2) to a high of 73 dBA along Main Avenuein the <strong>Green</strong>wood neighborhood (Site R5). Observed sources of noise at each of the measurement sites includedtraffic on the existing roads, aircraft operations, birds, wind in the trees, and other community-related activities.At measurement sites in quieter locations that are farther from major roads (such as Site R8), contributions fromaircraft and other noise sources can be greater than the contributions from vehicular traffic on local streets,resulting in greater differences between the Total and the Traffic-only noise levels. As shown in Table 4-5, themeasured Total Leqat Site R8 was 61 dBA, while the Traffic-only Leqwas 55 dBA. Aircraft noise was the majornoise source at this site during this short-term monitoring program.Chapter 4 – Affected Environment 4-11 July 2011\\mawatr\ev\09228.00\reports\<strong>FEIS</strong>_Final_July_2011\<strong>PVD</strong>_CH04_Affected_Env_JUL_2011.doc
T.F. <strong>Green</strong> <strong>Airport</strong> <strong>Improvement</strong> <strong>Program</strong>Environmental Impact Statement and Final Section 4(f) EvaluationTable 4-5Summary of Short-term Roadway Noise MeasurementsSiteNo.DescriptionMeasuredTotal Leq(dBA)MeasuredTraffic-only Leq(dBA)Observed Noise SourcesR1 Senator St., Lincoln Park 54 54 Traffic on Tennessee Ave., birds, distant traffic, start of take-off for aircrafton Runway 23, compressor on commercial property to southR2 Astral St., Hoxsie 51 51 Wind in trees, distant traffic, birds, aircraft on approach to Runway 23R4 <strong>Airport</strong> Rd. at Harmony Ct., Hoxsie 67 67 Traffic on <strong>Airport</strong> Rd., aircraft on approach to Runway 23, start oftake-off, reverse thrustR5 Main Ave. at Earl St., <strong>Green</strong>wood 73 73 Traffic on Main Ave., aircraft departures from Runway 23R6 Main Ave. at Gladys Ct., <strong>Green</strong>wood 75 66 Traffic on Main Ave., aircraft departures from Runway 23R7 Alabama St., Lincoln Park 60 60 Traffic on Post Road, traffic on ramps to and from Route 37R8 Bellevue Ave. at Summit St., Hoxsie 61 55 Traffic on local streets, aircraft on approach to Runway 23Source: HMMH, 2006.Notes: Refer to Figure 4-2 for the location of the noise measurements. Site R3 was removed from the analysis.4.2.2.4 Supplemental Noise MetricsIn addition to DNL, RealContours 163 was used to compute supplemental noise metrics to further describe thenoise exposure characteristics for the Baseline Condition. These supplemental metrics are not required by theFAA, but were conducted in response to agency and public comments received during the scoping process.These metrics provide information that the DNL metric does not, such as the time that a particular locationexperiences noise above a specified level and the maximum noise level at each of the sites.Time-Above (TA) and L maxnoise metrics were modeled for each of the 12 noise measurement sites and allnon-residential noise-sensitive sites within the extents of the modeled radar tracks. Each of the 12 measurementsite locations are described in DEIS Appendix F.5, Noise Monitoring, and shown in Figure 4-2. Table 4-4 presentsthe L maxvalues at these monitoring sites under the Baseline Condition.In general, the highest modeled DNL values would occur at those sites closest to the <strong>Airport</strong> and most exposedto aircraft operations. Under the Baseline Condition, the modeled DNLs at the noise measurement sites rangefrom a low of 53 dB at Site S6 in Cranston to a high of 69 dB at Sites P1 and P3 in Warwick. Similarly, the highestL maxvalues would occur at those sites closest to the <strong>Airport</strong> and most exposed to aircraft operations. TheTA-65 dB, 75 dB and 85 dB metrics, L maxmetric, and DNL metric for each of the non-residential noise-sensitivesites are provided in Table F.7-2 of DEIS Appendix F.7, Supplemental Noise Metrics.163 RealContours TM is a pre-processor to the INM used in this analysis. RealContours TM converts radar data into INM input files for modeling allowing themodeling of all reported flights at the airport during the year. Further details can be found in Appendix F, Noise, of this <strong>FEIS</strong>.Chapter 4 – Affected Environment 4-12 July 2011\\mawatr\ev\09228.00\reports\<strong>FEIS</strong>_Final_July_2011\<strong>PVD</strong>_CH04_Affected_Env_JUL_2011.doc
T.F. <strong>Green</strong> <strong>Airport</strong> <strong>Improvement</strong> <strong>Program</strong>Environmental Impact Statement and Final Section 4(f) Evaluation4.3 Compatible Land UseThis section summarizes of the methodology of the land use inventory and briefly describes existing land useconditions, including land use compatibility and zoning within the Project and Study Areas.4.3.1 MethodologyLand use compatibility is defined by the FAA in 14 CFR 150, <strong>Airport</strong> Noise Compatibility Planning, as the “use ofland that is identified as normally compatible with the outdoor noise environment.” 164 Baseline Condition landuses and zoning within the Study Area were identified using the Rhode Island Geographic Information System(RIGIS) and parcel-level information provided by the City of Warwick Planning Department and City of CranstonPlanning Department. Field surveys and review of aerial photographs were used to confirm and update land useswithin the Study Area. U.S. Census Bureau information and City of Warwick Chamber of Commerce maps providedadditional information for the base map, such as roads, road names, public buildings, and land uses. Meetings wereheld with municipal planning departments to collect and further verify data. The Study Area for the compatible landuse assessment is the same as the Noise Study Area.A detailed noise analysis and land use compatibility assessment for the Baseline Condition was undertaken in orderto identify areas of existing non-compatible land uses within the Study Area based on criteria established by the FAAand HUD (i.e., land uses exposed to noise at or above DNL 65 dB). The FAA and HUD established the threshold ofland use compatibility at DNL 65 dB based on a nation-wide survey that measured public responses to aircraft noise,165,166in particular levels of annoyance in relation to aircraft noise. Several land use categories (residential, schools,outdoor music shells, etc.) are not considered to be compatible with noise levels of DNL 65 dB or higher. Where thecommunity determines that these uses must be allowed within the DNL 65 dB, the FAA recommends that a “noiselevel reduction” (NLR) be implemented to achieve compatible noise levels in new construction. Noise attenuationmeasures such as sound insulation, which reduce the noise level by 25, 30, or 35 DNL, must be implemented in thedesign and/or construction of a structure. Commercial, industrial, and agricultural uses, however, are considered tobe compatible with all noise levels and do not require NLR measures.Local and state land use plans were collected and analyzed in accordance with Section 2 of theExecutive Order 12372 - Intergovernmental Review of Federal <strong>Program</strong>s. 167 The Executive Order requires the FAA toconsider any existing plans of public agencies in the area in which the <strong>Airport</strong> is located includingcomprehensive plans adopted by municipalities. 168 Only those promulgated plans that are reasonably consistentwith the City Comprehensive Plan and consistent with the State Guide Plan are applicable. Table 4-6 lists landuse plans applicable to the Study Area.164 14 CFR Part 150, <strong>Airport</strong> Noise Compatibility Planning, paragraph 150.7.165 T.F. <strong>Green</strong> <strong>Airport</strong> Final 14 FAR Part 150 Noise Compatibility Study, prepared by Landrum & Brown, April 2000.166 Environmental Criteria and Standards of the Department of Housing and Urban Development, Department of Housing and Urban Development, 24 CFRPart 51; 44 Federal Register 40861, Washington DC, 12 July 1979.167 Executive Order 12372 - Intergovernmental Review of Federal <strong>Program</strong>s, 47 Federal Register 30959 (July 14, 1982).168 The FAA does not have the jurisdiction to adopt, amend, or repeal local zoning ordinances, issue or deny building permits, and has no police powers withregards to local land use. The objective of the review of these plans is to determine if the action proposed in this <strong>FEIS</strong> is consistent with local, regional,and state plans for development and growth.Chapter 4 – Affected Environment 4-13 July 2011\\mawatr\ev\09228.00\reports\<strong>FEIS</strong>_Final_July_2011\<strong>PVD</strong>_CH04_Affected_Env_JUL_2011.doc
T.F. <strong>Green</strong> <strong>Airport</strong> <strong>Improvement</strong> <strong>Program</strong>Environmental Impact Statement and Final Section 4(f) EvaluationTable 4-6Land Use PlansTitle Year Preparer HighlightsCity of Warwick Comprehensive Plan 1 2002 City of Warwick, Planning Department Provides land use recommendations for the <strong>Airport</strong>and surrounding area.Warwick Station Redevelopment Plan 1998 City of Warwick, Planning Department Provides guidelines for connecting rail and air traveland creation of <strong>Airport</strong> gateway.Apponaug Village Master Plan 2004 Apponaug Village <strong>Improvement</strong> Provides streetscape and traffic planningAssociationimprovements specifically for Apponaug Village.T. F. <strong>Green</strong> Economic Development Plan 1996 Warwick and Central Rhode Island Identifies objectives for the four business districtsDevelopment Corporationssurrounding the <strong>Airport</strong>.City of Cranston, Rhode Island 1992 City of Cranston; City Planning No recommendations related to T.F. <strong>Green</strong> <strong>Airport</strong>.Comprehensive PlanCommissionLand Use 2025: Rhode Island’s State Land 2006 State of Rhode Island Department Recommends development of land in immediateUse Policies and Plan, The RI, State Guide of Administration, Division of vicinity of airports be compatible with airportPlan Statewide Planning <strong>Program</strong> operations, and to minimize adverse impacts relatedto airports on pre-existing land uses.City of Warwick Rhode Island Consolidated 2005 Scott Avedisian, Mayor Outlines goals and priorities to address the City’sPlan/Action Plan, 2005-2009affordable housing needs and presents an actionplan for the implementation of CommunityDevelopment Block Grant funding.Rhode Island Five-Year Strategic Housing 2006 Rhode Island Division of Planning Recommends a policy that subsidized Low- andPlan: 2006-2010Moderate-Income Housing units should be replacedon a one-for-one basis and that the State HousingResources Commission is charged with introducinglegislation to that effect in 2007.Draft State Guide Plan Element 640: State of 2011 State of Rhode Island Department The proposed element represent’s RIAC’s plan forRhode Island <strong>Airport</strong> System Plan of Administration, Division of the state airport system through the year 2021.Statewide Planning <strong>Program</strong>Sources: City of Warwick Planning Department; City of Cranston Planning Commission; State of Rhode Island Department of Administration; Central Rhode IslandDevelopment Corporation.1 The City of Warwick initiated an update to its Comprehensive Plan in 2010.4.3.2 Affected EnvironmentThe land use compatibility analysis examined general land uses and zoning districts within both the ProjectArea (the area of potential direct impacts) and the Study Area.4.3.2.1 General Land UsesFigure 4-6 shows the existing general land uses surrounding the <strong>Airport</strong>. The Project Area mostly consists of the<strong>Airport</strong> (63 percent); residential uses represent the second-largest land use type (12 percent) and commercialand industrial land uses represent the third largest (7 percent). Residential land uses are the most prominentland use of the Study Area encompassing 30 percent. The <strong>Airport</strong> is the second-largest land use (17 percent).Commercial and industrial land uses are the third-largest land use within the Study Area (16 percent). 169Table 4-7 summarizes the land uses in the Project and Study Areas. Land uses directly surrounding the <strong>Airport</strong>on the northern, eastern, and southern sides are primarily residential. The majority of the residential land use is169 This land use includes “Commercial”, “Commercial/Industrial Mixed”, and “Industrial” categories of land uses.Chapter 4 – Affected Environment 4-14 July 2011\\mawatr\ev\09228.00\reports\<strong>FEIS</strong>_Final_July_2011\<strong>PVD</strong>_CH04_Affected_Env_JUL_2011.doc
T.F. <strong>Green</strong> <strong>Airport</strong> <strong>Improvement</strong> <strong>Program</strong>Environmental Impact Statement and Final Section 4(f) Evaluationsingle-family; however, there is also some multi-family housing within the Study Area. Uses along the majorroads around the perimeter of the <strong>Airport</strong>, and on the western side, are predominantly commercial and lightindustrial. There are pockets of residential uses mixed among the commercial areas on the western side of the<strong>Airport</strong>. Several areas of open space in the form of developed recreation (i.e., parks, playgrounds, ball-playingfacilities); agricultural land; and natural open spaces (i.e., wetlands, beaches, brushland, forested areas, waterbodies) exist around the <strong>Airport</strong>.Table 4-7Land Uses in Project Area and Study AreaStudy AreaProject AreaLand Use Acres Percentage Land Use Acres PercentageResidential 1,832 30% <strong>Airport</strong> 1,023 63%<strong>Airport</strong> 1,063 17% Residential 191 12%Commercial/Industrial Total 991 16% Commercial/Industrial Total 118 7%Commercial 450 7% Commercial 61 4%Industrial 343 6% Commercial/Industrial Mixed 51 3%Commercial/Industrial Mixed 198 3% Industrial 6 0.4%Roads/Highway 975 16% Roads/Highways 129 8%Undeveloped 1 563 9% Agriculture 86 5%Open Water 327 5% Undeveloped 68 4%Institutional 179 3% Open Water 10 0.6%Agriculture 95 2% Institutional 7 0.4%Other Transportation 48 1% Federal 3 0.2%Cemeteries 38 0.6%Federal 15 0.2%Municipal 12 0.2%Waste Disposal 1 0.0%Total 6,139 100% Total 1,636 100%Source: RIGIS – field verification by VHB, Inc., 2005; City of Warwick Assessor’s Parcel Data.1 “Undeveloped” includes: wetlands; forested; developed recreation/open space; undeveloped parcels; and beaches.4.3.2.2 Zoning DistrictsFigure 4-7 shows the Baseline Condition zoning districts surrounding the <strong>Airport</strong>. Table 4-8 lists the zoningcategories and City of Warwick zoning districts. Most of the areas north and west of the <strong>Airport</strong> are zoned forcommercial and/or industrial uses, which, according to FAA criteria, are compatible with <strong>Airport</strong> operations.Residential zoning districts south of the <strong>Airport</strong> in the neighborhood of <strong>Green</strong>wood and east in the Hoxsieneighborhood allow land uses that are considered incompatible with noise levels.4.3.2.3 Land Use CompatibilityTable 4-9 summarizes these land uses that are exposed to noise levels at or above DNL 65 dB. Refer to Figure 4-8for the location of these land uses.Chapter 4 – Affected Environment 4-15 July 2011\\mawatr\ev\09228.00\reports\<strong>FEIS</strong>_Final_July_2011\<strong>PVD</strong>_CH04_Affected_Env_JUL_2011.doc
T.F. <strong>Green</strong> <strong>Airport</strong> <strong>Improvement</strong> <strong>Program</strong>Environmental Impact Statement and Final Section 4(f) EvaluationTable 4-8City of Warwick Generalized ZoningGeneralized CategoryZoning DistrictOpen SpaceOpen Space DistrictSingle-family Residential Residence A-40 District, Residence A-15 District, Residence A-10 District, Residence A-7 DistrictCommercialOffice District, Waterfront Business District, General Business DistrictIndustrialLight Industrial District, General Industrial DistrictTransportationWarwick Station Intermodal Zone, Warwick Station Gateway ZoneSource: Appendix A, Zoning, of the Code of Ordinances, City of Warwick, Rhode Island, published by the order of City Council, 1995 (reprinted in 2005).Table 4-9Land Use Exposed to DNL 65 dB or Greater (Baseline Condition)Land Use Acres Percentage<strong>Airport</strong> 733 63%Residential 1 223 19%Roads/Highways 105 9%Undeveloped 44 4%Agriculture 15 1%Commercial/Industrial Mixed 12 1%Commercial 12 1%Institutional 11 1%Industrial 11 1%Federal 3 0.3%Open Water 2 0.1%Waste Disposal 0.5 0.0%Cemeteries 0.0 0.0%Total 1,171 100.0%Notes: All land uses fall within the City of Warwick. Refer to Figure 4-8 for the location of the land uses exposed to DNL 65 dB or greater in 2004.Both the U.S. Department of Housing and Urban Development (HUD) and the FAA define DNL 65 dB as the threshold of noise incompatibility with residential landuses. Based on INM Version 6.1 and the 2004 noise contours.1 Incompatible land uses are in bold text.The total acreage of land exposed to noise levels of DNL 65 dB and above in 2004 includes approximately1,171 acres, or 19 percent of the overall Study Area and 72 percent of the Project Area. There are approximately223 acres of residential, or non-compatible, land exposed to DNL 65 dB and above noise levels in 2004.According to the FAA, community facilities such as schools, libraries, auditoriums, nursing homes, medical facilities,and places of worship (in addition to residential and parks and other recreational uses) are considered noise-sensitiveareassince elevated noise from <strong>Airport</strong> activities may interfere with activities associated with these uses. 170 There are24 places of worship (two of which were previously sound insulated), 22 educational institutions, including schoolsand daycare facilities (five of which were previously sound insulated), three libraries, and one assisted livingfacility/nursing home within the Study Area. The Project Area includes three places of worship, three educational170 FAA Order 1050.1E, Environmental Impacts: Policies and Procedures, U.S. Department of Transportation, March 20, 2006, Appendix A, Table 1, Page A-15.Chapter 4 – Affected Environment 4-16 July 2011\\mawatr\ev\09228.00\reports\<strong>FEIS</strong>_Final_July_2011\<strong>PVD</strong>_CH04_Affected_Env_JUL_2011.doc
T.F. <strong>Green</strong> <strong>Airport</strong> <strong>Improvement</strong> <strong>Program</strong>Environmental Impact Statement and Final Section 4(f) Evaluationinstitutions, and one assisted living facility/nursing home. Figure 4-9 shows the noise-sensitive land uses within theStudy and Project Areas. Non-residential noise-sensitive community facilities incompatible with baseline <strong>Airport</strong>noise (exposed to DNL 65 dB and above noise levels for 2004) are discussed in Section 4.2, Noise.4.4 Social and Socioeconomic, and Environmental Justice and Children’s Healthand Safety RisksThis section provides an overview of the regulatory jurisdiction and the methodology for the Baseline Conditionsocial and socioeconomic, and environmental justice population assessment and children’s health and safetyrisks, describes those conditions in the T.F. <strong>Green</strong> <strong>Airport</strong> Project Area.4.4.1 MethodologyThe following section provides an overview of the methodologies for the social, socioeconomic, environmentaljustice population, and children’s health and safety Baseline Condition assessment.4.4.1.1 Social and Socioeconomic Assessment MethodologyDemographic and socioeconomic trend data and information (including age, income, household size, andhousing affordability) were provided by DemographicsNow (a private firm that reformats and forecasts datacompiled by the U.S. Census Bureau), 171 and the Rhode Island Department of Labor and Training (RIDLT) todefine the characteristics and trends of the general demographic and socioeconomic conditions surrounding the<strong>Airport</strong>. Based on available data, 2004 estimates and trend estimates between 1990 and 2000 have been providedfor most demographic indicators. 172 Housing research included a review of the 2004 American CommunitySurvey and realtor data, as well as data provided by the Rhode Island Housing and Mortgage FinanceCorporation. Where data were available, projections have been provided to 2009.The business and employment analysis is based on data from the City of Warwick and City of CranstonAssessor's departments, special tabulations of Census of Employment and Wages data provided by the RIDLT(also known as the ES-202 data series) and field reconnaissance information. The Baseline Condition economicconditions of the Study Area in the context of the surrounding economic region were examined by comparingthe industry composition in the Study Area to the economies of City of Warwick, the region (the Cities ofWarwick and Cranston combined) and the State of Rhode Island. Commercial real estate analyses were based onobservations made through field reconnaissance, interviews with local commercial real estate brokers anddevelopers, the State of Rhode Island Economic Development Corporation, and the Central Rhode Island Chamberof Commerce, as well as tax assessment data from the City of Warwick.Regional Economic Study AreaThe social and socioeconomic conditions assessment includes comparisons of local and state data to regionaldemographic and economic data to provide context for the baseline analysis. The baseline demographic andeconomic conditions of the Study Area in the context of the surrounding larger region were examined bycomparing these conditions to the Cities of Warwick and Cranston, Kent and Providence Counties, and the State171 Demographic Detail Summary Report for the Year 2004, DemographicsNow.com. 2005.172 Statewide demographic data for 2004 are not available. This EIS uses the most current U.S. Census data available and appropriate for the communityanalysis. In general, the 2000 U.S. Census data is the most complete as it includes data from all households that completed census forms that year.Chapter 4 – Affected Environment 4-17 July 2011\\mawatr\ev\09228.00\reports\<strong>FEIS</strong>_Final_July_2011\<strong>PVD</strong>_CH04_Affected_Env_JUL_2011.doc
T.F. <strong>Green</strong> <strong>Airport</strong> <strong>Improvement</strong> <strong>Program</strong>Environmental Impact Statement and Final Section 4(f) Evaluationof Rhode Island. As part of a broader study area, these counties were selected because the City of Warwick (andthe <strong>Airport</strong>) is in Kent County, and the City of Cranston is in Providence County. For the purposes of businessesand employment analysis, the regional economic study area is defined as Kent and Providence Counties or,where applicable, the State of Rhode Island, depending on the analysis.4.4.1.2 Environmental Justice Population Assessment MethodologyMethods for identifying environmental justice populations followed the guidelines of Rhode Island StatewidePlanning <strong>Program</strong>. In the Rhode Island Transportation <strong>Improvement</strong> <strong>Program</strong> (TIP), 173 Statewide Planning usesthe state average of minority, Hispanic, and low-income populations to define environmental justicepopulations. The TIP thresholds were used to define the environmental justice populations and environmentaljustice neighborhoods identified.The concept of race does not include the concept of Hispanic origin. The U.S. Census Bureau directs users of theU.S. Census data to avoid combining race categories with Hispanic. The U.S. Census Bureau collects separatedata on Hispanic populations in addition to data on minority populations. Therefore, this analysis addressesminority and Hispanic populations separately. State averages for minority, Hispanic, and low-incomepopulations are shown in Table 4-10.Table 4-10Statewide Averages for Environmental Justice PopulationsEnvironmental Justice PopulationStatewide AverageBlack or African-American 4.5%American Indian and Alaska Native 0.5%Asian 2.3%Native Hawaiian and Other Pacific Islander 0.1%Some Other Race 5.0%Mixed Race 2.7%Total Minority 15.0%Hispanic 8.7%Low-Income 11.9%Source: 2000 U.S. Census Bureau. Although some 2010 census data was released in March 2011, a sufficient level ofcensus data for the <strong>FEIS</strong> analysis was not released prior to the filing of the <strong>FEIS</strong>.Minority, Hispanic, and low-income populations were identified using 2000 U.S. Census data for the StudyArea. Since the U.S. Census collects separate data on Hispanic populations in addition to data on minoritypopulations, the demographic analysis addresses minority and Hispanic populations separately. Minority andHispanic populations were identified using census block data, the smallest unit for which population data areavailable. Low-income populations were identified using census block group data, the smallest unit for whichincome data are available. All census blocks and census block groups that fall within or partially within theareas of significant impact were included. Census blocks are a subset of census block groups. The 2000 U.S.Census Data identifies census blocks and census block groups above the State of Rhode Island average forminority, Hispanic, and low-income populations in various neighborhoods surrounding T.F. <strong>Green</strong> <strong>Airport</strong>. A173 State of Rhode Island and Providence Plantations Transportation <strong>Improvement</strong> <strong>Program</strong> 2003-2004, Rhode Island Statewide Planning <strong>Program</strong>, Adopted August 8, 2002.Chapter 4 – Affected Environment 4-18 July 2011\\mawatr\ev\09228.00\reports\<strong>FEIS</strong>_Final_July_2011\<strong>PVD</strong>_CH04_Affected_Env_JUL_2011.doc
T.F. <strong>Green</strong> <strong>Airport</strong> <strong>Improvement</strong> <strong>Program</strong>Environmental Impact Statement and Final Section 4(f) Evaluationboundary of “maximum area of land acquisition,” which includes proposed areas of mandatory and voluntaryland acquisitions, was also used to more specifically identify impacts to environmental justice populations.4.4.1.3 Affordable Housing Assessment MethodologyAlthough not required by FAA Orders of CEQ regulations, in response to a request by the City of Warwick theT.F. <strong>Green</strong> <strong>Airport</strong> <strong>Improvement</strong> <strong>Program</strong> was evaluated in terms of its potential impact to affordable housing.For the Baseline Condition, residential properties within the Project and Study Areas were evaluated to see ifthey meet the State of Rhode Island definition of affordable housing (refer to Appendix G.2, Affordable HousingAnalysis, for the state definitions). Consideration was also given to low-and moderate-income housing that issubsidized by a municipal, state or federal source, and/or is managed by a public entity or non-profitorganization. This assessment provides the Baseline Condition as context for assessing whether the<strong>Improvement</strong> <strong>Program</strong> would result in substantial reductions of the subsidized housing stock with noreplacement options or would significantly impact housing affordability by removing a substantial numberof affordable housing units from the City of Warwick’s housing stock.4.4.2 Affected EnvironmentThis section provides an overview of the Baseline Condition for social and socioeconomic conditions,environmental justice populations, and children’s health and safety as context for the environment in which theT.F. <strong>Green</strong> <strong>Airport</strong> <strong>Improvement</strong> <strong>Program</strong> would occur.4.4.2.1 Economic ConditionsThis Study Area has substantial commercial and industrial activity, accounting for almost half of Warwick’semployment, 36 percent of the City’s commercial tax base, and 45 percent of its commercial establishments.The <strong>Airport</strong> is an important component of the existing economic base for the Cities of Warwick and Cranston,the larger regional economy, and the State of Rhode Island. A notable amount of this commercial activity isairport-related and this activity occurs in the 89 airport-dependent establishments which employ more than3,400 people, as well as the 474 aviation-reliant firms which provide nearly 5,100 of the 25,300 jobs in the StudyArea. Figure 4-10 shows the airport-related businesses within the Study Area.Business and Employment ProfileThe general economies of the Study Area and State of Rhode Island are similar with the exception of transportationand related industries which are five times more concentrated in the Study Area than in the State as a whole. Othersectors that are airport-dependent or aviation-reliant and are slightly stronger in the Study Area than the Stateinclude wholesale trade, accommodation and food services, and construction. Figure 4-11 presents the general sectorsof employment in the Study Area (excluding government employment) compared with the State.In 2004, the combined economies of the Cities of Warwick and Cranston included approximately 77,000employees in 5,800 firms. Approximately ten percent of jobs in Warwick were filled by workers commutingfrom Cranston, indicating that there is an important economic relationship between the cities. Warwick is theretailing center of the State of Rhode Island. Warwick has two super-regional malls just outside of the StudyArea: Warwick Mall and the Rhode Island Mall. 174 Both are on Bald Hill Road near the junction of I-95 and I-295.174 The Rhode Island Mall is the former Midland Mall, and is the site of 11 stores, including Wal-Mart, Kohl’s and Sears. Previously, the Midland Mall housedmore than 100 stores.Chapter 4 – Affected Environment 4-19 July 2011\\mawatr\ev\09228.00\reports\<strong>FEIS</strong>_Final_July_2011\<strong>PVD</strong>_CH04_Affected_Env_JUL_2011.doc
T.F. <strong>Green</strong> <strong>Airport</strong> <strong>Improvement</strong> <strong>Program</strong>Environmental Impact Statement and Final Section 4(f) EvaluationThe Study Area has a number of smaller shopping plazas along Post Road and Warwick Avenue including<strong>Airport</strong> Plaza, Wal-Mart, Ann & Hope Curtain and Bath Outlet, the Gateway Shopping Center, and theGovernor Francis Shopping Center. Many independent retail and local service firms operate from older stripmall centers and from converted residential buildings in the Study Area.In 2004, the Study Area supported approximately 25,000 non-governmental jobs in 1,500 establishments.Manufacturing and service sectors account for the largest share of establishments, and jobs and transportationservices are the Study Area’s largest employment sector with 3,200 jobs. 175 In 2004, the transportation servicesemployment in the Study Area was three times that found in the combined Warwick and Cranston economiesand five times higher than in the State of Rhode Island as a whole. The Study Area captures Warwick’s entireemployment base in air transportation and courier services. Moreover, three of the four post offices in the Cityare in the Study Area, including a major U.S. Postal Service mail sorting facility on Strawberry Field Road.In 2004, the Study Area, anchored by the <strong>Airport</strong>, was the major economic component of Warwick and continues tobe today. Under the Baseline Condition, the Study Area businesses (1,477 total) account for almost half of Warwick’sbusiness establishments and employment base (25,310 employees total) while consisting of less than 25 percent ofWarwick’s total land area.Additional sectors that are more prevalent in the Study Area than in Warwick as a whole include manufacturing,freight services, ground passenger transportation, wholesaling, accommodations, and construction. Each of thesesectors is also likely to be heavily influenced by the <strong>Airport</strong>. Finance and insurance sectors are also moreprominent industries in the economy of the Study Area than Warwick as a whole. Conversely, services, retailtrade, and food services are less prominent in the economy of the Study Area than in the City as a whole.Aviation Business and Employment ProfileThe <strong>Airport</strong>-specific analysis is presented in three categories: airport-dependent, aviation-reliant and other. “<strong>Airport</strong>dependent”jobs are those that are located in the Study Area to serve aviation businesses at the <strong>Airport</strong> or travelers whouse the <strong>Airport</strong>. 176 “Aviation-reliant” businesses use air transportation more intensively than seen in the generaleconomy for transporting goods and for business travel and are typically located in close proximity to an airport. 177“Other” industries in the Study Area are those that serve local or regional needs, such as restaurants located off-<strong>Airport</strong>.Figure 4-10 shows the location of and Table 4-11 lists the airport-related businesses within the Study Area. 178<strong>Airport</strong>-dependent businesses within the Study Area total 89 firms and account for 3,380 airport-dependent jobs.Aviation-reliant businesses in the Study Area total 474 firms and employ 5,080 people. Of the total Study Area,airport-dependent industries and aviation-reliant businesses account for 38 percent of all businesses and 33 percent ofall employment, and pay out $350 million in wages (36 percent of wages). 179 Table 4-12 lists industries that areclassified as airport-dependent and gives examples of these types of businesses in the Study Area.175 Services sector includes professional and technical services, educational services, administrative services, health care, social assistance, repair andmaintenance services, and personal services.176 These industries have been identified on the basis of economic studies of airports nationally, including Massachusetts, Vermont, Colorado, Arizona, andVirginia. This portion of the analysis will be reexamined when the economic study of the airport now underway is completed by RIAC.177 These industries are identified on the basis of national data published by the U.S. Department of Commerce and the U.S. Bureau of Transportation Statistics thatreport industries that are major consumers of air transportation services, and therefore most likely to locate in close proximity to an airport.178 The 2006 RIAC economic impact study documents 2,318 jobs on the T.F.<strong>Green</strong> <strong>Airport</strong>, including 418 Warwick residents. Given the detail of data in thestudy, it is not certain how many jobs would be double-counted if these on-airport jobs were added to those jobs identified as “aviation-dependent.”179 <strong>Airport</strong>-related businesses include airport-dependent and aviation-reliant.Chapter 4 – Affected Environment 4-20 July 2011\\mawatr\ev\09228.00\reports\<strong>FEIS</strong>_Final_July_2011\<strong>PVD</strong>_CH04_Affected_Env_JUL_2011.doc
T.F. <strong>Green</strong> <strong>Airport</strong> <strong>Improvement</strong> <strong>Program</strong>Environmental Impact Statement and Final Section 4(f) EvaluationTable 4-11<strong>Airport</strong>-dependent and Aviation-reliant Businesses in the Study AreaBusiness Establishments Employment WagesNumberClassification Number Percent Number Percent (millions) Percent<strong>Airport</strong>-dependent 89 6% 3,380 13% $106 11%Aviation-reliant 474 32% 5,080 20% $248 26%Total Aviation Related 563 38% 8,460 33% $354 36%Other (not aviation related) 913 62% 16,841 67% $616 64%Total Study Area 1,476 100% 25,301 100% $970 100%Source: 2004 Census of Employment and Wages provided by the Rhode Island Department of Labor and Training. Estimates of annualized data and classifications ofindustries developed by EDR Group. Rhode Island <strong>Airport</strong> Economic Impact Study-Update 2006, Wilbur Smith Associates for the Rhode Island <strong>Airport</strong>Corporation was used to document retail and restaurant jobs at the T.F. <strong>Green</strong> <strong>Airport</strong>.Note: Numbers may not add due to rounding for annual averages.Table 4-12<strong>Airport</strong>-dependent Industries in the Study AreaSectorPassenger car rentalScheduled passenger air transportationHotels and motelsCouriersTaxi serviceFood service contractorsOther ground transportationNonscheduled air passenger charteringFreight transportation arrangementParking lots and garagesTravel agenciesSecurity guards and patrol servicesOther support activities for air transportOther petroleum merchant wholesalersOther airport operationsFlight trainingCommunications equipment repairNonscheduled air freight charteringRetail and restaurants that are locatedon-<strong>Airport</strong>Source: EDR Group.DescriptionEstablishments that rent passenger cars without drivers to airport passengers, generally for short periods of timeAir transportation of passengers or passengers and freight over regular routes and on regular schedulesShort-term lodging places for airport passengers and flight crewsLocal messenger and delivery services of small items (includes auto and bicycle messengers)Local taxi companies that serve the airportCompanies that provide airlines with in-flight snacks, meals and beverages<strong>Airport</strong> shuttles and chauffeured limousines for hireFlights organized directly from the departure location to the destination, arranged by business and private passengers on anas-needed basisFreight forwarders, truck dispatchers and logistics companiesShort- and long-term parking for airport passengers and employeesAgencies that arrange personal and business travelTransportation Security Administration (on-airport), and private off-airport security, such as security at long-term parking areasAircraft ferrying, inspection, testing, fueling, maintenance, and repair; Independent air pilot (except owner-operators)Vendors of jet fuel and aviation gasAircraft parking/hangar rental; baggage/cargo handling services; runway maintenance and vacuuming; <strong>Airport</strong> and flying fieldoperators; Aviation clubsEstablishments that offer vocational or recreational flight trainingCompanies able to repair the complex communications equipment used by airplanes, air traffic control and other airportoperationsFlights organized directly from the departure location to the destination, arranged by business to move cargo on an asneeded basisThese establishments serve airport employees, employees of airport tenants and passengers.Chapter 4 – Affected Environment 4-21 July 2011\\mawatr\ev\09228.00\reports\<strong>FEIS</strong>_Final_July_2011\<strong>PVD</strong>_CH04_Affected_Env_JUL_2011.doc
T.F. <strong>Green</strong> <strong>Airport</strong> <strong>Improvement</strong> <strong>Program</strong>Environmental Impact Statement and Final Section 4(f) EvaluationLand Values and Property TaxesTable 4-13 presents the Baseline Condition land values and property tax revenue for residential and commercialproperties in the Study Area in order to understand the level of tax revenue paid to the City of Warwick.Table 4-13Study Area Commercial Land Use Value and Taxes (Baseline Condition)NumberofParcelsLandValue ($ million)BuildingTotalAssessedValue% of TotalStudy AreaAssessedValueTax RevenuesPropertyTaxRevenue($ million)% of TotalStudy AreaTaxRevenueCommercial Land Uses 1,518 $269 $612 $880 32% $15 36%Subtotal Commercial Land Uses- <strong>Airport</strong>-Related 1 128 $122 $205 $327 12% $3 7%Non-Commercial Land Uses 10,808 $605.8 $1,275.5 $1,881.4 68% $26.3 64%Subtotal Non-Commercial Land Uses Residential 2 9,662 $529 $1,096 $1,624 59% $24 59%Total Study Area Property Values Tax Revenue 12,326 $874.8 $1,887.5 $2,761.4 100% $41.3 4 100%Source: City of Warwick Tax Assessor’s database (2004).1 Includes parcels with airport-related uses such as car rental, hotels, and long-term parking, which is different from "airports and associated facilities."2 Includes High Density Residential (
T.F. <strong>Green</strong> <strong>Airport</strong> <strong>Improvement</strong> <strong>Program</strong>Environmental Impact Statement and Final Section 4(f) EvaluationDemographic and Household CharacteristicsTables 4-14 and 4-15 summarize the demographic and housing characteristics of the Study Area compared tothe Cities of Warwick and Cranston, and the region. Generally, the Study Area is similar to Warwick, Cranston,and the region in most demographic elements. However, the Study Area differs by a slightly decreasingpopulation over time and having a higher percentage of non-minority (white) residents, generally olderhouseholds, lower household incomes (with the except as compared to the region), lower valued housing stock,and higher residential rental rates.Table 4-14Demographic Characteristics of the Study Area Compared to Warwick, Cranston,and the RegionStudy Area Warwick Cranston Region 1Population 32,549 88,324 81,285 817,573Growth Rate (since 2000) 2.4% 3.1% 2.6% 3.9%Race/Ethnicity 95% White 95% White 89% White 82% WhiteMedian Age 41.5 41.7 40.0 37.5Median Age of Head of Household 51.9 51.4 50.2 48.5Median Household Income $47,117 $49,947 $47,694 $42,461Number of Households 13,618 37,261 32,071 322,344Average Household Size 2.35 2.34 2.39 2.45Source: DemographicsNow.Note: Data is based on the year 2004.1 Kent and Providence Counties.Table 4-15Residential Housing Stock Characteristics of the Study Area Compared to Warwick,Cranston, Region, and the StateStudy Area Warwick Cranston Region StateHousing Units 14,059 38,892 33,198 339,333 462,587Percent Owner-occupied 75% 75.8% 1 66.8% 44.9% 60.3%Single-unit Structures 77.5% 75.7% 63.1% 52.6% 58.8%Multi-family Structures 22.5% 24.3% 36.9% 47.4% 41.3%Median Value /Owner-occupied $204,700 $222,000 $230,000 $234,000 $264,700Monthly Cash Rent $742 $734 $642 $558 $578Source: U.S. Census (2000) and DemographicsNow.1 2008 Owner occupied, Source: movetowarwickri.com.Chapter 4 – Affected Environment 4-23 July 2011\\mawatr\ev\09228.00\reports\<strong>FEIS</strong>_Final_July_2011\<strong>PVD</strong>_CH04_Affected_Env_JUL_2011.doc
T.F. <strong>Green</strong> <strong>Airport</strong> <strong>Improvement</strong> <strong>Program</strong>Environmental Impact Statement and Final Section 4(f) EvaluationAccording to 2004 American Community Survey data, an estimated 129,820 households were housingcost-burdened in Rhode Island. 180 In 2008, an estimated 143,280 households were housing cost-burdened,according to a more recent American Community Survey, representing an approximately 10 percent increasefrom 2004. Table 4-16 summarizes housing affordability of the Study Area compared to the Cities of Warwickand Cranston, and the region, according to the U.S. Census of 2000. 181Table 4-16Housing Cost Burdened Households in 2000: Study Area Compared to Cranston, Warwick,the Region, and Rhode IslandRenters paying 30%+of incomeRenters paying 50%+of incomeOwners paying 35%+of incomeOwners paying 50%+of incomeGeographic Area Percent Number Percent Number Percent Number Percent NumberRhode Island 39% 59,467 19% 28,844 17% 34,615 8% 15,937Region 1 40% 48,903 19% 24,059 17% 24,249 8% 11,186Cranston 35% 3,551 16% 1,603 19% 3,332 9% 1,623Warwick 34% 3,333 15% 1,487 17% 4,128 8% 1,890Study Area 40% 1,181 19% 552 17% 1,595 8% 684Source: 2000 U.S. Census.1 Kent and Providence Counties.4.4.2.3 Affordable HousingThe distribution of subsidized housing within the Project Area and Study Area was documented at the requestof the City of Warwick (Table 4-17, Figure 4-12). Under the Baseline Condition, there were 647 publiclysubsidized housing units in the Study Area (including the Project Area), including elderly (633 units), specialneeds (13 units), and subsidized family housing (1 unit). 182 There were 18 units of elderly rental (WarwickTerrace Annex located at 124 Tennessee Avenue) within the Project Area. The 647 publicly subsidized housingunits represent approximately 33 percent of the 1,944 total subsidized housing units in Warwick. Subsidizedhousing units represent 5.2 percent of the 2004 City of Warwick’s estimated total housing stock.180 Renters who pay more than 30 percent of their income for housing and homeowners paying more than 35 percent of their income for mortgage paymentsare generally considered “cost-burdened” as they may have difficulty affording necessities such as food, clothing, transportation, and medical care.181 The most recently available data on housing cost burdened households in the State of Rhode Island comes from the American Community Survey, whichis at a statewide level. Public data for Warwick and Cranston is available only from the 2000 Census. Although some 2010 census data was released inMarch 2011, a sufficient level of census data for the <strong>FEIS</strong> analysis was not released prior to the filing of the <strong>FEIS</strong>.182 This represents a Baseline Condition for context only. The Warwick Housing Authority indicated that a 26-unit elderly housing complex (Father OlsenTerrace) was discontinued in 2006, reducing the total to 621 subsidized housing units (607 elderly units) in the Study Area.Chapter 4 – Affected Environment 4-24 July 2011\\mawatr\ev\09228.00\reports\<strong>FEIS</strong>_Final_July_2011\<strong>PVD</strong>_CH04_Affected_Env_JUL_2011.doc
T.F. <strong>Green</strong> <strong>Airport</strong> <strong>Improvement</strong> <strong>Program</strong>Environmental Impact Statement and Final Section 4(f) EvaluationTable 4-17 Publicly Subsidized Housing in the Project Area and Study Area 1Number CustomerName Location 2 of Units Type Tenure Subsidy SourceCharles Ford Terrace 25 Easton Avenue 35 Elderly Rental Warwick Public HousingCranberry Pond 955-959 Post Road 97 Elderly Rental Rhode Island Home/ Section 8Father Olsen Terrace3 2432 Post Road 26 Elderly Rental Warwick Public Housing<strong>Green</strong>wood Terrace 2426 Post Road 53 Elderly Rental Tax Credit/Rhode IslandHousing Section 8Meadowbrook Terrace & Annex 2220 Warwick Avenue 180 Elderly Rental Warwick Public HousingWarwick House of Hope 645 Jefferson Boulevard 2 Special needs Rental Rhode Island Housing HOME 5Fran Conway House of Hope4 645 Jefferson Boulevard 11 Special needs Rental – Single Rhode Island Housing HOME 5Room OccupancyWarwick House of Hope 101 Michigan Avenue 1 Family Homeownership Rhode Island Housing HOME 5Warwick Terrace 2215 Elmwood Avenue 100 Elderly Rental Warwick Public HousingWest Shore Terrace 3070 West Shore Road 124 Elderly Rental Warwick Public HousingWarwick Terrace Annex 124 Tennessee Avenue 18 Elderly Rental Warwick Public HousingTotal 647Source: Rhode Island Housing data. Data on percentage of current tenants with incomes at or below 50 percent Area Median Income in Warwick Housing Authorityproperties was provided by Warwick Housing Authority. Information on Warwick House of Hope development project at 645 Jefferson Boulevard via personalcommunication with Jean Lamb, Director of Development, Warwick House of Hope, September 15, 2005.Note: All units are in the City of Warwick.1 Resources located in the Project Area are in bold text.2 Refer to Figure 4-12.3 Per personal communication with the Warwick Housing Authority on May 14, 2009, this property was sold to the New England Technical Institute in 2006 (actualdate unavailable) and is no longer used as subsidized housing.4 House of Hope completed this project in November of 2005.5 The Rhode Island Housing agency’s HOME program offers grants and low-interest loans to encourage the construction or rehabilitation of affordable houses and apartments.4.4.2.4 Environmental Justice PopulationsThe 2000 U.S. Census identifies census blocks and census block groups above the State of Rhode Island averagefor minority, Hispanic, and low-income populations in various neighborhoods surrounding T.F. <strong>Green</strong> <strong>Airport</strong>.Minority, Hispanic, and low-income communities in the vicinity of the <strong>Airport</strong> are shown on Figure 4-13. Oneminority census block and one Hispanic census block are located in the <strong>Green</strong>wood neighborhood near theRunway 5 End. Two Hispanic census blocks are located near Strawberry Field Road; one west and one east of theRunway 5 End. Three minority census blocks are located near the northwest corner of Warwick Pond.Five minority census blocks, two Hispanic census blocks, and one census block that is both minority and Hispanicare located in the Spring <strong>Green</strong> neighborhood near the Runway 23 End. One Hispanic census block is locatednorth of <strong>Airport</strong> Road and east of Evergreen Drive. Two minority census blocks, two Hispanic census blocks, andone low-income census block group are located west of Post Road near the Runway 16 End. With the exception ofthe area west of Post Road on the Runway 16 End, the census blocks and census block groups below the statewideaverages for environmental justice populations greatly outnumber those census blocks and census block groupsabove the averages. 183183 On the Runway 5 and 23 Ends, there is an Asian population that constitutes a minority population as that term is defined in the DOT Order 5610.2.Chapter 4 – Affected Environment 4-25 July 2011\\mawatr\ev\09228.00\reports\<strong>FEIS</strong>_Final_July_2011\<strong>PVD</strong>_CH04_Affected_Env_JUL_2011.doc
T.F. <strong>Green</strong> <strong>Airport</strong> <strong>Improvement</strong> <strong>Program</strong>Environmental Impact Statement and Final Section 4(f) EvaluationThere are three minority census blocks and two Hispanic census blocks that fall within the land acquired underthe Completed Part 150 VLAP. There are no low-income census block groups within the Completed Part 150VLAP Areas. Table 4-18 shows the populations within the current acquisition areas.Table 4-18Completed Part 150 Voluntary Land Acquisition <strong>Program</strong> Impacts Affecting EnvironmentalJustice PopulationsCompleted Part 150 VLAP AreasState-Environmental Justice Population 1 1 2 3 4 2 5 6 7 Total wide Avg.Total Minority Population Affected 0 53 14 8 0 3 11 89Total Hispanic Population Affected 0 16 5 5 0 9 18 53Total Population 2 in Land Acquisition Area 54 586 269 311 87 219 364 1,890Percent Minority Affected 0% 9.0% 5.2% 2.6% 0% 1.4% 3.0% 4.7% 15.0%Percent Hispanic Affected 0% 2.7% 1.6% 1.6% 0% 4.1% 4.9% 2.8% 8.7%Low-Income Population 6 124 29 0 153 57 36 405Total Population 2 in Land Acquisition Area 466 2,054 1,293 0 3,210 900 1,088 9,011Percent Low-Income 1.3% 6.0% 2.2% 0% 4.8% 6.3% 3.3% 4.5% 11.9%Source: 2000 U.S. Census.Note: Based on 1999 Noise Exposure Map.1 One census block group incorporates land acquisition Areas 1 and 4. Population data for this census block group is listed under Area 1.2 The total population is different for minority/Hispanic and low-income because the minority/Hispanic census data are available by census block and the low-income data are available by census block group.Of the total population affected by the Completed Part 150 VLAP, 4.7 percent is identified as a minority.This percentage does not exceed the statewide average of 15.0 percent for a minority population. The Hispanicpopulation represents 2.8 percent of the total population affected. This percentage also does not exceed the statewideaverage of 8.7 percent for Hispanic populations. The low-income population represents 4.5 percent of the totalpopulation affected. This percentage does not exceed the statewide average of 11.9 percent for low-income impacts.There is no well-defined cohesive minority, Hispanic, or low-income population group in the vicinity of the<strong>Airport</strong> that has previously experienced disproportionate impacts. The population near the <strong>Airport</strong> is primarilynon-minority, non-Hispanic, and non-low-income.4.4.2.5 Children’s Health and Safety RisksAs documented for air quality and water quality, the Baseline Condition does not result in significant impacts toair quality, drinking water, recreational waters, or other products or substances that a child might come intocontact with or ingest. These topics are not further addressed in the context of children’s health and safety risks.The Warwick Public School District consists of the Drum Rock Early Childhood Center, sixteen ElementarySchools, three Junior High Schools, three Senior High Schools, the Career and Technical Center, and the AdultEducation <strong>Program</strong>. There are a total of 25 private and public schools in the Study Area. Six of these schools areimpacted by noise levels at DNL 60 dB or greater and were sound insulated as part of a previous soundinsulation effort under the Part 150 NCP.Chapter 4 – Affected Environment 4-26 July 2011\\mawatr\ev\09228.00\reports\<strong>FEIS</strong>_Final_July_2011\<strong>PVD</strong>_CH04_Affected_Env_JUL_2011.doc
T.F. <strong>Green</strong> <strong>Airport</strong> <strong>Improvement</strong> <strong>Program</strong>Environmental Impact Statement and Final Section 4(f) Evaluation4.5 Surface TransportationThis section presents the methodology of the traffic analysis and describes the Baseline Condition for surfacetransportation within the T.F. <strong>Green</strong> <strong>Airport</strong> Project and Study Areas. 1844.5.1 MethodologyThe methods used to conduct the Baseline Condition assessment followed standard industry practice fortransportation evaluations. The Surface Transportation Study Area and key intersections for the surfacetransportation analysis were established based on the potential area of influence for any airport-related action.Peak hour traffic volume data was collected at the key Surface Transportation Study Area intersections, along thefreeway segments, and at key ramp junctions. Field reviews were conducted to visually observe weekday peakhour traffic operations, to inventory geometry and physical conditions, and to record signal timings whereappropriate. Annual and monthly historical traffic data for roadways in the area were reviewed to ensure that thedata were not taken during a historically low month for the traffic demands through the area. A traffic operationsmodel was used to evaluate how the transportation infrastructure handles the peak hour demands.Surface Transportation Study AreaThe Study Area, shown in Figure 4-14, was established based on the potential area of influence of impactsresulting from any airport-related action. It includes the roadway system surrounding the <strong>Airport</strong>, including<strong>Airport</strong> Road, Post Road (U.S. Route 1), Jefferson Boulevard, and Main Avenue (State Route 113) as well asRoute 37 and <strong>Airport</strong> Connector.4.5.2 Affected EnvironmentThe existing roadway network in the vicinity of T.F. <strong>Green</strong> <strong>Airport</strong> is described and evaluated in this section,along with an inventory of public parking areas, a summary of the historical occurrence of vehicular crashes,and an overview of public transportation, bicycle facilities, rental car, and limousine services. This section alsodocuments Baseline Condition off-airport traffic flow patterns, traffic operations, and safety issues at the keyintersections, freeway segments, and ramps in the vicinity of T.F. <strong>Green</strong> <strong>Airport</strong>. The focus of this assessment isoff-airport transportation infrastructure and not on-airport infrastructure needs.4.5.2.1 Regional ContextT.F. <strong>Green</strong> <strong>Airport</strong> is located in the City of Warwick, six miles south of the City of Providence, Rhode Island.Major roadways around T.F. <strong>Green</strong> <strong>Airport</strong> include <strong>Airport</strong> Road to the north, Sandy Lane and WarwickAvenue to the east, Main Avenue (State Route 113) to the south, and Post Road (U.S. Route 1) to the west.Regionally, the <strong>Airport</strong> is accessible from several roadways including I-95 at Interchanges 13 and 14, I-295, PostRoad (U.S. Route 1), and State Route 37. The on-<strong>Airport</strong> terminal roadway, Terminal Loop Road, extends fromthe <strong>Airport</strong> Connector and connects with Post Road. The <strong>Airport</strong> Connector from I-95 at Interchange 13provides direct access to the <strong>Airport</strong> from the highway. Vehicular traffic to the <strong>Airport</strong> uses either the <strong>Airport</strong>Connector (approximately 70 percent) or Post Road (approximately 30 percent).184 Surface Transportation is not regularly evaluated as a separate category under FAA Order 1050.1E, Appendix A but in this <strong>FEIS</strong> was evaluated asseparate because of the substantial proposed changes to the roadway network under some alternatives.Chapter 4 – Affected Environment 4-27 July 2011\\mawatr\ev\09228.00\reports\<strong>FEIS</strong>_Final_July_2011\<strong>PVD</strong>_CH04_Affected_Env_JUL_2011.doc
T.F. <strong>Green</strong> <strong>Airport</strong> <strong>Improvement</strong> <strong>Program</strong>Environmental Impact Statement and Final Section 4(f) EvaluationThe InterLink facility is located at the southeast quadrant of the Jefferson Boulevard/Coronado Road intersectionand was completed in October 2010. Limited Massachusetts Bay Transportation Authority (MBTA) service startedDecember 2010. The station provides a direct pedestrian link between the <strong>Airport</strong> and connecting rail service toBoston and Providence. InterLink includes a Consolidated Rental Car Facility. Passengers can arrive at T.F. <strong>Green</strong><strong>Airport</strong> and take a moving walkway directly from the terminal to InterLink to obtain their rental cars.4.5.2.2 Surface Transportation EvaluationThe evaluation of the transportation infrastructure focused on the key roadways serving the <strong>Airport</strong>, including<strong>Airport</strong> Connector, State Route 37, <strong>Airport</strong> Road, Post Road, Jefferson Boulevard, and Main Avenue (State Route113). The key intersections along these streets are included in the Study Area along with the ramp junctions andfreeway segments along <strong>Airport</strong> Connector and Route 37 extending from the <strong>Airport</strong> to I-95. The evaluation is basedon morning and evening peak hour conditions that were determined using the traffic counts and observations. Theterm Level of Service (LOS) is used to denote the different operating conditions that occur under select traffic volumeloads. It is a qualitative measure that considers a number of factors including traffic demands, roadway geometry,speed, signal operations, travel delay, and freedom to maneuver. The LOS designation is an index ranging from A toF, with LOS A representing the best operating conditions and LOS F representing the worst operating conditions.Signalized IntersectionsThe Baseline Condition morning and evening peak hour capacity analyses for the signalized intersections in theStudy Area identified two intersections that operate under LOS E or F conditions:• Post Road at Lincoln Avenue• <strong>Airport</strong> Road at Warwick AvenueIn addition to the overall intersection performance assessment, an operational assessment determined that thefollowing intersections have lane groups that operate at LOS E or F during the morning or evening peak hourunder Baseline Conditions:• Post Road at Lincoln Avenue• Post Road at <strong>Airport</strong> Road• <strong>Airport</strong> Road at Warwick Avenue• Post Road at Coronado Road• Main Avenue at Industrial Drive• Main Avenue at Jefferson Boulevard• Jefferson Boulevard at Coronado Road/Kilvert StreetUnder the Baseline Condition, the on-<strong>Airport</strong> signalized location where <strong>Airport</strong> Connector intersects withTerminal Loop Road operates at capacity due to high demands, short storage bays, inefficient intersectiongeometry, and a high number of signal phases. This poor condition contributes to long delays and queues alongthe entire southern portion of Terminal Loop Road.Chapter 4 – Affected Environment 4-28 July 2011\\mawatr\ev\09228.00\reports\<strong>FEIS</strong>_Final_July_2011\<strong>PVD</strong>_CH04_Affected_Env_JUL_2011.doc
T.F. <strong>Green</strong> <strong>Airport</strong> <strong>Improvement</strong> <strong>Program</strong>Environmental Impact Statement and Final Section 4(f) EvaluationUnsignalized IntersectionsUnder the Baseline Condition, the intersection of Jefferson Boulevard and <strong>Airport</strong> Connector off-ramp is theonly unsignalized intersection in the Surface Transportation Study Area operating under LOS E or LOS Fconditions. 185 Vehicles exiting <strong>Airport</strong> Connector attempting to turn left onto Jefferson Boulevard experienceexcessive delays that result in LOS E or F conditions during the morning and evening peak hours. Heavyvolumes on Jefferson Boulevard result in insufficient gaps in the traffic stream that hinder the off-ramp vehiclesturning onto Jefferson Boulevard.Ramp Junctions and Freeway SegmentsAll of the ramp merges in the Study Area operate at LOS C or better during weekday peak hour trafficconditions. These results indicate that State Route 37 and <strong>Airport</strong> Connector have sufficient capacity toaccommodate merging maneuvers from on-ramps during weekday peak hour conditions.All ramp diverges in the Study Area operate at LOS C or better during weekday peak hour traffic conditions.These results indicate that State Route 37 and <strong>Airport</strong> Connector have sufficient capacity to accommodatediverging maneuvers from off-ramps during weekday peak hour conditions.All of the freeway segments in the Study Area operate at LOS B or better or better during weekday peak hourtraffic conditions. These results indicate that State Route 37 and the <strong>Airport</strong> Connector have sufficient capacityto handle the roadway traffic demands during weekday peak hour conditions.Intersection SafetyFor all of the Surface Transportation Study Area intersections, the average crash occurrence was 34 crashes overthe three-year period from 2002 to 2004. The majority of intersections (13) had three-year averages at or belowthis number. Five intersections exhibited higher crashes for the three-year period; three of those notably higher,in excess of 75 crashes per year. The five intersections with the highest occurrence of crashes were PostRoad/<strong>Airport</strong> Road (98 crashes), <strong>Airport</strong> Road/Warwick Avenue (89 crashes), Post Road/<strong>Airport</strong> ConnectorRamps (75 crashes), Jefferson Boulevard/<strong>Airport</strong> Connector Ramps (55 crashes), and JeffersonBoulevard/Coronado Road/Kilvert Street (49 crashes).It is notable that at two of the intersections that experienced a high occurrence of crashes, a large percentage of thecrashes were rear-end collisions. At the intersections of Post Road/<strong>Airport</strong> Road and <strong>Airport</strong> Road/WarwickAvenue, rear-end crashes accounted for 74 percent and 68 percent of the total crashes, respectively. At theintersection of Main Avenue at Industrial Drive, 80 percent of the crashes were rear-end collisions. Since all threelocations are signalized intersections, the high occurrence of rear-end collisions may be caused by inadequate sightdistance or excessive queuing.Three intersections had a high percentage (greater than 50 percent) of crashes involving personal injury. At theintersections of <strong>Airport</strong> Road/Hade Court, <strong>Airport</strong> Road/Commerce Drive, and Post Road/Donald Avenue,185 A traffic signal has since been installed at this intersection as part of the InterLink project.Chapter 4 – Affected Environment 4-29 July 2011\\mawatr\ev\09228.00\reports\<strong>FEIS</strong>_Final_July_2011\<strong>PVD</strong>_CH04_Affected_Env_JUL_2011.doc
T.F. <strong>Green</strong> <strong>Airport</strong> <strong>Improvement</strong> <strong>Program</strong>Environmental Impact Statement and Final Section 4(f) Evaluationcrashes involving personal injury accounted for 81 percent, 53 percent, and 67 percent of the total crashes,respectively.Rental CarsIn 2004, there were several rental car companies serving the <strong>Airport</strong> with facilities located both on- andoff-<strong>Airport</strong> property. Nearly every major car rental company is represented at the <strong>Airport</strong>, including Alamo,Avis, Budget, Dollar, Enterprise, Hertz, National, Payless Car Rental, and Thrifty. On-<strong>Airport</strong> rental cars areavailable on the lower level of the Garage A adjacent to the terminal building. Free shuttle bus services areprovided to off-<strong>Airport</strong> facilities, which are located on Post Road and <strong>Airport</strong> Road. A rental car maintenancefacility, which provides washing, cleaning, and mechanical servicing for rental cars, is located on the east side ofPost Road just north of <strong>Airport</strong> Road. InterLink also includes consolidated rental car facilities. InterLink isincluded in the Future No-Action Alternative analyzed in Chapter 5, Environmental Consequences.ParkingFigure 4-15 shows the location of the on- and off-<strong>Airport</strong> parking facilities, which are available to <strong>Airport</strong>patrons and employees. On-<strong>Airport</strong> parking includes approximately 8,422 spaces in four facilities: three garagesand two surface lots. Off-<strong>Airport</strong> parking at privately owned lots consists of approximately 2,200 spaces at threefacilities. In addition to the off-<strong>Airport</strong> public parking facilities, many of the hotels in the vicinity ofT.F. <strong>Green</strong> <strong>Airport</strong> offer “Stay, Park, and Fly” programs.Public TransportationBus, taxi, and airport limousine services are available at the <strong>Airport</strong>. Scheduled bus service includes inter- andintra-city bus operators, Peter Pan and RIPTA. The three taxi or limousine services include <strong>Airport</strong> Taxi &Limousine Service, Aero-<strong>Airport</strong> Limousine Service (Providence shuttle), and Cozy Cab, Inc. (Newport Shuttle).RIPTA bus service to Kennedy Plaza offers connections to the Bonanza and Greyhound Bus Lines, whichprovide scheduled service to regional destinations throughout Massachusetts, Connecticut, New York, NewHampshire, and Maine.4.6 Air QualityThis section summarizes the methodology of the air quality assessment, and briefly describes air emissionsassociated with T.F. <strong>Green</strong> <strong>Airport</strong>, including the pollutant types and emission sources for the BaselineCondition to provide a context for evaluating the T.F. <strong>Green</strong> <strong>Airport</strong> <strong>Improvement</strong> <strong>Program</strong>. This air qualityassessment considers all sources of airport-related air quality, including aircraft, ground service equipment(GSE), and motor vehicles traveling to, from, and moving about the <strong>Airport</strong> site; fuel storage facilities;stationary sources (i.e., steam boilers, emergency generators, etc.); aircraft deicing activities; and periodicconstruction activities for new projects or improvements to existing facilities.EPA’s Criteria PollutantsThe EPA has established the National Ambient Air Quality Standards (NAAQS) to protect public health, theenvironment, and the quality of life from the detrimental effects of air pollution. The standard is set at a level or rangeof levels at which no adverse effects are believed to occur, and includes a margin of safety to ensure no adverseChapter 4 – Affected Environment 4-30 July 2011\\mawatr\ev\09228.00\reports\<strong>FEIS</strong>_Final_July_2011\<strong>PVD</strong>_CH04_Affected_Env_JUL_2011.doc
T.F. <strong>Green</strong> <strong>Airport</strong> <strong>Improvement</strong> <strong>Program</strong>Environmental Impact Statement and Final Section 4(f) Evaluationeffects on sensitive populations (elderly, children, asthmatics) as required by the Clean Air Act (CAA). TheseNAAQS were set for the following six “criteria” air pollutants: carbon monoxide (CO), ozone (O 3), nitrogen dioxide(NO 2), sulfur dioxide (SO 2), particulate matter (PM), and lead (Pb), as listed in Table 4-19. The Rhode IslandDepartment of Environmental Management (RIDEM) has adopted these same NAAQS for the State of Rhode Island.Table 4-19National Ambient Air Quality StandardsNAAQSPollutant Averaging Time Primary Standards 1 Secondary Standards 1Carbon Monoxide (CO)Ozone (O3) 2Nitrogen dioxide (NO2)Sulfur Dioxide (SO2)Respirable Particulate Matter (PM10) 6Fine Particulate Matter (PM2.5)Lead (Pb) 81-hour8-hour8-hour 38-hour 41-hour 5Annual1-hour 53-hour24-hourAnnual24-hour24-hour 7Annual3-month35 ppm (40,000 µg/m 3 )9 ppm (10,000 µg/m 3 )0.08 ppm (157 µg/m 3 )0.075 ppm (147 µg/m 3 )NoneSame as primarySame as primarySame as primarySame as primarySame as primary0.5 ppm (1300 µg/m 3 )n/an/a150 µg/m 3Same as primary35 µg/m 3Same as primary15 µg/m 30.15 µg/m 3 Same as primary0.100 ppm (188 µg/m 3 )0.053 ppm (100 µg/m 3 )0.075 ppm (196 µg/m 3 )Na0.14 ppm (365 µg/m 3 )0.03 ppm (80 µg/m 3 )Source: EPA, 2011 (www.epa.gov/air/criteria.html); compiled by KB Environmental Sciences, Inc.1 Primary standards are set to protect public health. Secondary standards are designed to protect public welfare.2 The former ozone 1-hour NAAQS was revoked by the EPA on June 15, 2005.3 This is the former “1997” 8-hour standard for ozone.4 This is the new 8-hour standard established on March 12, 2008 and is referred to as the “2008” standard.5 The EPA established new 1-hour NO2 NAAQS (January 22, 2010) and new 1-hour SO2 NAAQS (August 23, 2010).6 EPA revoked the annual PM10 standard in 2006 (effective December 17, 2006).7 To attain this standard, the 3-year average of the 98th percentile of 24-hour concentrations at each population-oriented monitor within an area must not exceed 35 µg/m 3 (effective December 17, 2006).8 Corresponds to a rolling three month average measured over a three-year period.NAAQS National Ambient Air Quality Standards. Ppm = parts per million. µg/m 3 = micrograms per cubic meter. n/a = not applicable.Since publication of the Air Quality Protocol and the DEIS, EPA has made modifications to the NAAQS for NO 2and SO 2, is considering further strengthening the NAAQS for ozone. These changes to the NAAQS aresummarized below.NO 2– On January 22, 2010 the EPA established a new 1-hour NO 2NAAQS to help protect sensitive members ofthe human population from exposure to elevated short-term concentrations of NO 2. Set at 100 parts per billion(ppb), the new standard is evaluated based on the 3-year average of the 98th percentile of the maximum 1-houraverage concentrations. The new standard became effective on April 12, 2010. Although primarily intended toChapter 4 – Affected Environment 4-31 July 2011\\mawatr\ev\09228.00\reports\<strong>FEIS</strong>_Final_July_2011\<strong>PVD</strong>_CH04_Affected_Env_JUL_2011.doc
T.F. <strong>Green</strong> <strong>Airport</strong> <strong>Improvement</strong> <strong>Program</strong>Environmental Impact Statement and Final Section 4(f) Evaluationaddress high levels of NO 2near roadways, it could also be relevant near airports where NO xis viewed as an“indicator” pollutant for aircraft emissions.SO 2– The EPA also recently completed a review of the SO 2NAAQS and revised the existing standards toinclude a 1-hour standard of 75 ppb. The new 1-hour standard is assessed based on the 3-year average of the99th percentile of the maximum 1-hour average concentrations. The new standard became effective onAugust 23, 2010. As aviation is not considered to be a significant source of SO 2, it is unlikely that this newstandard will have any effect on airports.Ozone – The EPA also proposed on January 6, 2010 to revise the 8-hour ozone NAAQS from the current0.075 parts per million (ppm) to a range between 0.06 and 0.07 ppm. Due to overwhelming response fromindustry groups and other stakeholders, EPA has postponed the finalization of the new ozone NAAQS untillater in 2011. When the new standard takes effect, many areas of the U.S. that are now in attainment of theNAAQS for O 3will be designated non-attainment and a number of current non-attainment areas will bedesignated with greater severity.Lead – On October 15, 2008 the EPA reset the lead NAAQS at 0.15 µg/m 3 , ten times lower than the previousstandard of 1.5 µg/m 3 . The averaging time associated with the standard has also changed from quarterlyaverages over a three-year period to a “rolling three-month” average over a three-year period. If anythree-month average within this three-year period reveals a violation of the new standard, the area will bedesignated “non-attainment” of the new standard. The new rule also requires airports emitting greater than1.0 tons per year of lead to conduct ambient lead monitoring.Attainment/Non-Attainment StatusThe current attainment/non-attainment designations for Rhode Island (including the area nearT.F. <strong>Green</strong> <strong>Airport</strong>) are summarized in Table 4-20.The area encompassing the <strong>Airport</strong> is designated as attainment for all of the criteria air pollutants, with theexception of O 3for which the classification is “non-attainment” classification (Moderate). 186 In the immediateterm, RIDEM expects the EPA will designate the region as “unclassifiable” for the new 1-hour NO 2and SO 2standards as well as for lead, due to lack of monitoring or modeling data.186 “Moderate” denotes that Rhode Island must attain the standard within six years after designation, or by the end of 2010.Chapter 4 – Affected Environment 4-32 July 2011\\mawatr\ev\09228.00\reports\<strong>FEIS</strong>_Final_July_2011\<strong>PVD</strong>_CH04_Affected_Env_JUL_2011.doc
T.F. <strong>Green</strong> <strong>Airport</strong> <strong>Improvement</strong> <strong>Program</strong>Environmental Impact Statement and Final Section 4(f) EvaluationTable 4-202004 Baseline Condition Attainment/Non-AttainmentStatus of the Providence AreaPollutantDesignationOzone (O3) Non-attainment (moderate) 1Carbon monoxide (CO)AttainmentLead (Pb)AttainmentNitrogen dioxide (NO2)AttainmentSulfur dioxide (SO2)AttainmentParticulate matter (PM10)AttainmentParticulate matter (PM2.5)AttainmentSource: EPA, 2006.1 This designation applies to the 1997 ozone standard. With the promulgation of the 2008 ozonestandard and the consideration of a 2011 standard, an updated designation will be set by EPA in 2011or 2012.Hazardous Air PollutantsHazardous air pollutants (HAPs) are a category of air pollutants listed separately from the criteria air pollutantsand for which there are no NAAQS. FAA guidelines recommend that the assessment of airport-related HAPs inNEPA documents should be confined to an emissions inventory of a select group of HAPs that are mostcommonly associated with airport emissions (e.g., formaldehyde, benzene, 1,3-butadiene, naphthalene, etc.).RIDEM’s Air Pollution Control Regulation No. 22 - Air Toxics sets Acceptable Ambient Levels (AAL) for259 substances classifiable as HAPs. These AALs are designed to protect public health from unacceptableexposure to these substances, primarily from stationary sources of emissions.In addition, the FAA has initiated a number of research studies through the Partnership for Air TransportationNoise and Emissions Reduction (PARTNER) which are investigating the issues of air quality (in general) andhealth impacts (specifically) as related to aviation.Climate Change and <strong>Green</strong>house GasesOf growing concern globally is the impact of proposed projects on climate change. <strong>Green</strong>house gases (GHGs)are those that trap heat in the earth’s atmosphere. Both naturally occurring and anthropogenic (man-made)GHGs include water vapor (H 2O), carbon dioxide (CO 2), 187 methane (CH 4), nitrous oxide (N 2O), and O 3. 188 At thistime, there are no NAAQS for GHGs. <strong>Green</strong>house gases trap heat in the earth’s atmosphere. Research hasshown that there is a direct link between fuel combustion and GHG emissions. Therefore, sources that requirefuel or power at an airport are the primary sources that would generate GHGs. Aircraft are probably the mostoften cited air pollutant source, but they produce the same types of emissions as cars. Aircraft jet engines, likemany other vehicle engines, produce CO 2, H 2O, NOx, CO, SOx, unburned or partially combusted hydrocarbons(also known as volatile organic compounds [VOCs], particulates, and other trace compounds.187 All greenhouse gas inventories measure CO 2emissions, but beyond CO 2different inventories include different greenhouse gases.188 Several classes of halogenated substances that contain fluorine, chlorine, or bromine are also greenhouse gases, but they are, for the most part, solely aproduct of industrial activities. For example, chlorofluorocarbons (CFCs) and hydrochlorofluorocarbons (HCFCs) are halocarbons that contain chlorine,while halocarbons that contain bromine are referred to as bromofluorocarbons (i.e., halons) or sulfur (sulfur hexafluoride: SF6).Chapter 4 – Affected Environment 4-33 July 2011\\mawatr\ev\09228.00\reports\<strong>FEIS</strong>_Final_July_2011\<strong>PVD</strong>_CH04_Affected_Env_JUL_2011.doc
T.F. <strong>Green</strong> <strong>Airport</strong> <strong>Improvement</strong> <strong>Program</strong>Environmental Impact Statement and Final Section 4(f) EvaluationAccording to most international reviews, aviation emissions comprise a small but potentially importantpercentage of man-made GHG and other emissions that contribute to global warming. The IntergovernmentalPanel on Climate Change (IPCC) estimates that global aircraft emissions account for about 3.5 percent of thetotal quantity of GHG from human activities. 189 In terms of U.S. contribution, the U.S. General Accounting Office(GAO) reports that aviation accounts “for about 3 percent of total U.S. GHG emissions from human sources”compared with other industrial sources, including the remainder of the transportation sector (23 percent) andindustry (41 percent). 190The scientific community is developing areas of further study to enable them to more precisely estimateaviation's effects on the global atmosphere. The FAA is also currently leading or participating in several effortsintended to clarify the role that commercial aviation plays in GHG emissions and climate change. The mostcomprehensive and multi-year program geared towards quantifying climate change effects of aviation is theon-going Aviation Climate Change Research Initiative (ACCRI) funded by FAA and NASA and commenced in2007. ACCRI will reduce key scientific uncertainties in quantifying aviation-related climate impacts and providetimely scientific input to inform policy-making decisions. FAA also funds Project 12 of the Partnership for AirTransportation Noise & Emissions Reduction Center of Excellence research initiative to quantify the effects ofaircraft exhaust and contrails on global and U.S. climate and atmospheric composition.In April of 2009, the Transportation Research Board’s (TRB) <strong>Airport</strong> Cooperative Research <strong>Program</strong> (ACRP)Project 02-06 published the Guidebook on Preparing <strong>Airport</strong> <strong>Green</strong>house Gas Emission Inventories (ACRP Report 11),which provides recommended instructions to airport operators on how to prepare an airport-specific GHGemissions inventory. 191 The FAA is presently reviewing this guidebook and is expected to provide a version of aGHG Emissions Inventory Guidebook that is specifically applicable to NEPA documents.RIAC has prepared annual GHG emissions inventories since 2008 at T.F. <strong>Green</strong> <strong>Airport</strong> in accordance with theState of Rhode Island Permanent Air Quality Monitoring Act.4.6.1 MethodologyFAA Order 1050.1E states that an air quality assessment prepared under NEPA should include an analysis andconclusions of a proposed action’s impacts on air quality. It further directs that when NEPA analysis is needed, theproposed action should be assessed by evaluating the impact on the NAAQS. FAA Order 5050.4B provides that forNEPA purposes environmental analyses must determine if the air quality impacts of any reasonable alternativewould exceed a NAAQS for the time periods analyzed and for General Conformity requirements under the CAA 192only the proposed or preferred alternative need be analyzed.FAA Order 1050.1E references the FAA's Air Quality Procedures for Civilian <strong>Airport</strong>s & Air Force Bases(AQPCAAB) which provides more detailed guidance on air quality procedures. Pursuant to the AQPCAAB as wellas the FAA’s Environmental Desk Reference, a NAAQS Assessment is required for actions at commercial service189 Aviation’s Effects on the Global Atmosphere Are Potentially Significant and Expected to Grow, IPCC Report as referenced in U.S. General AccountingOffice (GAO) Environment: GAO/RCED-00-57, February 2000, p. 4.190 Ibid, p. 14; GAO cites available EPA data from 1997.191 Guidebook on Preparing <strong>Airport</strong> <strong>Green</strong>house Gas Emissions Inventories. Transportation Research Board, <strong>Airport</strong> Cooperative Research Panel, ACRPReport 11, Project 02-06,. See onlinepubs.trb.org/onlinepubs/acrp/acrp_rpt_011.pdf for the full report (in production).192 Clean Air Act Amendments of 1990.Chapter 4 – Affected Environment 4-34 July 2011\\mawatr\ev\09228.00\reports\<strong>FEIS</strong>_Final_July_2011\<strong>PVD</strong>_CH04_Affected_Env_JUL_2011.doc
T.F. <strong>Green</strong> <strong>Airport</strong> <strong>Improvement</strong> <strong>Program</strong>Environmental Impact Statement and Final Section 4(f) Evaluationairports, such as T.F. <strong>Green</strong>, in which there are more than 1.3 million annual enplanements. As T.F. <strong>Green</strong> <strong>Airport</strong>exceeds this threshold, a NAAQS Assessment has been performed for the <strong>Improvement</strong> <strong>Program</strong> to determinewhether the pollutant concentrations would exceed the NAAQS. Additionally, as the State of Rhode Island is in nonattainmentfor ozone (0 3) a General Conformity Assessment has been performed to determine if net emissions ofozone exceed the General Conformity threshold levels or are otherwise regionally significant.The overall approach for conducting the air quality assessment, including the objectives, methodologies, andintended outcomes were initially reviewed by the RIDEM prior to undertaking the analyses. 193 In general, the airquality assessment includes the following:• Emissions Inventory – The purpose of an emissions inventory is to quantify the amounts (i.e., total mass) ofair emissions (associated with the <strong>Airport</strong>, by emission source and pollutant type). Consistent with thisapproach, the sources of emissions included in the inventory are identified as aircraft, GSE/APUs, on- andoff-site motor vehicle operations and airport-related stationary sources and fuel storage facilities.• Atmospheric Dispersion Analysis – The purpose of the atmospheric dispersion analysis is to convert theemissions inventory results for CO, NO x, and PM 10/2.5to ambient (i.e., outdoor) concentrations at receptorslocated on the <strong>Airport</strong>, around the perimeter, and in the neighboring community. This is achieved bycombining the Emissions and Dispersion Modeling System (EDMS) emissions inventory output with actualhourly meteorological data and geographical information from the <strong>Airport</strong> area. Background pollutantlevels are added to the results to account for the contributions from non-airport, regional and naturalsources. The results are then directly compared to the NAAQS.• CO “Hot-Spot” Analysis – The purpose of this analysis is to predict ambient levels of CO in the vicinity ofroadway intersections, both on and off the <strong>Airport</strong>. Seven intersections were analyzed and selected basedon their proximity to the <strong>Airport</strong> and based on the surface transportation traffic analysis. The modeling wasconducted under simulated worst-case meteorological conditions (i.e., low wind speeds, stable atmosphericconditions, and low ambient temperatures) and the results are directly compared to the NAAQS for CO.• HAPs Emissions Inventory – HAPs are a category of air emissions distinct from the EPA criteria airpollutants and for which there are no NAAQS. The HAPs emissions inventory includes aircraft, GSE/APU,motor vehicle operations, and on-site stationary sources.Baseline conditions are based upon 2004 aircraft operations activity levels, aircraft fleet mix and operationaltimes for landing; take-off; climb-out; and ground-based taxi-in, taxi-out and delay periods. 194 GSE emissions arealso based upon the aircraft fleet mix and GSE operational characteristics at the <strong>Airport</strong> in 2004.4.6.1.1 Air Quality Study AreaThe <strong>Airport</strong> is located in a designated non-attainment area for the criteria pollutant O 3. Because O 3is a regionalpollutant, the non-attainment area designation is not confined to the Providence and Warwick area, butincludes the entire State of Rhode Island and extends into the neighboring states of Connecticut and193 RIDEM approved the Air Quality Assessment Protocol except for the exclusion of a health risk assessment based on hazardous air pollutant emissionsand dispersion modeling.194 The year 2004 airport operational levels are used in the air quality assessment for consistency with the noise, surface transportation, and other sections of the EIS.Chapter 4 – Affected Environment 4-35 July 2011\\mawatr\ev\09228.00\reports\<strong>FEIS</strong>_Final_July_2011\<strong>PVD</strong>_CH04_Affected_Env_JUL_2011.doc
T.F. <strong>Green</strong> <strong>Airport</strong> <strong>Improvement</strong> <strong>Program</strong>Environmental Impact Statement and Final Section 4(f) EvaluationMassachusetts. A regional pollutant, like O 3, encompasses extensive geographic areas (i.e., counties and states)unlike CO that only covers small areas (i.e., intersections and roadsides). This non-attainment area is within theNortheast U.S. Ozone Transport Region, where local O 3levels are influenced by emissions that are releasedelsewhere and transported regionally. As the Rhode Island portion of this regional O 3non-attainment area isdelineated by the state borders, the Study Area for this air quality assessment encompasses the entire state.While the Project Area for the air quality assessment has the same outer boundary as the Project Area for allother categories, the analysis further evaluates the areas where airport-related emissions have the potential tocause a measurable impact on air quality conditions. The boundaries of this area vary by source (i.e., aircraft,GSE, etc.) and type of pollutant (CO, NO x, PM 10/2.5). For example, GSE emissions of PM 10/2.5are mainly restrictedto the <strong>Airport</strong> main terminal aprons and cargo facilities. On-site motor vehicles emissions of CO are mostlyconfined to the on-site roadways, terminal curbsides and parking facilities. By comparison, aircraft emissionsduring the approach and climb-out modes of a landing-takeoff cycle (LTO) extend up to the atmospheric mixingheight. For this assessment, the atmospheric mixing height is assumed to be at an altitude of 2,226 feet and,based upon the type of aircraft that utilize the <strong>Airport</strong> this altitude is reached roughly 1.5 miles off the runwayends. <strong>Airport</strong>-related motor vehicle traffic traveling to and from T.F. <strong>Green</strong> <strong>Airport</strong> also has the potential toaffect air quality in the vicinity of off-site intersections located near the <strong>Airport</strong>.4.6.2 Affected EnvironmentThe following section provides a summary of the air quality assessment, which includes: an emissions inventoryof EPA criteria pollutants (or their precursors) for the Baseline Condition as well as airport-related HAPs; anatmospheric dispersion modeling of CO, NO 2, and PM 10/2.5and a CO “Hot-Spot” analyses to predict ambientconcentrations of pollutants on the <strong>Airport</strong> and in the neighboring community. A summary of the available airmonitoring data collected from monitoring stations closest to the <strong>Airport</strong> is also presented.4.6.2.1 Emissions InventoryThe results of the emissions inventory for the pollutants CO, VOC, NO x, SO xand PM 10/2.5are shown in Table 4-21 andare expressed in tpy for each pollutant type and emission source. The results can be easily compared to future-yearconditions as well as area-wide emissions data contained in Rhode Island’s State Implementation Plan (SIP). 195 Asshown in Table 4-21, in 2004, airport-related CO emissions were estimated to be produced in the greatestquantities followed by NO , VOC, SO and PM 10/2.5. For VOC and NO , aircraft were the dominant on-site sourcex x, xof these pollutants with GSE/APU being secondary sources. Lead (Pb) is both a criteria pollutant and a HAP, asreported in the DEIS Air Quality Technical Report.195 SIPs are the regulations and other materials for meeting clean air standards and associated Clean Air Act requirements (U.S. EPA,www.epa.gov/reg5oair/sips/, Accessed May 12, 2011.Chapter 4 – Affected Environment 4-36 July 2011\\mawatr\ev\09228.00\reports\<strong>FEIS</strong>_Final_July_2011\<strong>PVD</strong>_CH04_Affected_Env_JUL_2011.doc
T.F. <strong>Green</strong> <strong>Airport</strong> <strong>Improvement</strong> <strong>Program</strong>Environmental Impact Statement and Final Section 4(f) EvaluationTable 4-212004 Baseline Condition Air Emissions Inventory (tons per year)PollutantSource CO VOC NOx SOx PM10 PM2.5Aircraft 1 411 52 237 23 6 6GSE/APU 2 475 19 36 4 1 1Stationary 3 /Fueling 4 3 2 14 1 1 1Motor VehiclesOn-<strong>Airport</strong> 5 281 18 29 1 1 1Off-<strong>Airport</strong> 6 2,055 101 141 3 3 2Totals 3,225 193 458 32 12 10Source: KB Environmental Sciences, Inc. 2008.CO Carbon monoxide. GSE/APU Ground support equipment / auxiliary power units.NOx Nitrogen oxides. SOx Sulfur oxides.PM10/2.5 Particulate matter (10 and 2.5 microns in aerodynamic diameters).VOC Volatile Organic Compounds.1 Aircraft emissions comprise the entire landing and take-off (LTO) cycle (i.e., approach, landing, taxi-in, taxi-out, take-off, and climb out) to the atmosphericmixing height.2 GSE and APU emissions are combined.3 Stationary sources include boilers, emergency generators, and de-icing chemical use.4 Fueling sources include jet, avgas, gasoline, and diesel storage facilities.5 On-<strong>Airport</strong> motor vehicles include airport patron, employee, and cargo truck traffic operating in on-site parking facilities, along terminal curbsides and theinternal roadways.6 Off-<strong>Airport</strong> motor vehicles include both <strong>Airport</strong>- and non-<strong>Airport</strong> traffic (including cargo trucks) operating on the adjoining roadway network.Hazardous Air PollutantsAs previously discussed, HAPs are a category of air emissions distinct from the EPA criteria air pollutants and forwhich there are no NAAQS. The results of the HAPs baseline emissions inventory for 2004 are shown in Table 4-22and are expressed in units of tpy for each pollutant.Table 4-222004 Baseline Condition Hazardous Air Pollutants Emissions InventoryEmissionsEmissionsHAP Species (tpy) HAP Species (tpy)1,3-Butadiene 1.9 Lead 0.6Acetaldehyde 0.8 Naphthalene 0.2Acrolein 0.2 Propionaldehyde 0.8Benzene 5.5 Styrene 0.4Diesel PM 2.0 Toluene 12.1Ethylbenzene 2.0 Xylene 7.5Formaldehyde 6.7 PAHs 1 0.1Source: KB Environmental Sciences, Inc. 2008.Notes: HAPs = Hazardous air pollutants, tpy = Tons per year.1 PAHs (polynuclear aromatic hydrocarbons) include Acenaphthylene, Phenanthrene, Fluorene, Fluoranthene, Pyrene, Anthracene, Acenphthene,Benzo(ghi)perylene, Benzo(bk)fluoranthene, Benzo(a)anthracene, Benzo(a)pyrene, Chrysene, Indeno(123-cd)pyrene, and Dibenzo(ah)anthracene.Chapter 4 – Affected Environment 4-37 July 2011\\mawatr\ev\09228.00\reports\<strong>FEIS</strong>_Final_July_2011\<strong>PVD</strong>_CH04_Affected_Env_JUL_2011.doc
T.F. <strong>Green</strong> <strong>Airport</strong> <strong>Improvement</strong> <strong>Program</strong>Environmental Impact Statement and Final Section 4(f) EvaluationTotal emissions of toluene and xylene are expected to occur in the greatest amounts followed by formaldehydeand benzene. This trend is consistent with other findings by the EPA on a nationwide basis. 196 These compoundsare emitted in the exhaust of aircraft, GSE/APUs, and motor vehicle engines and to a lesser extent from boilers,fuel facilities, and other stationary sources.4.6.2.2 Atmospheric Dispersion ModelingThe atmospheric dispersion analysis results for the Baseline Condition at T.F. <strong>Green</strong> <strong>Airport</strong> compared to theapplicable NAAQS for CO, NO 2,and PM 10/2.5are summarized in Table 4-23. These reported results (withbackground levels added represent the maximum predicted concentrations (i.e., worst-case conditions).Table 4-232004 Baseline Condition Atmospheric Dispersion Analysis Results for T.F. <strong>Green</strong> <strong>Airport</strong>(µg/m 3 )Pollutant Averaging Period NAAQSCO1 hour8-hour40,00010,000MaximumConcentration 1,219,6866,727Exceed NAAQSNO2 Annual 100 45 NoPM10PM2.524-hour24-hour15035Annual1512NoSource: KB Environmental Sciences, Inc. 2008.Notes: CO = Carbon monoxide, NAAQS = National Ambient Air Quality Standards, NO2 = Nitrogen dioxide, PM10/2.5= Particulate matter (10 and 2.5 microns inaerodynamic diameters), and µg/m 3= micrograms per cubic meter.1 See Figure 4-16 for receptor locations.2 Maximum Concentration means highest predicted concentration (except 24-hour PM10 which is the fourth-highest and 24-hour PM2.5 which is theeighth-highest) using EDMS at all of the receptors analyzed with conservatively high background concentrations added.All of the maximum predicted concentrations of CO, NO 2,and PM 10/2.5(with background levels included) at themodeled receptor sites (Figure 4-16) are within the NAAQS for each pollutant and timeframe. The highest levelsare predicted to occur at Receptor 25 G, along <strong>Airport</strong> Road to the north of Runway 16. This is due to thecombination of emissions from roadway motor vehicle traffic (both airport-related and background traffic) withthe effects from airport-related sources.Ambient levels of Pb and SO 2are generally not affected by operations at commercial airports and therefore arenot assessed with the atmospheric dispersion model, although they are included in the emissions inventory.VOCs are not included in the dispersion modeling because there are no NAAQS to which the results can becompared.3834NoNoNoNo196 Documentation for Aircraft, Commercial Marine Vessel, Locomotive, and other Nonroad Components of the National Emissions Inventory, U.S. EnvironmentalProtection Agency, November 2002.Chapter 4 – Affected Environment 4-38 July 2011\\mawatr\ev\09228.00\reports\<strong>FEIS</strong>_Final_July_2011\<strong>PVD</strong>_CH04_Affected_Env_JUL_2011.doc
T.F. <strong>Green</strong> <strong>Airport</strong> <strong>Improvement</strong> <strong>Program</strong>Environmental Impact Statement and Final Section 4(f) Evaluation4.6.2.3 CO “Hot-Spot” AnalysesThe results of the CO “hot-spot” modeling for the Baseline Condition are summarized in Table 4-24 andrepresent the highest CO levels at any of the roadway receptors analyzed. Refer to Figure 4-17 for the locationsof the intersections evaluated. As shown, CO levels in the vicinities of the intersections analyzed are notexpected to exceed the NAAQS for CO under baseline conditions.Table 4-24 Baseline Condition CO “Hot-Spot” Analysis Results 1,2,3 (µg/m 3 )Maximum ConcentrationID 1 Intersection Location 1 1-Hour 8-Hour Exceed NAAQS13456Post Road / Lincoln AvenueWarwick Avenue / <strong>Airport</strong> RoadPost Road / <strong>Airport</strong> RoadPost Road / <strong>Airport</strong> ConnectorPost Road / Main Avenue20,70021,30020,60018,90020,4009,3009,7009,2008,0009,100NoNoNoNoNoNAAQS for CO 40,000 10,000Source: KB Environmental Sciences, Inc. 2008.Notes: CO = Carbon monoxide, NAAQS = National Ambient Air Quality Standard.1 See Figure 4-17 for intersection locations. Intersection 2 (Warwick Avenue/<strong>Airport</strong> Road (Relocated) is not included in this table as it is designated for future year conditions.2 Receptors are about 3 meters (10 feet) from roadway edge-of-pavement and the reported results are the highest CO concentrations at all receptors analyzed.3 Includes 1-hour background CO concentration of 14,000 µg/m 3 and 8-hour background concentration of 4,000 µg/m 3 . 4.6.2.4 Air Monitoring DataAir quality monitoring data in the vicinity of the <strong>Airport</strong> are available from three sources: the RIDEMPermanent Air Quality Monitoring Stations, the RIDEM Temporary Air Monitoring Study; and the RIACPermanent Air Quality Monitoring <strong>Program</strong>.RIDEM Permanent Monitoring StationsRIDEM operates eight permanent ambient air quality monitoring stations throughout the state as part of itsongoing air monitoring program. These stations sample and record outdoor levels of the criteria air pollutants andseveral of the HAPs discussed previously. Results are summarized in Table 4-25. As shown on Figure 4-18, theclosest state air monitoring stations to the <strong>Airport</strong> are approximately 6 to 9 miles to the north and are located in, ornear, downtown Providence. No permanent RIDEM air monitoring stations are presently located directly on, oradjacent to, the <strong>Airport</strong>. RIDEM collected air monitoring data from around the <strong>Airport</strong> in 2005 and 2006, and RIACinstalled a permanent air monitoring system in 2008.Chapter 4 – Affected Environment 4-39 July 2011\\mawatr\ev\09228.00\reports\<strong>FEIS</strong>_Final_July_2011\<strong>PVD</strong>_CH04_Affected_Env_JUL_2011.doc
T.F. <strong>Green</strong> <strong>Airport</strong> <strong>Improvement</strong> <strong>Program</strong>Environmental Impact Statement and Final Section 4(f) EvaluationTable 4-25 Permanent RIDEM Air Monitors—Data Summary 2005 through 2008 1,2,3Pollutant Year Averaging Time NAAQS Highest Measured Value 3 Exceeds NAAQSSite No. 1 (212 Prairie Avenue, Providence; 5.8 miles north of T.F. <strong>Green</strong> <strong>Airport</strong>)PM10 2008 24-hour 150 µg/m 3 34 µg/m 3 No2007 24-hour 150 µg/m 3 46 µg/m 3 No2006 24-hour 150 µg/m 3 47 µg/m 3 No2005 24-hour 150 µg/m 3 46 µg/m 3 NoPM2.5 2008 24-hour 35 µg/m 3 24.4 µg/m 3 No 4Annual 15 µg/m 3 9.1 µg/m 3 N/A 42007 24-hour 35 µg/m 3 27.1 µg/m 3 N/A 4Annual 15 µg/m 3 9.5 µg/m 3 N/A 42006 24-hour 35 µg/m 3 30.2 µg/m 3 N/A 4Annual 15 µg/m 3 10.1 µg/m 3 N/A 42005 24-hour 35 µg/m 3 31.1 µg/m 3 N/A 4Annual 15 µg/m 3 10.6 µg/m 3 N/A 43-year 24-hour 35 µg/m 3 29.5 µg/m 3 Noaverage(2005- 2007)Annual 15 µg/m 3 10.1 µg/m 3 NoSite No. 2 (76 Dorrance Street, Providence; 6.9 miles north of T.F. <strong>Green</strong> <strong>Airport</strong>)CO 2008 1-hour 35 ppm N/A N/A 58-hour 9 ppm N/A N/A 52007 1-hour 35 ppm N/A N/A 58-hour 9 ppm N/A N/A 52006 1-hour 35 ppm 4.2 ppm No8-hour 9 ppm 2.5 ppm No2005 1-hour 35 ppm 7.9 ppm No8-hour 9 ppm 2.5 ppm NoSO2 2008 3-hour 0.5 ppm N/A N/A 524-hour 0.14 ppm N/A N/A 5Annual 0.030 ppm N/A N/A 52007 3-hour 0.5 ppm N/A N/A 524-hour 0.14 ppm N/A N/A 5Annual 0.030 ppm N/A N/A 52006 3-hour 0.5 ppm 0.026 ppm No24-hour 0.14 ppm 0.017 ppm NoAnnual 0.030 ppm 0.004 ppm No2005 3-hour 0.5 ppm 0.036 ppm No24-hour 0.14 ppm 0.019 ppm NoAnnual 0.030 ppm 0.005 ppm NoChapter 4 – Affected Environment 4-40 July 2011\\mawatr\ev\09228.00\reports\<strong>FEIS</strong>_Final_July_2011\<strong>PVD</strong>_CH04_Affected_Env_JUL_2011.doc
T.F. <strong>Green</strong> <strong>Airport</strong> <strong>Improvement</strong> <strong>Program</strong>Environmental Impact Statement and Final Section 4(f) EvaluationTable 4-25Permanent RIDEM Air Monitors—Data Summary 2005 through 2008 1,2,3 (continued)Pollutant Year Averaging Time NAAQS Highest Measured Value Exceeds NAAQSSite No. 3 / Rockefeller Library, Providence / 7.1 miles north of T.F. <strong>Green</strong> <strong>Airport</strong>NO2 2008 Annual 0.053 ppm 0.012 ppm No2007 Annual 0.053 ppm 0.014 ppm No2006 Annual 0.053 ppm 0.015 ppm No2005 Annual 0.053 ppm 0.017 ppm NoSO 2 2008 3-hour 0.5 ppm 0.021 ppm No24-hour 0.14 ppm 0.011 ppm NoAnnual 0.030 ppm 0.002 ppm No2007 3-hour 0.5 ppm 0.039 ppm No24-hour 0.14 ppm 0.018 ppm NoAnnual 0.030 ppm 0.004 ppm No2006 3-hour 0.5 ppm 0.030 ppm No24-hour 0.14 ppm 0.020 ppm NoAnnual 0.030 ppm 0.005 ppm No2005 3-hour 0.5 ppm 0.048 ppm No24-hour 0.14 ppm 0.023 ppm NoAnnual 0.030 ppm 0.006 ppm NoSite No. 4 / Francis School, East Providence / 8.7 miles north of T.F. <strong>Green</strong> <strong>Airport</strong>O3 2008 8-hour 0.075 ppm 0.088 ppm Yes 42007 8-hour 0.075 ppm 0.096 ppm Yes 42006 8-hour 0.075 ppm 0.095 ppm Yes 42005 8-hour 0.075 ppm 0.095 ppm Yes 4CO2008 1-hour 35 ppm 1.5 ppm No8-hour 9 ppm 1.0 ppm No2007 1-hour 35 ppm 1.8 ppm No8-hour 9 ppm 1.1 ppm No2006 1-hour 35 ppm 2.5 ppm No8-hour 9 ppm 1.6 ppm No2005 1-hour 35 ppm 2.8 ppm No8-hour 9 ppm 1.6 ppm NoChapter 4 – Affected Environment 4-41 July 2011\\mawatr\ev\09228.00\reports\<strong>FEIS</strong>_Final_July_2011\<strong>PVD</strong>_CH04_Affected_Env_JUL_2011.doc
T.F. <strong>Green</strong> <strong>Airport</strong> <strong>Improvement</strong> <strong>Program</strong>Environmental Impact Statement and Final Section 4(f) EvaluationTable 4-25Permanent RIDEM Air Monitors—Data Summary 2005 through 2008 1,2,3 (continued)Pollutant Year Averaging Time NAAQS Highest Measured Value Exceeds NAAQSSite No. 5 / EPA Laboratory, Narragansett / 16 miles south of T.F. <strong>Green</strong> <strong>Airport</strong>O 3 2007 8-hour 0.08 ppm 0.085 ppm Yes 62006 8-hour 0.08 ppm 0.086 ppm Yes 62005 8-hour 0.08 ppm 0.089 ppm Yes 62007 8-hour 0.08 ppm 0.085 ppm Yes 6Source: EPA, 2009 www.epa.gov/air/data/geosel.html, compiled by KB Environmental Sciences, Inc.; and RIDEM, 2010. Source: EPA, 2009.NAAQS National Ambient Air Quality Standards.µg/m 3 micrograms per cubic meter.ppm parts per million.PM10 particulate matter less than 10 micrometers in diameter.PM2.5 particulate matter less than 2.5 micrometers in diameter.CO carbon monoxide.SO2 sulfur dioxide.NO2 nitrogen dioxide.O3 ozone.N/A Not available.Notes: See Figure 4-18 for the locations of the monitoring stations.Additional pollutants other than those identified in this table are also measured at the RIDEM air monitoring stations. Only those pollutants that are measuredclosest to T.F. <strong>Green</strong> <strong>Airport</strong> are reported here. A more complete summary can be obtained at www.dem.ri.gov/topics/air.htm.Lead (Pb) is not reported as RIDEM discontinued monitoring of this EPA criteria air pollutant in 1992 as the levels were consistently below the NAAQS.1 Years 2005 through 2008 are the four most current years for which data is presently available.2 Presently, there are eight permanent air monitoring stations in Rhode Island that are operated by RIDEM. The five stations reported in this table were selectedbecause they are closest to T.F. <strong>Green</strong> <strong>Airport</strong>.3 The reported values include annual average values for PM2.5, SO2, and NO2, including the average for the maximum three-year period for PM2.5 . The reportedvalues for 24-hour PM10 is the fourth highest value for the three-year period ending in that year, for 24-hour PM2.5 is the 98 th percentile value for that year, for1- and 8-hour CO and 3- and 24-hour SO2 is the second maximum value for that year, and for 8-hour O3 is the average of the fourth maximum values each yearfor the three-year period ending in that year.4 The NAAQS are compared to a three year average, not individual years.5 The Dorrance Street monitor stopped recording CO and SO2 data beginning midway through 2007.6 Measured values at the Francis School, East Providence monitor exceeded the NAAQS for O3 11 times in 2007 based on the 8-hour ozone NAAQS (0.075 ppm).The next closest O3 monitor to T.F. <strong>Green</strong> <strong>Airport</strong> is the Narragansett site located approximately 16 miles to the south. Violations of the NAAQS have alsooccurred at this station indicating that elevated O3 levels occur regionally and are not confined to Warwick or the <strong>Airport</strong> area.As shown in Table 4-25, the most recent air monitoring data collected by RIDEM in the Providence area arewithin the NAAQS for all of the criteria pollutants, again with the exception of O 3. Ozone levels at theFrancis School station, northeast of downtown Providence, exceeded the 1997 eight-hour NAAQS for thispollutant several times in 2007 and 2008. Violations have also occurred at the Narragansett site in southeasternRhode Island indicating that elevated O 3levels are regional occurrences that extend throughout the state,including Warwick and the area around T.F. <strong>Green</strong> <strong>Airport</strong>.RIDEM Air Quality StudyIn partnership with the City of Warwick, RIDEM completed a year-long air monitoring study in the vicinity ofT.F. <strong>Green</strong> <strong>Airport</strong> in 2005. The data were collected at four sites on (or adjacent to) the <strong>Airport</strong> and in the neighboringcommunity and then compared to similar data collected away from the <strong>Airport</strong> in Providence, East Providence,Pawtucket and West <strong>Green</strong>wich. The list of pollutants measured comprises 78 different compounds that areclassifiable as HAPs, total black carbon, and PM 2.5. The results 197 are summarized as follows:• PM 2.5levels were within NAAQS.197 The results are available on the RIDEM website at: www.dem.ri.gov/programs/benviron/air/slides/tfgreen_files/frame.htm.Chapter 4 – Affected Environment 4-42 July 2011\\mawatr\ev\09228.00\reports\<strong>FEIS</strong>_Final_July_2011\<strong>PVD</strong>_CH04_Affected_Env_JUL_2011.doc
T.F. <strong>Green</strong> <strong>Airport</strong> <strong>Improvement</strong> <strong>Program</strong>Environmental Impact Statement and Final Section 4(f) Evaluation• Levels of HAPs were within acute (short-term) health benchmarks.• Levels of HAPs were above chronic (long-term) benchmarks, but are the same as elsewhere in Rhode Island.• Black carbon levels were elevated downwind of the <strong>Airport</strong> in comparison to other stations; the <strong>Airport</strong> issuspected as a source.• Formaldehyde levels were elevated at one site near the <strong>Airport</strong> but the source is currently undetermined.RIAC Permanent Air Quality Monitoring <strong>Program</strong>RIAC implemented a permanent air monitoring system around the <strong>Airport</strong> in early 2008. 198 This system iscomprised of four separate monitoring stations located north, east, west and south of the <strong>Airport</strong> and wasdeveloped in accordance with state law and monitors ambient levels of PM 2.5, ultra-fine PM, black carbon and avariety of other HAPs. The resulting data are reported to RIDEM on a quarterly basis.4.7 Historic, Architectural, Archaeological, and Cultural ResourcesThis section discusses the methods used to survey historical, architectural, archaeological, and culturalresources and describes the resources identified within the Project Area.4.7.1 MethodologyAll surveys were conducted following the methodology defined in The Secretary of the Interior's Standards andGuidelines for Archeology and Historic Preservation and National Park Service Bulletin #24 – Guidelines for Local199, 200Surveys: A Basis for Preservation Planning. The initial step of each survey was to define the Area of PotentialEffect (APE), which is discussed further below. The surveys involved a review of existing cultural resourcesurvey information to identify known historical properties within the APE; historical contexts that outline themajor themes and events in the development of the <strong>Airport</strong> and its surrounding neighborhoods; fieldwork andvisual inspection to confirm the location and current condition of previously recorded historic properties in theAPE and to locate previously unidentified historical properties; and preparation of Rhode Island HistoricalPreservation and Heritage Commission (RIHPHC) Inventory Forms for buildings and archaeological site formsfor sites that appear to have potential for listing in the National Register of Historic Places (NRHP). Criteria(criteria A-D) established by the National Park Service for registering properties in the NRHP were employed inthe preliminary assessment to identify potential direct and indirect impacts within the APE.For potential archaeological resources, state site files research, archival studies, and a walkover inspection ofundisturbed areas within the APE where direct impacts would occur were conducted. RIAC provided supplementalinformation on the history of landscape development on and surrounding the areas of proposed improvements. TheCity of Warwick historical context is drawn from information contained in the Comprehensive Plan of the City ofWarwick, Historic Element, 201 and from the 1981 Statewide Historical Preservation Report. 202198 Air Quality Monitoring Work Plan for T.F. <strong>Green</strong> <strong>Airport</strong>, Prepared in Support of the State of Rhode Island Permanent Air Quality Monitoring Act, RhodeIsland <strong>Airport</strong> Corporation. October 29, 2007.199 Standards and Guidelines for Archaeology and Historic Preservation, National Park Service, 1983.200 National Park Service Bulletin #24, Guidelines for Local Surveys: A Basis for Preservation Planning, National Park Service, 1985.201 Comprehensive Plan of the City of Warwick, Historic Element, City of Warwick, 2002, from the City of Warwick website, accessed January 30, 2006.202 Statewide Historical Preservation Report, Report K-W-1, Rhode Island Historical Preservation and Heritage Commission, 1981.Chapter 4 – Affected Environment 4-43 July 2011\\mawatr\ev\09228.00\reports\<strong>FEIS</strong>_Final_July_2011\<strong>PVD</strong>_CH04_Affected_Env_JUL_2011.doc
T.F. <strong>Green</strong> <strong>Airport</strong> <strong>Improvement</strong> <strong>Program</strong>Environmental Impact Statement and Final Section 4(f) EvaluationThe survey of above-ground resources evaluated all properties within the APE that are at least 50 years old andretain some degree of their historical architectural integrity. Properties that are less than 50 years of age, buthave particularly important historical associations or architectural significance, were also evaluated. Forarchaeological sites the evaluation criteria included presence or absence of cultural material in meaningfulcontexts and analysis to assess the information potential of each site identified.The FAA entered into government to government consultation with the Narragansett Indian Tribe, represented bythe Narragansett Indian Tribal Historic Preservation Office (NITHPO). The NITHPO was invited, and accepted, toparticipate in consultation as part of the Coordination Group. Consultation has been ongoing since 2005 and hasincluded formal Coordination Group meetings and individual meetings between FAA and NITHPO. NITHPOidentified the importance of protecting archaeological sites and the need to monitor archaeological investigationsthat would be carried out during the course of the project. FAA and NITHPO reached agreement for NITHPO tomonitor subsurface archaeological investigations. The FAA also coordinated with RIHPHC on draft historical,architectural, archaeological, and cultural resources findings and draft reports.4.7.1.1 Study Area and Area of Potential EffectUnder Section 106 of the National Historic Preservation Act of 1966, as amended, the APE is defined as “thegeographic area or areas within which an undertaking may directly or indirectly cause alterations in thecharacter or use of historical properties, if any such properties exist.” 203 The APE for the <strong>Improvement</strong> <strong>Program</strong>was determined by the potential effects of the project to historical properties by:• A physical taking or modification or by a construction-related taking or modification to the historicalproperty (direct impacts); or• By affecting the qualities for which the historical property is eligible or listed in the NRHP (indirectimpacts), including the introduction to environmental impacts (e.g., increases in noise) or the potentialalteration or obstruction of the setting of those historical properties.Refer to Figure 4-19 for the location of the APE.4.7.2 Affected EnvironmentThis section provides a summary of the major themes and events of the area and provides a context forevaluating historical properties identified within the <strong>Airport</strong> APE.4.7.2.1 Historical ContextWhen the first Europeans arrived in Warwick between 1638 and 1640 they encountered at least four majorsubdivisions of the larger Narragansett Tribe: Shawmets, Potowomuts, Cowesetts, and Pawtuxets.Native American settlement at the time of European contact focused upon near-coastal and coastal confluencesof rivers and streams. A network of fields and collecting territories surrounded concentrations of dwellings. Theimportance of waterways in Native landscape perspectives is reflected in their use as territorial and boundarymarkers as lands were transferred from Native to European possession.203 Section 106 of the National Historic Preservation Act of 1966, 36 CFR 800.16 (d).Chapter 4 – Affected Environment 4-44 July 2011\\mawatr\ev\09228.00\reports\<strong>FEIS</strong>_Final_July_2011\<strong>PVD</strong>_CH04_Affected_Env_JUL_2011.doc
T.F. <strong>Green</strong> <strong>Airport</strong> <strong>Improvement</strong> <strong>Program</strong>Environmental Impact Statement and Final Section 4(f) EvaluationThe City of Warwick was first settled by English Colonists in 1643 and was one of four independent Narragansett Baysettlements that were consolidated the following year to form the colony of Rhode Island and Providence Plantations.Throughout the 17th and 18th centuries Warwick grew around several nodes of settlement that were spread over anexpansive area extending from Narragansett Bay to the Connecticut Colony border. The early economy was basedprimarily on agricultural production, but maritime industries became increasingly important as the period wore on.The onset of the Industrial Revolution in the early 19th century caused significant changes in the settlement pattern ofWarwick where a number of textile operations sprang up along the interior streams. Improved transportation routes,initially in the form of turnpikes such as the New London Turnpike (opened in 1821) and later the establishment of railservice via the Stonington Railroad in the 1830s facilitated the movement of goods and people within the western halfof Warwick. The first concerted development of the area encompassing the present-day T.F. <strong>Green</strong> <strong>Airport</strong> siteoccurred during the period immediately following the Civil War.The creation of T.F. <strong>Green</strong> <strong>Airport</strong> had a profound effect on the development patterns of the western section ofWarwick in the 20th century. By the early 1920s, Rhode Island had a number of small airfields that served aburgeoning number of aircraft. Recognizing the economic potential of air freight and passenger travel, Providenceareabusinessmen began lobbying for a centralized, state-operated airfield. In 1925, the state legislature authorized astudy to investigate appropriate locations for the airfield. The initial results were presented two years later and therecommendations included two possible locations in Warwick, Gaspee Point and Gaspee Plateau. After having lostmuch of its industrial base when West Warwick was established in 1913, Warwick was particularly interested in thepotential of an airport to spur commercial development. In 1928, the Warwick Town Council passed a resolutionasking the Governor to establish an airport in Warwick. Based on recommendations from the New York engineeringfirm Black and Bigelow, a 158-acre tract in the Hillsgrove section of Warwick was ultimately selected in 1929 as thesite for a state airfield. Work was begun on clearing and grading the first turf runways in 1929. The State <strong>Airport</strong> atHillsgrove, as it was originally known, became the nation’s first state-owned airport to open for commercial traffic,and was officially dedicated on September 26, 1931.4.7.2.2 Identified Historical Architectural Resources within the APE on <strong>Airport</strong> PropertyOne property in the APE and on <strong>Airport</strong> property was previously surveyed and listed in the NRHP: theRhode Island State <strong>Airport</strong> Terminal (Figure 4-20, No. 5). Two properties within the APE were previouslysurveyed and identified as eligible for listing in the NRHP: Hangar No. 1, 628-644 <strong>Airport</strong> Road (Figure 4-20,No. 4); and Hangar No. 2 (Figure 4-20, No. 6).On January 1, 2009, the Rhode Island State Historic Preservation Office (RISHPO) in this case the Rhode IslandHistorical Preservation and Heritage Commission (RIPHPC), after reviewing a survey conducted by FAA,offered the opinion that Hangar No. 1 and No. 2 along with the Rhode Island State <strong>Airport</strong> Terminal Buildingwarranted consideration as a potential historic district eligible for inclusion on the NRHP, and that the airfield,although altered through time, should be included in this district. On April 27, 2009, the FAA determined thatHangar No. 1 and No. 2, and the Rhode Island State <strong>Airport</strong> Terminal Building as well as portions of the airfieldwere eligible for listing in the NRHP as a historic district (Figure 4-20, No. 12). Chapter 7, Final Section4(f)/Section 6(f) Evaluation, provides a more detailed description of the eligible airport historic district,Hangar No. 1 and No. 2, and the Rhode Island State <strong>Airport</strong> Terminal Building.Chapter 4 – Affected Environment 4-45 July 2011\\mawatr\ev\09228.00\reports\<strong>FEIS</strong>_Final_July_2011\<strong>PVD</strong>_CH04_Affected_Env_JUL_2011.doc
T.F. <strong>Green</strong> <strong>Airport</strong> <strong>Improvement</strong> <strong>Program</strong>Environmental Impact Statement and Final Section 4(f) Evaluation4.7.2.3 Identified Historical Architectural Resources Off-<strong>Airport</strong>The following eight properties within the APE are located off-<strong>Airport</strong> (Figure 4-20):• Pawtuxet Village Historic District;• Christopher Rhodes House;• John Waterman Arnold House;• Warwick Civic Center Historic District;• Apponaug Historic District;• Caleb <strong>Green</strong>e House;• Cowesett Pound; and• Amasa Sprague Estate Stone Wall.4.7.2.4 Cemeteries Within the APEThe APE includes six historical cemeteries: two on the <strong>Airport</strong> property (Warwick Historical Cemetery No. 26and No. 81); and four (Warwick Historical Cemetery No. 63, No. 76, No. 77, and No. 78) within the non-<strong>Airport</strong>portion of the APE. Figure 4-20 shows these resources. None of these cemeteries are considered eligible forlisting in the NRHP, however, they are protected under state law (RI General Laws 42 45-1 et seq.; RI GeneralLaws 23-18-1 et seq.) and local ordinance (Chapter 12 of the Code of Ordinances of the City of Warwick).Archaeological investigations at Warwick Historical Cemetery (WHC) 26, 76, 77, and 78 were completed inApril 2011. The boundaries of WHC 26 and 76 were determined, and the boundaries of WHC 77 and 78 havenot been confirmed. 204 The results of these surveys will assist FAA and RIAC in further consultation with theWarwick Historical Cemetery Commission (WHCC) and the NITHPO relative to potential impacts resultingfrom the T.F. <strong>Green</strong> <strong>Airport</strong> <strong>Improvement</strong> <strong>Program</strong> in accordance with Section 106 of the National HistoricPreservation Act, as amended, Rhode Island General Law 23-18-1 et seq., and Chapter 12 of the Code ofOrdinances of the City of Warwick. Details of the surveys are provided below.Archaeological investigations were undertaken between April 7 and 12, 2011 under Permit No. 2011-02 (issuedby the RIHPHC on January 7, 2011) to define the limits of the four historical cemeteries (WHC 26; WHC 76;WHC 77; and WHC 78 located in the APE. As required by Rhode Island General Law 23018-1 et. seq. andChapter 12, FAA and RIAC met with the WHCC. Machine-assisted topsoil removal exposed five unmarkedgraves north, east, and west of the upright burial markers. These grave shafts appeared as rectangular outlinesof mottled sands and gravels that had been dug into the underlying subsoil.Freeman Burial Lot (WHC 26)Machine-assisted topsoil removal at the Freeman Burial Lot (WHC 26) on the <strong>Airport</strong> property resulted in arefinement of the cemetery’s boundaries. The burial ground is larger than upright burial markers andmonuments indicate, measuring approximately 36 m x 25 m (118 ft x 88 ft). The discovery of five unmarkedgrave shafts indicates the potential for additional unmarked interments within the cemetery. Two areas ofNarragansett Indian Tribal concern were observed within the Freeman Lot (WHC 26) during the archaeologicalcemetery delineation.204 The exact boundaries of WHC 77 and 78 are not confirmed because permission has not been granted to strip top soils around the perimeter of visibleheadstones at these cemeteries. At this time the unconfirmed boundary for WHC 78 is the limits of the designated cemetery lot.Chapter 4 – Affected Environment 4-46 July 2011\\mawatr\ev\09228.00\reports\<strong>FEIS</strong>_Final_July_2011\<strong>PVD</strong>_CH04_Affected_Env_JUL_2011.doc
T.F. <strong>Green</strong> <strong>Airport</strong> <strong>Improvement</strong> <strong>Program</strong>Environmental Impact Statement and Final Section 4(f) EvaluationFAA and RIAC will continue to consult with the WHCC regarding impacts to this cemetery in accordance withChapter 12 of the City of Warwick ordinances and Rhode Island General Law 23-18-11. FAA and RIAC willalso continue consultation with the NITHPO and discuss the effects <strong>Airport</strong> improvements may have on eitherof these resources.Cole Lot (WHC 76)The area surrounding the Cole Lot was examined byground penetrating radar (GPR). Data along 26 GPR transectswere collected, covering an area approximately 1,500 square feet. A number of deep discontinuous reflections wereidentified that were not interpreted as grave shafts. Within these general areas of soil disturbance are strongreflections representing possible lenses of gravel that occur naturally in the soils. The GPR survey of the Cole Lotsuggests that there are no grave shafts outside of the currently delineated boundary represented by the iron fence.Northup Lot (WHC 77)Investigations at the Northup Lot consisted of a combination of GPR and machine stripping. The GPR surveyconsisted of 24 transects covering approximately 1,200 square feet and produced multiple reflections consistentwithin disturbed, previously excavated soils, or potential grave shafts including several between the stockadewood fence north of the Northup Lot and Main Avenue. Machine stripping between Main Avenue and thefence only exposed two subsurface anomalies that are 20th century in origin and not associated with thecemetery. No other indications of subsurface disturbance indicating potential graves were noted in the trench.Howard, Remington, Arnold, Ransbottom (WHC 78)GPR survey of this site consisted of 53 individual transects covering approximately 2,600 square feet, indicatingmultiple reflections consistent with disturbed or previously excavated soils. The survey also indicated irregularreflections characteristic of natural layering produced by soil formation processes. The GPR survey producedseveral strong reflections between the cemetery and Main Avenue within an area of general soil disturbance.The survey at WHC 78 identified several locations that potentially could be unmarked burials. The presence ofunmarked burials could be confirmed through subsurface investigations if such investigations are approved byproperty owners.4.7.2.5 Archaeological Sites Identified within the APEThree pre-contact Native American archaeological sites were identified within the APE. They are designated theDouble L site, the Top Flight site, and the Striped Feather site. Figure 4-21 shows the general location of thesesites. Based on site examinations, the Striped Feather site did not meet the criteria for listing in the NRHP. TheDouble L site has been determined conditionally eligible pending additional subsurface investigations. The TopFlight site was determined potentially significant for the information it contains relative to understanding pastNative American activities in and around the Buckeye Brook watershed.A number of areas within the APE have not been surveyed because of denied access and/or later changes in thedesign of the <strong>Improvement</strong> <strong>Program</strong>. Later changes in the design concepts include the development ofAlternative B4 to with a Realigned Main Avenue (as described below) and the identification of proposedwetland mitigation areas. Additional archaeological survey would be conducted in areas where direct impactsChapter 4 – Affected Environment 4-47 July 2011\\mawatr\ev\09228.00\reports\<strong>FEIS</strong>_Final_July_2011\<strong>PVD</strong>_CH04_Affected_Env_JUL_2011.doc
T.F. <strong>Green</strong> <strong>Airport</strong> <strong>Improvement</strong> <strong>Program</strong>Environmental Impact Statement and Final Section 4(f) Evaluationwould occur to determine the presence or absence of potentially significant archaeological sites. These surveyswould be conducted before any ground disturbing activities would commence.In response to a request from NITHPO, a Phase I(c) archaeological investigation was conducted along RealignedMain Avenue under Permit No. 2011-03 (issued by RIHPHC on January 7, 2011). Field investigations, consisting ofthe excavation of 14 trenches along the center line of the proposed realignment were conducted between April 5 and7, 2011. The trench excavations, monitored by NITHPO, exposed 20th century domestic debris and evidence forhouse lots along its entire course. Machine excavation did not locate any pre-contact Native American culturalfeatures or deposits. The results of the survey have been forwarded to the RIHPHC and NITHPO for review.4.8 Section 4(f) and 6(f) ResourcesSection 4(f) of the U.S. Department of Transportation (DOT) Act of 1966 205 requires DOT agencies to protect certainpublic resources. These protected resources, referred to as Section 4(f) resources, include publicly owned parks,recreation areas, wildlife or waterfowl refuges, or historical properties of national, state, or local significance. 206Similarly, properties acquired with Section 6(f) resources of the Land and Water Conservation Fund Act of 1965, 207 whichprovides funds for buying or developing public use recreational lands through grants to local and state governments,states that property purchased or developed with funds under the Act may not be converted to other than outdoorpublic recreation uses without approval of the Department of Interior’s and National Park Service. This sectiondiscusses the methods used to assess Section 4(f) and Section 6(f) resources and describes the resources identifiedwithin the Project Area and Study Area. Chapter 7, Final Section 4(f)/Section 6(f) Evaluation, provides an evaluation ofSection 4(f) and Section 6(f) resources that were determined to be impacted by the <strong>Improvement</strong> <strong>Program</strong>.4.8.1 MethodologySection 4(f) and Section 6(f) resources were identified within the Study Area and Project Area using the NaturalResources, Open Space, and Recreation chapter of the City of Warwick Comprehensive Plan, (updated 2002),available State of Rhode Island Geographic Information Systems data on public parks and recreation space,available street maps and atlases, United States Geological Survey Quadrangle Maps, the City of Warwickwebsite, field reconnaissance, historical research, and consultation with local officials having jurisdiction overresources typically protected under Section 4(f) and Section 6(f). The City of Warwick also providedconfirmation of Section 4(f) resources. 208 Potential Section 6(f) resources were identified using the National ParkService (NPS) database of Land and Water Conservation Fund Act projects, 209 which was followed up by furtherresearch of project files at the Rhode Island Department of Environmental Management (RIDEM) offices.4.8.1.1 Project Area and Study AreaThe Project Area includes the T.F. <strong>Green</strong> <strong>Airport</strong> property and land immediately adjacent to the <strong>Airport</strong>. TheStudy Area for Section 4(f) and Section 6(f) resources is derived from the APE for indirect impacts for historical205 U.S. Department of Transportation Act of 1966, Section 4(f), 49 U.S.C., section 303(c).206 Ibid. Approval of <strong>Program</strong>s and Projects.207 Section 6(f) of the Land and Water Conservation Fund Act of 1965, codified at Title 16 U.S.C., section 4601-8(f)(3) (Section 6[f]).208 City of Warwick, TF <strong>Green</strong> EIS Information Request, Memorandum, February 22, 2006.209 National Park Service, U.S. Department of Interior, www.nps.gov/ncrc/programs/lwcf/.Chapter 4 – Affected Environment 4-48 July 2011\\mawatr\ev\09228.00\reports\<strong>FEIS</strong>_Final_July_2011\<strong>PVD</strong>_CH04_Affected_Env_JUL_2011.doc
T.F. <strong>Green</strong> <strong>Airport</strong> <strong>Improvement</strong> <strong>Program</strong>Environmental Impact Statement and Final Section 4(f) Evaluationresources as described in Section 4.7.1.1, Study Area and Area of Potential Affect. The Study Area encompasses thelargest geographic effect with the potential to impair the use of Section 4(f) and Section 6(f) resources.4.8.2 Affected EnvironmentThis section describes Section 4(f) and Section 6(f) resources within the Study Area.4.8.2.1 Historical ResourcesSection 4(f) historical resources include 12 sites (shown in Figure 7-1) listed or eligible for listing in the NRHP,four of which are on <strong>Airport</strong> property. These resources are:• Pawtuxet Village Historic District• Rhodes (Christopher) Historic Site• John Waterman Arnold Historic Site• Rhode Island State <strong>Airport</strong> Terminal (on-<strong>Airport</strong>)• Hangar No. 1 (on-<strong>Airport</strong>)• Hangar No. 2 (on-<strong>Airport</strong>)• Eligible airport historic district (on-<strong>Airport</strong>) 210• Warwick Civic Center Historic District• Apponaug Historic District• Caleb <strong>Green</strong>e House• Cowesett Pond• Amasa Sprague Estate Stone WallsAdditional information on these resources is provided in Section 4.7, Historic, Architectural, Archaeological, andCultural Resources. All historical architectural resources are listed in the NRHP with the exception of threeon-<strong>Airport</strong> resources: the eligible airport historic district, Hangar No. 1, and Hangar No. 2 have beendetermined by the FAA and RISHPO to be eligible for listing in the NRHP. The eligibility of the eligible airporthistoric district was precipitated by an FAA survey and subsequent review and statement by RISHPO that itappeared to be eligible for listing as a historic district. Chapter 7, Final Section 4(f)/Section 6(f) Evaluation,provides a more detailed description of the eligible airport historic district, Hangars No. 1 and No. 2, and theRhode Island State <strong>Airport</strong> Terminal.4.8.2.2 Recreational ResourcesSection 4(f) public parks and recreation areas identified within the Study Area are listed in Table 4-26. The tablealso notes which public parks and recreation areas are Section 6(f) resources. Section 4(f) and Section 6(f)recreational resources are shown on Figure 7-1. There are no wildlife or waterfowl refuges within the StudyArea. There are 23 Section 4(f)-protected and four Section 6(f)-protected public parks and recreation areaswithin the Study Area that have the potential to be indirectly affected by changes in noise levels.210 Refer to DEIS Historic Resources Technical Report, Chapter 2 Affected Environment for details on the Determination of Eligibility for the District.Chapter 4 – Affected Environment 4-49 July 2011\\mawatr\ev\09228.00\reports\<strong>FEIS</strong>_Final_July_2011\<strong>PVD</strong>_CH04_Affected_Env_JUL_2011.doc
T.F. <strong>Green</strong> <strong>Airport</strong> <strong>Improvement</strong> <strong>Program</strong>Environmental Impact Statement and Final Section 4(f) EvaluationTable 4-26 Section 4(f) Parks and Recreation Areas within the Study Area and Project Area 1, 2PropertySizeName Location Type Ownership Functions (acres) 3Adams Playground Adams Street Playfield City of Warwick Basketball court, tot lot, open space 1.95Apponaug Park Post Road Park City of Warwick Historical significance, landscape 0.24Arnold’s Neck Waterfront Park Hallworth Drive Park City of Warwick Playground, municipal dock, lawn area, parking 2.53Arnold’s Pond Beach Warwick Avenue Beach City of Warwick 100 linear feet of freshwater beach 0.67George Boyd Field 5 600 Sandy Lane Playfield4 City of Warwick Lighted ball field, open space 2.3Gorton Pond Beach 5 Post Road Beach City of Warwick Freshwater beach, parking, restroom facilities, walking paths 3.95<strong>Green</strong>wood School Playfield 93 Sharon Street Playfield City of Warwick Basketball court, ball field, tot lot, parking 1.11Groveland Park West Shore Road at Park City of Warwick Open space 0.3Normandy DriveHolliman School Playfields and Tot 70 Deborah Road Playfield City of Warwick Playfields, tot lot N/ALotJohn Wickes School Playfield 1, 4 50 Child Lane Playfield City of Warwick Ball field, basketball court, open space4.8Kenney Field Jefferson Boulevard Playfield City of Warwick Ball field, woodland 3.32leases from ownerLippitt School Playground 20 Almy Street (fields on Playground City of Warwick Ball field, basketball court, open space 3.31Gulf Street)Little Pond Beach West Shore Road Beach City of Warwick Freshwater beach, tot lot N/AMickey Stevens Sports Sandy Lane Recreation City of Warwick Ice rinks, indoor swimming pool, tennis courts, 41.85Complex1, 5 Complex basketball courts, soccer and baseball fields,volleyball courts, concessions, restrooms, parkingNausauket School Playfield 70 Nausauket Road Playfield City of Warwick Basketball court, tot lot, open space 4.55O’Brien Field Playfield Veterans Memorial Drive Playfield City of Warwick Ball fields, basketball court, tot lot 4.1Pilgrim High School Playfield 111 Pilgrim Parkway (fields Playfield City of Warwick Tennis courts, football field, track, softball field, 10.78off Fairfax Drive)baseball/soccer field, bleachers, parkingRandall Holden School Playfield 61 Hoxsie Avenue Playfield City of Warwick Baseball field, basketball court, open space 1.69Sand Pond Beach Massasoit Drive and Beach City of Warwick Freshwater beach 3.1Puritan DriveWarwick Pond Beach End of Stanmore Road Beach/Park City of Warwick Freshwater beach and park 0.35Warwick Veterans Memorial High 2401 West Shore Road Playfield City of Warwick Football field, track, baseball field, small track, tennis 30.74School Field (fields off Fletcher Street) courts, parking, bleachersWhittaker Field North Country Club Drive Playfield City of Warwick Basketball court, playfields 13.02Winslow Park1, 5, 6, 7 98 Greeley Avenue Playfield/Park City of Warwick Softball and soccer fields, walking path, 4.3RIAC playgrounds, concessions, restroom, parking 27.4Sources: City of Warwick Comprehensive Plan, 2002; VHB, Inc.1 Resources located in the Project Area are in bold text.2 All resources are located in the City of Warwick.3 The acreage noted in the table describes the portion of the associated parcel used for public park land or recreation. Figure 7-1 shows the entirety of theassociated parcel, and the size may differ.4 Per the City of Warwick 1993 Comprehensive Plan, a playfield is defined as a recreational area dominated by athletic fields for organized team sports.5 The park also contains Section 6(f) property.6 Winslow Park includes approximately 4.3 acres owned by the City of Warwick, and approximately 27.4 acres owned by RIAC and leased to the City of Warwick.26.0 acres of the leased area are actively used for recreational activities.7 The state owned lands have been included as a Section 4(f) resource for the purpose of this <strong>FEIS</strong> analysis.Chapter 4 – Affected Environment 4-50 July 2011\\mawatr\ev\09228.00\reports\<strong>FEIS</strong>_Final_July_2011\<strong>PVD</strong>_CH04_Affected_Env_JUL_2011.doc
T.F. <strong>Green</strong> <strong>Airport</strong> <strong>Improvement</strong> <strong>Program</strong>Environmental Impact Statement and Final Section 4(f) EvaluationThe Warwick-East <strong>Green</strong>wich Bicycle Network was determined not to be a Section 4(f) resource because the networkis not a separate recreational facility and is used for transportation purposes. The Warwick-East <strong>Green</strong>wich BicycleNetwork is limited to signs marking the bike route on existing public roads, and is not on a separate public right-ofway.Section 4(f) does not apply to bicycle routes or bicycle lanes within highway right-of-way because they do notconstitute a separate recreational facility. 211 RIDOT’s bicycle system map notes that the Warwick-East <strong>Green</strong>wichBicycle Network includes statewide signage marking the bike route. 212 A Guide to Cycling in the Ocean State, which wasdeveloped by RIDOT and the Narrangansett Bay Wheelmen to assist experienced and commuter cyclists in planningtrips on roadways, indicates that the Warwick-East <strong>Green</strong>wich Bicycle Network is a “suitable road” for bicycling. 213In 2004, the Wells Avenue Playground was included in the baseline assessment. It was similarly determined not to bea Section 4(f) resource because it is on land owned by RIAC, and was a temporary use of transportation land. At thetime of the <strong>FEIS</strong> filing, the Wells Avenue Playground is no longer in existence. The City of Warwick has removed allthe playground equipment on the property.Of the 23 parks and recreational areas within the Study Area, four are also Section 6(f) resources. Two of theseresources, Winslow Park and the Mickey Stevens Sports Complex, are within the Project Area and have thepotential to be directly impacted by the <strong>Airport</strong> <strong>Improvement</strong> <strong>Program</strong>. A portion of the land in Winslow Parkis a Section 6(f) resource as Land and Water Conservation Fund Act funds were provided to the City ofWarwick for various improvements in the 1970s and 1980s. The NPS received a copy of the DEIS for review.Since the filing of the DEIS, the FAA has consulted with the NPS State Liaision Officer and RIDEM to determinethe boundary of the Section 6(f) regulated portion of Winslow Park. The Section 6(f) boundary map on file withthe NPS was recently revised to include only the City-owned portion of Winslow Park. The L&WCF grantswere approved by the NPS approximately three years before the RIAC-owned land was leased to the City.Please refer to refer to Appendix J, Section 4(f) and Section 6(f) Resources, for the City of Warwick’s request toRIDEM’s State Liaison Officer for a boundary change limiting the Section 6(f) boundary to the City-ownedportion of the park. In May 2011, RIDEM’s State Liaison Officer for the NPS indicated that the boundary changerequest from the City was approved by the NPS. 214The Mickey Stevens Sports Complex is also a Section 6(f) resource. Land and Water Conservation Fund Actfunds were provided to the City of Warwick for the construction of multipurpose playing fields and aswimming pool at the Sports Complex.4.9 Wetlands and WaterwaysThis section summarizes the methodology for identifying wetlands resources, and describes the wetlandsresources within the T.F. <strong>Green</strong> <strong>Airport</strong> Project Area.4.9.1 MethodologyThe limits of existing wetlands resources located outside <strong>Airport</strong> property in the Project Area and Study Areaare based on the RIGIS 215 wetlands database. Each wetland depicted within the Study Area (Figure 4-22) was211 U.S. Department of Transportation, Federal Highway Administration, FHWA Section 4(f) Policy Paper, March 1, 2005, pg. 21.212 State of Rhode Island Statewide Bicycle System 2010, www.dot.state.ri.us/img/content/bikeri/bikeplanfebruary2010.pdf.213 Rhode Island Department of Transportation, A Guide to Cycling in the Ocean State, 2009-2010.214 Dias, Joseph. Telephone communication with Kendra Beaver. May 19, 2011.215 Rhode Island Geographic Information System, www.edc.uri.edu/rigis.Chapter 4 – Affected Environment 4-51 July 2011\\mawatr\ev\09228.00\reports\<strong>FEIS</strong>_Final_July_2011\<strong>PVD</strong>_CH04_Affected_Env_JUL_2011.doc
T.F. <strong>Green</strong> <strong>Airport</strong> <strong>Improvement</strong> <strong>Program</strong>Environmental Impact Statement and Final Section 4(f) Evaluationfield-inspected to collect descriptive data used to classify and evaluate the wetland. The evaluation of wetlandfunctions and values follows the "Descriptive Approach” provided in the USACE Highway MethodologyWorkbook Supplement. 216 The Highway Methodology Workbook Supplement recognizes thirteen wetland functionsand values. These eight functions and five values can be grouped into the following four general categories:• Biological Functions;• Hydrological Functions;• Water Quality Functions; and• Societal Values.The degree to which a wetland provides each of these functions or values is determined by one or more of thefollowing factors: landscape position, substrate, hydrology, vegetation, history of disturbance, and size. Eachwetland may provide one or more of the listed functions or values at a significant level. Criteria used toevaluate the level at which a wetland provided each specific wetland function and value is found in the HighwayMethodology Workbook Supplement.The factors determining the level of function provided by a wetland can often be broken into two categories: theeffectiveness and the opportunity. The effectiveness of a wetland to provide a specified function is generallydependent on factors within the wetland, whereas the opportunity to provide a function is often influenced bythe wetland’s position in the landscape and adjacent land uses. A principal function or value is an importantphysical component of a wetland ecosystem, and/or considered of special value or significance to society, froma local, regional, and/or national perspective.The RIDEM Rules 217 Rule 10.02 recognizes that freshwater wetlands support wildlife and provide wildlifehabitat; support public recreation and aesthetic values; provide flood protection; protect surface water andgroundwater supplies; and protect water quality. These functions, and the criteria used to evaluate the level ofeach function a wetland provides, are similar to those described by the “Descriptive Approach”.4.9.2 Affected EnvironmentThe hydrologic setting influences some of the functions and values provided by wetlands. The Study Areaoccupies part of a broad outwash deposit known as the Warwick Plains Delta (Delta). The Delta is composedmostly of well-sorted sands and gravels deposited by melt waters during the last retreat of the North Americancontinental glacier from Rhode Island. During this deglaciation, Narragansett Bay and adjacent parts of RhodeIsland, including the <strong>Airport</strong>, were submerged beneath a freshwater lake, Glacial Lake Narragansett. The Deltawas formed as a submerged feature within this lake and was exposed after the deposits impounding the lakebreached, causing it to drain. Subsequent sea level rise again submerged the portion of the Delta south of the<strong>Airport</strong> site, forming <strong>Green</strong>wich Bay.The <strong>Airport</strong> passenger terminal and runways were built on a high part of the Delta that forms a drainage divide.Drainage flows east and south of the <strong>Airport</strong> to the Providence River (Narragansett Bay) and <strong>Green</strong>wich Bay.Drainage from much of the Study Area north and west of the <strong>Airport</strong> flows to the Pawtuxet River, which discharges216 Highway Methodology Workbook Supplement. NAEEP-360-1-30a. U.S. Army Corps of Engineers New England District. September 1999.217 Regulations Governing the Administration and Enforcement of the Freshwater Wetlands Act (RIDEM, 2010)Chapter 4 – Affected Environment 4-52 July 2011\\mawatr\ev\09228.00\reports\<strong>FEIS</strong>_Final_July_2011\<strong>PVD</strong>_CH04_Affected_Env_JUL_2011.doc
T.F. <strong>Green</strong> <strong>Airport</strong> <strong>Improvement</strong> <strong>Program</strong>Environmental Impact Statement and Final Section 4(f) Evaluationto the Providence River north of the <strong>Airport</strong>. Wetlands are present in eastern and northern parts of the <strong>Airport</strong> in theProject Area, and throughout the Study Area. These wetlands are situated in the large outwash delta, and thefreshwater wetlands are often supported by groundwater discharge. Project Area streams include Buckeye Brook,Spring <strong>Green</strong> Pond Brook, Tuscatucket Brook, Callahan Brook, and many smaller unnamed streams.4.9.2.1 Study Area WetlandsMany of the wetlands in the Study Area (Figure 4-22) are in urbanized watersheds. The wetland systemsassociated with Buckeye Brook, Warwick Pond, Callahan Brook, Tuscatucket Brook, the Three Ponds wetlandsystem, and others provide valuable water quality functions. These wetlands act to remove nutrients, toxicants,and sediments from stormwater. Table 4-27 summarizes the functions and values of these Study Area wetlands.Table 4-27Summary of Study Area Baseline Condition Wetland Functions and ValuesWetlandBaseline Condition Wetland Functions and Values (USACE, RIDEM)WetlandSystemArea(ac)GW R/D SWGFFA FPS/T/P R WQNR/R/T WQ PE S&S S F&SHWLH WWHT&ESH REC ED/SVU/H AESVQ/A AESA7 87.2 P P X X P X P P X XA9 0.6 X PA12 3.5 PA15 20.4 P P X P X X XB1 6.0 X X P PB2 11.2 P X XC 27.6 X X X X P XD 1.2 X XE 5.4 XG1 14.1 X X X X X X XG2 10.5 X X X X X X XG3 6.7 X X X X PG4 12.2 X P X X X XG5 11.3 X X P X X XH 10.6 X P X X XJ 12.6 X X X P XL1 1.5 XL2 22.8 X X X X XM 6.1 X X XN 17.1 X X X P XO 54 P P X X P X P P P X XNote: Refer to Figure 4-22.PXGWR/DFFAS/T/P RNR/R/TPES&S SF&S HWLHPrincipal Wetland Function or Value.Wetland Function or Value likely provided by wetland.Groundwater Recharge/Discharge.Flood Flow Alteration.Sediment/Toxicant/Pathogen Retention.Nutrient Removal/Retention/Transformation.Production Export.Sediment and Shoreline Stabilization.Fish and Shellfish Habitat.Wildlife Habitat.T&E SHRECED/SVU/HVQ/ASWGFPWWHWQAESacThreatened and Endangered Species Habitat.Recreation and Aesthetic.Educational/Scientific Value.Uniqueness/Heritage.Visual Quality/Aesthetics.Surface Water and Groundwater.Flood Protection.Wildlife and Wildlife Habitat.Water Quality.Aesthetic Value.Acre.Chapter 4 – Affected Environment 4-53 July 2011\\mawatr\ev\09228.00\reports\<strong>FEIS</strong>_Final_July_2011\<strong>PVD</strong>_CH04_Affected_Env_JUL_2011.doc
T.F. <strong>Green</strong> <strong>Airport</strong> <strong>Improvement</strong> <strong>Program</strong>Environmental Impact Statement and Final Section 4(f) Evaluation4.9.2.2 Project Area WetlandsWetlands within the Project Area (Figure 4-23) are mostly within the Buckeye Brook watershed, and providesurface water and groundwater support, flood protection, and water quality protection (sedimenttransformation/retention, nutrient transformation/retention). Buckeye Brook, Warwick Pond, and Spring<strong>Green</strong> Pond also provide fish and shellfish habitat. Wildlife habitat values of these wetlands are limited by thequality of the wetlands, and by the <strong>Airport</strong> perimeter fence that restricts movement of mammal species forsafety reasons. Wetlands in the southeastern and northern portions of the <strong>Airport</strong> have been encroached on bypast landfill operations, gravel removal, ditching, and road and runway construction. These encroachmentsreduce the functional values of these wetlands but within the built environment represent some of the onlyremaining habitat capable of supporting mammals, reptiles, amphibians, and birds. All of the wetlands withinthe Project Area are “waters of the United States” within federal and state jurisdiction. Table 4-28 lists thestate-jurisdictional resource areas associated with each wetland. Table 4-29 lists the functions and valuesassociated with each wetland within the Project Area.Table 4-28Project Area Baseline Condition Wetlands - State Jurisdiction Resource AreasAreaPerimeter RiverRiverbankSubject toWetland Width WetlandStorm SizeWetland Wetland Type (feet) (feet) (feet) Floodplain Flowage (acres)A1 Swamp/Wetland Complex 50 10 200 + - 14.5A6 Swamp 50 < 10 100 - 3.1A8 2 Forested Wetland - < 10 100 + + 16.3 Northern Finger(A8 total)A8 2 Swamp/Pond Complex 50 - - + - 16.3 Main Body(A8 total)A10 2 Swamp/Wetland Complex 50 >10 200 + - 25.6A11 2 Swamp/Wetland Complex 50 10 200A13 2 Swamp/Wetland Complex 50 >10 200 + - 19.4A14 2 Marsh 50 >10 200 + - 13.5A16 2 Emergent Plant Community - - - - + 0.6I Swamp/Marsh Complex 50 - - - + 15.3K Swamp 50 < 10 100 - - 26.2P Swamp 50 - - - + 17.11 Indicates presence (+) and absence (-) of wetland attribute.2 Wetland Limits and Types within <strong>Airport</strong> Property verified by the RIDEM Division of Water Resources. Additional Wetland Types may be present.Chapter 4 – Affected Environment 4-54 July 2011\\mawatr\ev\09228.00\reports\<strong>FEIS</strong>_Final_July_2011\<strong>PVD</strong>_CH04_Affected_Env_JUL_2011.doc
T.F. <strong>Green</strong> <strong>Airport</strong> <strong>Improvement</strong> <strong>Program</strong>Environmental Impact Statement and Final Section 4(f) EvaluationTable 4-29Summary of Project Area Wetland Functions and ValuesWetlandSystemWetlandArea(ac)GWR/D SWGWFFA –FPS/T/P R WQBaseline Condition Wetland Functions and Values (USACE,-RIDEM)NR/R/T WLH T&EWQ PE S&S S F&SH WWH SH REC ED/S VU/H -AESVQ/A AESA1 3.1 P XA2 7.6 P X X X PA3 1 12.9 P P X P X X XA4 4.4 P X X X XA5 14.5 X X X X P XA6 3.1 XA8 16.3 X P P X XA10 25.6 X P P X X P P X XA11 2.7 XA13 19.4 P P P XA14 13.5 X P PA16 0.6I 15.3 X P P XK 26.2 X X XP 17.1 P P P X1 Includes deepwater habitats in total.P Principal Wetland Function or Value.X Wetland Function or Value likely provided by wetland.GWR/D Groundwater Recharge/Discharge. SWGW – Surface Water and Groundwater.FFA Flood Flow Alteration. FP Flood Protection.S/T/P R Sediment/Toxicant/Pathogen Retention. WWH Wildlife and Wildlife Habitat.NR/R/T Nutrient Removal/Retention/Transformation. REC Recreation and Aesthetic.PE Production Export. AES Aesthetic.S&S S Sediment and Shoreline Stabilization. VQ/A Visual Quality/Aesthetics.F&S H Fish and Shellfish Habitat. U/H Uniqueness/Heritage.WLH Wildlife Habitat. ED/SV Educational/Scientific Value.T&E SH Threatened and Endangered Species Habitat. REC Recreation.Chapter 4 – Affected Environment 4-55 July 2011\\mawatr\ev\09228.00\reports\<strong>FEIS</strong>_Final_July_2011\<strong>PVD</strong>_CH04_Affected_Env_JUL_2011.doc
T.F. <strong>Green</strong> <strong>Airport</strong> <strong>Improvement</strong> <strong>Program</strong>Environmental Impact Statement and Final Section 4(f) Evaluation4.10 Water QualityThis section summarizes the methodology for identifying water resources and quality, and describes the waterresources and water quality within the T.F. <strong>Green</strong> <strong>Airport</strong> Project and Study Areas.4.10.1 MethodologyWater resources and water quality data were collected from existing data, maps, and reports, includinghistorical outfall monitoring data for the Study Area. This information was supplemented by water qualityregulations and standards for the State of Rhode Island as well as data provided by RIDEM.4.10.2 Affected EnvironmentThis section describes surface water and groundwater resources and water quality of the T.F. <strong>Green</strong> <strong>Airport</strong>property.4.10.2.1 Surface Water ResourcesMajor surface water resources in the vicinity of the <strong>Airport</strong> include water bodies such as Warwick Pond andTuscatucket Brook. Surface waters on the <strong>Airport</strong> property include Buckeye Brook and other unnamed streams.The <strong>Airport</strong> is located within the Narragansett Bay watershed. The Study Area is within four sub-drainagebasins of Narragansett Bay, as shown in Figure 4-24:• Upper Narragansett Bay;• <strong>Green</strong>wich Bay;• Providence River; and• Pawtuxet River.The Project Area also contains subwatersheds associated with Warwick Pond, Buckeye Brook, Spring <strong>Green</strong>Pond, and Tuscatucket Brook (Figure 4-25). Table 4-30 lists the surface waters affected by <strong>Airport</strong> dischargesand compares the amount of <strong>Airport</strong> runoff they receive to their total drainage areas.Table 4-30Contributing Areas to Surface Waters Receiving <strong>Airport</strong> Discharges (Baseline Condition)Total Drainage Area Non-<strong>Airport</strong> Drainage <strong>Airport</strong> Contribution <strong>Airport</strong> ContributionWater Body (acres) (acres) 1 (acres) (%)Warwick Pond 1,236 959 277 22%Buckeye Brook 2 2,003 1,417 586 29%Tuscatucket Brook 2 418 332 86 21%<strong>Green</strong>wich Bay 7,172 7,086 86 1.2%Narragansett Bay 1,001,344 1,000,672 672
T.F. <strong>Green</strong> <strong>Airport</strong> <strong>Improvement</strong> <strong>Program</strong>Environmental Impact Statement and Final Section 4(f) EvaluationTable 4-31 indicates the regulatory classifications for the surface waters affected by <strong>Airport</strong> discharge. Theclassifications for each water body include designated usage, impairment(s) due to water quality (as defined bySection 303(d) of the Clean Water Act), and “total maximum daily load” (TMDL) limits for certain parameters,as established by the EPA.Table 4-31Regulatory Classifications for Surface Waters Receiving <strong>Airport</strong> DischargesWater Body Classification 303(d) Impairments 2 TMDLStatusWarwick Pond B 1 Algal growth Delisted – Tracked as an Observed Effect 2Eutrophication (excess Delisted – Dissolved Oxygen, Total Phosphorus TMDL approved by EPAphosphorus, low DO)Buckeye Brook B 1 Biodiversity impacts TMDL not yet developedPathogensTMDL (December 2008) approved by EPA; may be delistedTuscatucket Brook A 3 Pathogens Delisted – TMDL approved by EPA<strong>Green</strong>wich Bay Mixed SA 4 &SB 5 /SB1 6 Nutrients, DO Need for TMDL will be reassessed after wastewater treatment upgrades and SAMPimplementation are completePathogensDelisted – TMDL approved by EPANarragansett Bay Mixed SA 4 &SB 5 /SB1 6Nutrients, DOPathogensNeed for TMDL will be reassessed after wastewater treatment upgrades are completeConsent agreement for CSO abatement may make TMDL unnecessarySource: 303(d) List (April 2008), Water Quality Regulations (2006).Note: Section 303(d) of the Clean Water Act requires that states establish water quality standards for their surface waters and identify impaired water bodies. Section303(d) of the CWA also establishes the Total Maximum Daily Load (TMDL) program. A TMDL is the allowable load of a single pollutant from all point andnon-point sources to a segment of a water body. Under the TMDL program, states establish priority rankings for their water bodies and identify the uses for thesewater bodies (e.g. drinking water supply, recreation, etc.).1 Designated for fish and wildlife habitat and primary and secondary contact recreational activities, and compatible for industrial processes and cooling,hydropower, aquacultural uses, navigation, and irrigation and other agricultural uses. These waters shall have good aesthetic value.2 Monitoring observations that represent responses to pollutants or other stressors causing impairment such as excess algal growth, chlorophyll a, taste and odor,color, sedimentation/ siltation, and noxious aquatic plants. These terms were used on the 2006 303(d) List as causes of impairment. In general, on the 2008303(d) List, these terms have been moved from causes of impairment to Observed Effects for a number of waterbodies.3 Designated for primary and secondary contact recreational activities and for fish and wildlife habitat, and are suitable for compatible industrial processes andcooling, hydropower, aquacultural uses, navigation, and irrigation and other agricultural uses. These waters shall have excellent aesthetic value.4 Designated for shellfish harvesting for direct human consumption, primary and secondary contact recreational activities, and fish and wildlife habitat. They aresuitable for aquacultural uses, navigation and industrial cooling. These waters shall have good aesthetic value.5 Designated for primary and secondary contact recreational activities; shellfish harvesting for controlled relay and depuration; and fish and wildlife habitat. Theyare suitable for aquacultural uses, navigation, and industrial cooling. These waters shall have good aesthetic value.6 Designated for primary and secondary contact recreational activities and fish and wildlife habitat. They are suitable for aquacultural uses, navigation, andindustrial cooling. These waters shall have good aesthetic value. Primary contact recreational activities may be impacted due to pathogens from approvedwastewater discharges. However all Class SB criteria must be met.TMDL Total Maximum Daily Load.DO Dissolved Oxygen.CSO Combined Sewer Overflow.4.10.2.2 Groundwater ResourcesFigure 4-26 shows groundwater resources in the Study Area. The thick, coarse-textured sediments of the Deltahold water in saturated underground layers. The Project Area is not located within a public water supplyreservoir, a groundwater recharge area, or a wellhead protection area. Most importantly, the <strong>Airport</strong> does notoverlie a sole-source aquifer. The Providence/Warwick Groundwater Aquifer is under the southwesternportion of the <strong>Airport</strong>, but this groundwater is not used as a public drinking water supply. Public water supplycomes from surface water reservoirs managed by the Providence Water Supply Board.Chapter 4 – Affected Environment 4-57 July 2011\\mawatr\ev\09228.00\reports\<strong>FEIS</strong>_Final_July_2011\<strong>PVD</strong>_CH04_Affected_Env_JUL_2011.doc
T.F. <strong>Green</strong> <strong>Airport</strong> <strong>Improvement</strong> <strong>Program</strong>Environmental Impact Statement and Final Section 4(f) EvaluationBaseflow from groundwater maintains water levels in Buckeye Brook, Warwick Pond, and Tuscatucket Brook.Groundwater discharge maintains numerous wetlands surrounding the <strong>Airport</strong>. Buckeye Brook, Spring <strong>Green</strong> PondBrook, Tuscatucket Brook, and many smaller unnamed streams originate from wetlands fed by groundwater discharge.4.10.2.3 Water QualitySurface water quality in the Project Area is affected by stormwater discharges from the <strong>Airport</strong> and otherdeveloped land. The stormwater system on the <strong>Airport</strong> collects runoff from approximately 672 acres of the 1,100acre property. In the remaining areas, stormwater may infiltrate through unpaved areas, flow into municipalstorm drains, or reach local receiving waters via overland flow. There are 13 drainage areas within the developedportion of the <strong>Airport</strong>, as shown in Figure 4-27 and listed in Table 4-32. The Project Area includes the <strong>Airport</strong> aswell as other land uses (roads, parking lots, industrial facilities, residential areas) that generate stormwater runoff.RIAC samples both the <strong>Airport</strong> outfalls and the local water bodies to determine the water quality impact of<strong>Airport</strong> runoff. Three outfalls discharge to Tuscatucket Brook, the only Class A water body in the Project Area(see Note 3 to Table 4-31). Outfall data from sampling events are provided in Table 4-33.Table 4-32Drainage Areas and Outfalls within T.F. <strong>Green</strong> <strong>Airport</strong>DrainageAreaSize(acres) Land Use Treatment Outfall 1 Receiving Water1 5.9 Fueling Activated carbon filter, oil/waterseparator001A,100A 1City storm drain to Buckeye Brook north ofWarwick Pond2 93.4 Operations, fueling, cargo,hangarsOil/water separator, Vortechs system 002A Open swale to Buckeye Brook north ofWarwick Pond3 119.8 Runway, taxiway, terminalgaragesNone 003A Open swale to Buckeye Brook north ofWarwick Pond4 30.1 Runway, taxiway None 004A Tributary to Warwick Pond4B 2.0 Airfield None 004B Buckeye Brook south of Warwick Pond4C 3.0 Airfield None 004C Buckeye Brook south of Warwick Pond5 3.1 Runway None 005A Buckeye Brook south of Warwick Pond6 7.6 Runway None 006A Buckeye Brook south of Warwick Pond6B 1.5 Airfield None 006B Buckeye Brook south of Warwick Pond6C 0.8 Taxiway None 006C Buckeye Brook south of Warwick Pond6D 0.7 Taxiway None 006D Buckeye Brook south of Warwick Pond7 9.6 Taxiway None 007 Buckeye Brook south of Warwick Pond7B 1.2 Taxiway None 007B Buckeye Brook south of Warwick Pond8 240.6 Parking, taxiways, runways,deicing, fueling, cargoGlycol interceptor, oil/water separators,Vortechs system, detention basin, mobilecollection units, odor control008ATributary to Buckeye Brook south ofWarwick Pond9 38.4 Runway, taxiway None 009A Buckeye Brook south of Warwick Pond10 26.0 Runway, taxiway, secondary None 010A Grass swale to Tuscatucket Brookdeicing11 14.0 Runway, taxiway None 011A 2 Grass swale to Tuscatucket Brook12 46.4 Parking, taxiway Oil/water separator, Vortechs 012A 2 Grass swale to Tuscatucket Brooksystem, detention basin13 28.0 Maintenance facility Vortechs system, detention basin 0013A Tributary to Warwick PondSource: Gresham, Smith, and Partners (2008).1 Runoff from the fueling secondary containment area is treated and discharged upstream of Outfall 001A through Outfall 100A; therefore, all runoff from this areapasses ultimately through Outfall 001A.2 Outfalls 011A and 012A are now combined behind a single headwall, forming a combined point discharge from their two distinct drainage areas.Chapter 4 – Affected Environment 4-58 July 2011\\mawatr\ev\09228.00\reports\<strong>FEIS</strong>_Final_July_2011\<strong>PVD</strong>_CH04_Affected_Env_JUL_2011.doc
T.F. <strong>Green</strong> <strong>Airport</strong> <strong>Improvement</strong> <strong>Program</strong>Environmental Impact Statement and Final Section 4(f) EvaluationTable 4-33 Water Quality at T.F. <strong>Green</strong> <strong>Airport</strong> Outfalls 1,2,3Outfall Date 1 (mg/L) BOD 2 (mg/L) (mg/L) (mg/L) glycol (mg/L) VOCs (µg/L) (mg/L)TSS 2COD 2 Oil & Grease PropyleneIron1/22/2004 28 No data 330 0.8 180
T.F. <strong>Green</strong> <strong>Airport</strong> <strong>Improvement</strong> <strong>Program</strong>Environmental Impact Statement and Final Section 4(f) EvaluationAdditional water quality data was collected during the preparation of this <strong>FEIS</strong> (from 2004 to 2007) includingroutine sampling of <strong>Airport</strong> discharges and local water bodies, and sampling conducted specifically for the <strong>FEIS</strong>to confirm the Baseline Condition data presented above. Sampling was conducted during and after winterstorm events and outside the deicing season. Analytical results indicated that although glycol levels weresomewhat elevated during the deicing season, no glycol was detected in <strong>Airport</strong> discharges or local surfacewaters outside the deicing season. Results from Outfalls 002A, 003A, 008A and 011A/012A indicated that fecalcoliform counts were all extremely low during both wet and dry weather; however, fecal coliform counts forBuckeye Brook and Warwick Pond were elevated in 2005 during both dry and wet weather, ranging between 42and 780 most-probable-number (MPN).4.11 Fish, Wildlife, and PlantsThis section summarizes the methodology for identifying the fish, wildlife, and plants within the Study Areaand describes these biotic communities within the Project Area.4.11.1 MethodologyInvestigations regarding the presence of state or federally listed threatened or endangered species wereconducted through coordination with the Rhode Island Natural Heritage <strong>Program</strong> (RINHP), RIDEM Division ofFish and Wildlife (DFW), and the U.S. Fish and Wildlife Service (USFWS); inspections of the Project and StudyAreas; review of previously collected or reported data; and literature reviews. Letters requesting writtencorrespondence from these agencies were submitted initially in September 2001, and were resubmitted on July25, 2005. Data collected by RIDEM DFW staff from surveys conducted during the summer of 2005 wereobtained through electronic correspondence.Descriptions of the Baseline Condition biotic communities were developed from published literature, previousstudies, and field surveys conducted within the Project Area and Study Area. 218 Vegetation cover types wereidentified and mapped on aerial photographs in the Project Area. RIDEM DFW data from electroshock surveysfor some of the water bodies in the Study Area were also used. Habitat suitability assessments are based on fieldobservation and published information. 219 Preliminary biodiversity data from studies of Buckeye Brook and its220, 221tributaries were obtained from the RIDEM Office of Water Resources.Study Area vegetation cover types were evaluated using RIGIS 222 data augmented by aerial photographinterpretation and limited field investigations. Biotic communities associated with each RIGIS land use andcover type were described for each of the land use categories. Potential wildlife use was also described for eachof the land use categories. Wildlife evaluations were conducted by reviewing information on potentialthreatened and endangered species habitat received through coordination with the USFWS, RIDEM DFW,RINHP, and other sources.218 Buckeye Brook Habitat <strong>Improvement</strong>/Restoration <strong>Program</strong>, Natural Resource Services, Inc. December 3, 2004.219 New England Wildlife: Habitat, Natural History, and Distribution. Degraff, Richard M. and Rudis, Deborah. Gen. Tech. Rep. NE-108. Broomall, PA: USDA,Forest Service, Northeast Forest Experiment Station; 1986.220 ESS Group 2009; Buckeye Brook Biodiversity Impairment Data Report, 2008. 27 pp + tables, photos, and figures.221 EPA October 15, 2008. Toxicity Test Results; Buckeye Brook Study Summer 2008.222 Rhode Island Geographic Information System, www.edc.uri.edu/rigis.Chapter 4 – Affected Environment 4-60 July 2011\\mawatr\ev\09228.00\reports\<strong>FEIS</strong>_Final_July_2011\<strong>PVD</strong>_CH04_Affected_Env_JUL_2011.doc
T.F. <strong>Green</strong> <strong>Airport</strong> <strong>Improvement</strong> <strong>Program</strong>Environmental Impact Statement and Final Section 4(f) Evaluation4.11.2 Affected EnvironmentThe Project Area and Study Area are in an urbanized section of Warwick characterized by industrial, mixedcommercial and dense residential development. Biotic communities within the <strong>Airport</strong> are managed inaccordance with FAA requirements to minimize the risk of aviation collision with wildlife and maintainunobstructed airspace surfaces. The following sections summarize the biotic communities and existingmanagement plans for the T.F. <strong>Green</strong> <strong>Airport</strong>.4.11.2.1 Biotic ResourcesThis section provides information on state-listed species in the Study Area and describes the biotic communitiesfor the Study Area and Project Area. There are no federally listed species in the Study Area, as discussed inSection 4.12, Federal Threatened and Endangered Species. Figures 4-28 and 4-29 show the natural communities ofthe Study Area and Project Area, respectively.For this <strong>FEIS</strong>, biodiversity is described primarily in terms of important fish, wildlife, and plant communities thatare known to occur in the Project Area and Study Area. Rare species are subject to regulatory protection,whereas overall biodiversity is not. Rare species may have greater sensitivity to human practices, and they areoften more habitat-specific than common species and, therefore, more likely to be affected by disturbance.The RINHP publishes lists of native species of plants and animals that are rare within the state. 223 The RINHPdefines endangered as a native species in imminent danger of extirpation from Rhode Island. Populations ofthese species have already been reduced to a critically low number or have experienced drastic habitat loss ordegradation. Immediate management action is required to prevent extinction in the state. A threatened speciesis a native species that is likely to become state-endangered in the future if current trends in habitat loss or otherdetrimental factors remain unchanged. In general, these organisms have three to five known or estimatedpopulations and are especially vulnerable to habitat loss. A state species of concern is a native species (orsubspecies) not considered to be state-endangered or threatened at the present time, but is listed due to variousfactors of rarity and/or vulnerability. The RINHP maintains and publishes lists of species considered to beendangered, threatened, or of concern in the state.State-listed Endangered and Threatened Biotic ResourcesTwo state species of concern may be present within the Study Area: the freshwater Eastern lampmussel(Lampsilis radiata) and wild rice (Zizania aquatica). Warwick Pond historically supported a large population offreshwater mussels, but recent surveys of Warwick Pond did not locate any unique mussel species, suggestingthat these populations may have collapsed. 224 Wild rice occurs in the tidal freshwater reach of Buckeye Brookbetween Route 117 and Mill Cove (approximately one mile downstream of the Study Area limits).223 Rhode Island Department of Environmental Management Natural Heritage <strong>Program</strong> (www.dem.ri.gov/programs/bpoladm/plandev/heritage/ ).224 Rhode Island Department of Environmental Management Natural Heritage <strong>Program</strong> , correspondence, August 11, 2005.Chapter 4 – Affected Environment 4-61 July 2011\\mawatr\ev\09228.00\reports\<strong>FEIS</strong>_Final_July_2011\<strong>PVD</strong>_CH04_Affected_Env_JUL_2011.doc
T.F. <strong>Green</strong> <strong>Airport</strong> <strong>Improvement</strong> <strong>Program</strong>Environmental Impact Statement and Final Section 4(f) EvaluationThe American eel (Anguilla rostrata), formerly a candidate for federal listing, is found within the Project Area.RIDEM DFW fisheries data provide records for American eel in several waterways and water bodies associatedwith the Project Area: Buckeye Brook, Tuscatucket Brook, Spring <strong>Green</strong> Pond, and Spring <strong>Green</strong> Pond Brook;and Study Area: Warwick Pond, Gorton Pond, and Little Pond. 225 American eel is a catadromous fish species withmultiple life stages that migrate from freshwater to the ocean to spawn. The American eel requires various habitatsover their lifespan, including open oceans, large coastal tributaries, small freshwater streams, lakes, and ponds. 226If present, the American eel is likely to use the Buckeye Brook watershed for the upstream and downstreammovement into and out of Warwick and Spring <strong>Green</strong> Ponds, to the estuarine freshwater-saltwater interface, andNarragansett Bay.One insect species listed by the state as threatened, the pine barrens tiger beetle (Cicindela formosa), is known tooccur within the Project Area. 227 Though small and isolated by encroaching urban development, suitable habitatfor the pine barrens tiger beetle is present. A deeply sculpted outwash terrace juts northwestward into thefloodplain swamp associated with Buckeye Brook in the southeastern corner of the <strong>Airport</strong> property. Thispeninsula supports a remnant pine barren community dominated by pitch pine (Pinus rigida) and scrub oak(Quercus ilicifolia). This cover type was once more common in the Study Area. A small population of this specieswas observed on June 13, 2006 and again on August 17, 2006 by wildlife biologists from the RIDEM DFW. Thepopulation was very small, consisting of three or four individuals. 228 It is not known if the existing population islarge enough to remain viable. In the event of a local extinction, the absence of suitable habitat supportingpopulations of this species would preclude potential recolonization.The airfield provides potentially suitable habitat for a number of regionally rare grassland bird species, includingthe upland sandpiper (Bartramia longicauda), horned lark (Eremophila alpestris), and grasshopper sparrow(Ammodramus savannarum). These bird species are rare at the state level but have no special federal status beyondthe normal protection afforded all migratory birds. 229 As a group, grassland bird species require large expanses ofshort grass (up to two feet in height) habitat. 230 Grassland bird species were surveyed for this <strong>FEIS</strong> and through a2004-2005 study. 231 No state-listed grassland bird species were observed within the Project Area.The sickle-leaved golden aster (Pityopsis falcata), a state species of concern, was identified during an inspectionof the pine barren community in the southeastern corner of the <strong>Airport</strong> (Figure 4-29). In September 2006, a smallpopulation, approximately 12 plants, was observed in this area. A single flowering individual plant was notedduring the inspection. This species was found growing in loose sands near the <strong>Airport</strong> perimeter fence.225 A Preliminary Summary of Fish Surveys That Were Conducted in Rhode Island’s Streams and Ponds Between 1993 and 2002. Rhode Island Departmentof Environmental Management, Division of Fish and Wildlife. Alan D. Libby, May 2004.226 Federal Register, Vol. 70, No. 128, July 6, 2005.227 Personal communication with Christopher Raithel, DFW, September 21, 2006.228 Ibid.229 Rhode Island Department of Environmental Management Division of Fish and Wildlife correspondence, September 25, 2001.230 Grasslands of Northeastern North America: Ecology and Conservation of Native and Agricultural Landscapes, Vickery, Peter D. and Dunwiddie Peter W.Massachusetts Audubon Society, Lincoln, MA. 1997.231 Buckeye Brook Habitat <strong>Improvement</strong>/ Restoration <strong>Program</strong> T.F. <strong>Green</strong> <strong>Airport</strong>, Natural Resource Services, Inc. December 3, 2004 and Habitat Suitabilityof Buckeye Brook for River Herring at T. F. <strong>Green</strong> <strong>Airport</strong>, Natural Resource Services, Inc. Warwick, Rhode Island. February 9, 2006.Chapter 4 – Affected Environment 4-62 July 2011\\mawatr\ev\09228.00\reports\<strong>FEIS</strong>_Final_July_2011\<strong>PVD</strong>_CH04_Affected_Env_JUL_2011.doc
T.F. <strong>Green</strong> <strong>Airport</strong> <strong>Improvement</strong> <strong>Program</strong>Environmental Impact Statement and Final Section 4(f) EvaluationStudy Area Biotic CommunitiesThe major biotic communities within the Study Area (Figure 4-28) can be broadly classified based on thevegetation structure as Grasslands, Shrub, Forest, and Disturbed Areas. Each of these communities is commonwithin the region. Important factors that affect the species composition of the plant associations found in thesecommunities include the physical environment (e.g., wetland or upland) and history of disturbance. Table 4-34lists the Study Area biotic communities by cover type, typical wildlife using each community, and theapproximate acreage encompassed by each.Table 4-34Summary of Study Area Cover TypesCover Type Wildlife Utilizing Cover Type Approximate Area (acres)Forested Upland Small mammal, songbird nesting habitat 222Shrubland (Upland) Songbird foraging and nesting habitat 194Grassland Small mammal, songbird foraging habitat 63Agricultural Land Mammal and songbird foraging habitat 65Forested Wetland Small mammals, songbird nesting/foraging habitat 174Scrub Shrub Wetland Songbird nesting/foraging habitat 48Emergent Wetland Songbird, waterfowl, muskrat 18Emergent Wetland (Phragmites dominated) Poor quality habitat 25Open Water Fish, shellfish, waterfowl 311Tidal Habitats Waterfowl, wading birds, fish and shellfish 23Total Habitat Area 1,143Project Area Biotic CommunitiesThe Project Area includes T.F. <strong>Green</strong> <strong>Airport</strong> and some adjacent areas north and south of the <strong>Airport</strong>(Figure 4-29). This area includes some forested habitats, shrub habitats, and grasslands. No tidal habitats occurwithin the Project Area. Table 4-35 lists the Project Area biotic communities by cover type, typical wildlife usingeach community, and the approximate acreage encompassed by each.The <strong>Airport</strong> provides limited habitat for wildlife species because most wildlife (birds and large mammals) areincompatible with safe operations of an airport. The <strong>Airport</strong> is a large facility with high levels of activity nearthe terminal, aircraft hangars, and runways. Natural habitats are associated with the land between the runwaysand the runway protection zones. Farther from the runways, closely mown grasslands transition to taller, lessintensely maintained grassland, then shrub land and low tree, and finally forested zones in the northern,southern, and eastern sides of the <strong>Airport</strong> property. The management of these areas is governed by the <strong>Airport</strong>’sVegetation Management <strong>Program</strong> 232 and the Wildlife Hazard Management <strong>Program</strong> 233 described inSection 4.11.2.2, Existing Wildlife and Vegetation Management Plans.232 Vegetation Management <strong>Program</strong>, Warwick, Rhode Island, Rhode Island <strong>Airport</strong> Corporation, revised August 2004.233 Wildlife Hazard Management Plan. Rhode Island <strong>Airport</strong> Corporation, revised February 4, 2005.Chapter 4 – Affected Environment 4-63 July 2011\\mawatr\ev\09228.00\reports\<strong>FEIS</strong>_Final_July_2011\<strong>PVD</strong>_CH04_Affected_Env_JUL_2011.doc
T.F. <strong>Green</strong> <strong>Airport</strong> <strong>Improvement</strong> <strong>Program</strong>Environmental Impact Statement and Final Section 4(f) EvaluationTable 4-35 Summary of Project Area Cover Types (2004)Approximate AreaCover Type Wildlife Utilizing Cover Type (acres)Forested Upland Small mammal, songbird nesting habitat 70Shrubland (Upland) Songbird foraging and nesting habitat 55.4Grassland and Agricultural Land Small mammal, songbird foraging habitat 121.1Forested Wetland Small mammals, songbird nesting/foraging habitat 42.6Scrub Shrub Wetland Songbird nesting/foraging habitat 38.4Emergent Wetland Songbird, waterfowl, muskrat 8.8Emergent Wetland Phragmites dominated Red-winged blackbird (poor quality habitat) 16.4Open Water (streams/ponds) Fish, migratory fish run, shellfish, waterfowl 9.2Tidal Habitats Waterfowl, wading birds, fish and shellfish 0Total Habitat Area 361.9In the Project Area, upland shrub cover approximately 55.4 acres and wetland scrub-shrub coversapproximately 38.4 acres. Upland shrub is also present in the landfill in the southern part of the Project Area,and is created and maintained in other parts of the <strong>Airport</strong> as part of the Vegetation Management <strong>Program</strong>.All of grassland habitats that occur within the Project Area are also located in the Study Area. Grasslands covermost of the <strong>Airport</strong> and are dominated by warm season grasses including little bluestem (Schizachyrium scoparium),poverty grass (Danthonia spicata), purple lovegrass (Eragrostis spectabilis), Pennsylvania sedge (Carex pensylvanica),panic grass (Panicum sp.), and sheep fescue (Festuca ovina). Common forbs include bracted plantain(Plantago aristata), jointweed (Polygonella articulata), rabbit-foot clover (Trifolium arvense), and partridge-pea(Chamaecrista nictitans). Grasslands closest to the runways are mown frequently and have little value as wildlifehabitat (470 acres).Emergent wetland communities, including mown grassland, cattail stands, and common reed stands, occupyapproximately 25.2 acres of the Project Area. Wetlands dominated by the invasive common reed make up16.4 acres of this total and are especially prevalent in some reaches of Buckeye Brook south of Warwick Pondand south of Runway 16-34. The wetlands, waterways, and water bodies in the Buckeye Brook system east ofthe <strong>Airport</strong> provide important wetland wildlife and fishery habitat. Portions of Buckeye Brook and Spring<strong>Green</strong> Brook support an anadromous (migratory) run of river herring from the coast into Warwick and Spring<strong>Green</strong> Ponds. Shrub wetlands located in the Project Area mostly result from vegetation management wherewoody vegetation is periodically cut to maintain clear airspace.Approximately 42.6 acres of forested wetlands are present in the Study Area. This includes a small(approximately 1.4 acre) stand of Atlantic white cedar (Chamaecyparis thyoides) and 41.1 acres of broad-leaveddeciduous trees.Chapter 4 – Affected Environment 4-64 July 2011\\mawatr\ev\09228.00\reports\<strong>FEIS</strong>_Final_July_2011\<strong>PVD</strong>_CH04_Affected_Env_JUL_2011.doc
T.F. <strong>Green</strong> <strong>Airport</strong> <strong>Improvement</strong> <strong>Program</strong>Environmental Impact Statement and Final Section 4(f) EvaluationThe largest deepwater habitat in the Project Area is Spring <strong>Green</strong> Pond (8.9 acres) north of <strong>Airport</strong> Road and westof Warwick Avenue. The RIDEM DFW notes that this pond supports a small number of waterfowl includingmallard (Anas platyrhynchos), American black duck (A. rubripes), Canada goose (Branta canadensis), and mute swan(Cygnus olor) during ice-free periods. 234Buckeye Brook is notable for the unaided river herring 235 spawning run that occurs in the spring into WarwickPond further upstream into Spring <strong>Green</strong> Pond. Spring <strong>Green</strong> Pond is an artificial impoundment that is shownon maps dating back more than 120 years. 236Buckeye Brook was placed on the Rhode Island 303(d) list of impaired waters for biodiversity impairmentsbased on preliminary data collected during the Statewide Wadeable Streams Biomonitoring and HabitatAssessment. 237 The RIDEM has begun studies to better characterize the impairment and develop TMDLrestrictions on pollutants that may be discharged into the Buckeye Brook and its tributaries. The habitatassessment for streams in the watershed identified the poorest scoring segments to be Warner Brook, which isnot sourced on the <strong>Airport</strong>, along with Tributaries A11 and A14 within the Project Area. The highest scoringstream segment of Buckeye Brook was located just downstream of the Study Area near Old Warwick Avenue.This segment actually scored higher than the unimpaired stream used as a reference, indicating impairments inthe upper watershed appear to be attenuated in downstream segments.Assessments of macro-invertebrate diversity found four sampling stations along the brook and its tributaries tobe moderately impaired and three sampling stations (Tributary A in Wetland A13, Buckeye Brook near RufusRoad, and Warner Brook) to be severely impaired. The EPA conducted chronic toxicity tests on fatheadminnow (Pimephales promelas) and a common freshwater invertebrate (Ceriodaphnia dubia) using water samplescollected from the similar points in the watershed. These tests measure the survivorship and growth of thesespecies in water samples collected from the sampled stream segments to identify statistically significantvariations. These tests found no statistically significant effects on survivorship for either species among thesamples taken in the watershed, including samples from Tributaries A11 and A14. These tests did showapparent significant reductions in reproduction rates of Ceriodaphnia for water samples collected fromTributaries A11 and A14.The following important components of local or regional biodiversity have been identified in the Project Area:• Aquatic habitats in Buckeye Brook, Spring <strong>Green</strong> Brook, and Spring <strong>Green</strong> Pond. Buckeye Brook and Spring<strong>Green</strong> Brook are used by river herring during spawning runs to Warwick Pond and Spring <strong>Green</strong> Pond, andby American eel for habitat and spawning runs to the coast. River herring and American eel are identified234 Rhode Island Department of Environmental Management Department of Fish and Wildlife correspondence, August 17, 2001.235 River Herring is a collective term used to describe both anadromous alewives (Alosa pseudoharengus) and blueback herring (Alosa aestivalis). Locallythese fish are known as buckeyes, hence the name Buckeye Brook. The migration is unaided as no artificial fish ladders or other devices are necessaryfor the fish to complete their passage to spawning sites in Warwick Pond and Spring <strong>Green</strong> Pond.236 This earthen dam now is now concealed as the roadway fill section of Warwick Avenue where it crosses east of the pond. Along with the dam to create thepond, an outlet channel was excavated which drains west to a small stream in the headwaters Buckeye Brook north of <strong>Airport</strong> Road. The existingconfiguration of pond and outlet stream appears on the U.S. Geological Survey, June 1892 Edition of the Rhode Island Narragansett Bay TopographicMap Sheet, fieldwork completed in1888.237 ESS Group. 2009; Buckeye Brook Biodiversity Impairment Data Report, 2008. 27 pp + tables, photos, and figures. and USEPA October 15, 2008; ToxicityTest Results; Buckeye Brook Study Summer 2008.Chapter 4 – Affected Environment 4-65 July 2011\\mawatr\ev\09228.00\reports\<strong>FEIS</strong>_Final_July_2011\<strong>PVD</strong>_CH04_Affected_Env_JUL_2011.doc
T.F. <strong>Green</strong> <strong>Airport</strong> <strong>Improvement</strong> <strong>Program</strong>Environmental Impact Statement and Final Section 4(f) Evaluationby the Rhode Island’s Comprehensive Wildlife Conservation Strategy as species of greatest conservationneed.• River herring spawning and fingerling foraging habitat present in Spring <strong>Green</strong> Pond is also used byAmerican eel as foraging habitat.• Grassland bird habitat is present south of Runway 34 on <strong>Airport</strong> property. Two grassland bird species ofgreatest conservation need, 238 the bobolink (Dolichonyx oryzivorus) and eastern meadowlark(Sturnella magna), have been observed in this habitat.• Waterfowl and wading bird habitat is present south of Runway 34 in Wetlands A10, A13, and A14.Two greatest conservation need species, American black duck and black-crowned night-heron (Nycticoraxnycticorax), have been observed in these habitats.• Black-crowned night-heron has been observed utilizing the riparian forested wetland (Wetland A5) alongBuckeye Brook. This habitat may also be important for mammals foraging along the stream.• A small one-acre pine barren area south of Runway 34 and east of Buckeye Brook provides habitat for astate-listed plant (sickle-leaved golden aster) and animal (pine barrens tiger beetle).• A small (1.4 acres) remnant Atlantic white cedar wetland south of Runway 34, east of Buckeye Brook is alocally uncommon plant community.4.11.2.2 Existing Wildlife and Vegetation Management PlansCollisions between wildlife and aircraft are a safety hazard and cause substantial losses to the aviation industry.Globally, wildlife strikes have killed more than 219 people and destroyed over 200 aircraft since 1988. 239According to the FAA, the civil and military aviation communities widely recognize that the threat to humanhealth and safety from wildlife strikes is increasing. 240 In an effort to minimize this risk, a Wildlife HazardManagement Plan 241 has been prepared and implemented by RIAC to discourage wildlife from utilizing habitatswithin the <strong>Airport</strong> property.The Wildlife Hazard Management Plan establishes wildlife control measures for T.F. <strong>Green</strong> <strong>Airport</strong> in order toimmediately alleviate, to the extent possible, hazards to air carrier aircraft created by wildlife. Wildlife hazardsto aircrafts consist of birds, occasional deer, coyotes, and other mammals. Physical inspection of the <strong>Airport</strong> isconducted daily as part of the 14 CFR Part 139, Self Inspection <strong>Program</strong>, during weather or precipitationactivity, and upon request, to assess wildlife activity on the <strong>Airport</strong>.In addition to managing wildlife collisions hazards, the airspace around the <strong>Airport</strong> must remain clear of fixedobstructions. The FAA regulates mandated airspace surfaces in the vicinity of the <strong>Airport</strong> to maintain aviationsafety. Left unmanaged, plant communities in the immediate vicinity of the <strong>Airport</strong> could grow into this238 Greatest conservation need species have been identified by the State of Rhode Island Division of Fish and Wildlife to prevent species of greatest conservationneed and habitats from becoming endangered (RIDEM, www.dem.ri.gov/programs/bnatres/fishwild/swgindex.htm, accessed May 12, 2011.239 Wildlife Strikes to Civilian Aircraft in the United States, 1990-2007, Federal Aviation Administration, National Wildlife Strike Database, Serial ReportNumber 14, June 2008, p. vii.240 Ibid.241 Wildlife Hazard Management Plan. Rhode Island <strong>Airport</strong> Corporation, revised April 27, 2009.Chapter 4 – Affected Environment 4-66 July 2011\\mawatr\ev\09228.00\reports\<strong>FEIS</strong>_Final_July_2011\<strong>PVD</strong>_CH04_Affected_Env_JUL_2011.doc
T.F. <strong>Green</strong> <strong>Airport</strong> <strong>Improvement</strong> <strong>Program</strong>Environmental Impact Statement and Final Section 4(f) Evaluationairspace surface. The Vegetation Management <strong>Program</strong> (VMP) defines long-term, sustainable vegetativemanagement and maintenance practices that allow RIAC to prevent future vegetative penetrations ofFAA-mandated airspace surfaces, while being protective of the environment. Most of the grassland, shrub, andlow tree habitats around the <strong>Airport</strong> are the product of the VMP.4.12 Federal Threatened and Endangered SpeciesThis section summarizes the methodology for determining the presence of federally listed threatened andendangered species, and describes these species within the Project Area.4.12.1 MethodologyInvestigations regarding the presence of state or federally listed threatened or endangered species wereconducted through coordination with the appropriate regulatory agencies, including RINHP, RIDEM DFW, andthe USFWS; inspections of the Project and Study Areas; review of previously collected or reported data; andliterature reviews. Letters requesting written correspondence from these agencies were submitted onJuly 25, 2005. Data collected by RIDEM DFW staff from surveys conducted during the summer of 2005 wereobtained through electronic correspondence.4.12.2 Affected EnvironmentNo species listed as federally endangered or threatened under the Endangered Species Act were observed or areknown to occur in the Study Area or Project Area. The American eel (Anguilla rostrata) found within the ProjectArea was formerly a candidate for federal listing.4.13 FloodplainsThis section summarizes the methodology for identifying floodplains and describes the floodplains within theProject Area. Since the DEIS was prepared, the Federal Emergency Management Agency (FEMA) has revisedthe Flood Insurance Rate Maps (FIRM), which establish the base flood elevation of the 1% Annual Chance Flood(formerly known as the 100-year floodplain). RIDEM also regulates floodplains under the Rhode IslandFreshwater Wetland Act. 242 The methodology for identifying RIDEM-regulated wetlands can vary from that usedby the FEMA and a separate study was prepared to identify floodplain limits subject to State regulation.4.13.1 MethodologyThe areas subject to flooding and protected under Executive Order 11988 and USDOT Order 5650.2 wereobtained using the base flood elevation published on the latest FIRM maps. Since the topographic mappingused to design the <strong>Airport</strong> improvements is considered more accurate than the base maps used by the FEMA toprepare the FIRMs, the floodplain limits were determined by tracing the base flood elevation 14-foot NorthAmerican Vertical Datum of 1988 (NAVD 88) contour on the <strong>FEIS</strong> plans. The flood elevation calculated at the<strong>Airport</strong> is based on a wave runup analysis along coastal portions of Warwick. The flood elevation of 14 feet242 R.I.G.L.,sections 2-1-18 through 2-1-27.Chapter 4 – Affected Environment 4-67 July 2011\\mawatr\ev\09228.00\reports\<strong>FEIS</strong>_Final_July_2011\<strong>PVD</strong>_CH04_Affected_Env_JUL_2011.doc
T.F. <strong>Green</strong> <strong>Airport</strong> <strong>Improvement</strong> <strong>Program</strong>Environmental Impact Statement and Final Section 4(f) Evaluationabove NAVD 88 was determined by calculating the stillwater elevation at Connecticut Point where the MillRiver discharges to Narragansett Bay. This elevation was then projected up Buckeye Brook to a point where thestream elevation is above 14 feet NAVD 88.The RIDEM Rules and Regulations Governing the Administration and Enforcement of the Freshwater Wetlands Actincludes a definition of floodplain, 243 which in some circumstances extends state jurisdiction beyond the limits ofthe FEMA 1% Annual Chance Flood boundary (base flood boundary). The limits of state-regulated floodplainsassociated with Buckeye Brook and its tributaries were estimated and mapped based on accepted engineeringmethodology for floodplain elevation estimation according to FEMA.Since the FEMA base flood elevation was determined by projecting the stillwater elevation from a coastal waverunup analysis up Buckeye Brook, there were previously no detailed cross-sections or modeling of BuckeyeBrook to identify its flooding characteristics in response to rainfall events. For the purposes of this <strong>FEIS</strong>, in orderto more accurately evaluate state-regulated floodplain impacts to downstream properties, a more detailedanalysis was completed. The supplemental floodplain analysis completed for the <strong>Improvement</strong> <strong>Program</strong>involved the development of a site-specific floodplain model for the Buckeye Brook Watershed upstream ofWarwick Avenue. As described in Appendix L, Floodplains, the model was developed using data from the recentsurvey of wetlands and topography, one-foot contour information provided by the RIAC, local rainfall records,and available pertinent reports and field studies. This information was used to determine the appropriate inputparameters for the development of a Hydrologic Engineering Center – River Analysis System (HEC-RAS) modelthat was used to calculate the estimated floodplain elevation for a 100-year storm recurrence with a rainfallvolume of 8.7 inches over a 24-hour period. Details of the HEC-RAS modeling are included in Appendix L,Floodplains. The HEC-RAS model was used to determine if impacts to downstream properties would occur as aresult of <strong>Improvement</strong> <strong>Program</strong>. See Chapter 5, Environmental Consequences, Section 5.14, Floodplains.4.13.1.1 Floodplain Study AreaThe floodplain Study Area includes that area which the FEMA’s Flood Insurance Study Kent County (AllJurisdictions) (effective December 3, 2010) and FIRM Numbers 44003C0131G and 44003C0133G (both witheffective dates of December 3, 2010) show flooding physically contiguous to Buckeye Brook. The floodplainStudy Area is shown on Figure 4-30, 1% Annual Chance Floodplain. The 1% Annual Chance Flood is equivalentto a flood which inundates an area with a one percent likelihood of occurrence in any given year. The floodplainarea includes:• Buckeye Brook south of <strong>Airport</strong> Road through Warwick Pond, extending south and downstream to OldMill Creek;• Wetland A8 west of Warwick Pond extending across a portion of Runway 34; and• Wetlands A13 and A14 south of Runway 34.243 As defined in section 2-1-20(3) of the Act, that land area adjacent to a river or stream or other flowing body of water that is, on average, likely to becovered with flood waters resulting from a one hundred (100) year frequency storm. A storm of this nature is one that is to be expected to be equaled orexceeded once in one hundred (100) years, and hence may be said to have a one percent (1%) probability of being equaled or exceeded in any givenyear. Rainfall intensity data for such a storm are those established for New England locations by the National Weather Service (formerly the U.S. WeatherBureau).Chapter 4 – Affected Environment 4-68 July 2011\\mawatr\ev\09228.00\reports\<strong>FEIS</strong>_Final_July_2011\<strong>PVD</strong>_CH04_Affected_Env_JUL_2011.doc
T.F. <strong>Green</strong> <strong>Airport</strong> <strong>Improvement</strong> <strong>Program</strong>Environmental Impact Statement and Final Section 4(f) EvaluationAs described above, the base flood boundary mapped by FEMA in the Study Area is subject to coastal flooding.Buckeye Brook is also subject to flooding in response to larger rainfall events. This conclusion is supported byobservations, provided by <strong>Airport</strong> staff and nearby residents, of flooding in Buckeye Brook at numerouslocations during high rainfall events. The detailed model developed to evaluate flooding caused by stream flowgenerated by runoff in the Buckeye Brook Watershed, as described in Appendix L, Floodplains, identifies a baseflood boundary predominantly governed by upstream runoff contributions, not by tailwater conditions aspresumed in the FEMA mapping.4.13.2 Affected EnvironmentThe Project Area is covered by four FIRMS published by FEMA for Kent County, Rhode Island:• 44003C0133G, revised December 3, 2010• 44003C0131G, revised December 3, 2010• 44003C0129G, revised December 3, 2010• 44003C0127G, revised December 3, 2010According to the FIRMs, the Project Area contains Zone AE: Special Flood Hazard Areas subject to Inundation by the1% Annual Chance Flood, and Zone X: Other Flood Areas. 244The eastern portion of the Project Area within the eastern and south eastern portions of the T.F. <strong>Green</strong> <strong>Airport</strong>boundary contains areas designated as Zone AE and Zone X associated with Warwick Pond and Buckeye Brook(Figure 4-30). The Zone AE Special Flood Hazard Area includes the Buckeye Brook culverts under LakeshoreDrive at the north end of Warwick Pond. These culverts and roadway are subject to frequent flooding, typicallyat least once per year. The supplemental floodplain analysis conducted for this <strong>FEIS</strong> found Lakeshore Drive tobe an area of significant flooding, beyond that depicted in the FIRM, due to inadequate capacity of the culvert toconvey flows at this location.The natural and beneficial values of these floodplains include moderation of flood waters; protection of waterquality of Warwick Pond and Buckeye Brook; wildlife habitat; and groundwater recharge. The floodplain areaswithin the <strong>Airport</strong> boundary do not provide natural and beneficial values for scientific study, outdoorrecreation, agriculture, aquaculture, or forestry because they are within the fenced and managed limits of the<strong>Airport</strong> and are not accessible to the public.244 Areas of 0.2 percent annual chance flood; areas of 1percent annual chance flood with average depths of less than 1 foot or with drainage areas less than1 square mile; and areas protected by levees from the 1percent annual chance flood.Chapter 4 – Affected Environment 4-69 July 2011\\mawatr\ev\09228.00\reports\<strong>FEIS</strong>_Final_July_2011\<strong>PVD</strong>_CH04_Affected_Env_JUL_2011.doc
T.F. <strong>Green</strong> <strong>Airport</strong> <strong>Improvement</strong> <strong>Program</strong>Environmental Impact Statement and Final Section 4(f) Evaluation4.14 Coastal ResourcesThis section describes coastal resources within the T.F. <strong>Green</strong> <strong>Airport</strong> Project Area.4.14.1 MethodologyCoastal areas have been evaluated through the analyses performed under other resource categories discussedpreviously (Section 4.9, Wetlands and Waterways, Section 4.10, Water Quality, Section 4.11 Fish, Wildlife and Plants,Section 4.12, Federal Threatened and Endangered Species, and Section 4.13, Floodplains).4.14.1.1 Coastal Resources Study AreaCoastal Zone Management Act (CZMA) jurisdiction extends beyond the Study Area. Figure 4-31 depicts theProject and Study Areas, federally designated Coastal Barrier Resource System (CBRS) resources, and the RhodeIsland Coastal Resources Management Council (RICRMC) Special Area Management Plans (SAMPs)boundaries.4.14.2 Affected EnvironmentThis section describes coastal barriers and zones within the Project Area.4.14.2.1 Coastal BarriersUnder the Coastal Barriers Resource Act (CBRA), the USFWS was tasked with the preparation of maps depictingareas designated for protection. The John H. Chafee CBRS includes all areas designated for protection under theCBRA. The Project Area does not contain any coastal barriers mapped in the John H. Chafee CBRS.Five coastal areas included in the John H. Chafee CBRS and designated for protection under the CBRA occuroutside of the Project Area (Figure 4-31). Bakers Creek, Brush Neck/Buttonwoods Cove, Mill Cove,Occupasstuxet Cove and Passeonkquis Cove are designated CBRS areas. 245 Two of these, Buttonwoods Coveand Mill Cove, are down gradient of the <strong>Airport</strong>.4.14.2.2 Rhode Island Coastal ZoneRhode Island’s Coastal Zone includes the entire state; however, the inland extent of the regulatory authority ofthe RICRMC is 200 feet inland from any coastal feature. 246 RICRMC defines the Coastal Zone as “the areaencompassed within the state’s seaward jurisdiction (three miles) to the inland boundaries of the state’s21 coastal communities.” Within these communities, RICRMC exercises its federal consistency requirement overdirect federal activities or federally sponsored activities which are reasonably likely to affect any coastal use orresource within the RICRMC’s jurisdictional area (Figure 4-32).In some areas, RICRMC jurisdiction is expanded to include those areas within the watershed boundaries ofcertain coastal estuaries. These watershed areas are regulated under SAMPs. RICRMC SAMPs have beenprepared for the Salt Pond Region, Providence Harbor, Metro Bay, Pawcatuck River, Narrow River, Aquidneck245 Map of the Prudence Island Complex Unit D02B. U.S. Fish and Wildlife Service. October 24, 1990, revised July 12, 1996.246 U.S. Department of Commerce, National Oceanic and Atmospheric Administration, Ocean and Coastal Resource Management,www.coastalmanagement.noaa.gov.Chapter 4 – Affected Environment 4-70 July 2011\\mawatr\ev\09228.00\reports\<strong>FEIS</strong>_Final_July_2011\<strong>PVD</strong>_CH04_Affected_Env_JUL_2011.doc
T.F. <strong>Green</strong> <strong>Airport</strong> <strong>Improvement</strong> <strong>Program</strong>Environmental Impact Statement and Final Section 4(f) EvaluationIsland, and <strong>Green</strong>wich Bay. The southern portion of the Project Area is within the watershed of <strong>Green</strong>wich Bay(Figure 4-32), and is subject to RICRMC coastal jurisdiction and goals of the <strong>Green</strong>wich Bay SAMP. 247 Activitiescomprising the <strong>Improvement</strong> Project will require a CZM Consistency Determination from the RICRMC. TheSAMP identifies T.F. <strong>Green</strong> <strong>Airport</strong> as a potential source of pollutant loading in the <strong>Green</strong>wich Bay watershedand the regional groundwater aquifer that discharges to <strong>Green</strong>wich Bay.RICRMC also has authority over freshwater wetlands in the vicinity of the coast. The RICRMC’s Rules andRegulations Governing the Protection and Management of Freshwater Wetlands in the Vicinity of the Coast 248 definesresources subject to protection and requirements for seeking approvals. Maps identifying the boundary betweenRICRMC and RIDEM jurisdictions are published by the RICRMC. The boundary typically follows majorroadways, railroad corridors, and other linear facilities. In the vicinity of the <strong>Airport</strong>, the boundary line followsNarragansett Parkway to Warwick Avenue, Warwick Avenue south to West Shore Road, and West Shore Roadsouth and west to Post Road (Figure 4-32). T.F. <strong>Green</strong> <strong>Airport</strong> is not within the RICRMC freshwater wetlandjurisdiction; however, portions of the Project Area east of Warwick Avenue are within the RICRMC freshwaterwetland jurisdiction.4.15 FarmlandsThis section provides a summary of the methodology of the farmland soils inventory, and briefly describesexisting farmland soil conditions within the T.F. <strong>Green</strong> <strong>Airport</strong> Study and Project Areas.4.15.1 MethodologyFarmland soils within the Project Area were identified by reviewing the Soil Survey of Rhode Island. 249 In 1981, theUnited States Department of Agriculture (USDA) passed the Farmland Protection Policy Act (FPPA)(7 U.S.C. 4201-4209) to ensure that significant agricultural lands are protected from being converted tonon-agricultural uses during federal actions. 250 The FPPA protects three classes of farmland soils: PrimeFarmland; Unique Farmland; and additional farmland other than prime or unique farmland that is of statewideor local importance (Farmland of Statewide Importance), as described further below.• Prime Farmland is defined as land (certain soil types) that has the best combination of physical andchemical characteristics for producing food, feed, forage, fiber, and oilseed crops, and is also available forthese uses. Prime farmland can include cropland, pastureland, range-land, forest land, or other land. It doesnot include land already in or committed to urban development or water storage.• Unique Farmland is land other than prime farmland that is or can be used for the production of specifichigh-value food and fiber crops.247 <strong>Green</strong>wich Bay Special Area Management Plan, Rhode Island Coastal Resources Management Council, adopted May 10, 2005,www.crmc.state.ri.us/regulations/SAMP_<strong>Green</strong>wichBay.pdf.248 Rhode Island Coastal Resources Management Council, Coastal Resources Management <strong>Program</strong>,www.crmc.state.ri.us/regulations/Fresh_Water_Wetlands.pdf.249 Soil Survey of Rhode Island, Rector, Dean. USDA Natural Resource Conservation Service (formerly Soil Conservation Service). 1981.250 Environmental Desk Reference for <strong>Airport</strong> Actions, FAA, October 5, 2007.Chapter 4 – Affected Environment 4-71 July 2011\\mawatr\ev\09228.00\reports\<strong>FEIS</strong>_Final_July_2011\<strong>PVD</strong>_CH04_Affected_Env_JUL_2011.doc
T.F. <strong>Green</strong> <strong>Airport</strong> <strong>Improvement</strong> <strong>Program</strong>Environmental Impact Statement and Final Section 4(f) Evaluation• Additional Farmland of Statewide Importance includes farmlands of statewide or local importance andlands also potentially used for the production of food, feed, fiber, forage, and oil seed crops. Generally,additional farmlands of statewide or local importance include those that nearly meet the definition of primefarmland and that economically produce high yields of crops when treated and managed according toacceptable farming methods.4.15.2 Affected EnvironmentThe soils within the Project Area that are classified as Prime Farmland or Additional Farmland of StatewideImportance are shown on Figure 4-33 and listed in Table 4-36.Table 4-36Regulated Farmland Soils within the Project Area (Baseline Condition)Prime Farmland 1Area (acres)Merrimac sandy loam, 0 to 3 percent slopes 14.2Merrimac sandy loam, 3 to 8 percent slopes 1.9Sudbury sandy loam 17.8Additional Farmland of Statewide ImportanceWalpole sandy loam 2 69.8Hinckley gravelly sandy loam, 0 to 3 percent slopes 169.4Hinckley gravelly sandy loam, rolling 83.11 All the Prime Farmland soil map units are also designated as Additional Farmland of Statewide Importance.2 Refers to artificial drainage installed in agricultural fields.Scattered pockets of both Prime Farmland and Additional Farmland of Statewide Importance soil mappingunits occur throughout the northern and southeastern portions of the Project Area (Figure 4-33). Regulatedfarmland soils at the southeastern corner of the Project Area are primarily within undrained wetland areas, orare developed. Within the Project Area, most Prime Farmland and Additional Farmland of StatewideImportance units are undeveloped and consist of woodland and shrubland or undrained wetlands.Most undeveloped farmland soils occur north of <strong>Airport</strong> Road, extending from Post Road to Spring <strong>Green</strong> Pond(Figure 4-33). A 55-acre tract of cultivated Additional Farmland of Statewide Importance is locatedapproximately one-quarter mile north of <strong>Airport</strong> Road (the Confreda Farm). The 38.8-acre Fain Farm (37.8 acresof which are Additional Farmland of Statewide Importance) is also just north of <strong>Airport</strong> Road and BuckeyeBrook. These are the only areas of active farmland within the Project Area.Most of the Additional Farmland of Statewide Importance units closest to the eastern portions of the <strong>Airport</strong>property boundary are mapped as poorly drained Walpole soils according to the Soil Survey of Rhode Island. 251Walpole soils are hydric and are only considered Additional Farmland of Statewide Importance when drained.Because these soils are not presently drained, they are excluded from consideration as Additional Farmlands ofStatewide Importance. Small pockets of both Prime Farmland and Farmland of Statewide Importance soil251 Soil Survey of Rhode Island, Rector, Dean. USDA Natural Resource Conservation Service (formerly Soil Conservation Service). 1981.Chapter 4 – Affected Environment 4-72 July 2011\\mawatr\ev\09228.00\reports\<strong>FEIS</strong>_Final_July_2011\<strong>PVD</strong>_CH04_Affected_Env_JUL_2011.doc
T.F. <strong>Green</strong> <strong>Airport</strong> <strong>Improvement</strong> <strong>Program</strong>Environmental Impact Statement and Final Section 4(f) Evaluationmapping units are interspersed either within or around these larger Walpole mapping units closest to theeastern portions of the <strong>Airport</strong> (Figure 4-33).4.16 Hazardous Materials, Pollution Prevention, and Solid WasteThis section describes the Baseline Condition for hazardous materials and solid waste within the Project Areaand Study Area.4.16.1 MethodologyPotential sources of soil and groundwater contamination were assessed within the Project Area, the area ofprobable physical impact, and the Study Area, which includes additional areas in the vicinity ofT.F. <strong>Green</strong> <strong>Airport</strong> that may have the potential to affect the <strong>Airport</strong> or the Project Area. The identification ofhazardous materials was established using guidance set forth in ASTM E 1527-00 Standard Practice forEnvironmental Site Assessments, 252 which is the generally accepted standard for environmental site assessments.FAA evaluated available published materials for the presence of known and potential subsurface contaminationand oil or hazardous material use and storage areas within the Study Area. A review of federal, state, andproprietary environmental agency databases was conducted through Environmental Data Resources, Inc. (EDR)to identify properties in the vicinity of the Project Area that have had a release of oil and/or hazardousmaterials (OHM). The review included the National Priority List (NPL) which is a database maintained by theEPA as an inventory of hazardous materials disposal sites that have been reported to the federal governmentand been determined to be a priority for a federally overseen cleanup. The types of sites reviewed includedthose listed in the Comprehensive Environmental Response, Compensation, and Liability Information System(CERCLIS), Leaking Underground Storage Tanks (LUST), State-listed Sites, and hazardous waste generatorswithin the Project Area. A review of RIDEM files provided information regarding the type of release, preciselocation of soil or groundwater impacts, magnitude of the impacts, and the most recent status of any monitoringor remediation activities for each of the releases. Refer to Table 2-1 of the Hazardous Materials, PollutionPrevention, and Solid Waste Technical Report of the DEIS for the complete list of databases reviewed.The various solid and hazardous wastes generated and managed at T.F. <strong>Green</strong> <strong>Airport</strong> were inventoried. . Suchsources include sanitary waste and garbage from airport facilities and aircraft, waste oil products associatedwith vehicle and equipment maintenance facilities (including GSE), and miscellaneous waste from building andairfield maintenance. RIAC operates in compliance with Rhode Island’s Rules and Regulations for HazardousWaste Management according to a letter of compliance from the RIDEM to RIAC (dated May 2004).4.16.2 Affected EnvironmentThis section summarizes the potential sources of contaminated soil and/or groundwater within the Project Areaas the Baseline Condition.252 ASTM E 1527 Standard Practice for Environmental Site Assessments, American Society for Testing and Materials, July 2000. Superseded by ASTME1527 - 05 Standard Practice for Environmental Site Assessments: Phase I Environmental Site Assessment Process, 2005.Chapter 4 – Affected Environment 4-73 July 2011\\mawatr\ev\09228.00\reports\<strong>FEIS</strong>_Final_July_2011\<strong>PVD</strong>_CH04_Affected_Env_JUL_2011.doc
T.F. <strong>Green</strong> <strong>Airport</strong> <strong>Improvement</strong> <strong>Program</strong>Environmental Impact Statement and Final Section 4(f) Evaluation4.16.2.1 Hazardous MaterialsA review of federal and state environmental databases, and state records was conducted to identify propertieswithin the Project Area and the Study Area that have had a release or threat of release of OHM, and may havethe potential to impact the <strong>Improvement</strong> <strong>Program</strong>. The majority of sites identified in the database search are notanticipated to present a threat to soil or groundwater within the Project Area based on the distance from the<strong>Airport</strong>, direction with respect to inferred groundwater flow direction, and/or completed remedial status. Asearch of the NPL revealed that there are no listed sites in the Project Area, Study Area, or the City of Warwick.Further review of sites within the Project Area or upgradient from the Project Area was undertaken to identifythe potential contaminants that could be encountered during construction of the proposed <strong>Airport</strong><strong>Improvement</strong> <strong>Program</strong>. Figure 4-34 shows the locations of sites identified as a potential source of soil andgroundwater contamination.Storage and Handling of Oil Products at T.F. <strong>Green</strong> <strong>Airport</strong>Figure 4-35 shows the numerous oil management areas at T.F. <strong>Green</strong> <strong>Airport</strong>. Oil management areas include areaswhere oil products are stored or handled, such as underground and aboveground storage tanks, drums,miscellaneous oil product containers, and fueling areas. The following paragraphs provide an overview of knownaboveground and underground storage tanks on-<strong>Airport</strong>.Aboveground Storage Tanks (ASTs)RIAC and its tenants maintain 23 ASTs holding more than 300,000 gallons of petroleum products 253 (diesel fuel,gasoline, motor oil, hydraulic oil, waste oil, Jet A, aviation gas, heating oil, and truck oil) all of which are locatedinside the <strong>Airport</strong> perimeter fencing. Table 4-37 lists the on-<strong>Airport</strong> ASTs.Underground Storage Tanks (USTs)RIAC and <strong>Airport</strong> tenants maintain 20 UST systems at T.F. <strong>Green</strong> <strong>Airport</strong>, which are listed in Table 4-38.Figure 4-35 shows the location of the on-<strong>Airport</strong> USTs.According to the Spill Prevention Containment and Control Plan (Revision 3.0 dated April 2004), all USTs at the<strong>Airport</strong> have been removed or upgraded to meet EPA requirements. 254 According to a letter of complianceissued to RIAC from the RIDEM, RIAC was in compliance with Rhode Island Rules and Regulations forUnderground Storage Facilities Used for Petroleum Products and Hazardous materials at this time.A summary of Emergency Response Activities 255 in 2001 reported that subsurface soil and groundwatercontamination was discovered during excavation activities performed at the Former T.F. <strong>Green</strong> Fuel Farm withregard to the installation of an oil/water separator (Figure 4-34). Reports from January 2004 to 2010 indicate thatthe potential contaminants of primary concern (benzene, toluene, ethyl benzene, and xylene) are belowdetection limits and that other VOCs associated with the petroleum products were below actionablelevels. RIAC continues to operate the oil/water separator.253 Spill Prevention, Control, and Countermeasure Plan T.F. <strong>Green</strong> <strong>Airport</strong>, Fuss & O’Neill, Inc. Revision 3.0, April 2004.254 Ibid. 255 Emergency Response Activities. BETA Consulting Engineers, Scientists and Planners, December 2001.Chapter 4 – Affected Environment 4-74 July 2011\\mawatr\ev\09228.00\reports\<strong>FEIS</strong>_Final_July_2011\<strong>PVD</strong>_CH04_Affected_Env_JUL_2011.doc
T.F. <strong>Green</strong> <strong>Airport</strong> <strong>Improvement</strong> <strong>Program</strong>Environmental Impact Statement and Final Section 4(f) EvaluationTable 4-37T.F <strong>Green</strong> <strong>Airport</strong> Aboveground Storage TanksCapacityProductTank ID Number Date Installed (gallons) Contained StatusA-T.F. <strong>Green</strong> <strong>Airport</strong> Maintenance FacilityA-001 1998 6,000 Diesel ActiveA-002 1998 6,000 Gasoline ActiveA-008 (Office) 1999 480 Diesel ActiveA-009 (Garage) 2001 350 Motor Oil ActiveA-010 (Garage) 2001 350 Hydraulic Oil ActiveA-011 (Garage) 2003 350 Waste Oil ActiveC-Hangar No. 2 2001 6,000 Diesel ActiveC-002 (FedEx) 2001 275 Motor Oil ActiveC-003 (ADS Aviation Maintenance, Inc.) 1998 (est.) 275 Waste Oil ActiveC-004 (FedEx) 2002 125 Waste Oil ActiveF-Former City of Warwick Fire StationF-001 1998 280 Diesel ActiveG-Air Traffic Control TowerG-001 2001 1,000 Diesel ActiveG-002 Unknown 75 Diesel ActiveI-Northstar Aviation, FBO (West Tank Farm) 2000/2001 500 Motor Oil ActiveS-003 (Budget) 2000/2001 500 Truck Oil ActiveS-New Rental Car Facilities (AVIS, HERTZ, BUDGET)S-002 (Budget) 2000/2001 500 Motor Oil ActiveS-003 (Budget) 2000/2001 500 Truck Oil ActiveS-004 (Budget) 2000/2001 1,000 Waste Oil ActiveS-008 (Hertz) 2000 500 Motor Oil ActiveS-009 (Hertz) 2000 500 Waste Oil ActiveS-013 (Avis) 2000 500 Motor Oil ActiveS-014 (Avis) 2000 500 Motor Oil ActiveS-015 (Avis) 2000 500 Waste Oil ActiveSource: EDR DataMap Area Study, July 26, 2005.Note: Within the existing Fuel Farm on-<strong>Airport</strong>, there are also six 50,000 gallon Jet-A fuel tanks.Chapter 4 – Affected Environment 4-75 July 2011\\mawatr\ev\09228.00\reports\<strong>FEIS</strong>_Final_July_2011\<strong>PVD</strong>_CH04_Affected_Env_JUL_2011.doc
T.F. <strong>Green</strong> <strong>Airport</strong> <strong>Improvement</strong> <strong>Program</strong>Environmental Impact Statement and Final Section 4(f) EvaluationTable 4-38 Underground Storage Tanks 1 Capacity ProductTank ID Number Date Installed (gallons) Contained StatusH-FAA FacilitiesH-001 (Approach Lighting System) 1988 2,500 Diesel ActiveJ-Northstar Aviation, FBO (East Tank Farm)J-001 11/88 20,000 Jet A ActiveJ-002 11/88 20,000 Jet A ActiveJ-003 11/88 12,000 Jet A ActiveJ-004 11/88 500 Tested Fuel ActiveJ-005 Unknown 500 Tested Fuel ActiveK-Fleet Aircraft FacilityK-001 4/91 7,500 Jet A ActiveK-002 4/91 7,500 Jet A ActiveL-CVSL-001 3/80 20,000 Jet A ActiveM-Textron, Inc. (West Hangar)M-001 4/81 20,000 Jet A ActiveO-Bell Helicopter HangarO-002 (Oil/Water Separator UST) 1987 700 Oily Washwater ActiveP-Former Rental Car Facilities (AVIS, HERTZ)P-001 (Avis) 11/84 10,000 Gasoline ActiveP-002 (Avis) 11/84 10,000 Gasoline ActiveP-003 (Avis) 11/84 1,000 No. 2 Oil ActiveP-007 (Hertz) 3/77 10/000 Gasoline ActiveR-T.F. <strong>Green</strong> <strong>Airport</strong> (Terminal, Terminal Apron, ParkingAreas, and Cargo Building)R-006 (UST Terminal Generator) 1995 6,000 Diesel ActiveS-New Rental Car Facilities (AVIS, HERTZ, BUDGET)S-001 (Budget) 2000/2001 1,600 (total) 1,200-gal Activegasoline400-gal dieselS-007 (Hertz) 2000 10,000 Gasoline ActiveS-010 (Hertz) (UST Holding tank) 2000 Unknown Recovered Oil ActiveS-012 (Avis) 2000 10,000 Gasoline ActiveSource: EDR DataMap Area Study, July 26, 2005.Note: UST = Underground storage tank.1 Refer to Figure 4-35 for location of these sources.Chapter 4 – Affected Environment 4-76 July 2011\\mawatr\ev\09228.00\reports\<strong>FEIS</strong>_Final_July_2011\<strong>PVD</strong>_CH04_Affected_Env_JUL_2011.doc
T.F. <strong>Green</strong> <strong>Airport</strong> <strong>Improvement</strong> <strong>Program</strong>Environmental Impact Statement and Final Section 4(f) EvaluationMiscellaneous Oil and Hazardous Materials StorageSmall quantities of miscellaneous OHM are stored in various material storage areas around the <strong>Airport</strong>, which arelisted in Table 4-39 and depicted on Figure 4-35. Handling, storage and disposal of these OHM is the responsibilityof each individual operator/tenant.Table 4-39Miscellaneous Oil and Hazardous Materials StorageTank ID Number# DrumsDateInstalledCapacity(gallons) Product Contained StatusA-T.F. <strong>Green</strong> <strong>Airport</strong> Maintenance FacilityA-006 (Garage)A-007 (Garage)Drums (2)Drums (7)NANA5555 (each)Waste OilMotor Oil, Waste Oil,Hydraulic OilActiveActiveB-Hangar No. 1B-001 (PT Aero)B-003 (Corporate Air)DrumDrums (2)NANA5555 gal (each)Waste OilWaste Oil, OilActiveActiveC-Hangar No. 2C-001 (FedEx)C-005 (ABX Air)Drums (6)DrumNANA55 gal (each)55Motor Oil, Hydraulic OilWaste OilActiveActiveJ-Northstar Aviation, FBO (East Tank Farm)J-006 Drums (4) NA 55 gal (each) Fuel Additive (Prist®) ActiveK-Fleet Aircraft FacilityK-004Drums (2) NA 55 gal (each) Waste Oil, Test Fuel ActiveL-CVSL-002 Drum NA 55 Waste Oil ActiveM-Textron, Inc. (West Hangar)M-003 Drum NA 55 gal (each) Waste Oil ActiveN-Textron, Inc. (East Hangar)N-001 Drums NA 55 Waste Oil ActiveO-Bell Helicopter HangarO-001 Drums (2) NA 55 gal (each)R-T.F. <strong>Green</strong> <strong>Airport</strong> (Terminal, Terminal Apron, ParkingAreas, and Cargo Building)R-001 (Quantum) Drums (2) NA 55 gal eachR-002 (Quantum) Drums (2) NA 55 gal eachR-003 (Delta) Drums (4) NA 55 gal eachR-004 (Delta) Drum NA 55R-007 (Northstar) Drums (7) 1995 55 gal eachS-New Rental Car Facilities (BUDGET) 1S-006 (Budget) Drum 2000/2001 55Source: EDR DataMap Area Study, July 26, 2005.Note: Refer to Figure 4-35.FBO = Fixed-base Operator.1 Since the 2004 baseline assessment was conducted, RIAC has removed all the tanks at the rental car facilities.Waste fuel, test fuelMotor Oil, Waste OilLubrication OilLubrication OilWaste OilMotor OilTransmission FluidActiveActiveActiveActiveActiveActiveActiveChapter 4 – Affected Environment 4-77 July 2011\\mawatr\ev\09228.00\reports\<strong>FEIS</strong>_Final_July_2011\<strong>PVD</strong>_CH04_Affected_Env_JUL_2011.doc
T.F. <strong>Green</strong> <strong>Airport</strong> <strong>Improvement</strong> <strong>Program</strong>Environmental Impact Statement and Final Section 4(f) EvaluationSpillsAccording to the RIAC Oil Spill History, from June 2005, there were 16 spills recorded which involved between15 and 50 gallons of Jet A fuel or diesel fuel. 256 Five spills were recorded above 50 gallons. Other substantialreleases recorded which were greater than 20 gallons involved hydraulic fluid, motor oil, lavatory waste, andglycol. Spills were contained in accordance with RIAC’s operational procedures (refer to Section 4.16.2.2,Pollution Prevention Measures at T.F. <strong>Green</strong> <strong>Airport</strong>).Potential Sources of Contaminated Soil or Groundwater Within the Project AreaA review of federal and state environmental databases, and state records was conducted to identify propertieswithin the Project Area and the Study Area that have had a release or threat of release of OHM, and may havethe potential to impact the T.F. <strong>Green</strong> <strong>Airport</strong> <strong>Improvement</strong> <strong>Program</strong>. A search of the NPL revealed that thereare no listed sites in the Project Area, Study Area, or the City of Warwick.The majority of sites identified in the database search are not anticipated to present a threat to soil or groundwaterwithin the Project Area based on the distance from T.F. <strong>Green</strong> <strong>Airport</strong>, direction with respect to inferredgroundwater flow direction, and/or completed remedial status. Further review of sites within the Project Area orup gradient from the Project Area was undertaken to identify the potential contaminants that could beencountered during construction of the proposed <strong>Airport</strong> <strong>Improvement</strong> <strong>Program</strong>. The following sections provideinformation on the CERCLIS, LUSTs, state-listed Sites, and RCRA generators within the Project Area.Comprehensive Environmental Response, Compensation and Liability Information SystemThe two active CERCLIS sites are located within the Project Area: the Former Truk-Away Landfill and theMays, Marshall & Meier, Co. site.Former Truk-Away LandfillThe Former Truk-Away Landfill, which is located adjacent to the <strong>Airport</strong> property on state-owned land, is westof Runway 16-34 (Figure 4-36). Appendix M, Hazardous Materials, Pollution Prevention and Solid Waste providestwo Limited Environmental Site Investigation Reports for the former Truk-Away Landfill dated March 2011 andSeptember 2008. The reports describe the investigation and sampling activities conducted to supportremediation and closure of the Former Truk-Away Landfill.Periodic monitoring of onsite monitoring wells at this active CERCLIS site revealed the presence of separate phasepetroleum, in addition to other groundwater impacts. 257 Soil vapor sampling has shown high concentrations ofmethane near the center of the site. Areas of exposed solid waste are still observed at the site. Rhode IslandDepartment of Administration (RIDOA) is responsible for characterizing the nature and extent of the contaminationfree, and proposing a method of remediation. The actual boundary, or edge of waste, of the landfill has not beendelineated, and additional monitoring wells have not been installed to characterize the impact the landfill may haveon off-site groundwater supplies or the surrounding surface water bodies and wetlands.256 Spill Prevention, Control, and Countermeasure, dated March 2, 1999 through June 1, 2005.257 Site Investigation Report, Former Truk-Away Landfill, Warwick Industrial Drive, Warwick, Rhode Island. EA Engineering, Science, and Technology, Inc.September 2008.Chapter 4 – Affected Environment 4-78 July 2011\\mawatr\ev\09228.00\reports\<strong>FEIS</strong>_Final_July_2011\<strong>PVD</strong>_CH04_Affected_Env_JUL_2011.doc
T.F. <strong>Green</strong> <strong>Airport</strong> <strong>Improvement</strong> <strong>Program</strong>Environmental Impact Statement and Final Section 4(f) EvaluationOn-site monitoring wells were sampled by Lincoln Environmental under the supervision of RIDEM and RIDOAin December 2004 and January 2005. The results of the groundwater analysis were submitted to RIDEM inMarch 2005, and reported low level concentrations of volatile and semi-volatile organic compounds in five ofthe six wells sampled. These concentrations were below applicable RIDEM GB groundwater standards. 258 Asixth well was found to contain separate phase product on two sampling events. Analysis of a sample from thiswell revealed the presence of polychlorinated biphenyls (PCBs), in addition to petroleum compounds.Surface water sampling conducted in the 1980s showed some PCB contamination in a pond near the landfill aswell as varying levels of petroleum and PCB contamination in sediments and groundwater. Subsequentsampling results indicated that contamination at the site has decreased, and groundwater sampling found thatthe groundwater at the site met RIDEM regulatory objectives. However, this investigation also identified a lightnon aqueous phase liquid (LNAPL) containing VOCs and PCBs still floating at the top of the groundwater table.There is no indication that the contaminants are migrating off-site, but the LNAPL would require furtherremediation and the landfill would have to be capped with clean fill before the site could be closed and delistedfrom the CERCLIS. 259Mays, Marshall & Meier, Co.The Mays, Marshall & Meier, Co. site is located at 450 Pavilion Avenue in Warwick, approximately 0.2 milesnorth of the <strong>Airport</strong> boundary, outside of the <strong>Airport</strong> property (Figure 4-34). The Mays, Marshall & Meier, Co.site is considered active by RIDEM and requires on-going remedial actions. This site is a potential source ofchlorinated groundwater and LNAPL. Based on field monitoring, it appears that groundwater flows in asoutheasterly direction from the site towards T.F. <strong>Green</strong> <strong>Airport</strong>.Leaking Underground Storage Tanks (LUSTs)Table 4-40 lists the seventeen LUSTs within the Project Area.Two active LUST sites (located off-<strong>Airport</strong>) are presently under investigation or are undergoing groundwatermonitoring as required by RIDEM: Mobil SS#01 and Spring <strong>Green</strong> Corporation (Former #1Tire) (Figure 4-34).Seven sites either will require or have required soil removal only during UST closure. The remaining eight sitesare inactive. Inactive sites are closed and UST releases have been remediated or attenuated. The BudgetRent-A-Car site located at T.F. <strong>Green</strong> <strong>Airport</strong> (at 2000 <strong>Airport</strong> Road) is inactive. In December 2003 letter, RIDEMindicated that contaminated soil and/or groundwater may still be present in or around the area known to havebeen impacted by a former LUST release.258 RIDEM classifies groundwater as GB for those groundwater resources which may not be suitable for public or private drinking water use without treatmentdue to known or presumed degradation (RIDEM Rules and Regulations for Groundwater Quality, March 2004).259 Site Investigation Report, Former Truk-Away Landfill, Warwick Industrial Drive, Warwick, Rhode Island. EA Engineering, Science, and Technology, Inc.September 2008.Chapter 4 – Affected Environment 4-79 July 2011\\mawatr\ev\09228.00\reports\<strong>FEIS</strong>_Final_July_2011\<strong>PVD</strong>_CH04_Affected_Env_JUL_2011.doc
T.F. <strong>Green</strong> <strong>Airport</strong> <strong>Improvement</strong> <strong>Program</strong>Environmental Impact Statement and Final Section 4(f) EvaluationTable 4-40Leaking Underground Storage Tanks within the Project Area (Baseline Condition)Date Added to theSite Name Site Address Status RIDEM LUST ListMobil SS#01 1 1776 Post Road Active 7/10/89Exxon Station 2003 Post Road Inactive 1/1/93Strawberry Field Site 333 Strawberry Field Road Inactive 8/18/95Ryder 112 Gallway Street Inactive 9/15/98Cedar Swamp Pumping Station Cedar Swamp Road SRO 9/5/95Sunoco Service Station 1630 Post Road Inactive 10/3/94C-Line Trucking 340 Jefferson Blvd. Inactive 10/15/97Confreda Bros Farm 140-150 Wyoming Avenue SRO 11/14/96Textron Aircraft 566 <strong>Airport</strong> Road SRO 7/30/93CVS 560 <strong>Airport</strong> Road SRO 11/4/98Northstar Aviation Inc 544 <strong>Airport</strong> Road Inactive 12/29/95Confreda Farms 82 Evergreen Avenue Inactive 11/14/96Spring <strong>Green</strong> Corp. (Former #1 Tire) 1 1550-1564 Warwick Ave Active 7/7/03Hertz – T.F. <strong>Green</strong> <strong>Airport</strong> 2000 Post Road SRO 12/27/94Budget Rent-A-Car System, Inc. 2000 <strong>Airport</strong> Road Inactive 10/26/00<strong>Airport</strong> Hangar III DOT Maintenance Facility <strong>Airport</strong> Road SRO 7/2/98T.F. <strong>Green</strong> <strong>Airport</strong> Post Road SRO 1/30/95Source: EDR Report July 26, 2005.SRO Soil Removal Only1 Site is located off-<strong>Airport</strong> and is considered active as it is presently under investigation or is undergoing groundwater monitoring as required by RIDEM.Mobile SS#01Mobile SS#01 is located at 1776 Post Road, northeast of the intersection of Post Road and <strong>Airport</strong> Road(Figure 4-34). Approximately 1,100 tons of petroleum-impacted soils were removed from the site during theremoval and replacement of the USTs in July 1989. An environmental site assessment prepared November 1989following UST removal and replacement revealed petroleum impacted groundwater at the site. A groundwatersampling program to monitor natural attenuation of groundwater has been in place since 1990. A QuarterlyGroundwater Monitoring Report (January 24, 2005) indicated that concentrations of methyl tertiary butyl ether(MTBE) are above the RIDEM GB Groundwater Objectives in two of the monitoring wells. Based ongroundwater monitoring data, it appears that groundwater flow is in a northeasterly direction, away from the<strong>Airport</strong> but within the Project Area. Continued quarterly groundwater sampling was recommended to furtherevaluate site conditions.Spring <strong>Green</strong> Corporation (Former #1 Tire)The facility is located at 1550-1564 Warwick Avenue (Figure 4-34). RIDEM’s February 4, 2004 Remedial DecisionLetter approved the conceptually approved remedy of the site, including Soil Vapor Extraction coupled withChapter 4 – Affected Environment 4-80 July 2011\\mawatr\ev\09228.00\reports\<strong>FEIS</strong>_Final_July_2011\<strong>PVD</strong>_CH04_Affected_Env_JUL_2011.doc
T.F. <strong>Green</strong> <strong>Airport</strong> <strong>Improvement</strong> <strong>Program</strong>Environmental Impact Statement and Final Section 4(f) EvaluationAir Sparging (SVE/AS) to remediate petroleum-impacted soil, removal of buried solid waste for proper off-sitedisposal, construction of engineered controls, establishment of institutional controls, and the implementation ofa groundwater and surface water quality monitoring program. A Remedial Action Work Plan was submitted toRIDEM on March 8, 2004. The Spring <strong>Green</strong> Corporation site is considered Active by RIDEM and requireson-going remediation.The Environmental Land Use Restriction (ELUR) for the site requires annual inspection and maintenance of thesoil cap, prohibits the use of the site’s groundwater as a potable water source, and requires notification ofRIDEM for planned soil excavation activities. The ELUR will restrict future use of the site toindustrial/commercial land uses. A soil management plan was also prepared for this site.Rhode Island State Sites ListThe Rhode Island State Sites List is an inventory of properties for which RIDEM Division of Site Remediationhas reviewed site assessment data. These assessments were submitted voluntarily or as part of state regulatoryactions. The majority of the listed sites does not require further response actions pursuant to the RemediationRegulations, but may affect soil or groundwater conditions within the Project Area.Strawberry Field Estates is located at 333 Strawberry Field Road (Figure 4-34). The Strawberry Field site is listedas an inactive LUST site, but is considered an active State Site by RIDEM requiring further response actions.The Forest Company is located on the north side of <strong>Airport</strong> Road between <strong>Green</strong>acre Avenue and CommerceDrive (Figure 4-34). The contaminants (tricholorethylene) detected in the soil and groundwater at the site aresimilar to those found at the former Mays, Marshall & Meier, Co. west of the Forest Company Site.Groundwater flow from that site is expected to flow to the southeast, in the direction of the Forest Companyproperty.Groundwater at the NE Clarklift site, which is located southeast of the Mays, Marshall & Meier, Co. site andadjacent to the Forest Company, was found to be contaminated with trichloroethylene, 1,1 dichloroethane,1,2 dichloroethylene, and vinyl chloride. RIDEM concluded that NE Clarklift is a down gradient receptor ofcontamination emanating from the Mays, Marshall & Meier Co. site. Similar to Forest Company, groundwaterat the NE Clarklift site flows in a southeasterly direction from Mays, Marshall & Meier Co. A study done byEnvironmental Advisory Group, Inc. and Ferrari Engineering, Inc. concluded that Forest Company is also adown gradient receptor.An ELUR was proposed as the remedial alternative for the site in 1998. The purpose of the ELUR is to assure thecontaminated site is not used for residential activities, groundwater at the portion of the contaminated site is notutilized as potable water, and subsurface structures are not constructed over groundwater at those portions ofthe contaminated site characterized by hazardous substances in groundwater at concentrations exceeding theapplicable RIDEM-approved Groundwater Objectives.Chapter 4 – Affected Environment 4-81 July 2011\\mawatr\ev\09228.00\reports\<strong>FEIS</strong>_Final_July_2011\<strong>PVD</strong>_CH04_Affected_Env_JUL_2011.doc
T.F. <strong>Green</strong> <strong>Airport</strong> <strong>Improvement</strong> <strong>Program</strong>Environmental Impact Statement and Final Section 4(f) EvaluationRCRA-Regulated Hazardous WastesThe EPA requires biennial reports of information regarding the generation, management, and final dispositionof hazardous wastes regulated under RCRA (regulated as small and large quantity generators). 260 Based on theEDR database search and specific file reviews conducted at the RIDEM, no RCRA violations or violations of theRhode Island Rules and Regulations for Hazardous Materials were identified within the Project Area, although theT.H. Baylis Co., Inc. file was unavailable for review.One large quantity RCRA generator, Jay Packaging Group, Inc. located at 100 Warwick Industrial Drive, iswithin the Project Area (Figure 4-34). Jay Packaging Group, Inc. generates hazardous and non-hazardous wasteas a result of printing and coating paperboard packaging components (oil solids, spent lubricating oil,photographic fixer, silver, treated waste water, residual inks left after production cleanup, and mixed solventcleaners). RIDEM’s Office of Compliance and Inspection completed a Field Inspection Report onSeptember 29, 2004 and placed the site on the 2005 target list. In April of 2005, a Notice of Violation wasforwarded to U.S. Corporation Company from RIDEM with an administrative penalty. In September 2005,RIDEM re-inspected the property and indicated the site seemed to be compliant with most of the violations.4.16.2.2 Pollution Prevention Measures at T.F. <strong>Green</strong> <strong>Airport</strong>Operational procedures for product handling, particularly those relevant to spill prevention are included in theSpill Prevention, Control, and Countermeasures Plan. 261 Emergency response procedures, oil spill clean-upprocedures, and reporting procedures are also described in the Plan.4.16.2.3 Solid WasteConsideration is given to solid waste materials, including sanitary sewage, and demolition debris andassociated materials.Solid WasteThe majority of facilities along the west side of the <strong>Airport</strong> (the <strong>Airport</strong> terminal and belly cargo facility) areconnected to the municipal sanitary sewer system along Post Road for treatment at the Warwick WastewaterTreatment Plant. Sanitary waste from aircraft is pumped into lavatory trucks, where it is pretreated withpropylene glycol. Trucks offload the waste at an underground, enclosed triturator at the southern end of the bellycargo facility. The waste is then gravity-fed into a holding tank. A pump station conveys the waste to a sewer lineconnected to the municipal sewer system along Post Road.Terminal and aircraft trash generated at the <strong>Airport</strong> is stored in two covered, roll-off, dumpsters at the individualtenant facilities located at the terminal loading dock. Waste from the two roll-off dumpsters and from smallerdumpsters used by other airport and tenant facilities is collected by private contractors, and disposed off-<strong>Airport</strong>, inaccordance with state regulations. Recycling bins for miscellaneous recyclables are maintained throughout the<strong>Airport</strong> and tenant facilities.260 The National Biennial RCRA Hazardous Waste Report, EPA. Based on 1997 data, updated July 20, 2001. Small quantity generators generate less than220 pounds of hazardous waste, or less than 2.2 pounds of acute hazardous waste per month. A facility is defined as a federal large quantity generator if itgenerated in any single month 2,200 pounds or more of RCRA hazardous waste, 2.2 pounds of RCRA acute hazardous waste; or more than 220 pounds ofspill cleanup material contaminated with RCRA acute hazardous waste.261 Spill Prevention, Control, and Countermeasures Plan T.F. <strong>Green</strong> <strong>Airport</strong>, Fuss & O’Neill, Inc. Revision 3.0, April 2004.Chapter 4 – Affected Environment 4-82 July 2011\\mawatr\ev\09228.00\reports\<strong>FEIS</strong>_Final_July_2011\<strong>PVD</strong>_CH04_Affected_Env_JUL_2011.doc
T.F. <strong>Green</strong> <strong>Airport</strong> <strong>Improvement</strong> <strong>Program</strong>Environmental Impact Statement and Final Section 4(f) EvaluationSanitary SewageMost of the airport facilities along the west side of the <strong>Airport</strong>, including the <strong>Airport</strong> terminal and belly cargo facilityare connected to the municipal sanitary sewer system along Post Road for treatment at the Warwick WastewaterTreatment Plant. Since the 2004 baseline assessment was conducted and the InterLink was opened in 2010, rental carfacilities are no longer located on the <strong>Airport</strong>. Sanitary waste from aircraft is pumped into lavatory trucks. Trucksoffload the waste at the triturator. The triturator is housed underground in an enclosed shed to minimize potentialstormwater contact with the sanitary waste. The waste is then gravity-fed into a holding tank. A pump stationconveys the waste to a sewer line connected to the municipal sewer system along Post Road.The majority of the <strong>Airport</strong> and tenant hangar facilities on the northern portion of the <strong>Airport</strong> have individualon-site septic disposal (ISDS) systems. The <strong>Airport</strong> and the individual tenants maintain these septic systems. In2010, RIAC installed a sewer line and pump station to serve Hangar No. 2. Waste from the Aircraft Rescue andFire Fighting (ARFF) Unit and the <strong>Airport</strong> Traffic Control Tower (ATCT) facilities are conveyed to the City ofWarwick sanitary sewer for treatment.Demolition DebrisHangar No. 1 is known to contain asbestos. Other buildings constructed prior to 1980 potentially includeasbestos-containing materials (ACM). Residential buildings constructed prior to 1978 and commercial orindustrial buildings constructed prior to the mid-1990s potentially contain lead-based paint building materials.Federal law now prohibits the widespread use of these materials, particularly in residential buildings. Due toless stringent regulations, commercial and industrial buildings are considered more likely than residentialbuildings to contain these materials.4.17 Light Emissions and Visual EnvironmentThis section describes the Baseline Condition for light emissions and the visual environment within the ProjectArea.4.17.1 MethodologyThe Baseline Conditions ambient light levels were assessed by inventorying the current lighting systemenvironment within the Project Area. The visual environment was subjectively characterized in regard to theexisting environment, architecture, historic or cultural setting, and land use planning.4.17.2 Affected EnvironmentThis section describes the Baseline Condition for lighting systems and visual environment the <strong>Airport</strong>.4.17.2.1 Lighting SystemsA variety of lighting systems are required by the FAA at airports that operate in all weather conditions. Thoselighting systems are designed to permit aircraft to operate safely and under all weather conditions, both dayand night.Chapter 4 – Affected Environment 4-83 July 2011\\mawatr\ev\09228.00\reports\<strong>FEIS</strong>_Final_July_2011\<strong>PVD</strong>_CH04_Affected_Env_JUL_2011.doc
T.F. <strong>Green</strong> <strong>Airport</strong> <strong>Improvement</strong> <strong>Program</strong>Environmental Impact Statement and Final Section 4(f) EvaluationFigure 4-37 shows the existing lighting and navigation aids at T.F. <strong>Green</strong> <strong>Airport</strong>, which include:• Rotating beacon• Taxiway edge and centerline lights (all taxiways have edge lights; Taxiway V has centerline lights)• Runway Touchdown Zone (TDZ) Lights (Runway 5)• Runway edge and centerline lights (Runway 5/23 and 16/34 have edge lights; Runway 5/23 has centerline)• Runway threshold lights (Runways 5/23 and 16/34)• Runway End identifier lights (REIL) (Runway 16/34)• Visual approach slope indicators (VASI) (Runways 16, 23, and 34)• High intensity runway lights (HIRL) (Runways 5/23 and 16/34)• Medium-Intensity Approach Lighting System with Runway Alignment Indicator (MALSR) (Runways 23and 34) /Approach Light System with Sequenced Flashing Lights (ALSF) (Runway 5)• Lighted runway and taxiway signs (all runways and taxiways)• Obstruction lights• Aircraft ramp/apron floodlights• Terminal building lights• Parking lot and access road lightingRunway edge lights are used to outline edges of runways during periods of darkness or restricted visibilityconditions. The runway edge lights are white, except on the last 2,000 feet of instrument approach runways,where they are amber, indicating the touchdown zone (TDZ) during night or adverse weather. All runways areoutfitted with HIRL.Runway centerline lights indicate the location of the runway centerline during night or adverse weather.Runway 5 has TDZ lights, which include two rows of transverse light bars located symmetrically about therunway centerline, at 100-foot intervals, extending 3,000 feet along the runway. Runway 5 is equipped with aCategory II/Category III (CAT II/CAT III), Approach Light System with Sequenced Flashing Lights (ALSF-II).The ALSF-II is a high intensity approach light system with sequenced flashing lights that extends 2,400 feetfrom the end of the runway and up at a two percent slope.Runway Ends 23 and 34 are outfitted with a MALSR, which provides visual guidance to approaching aircraftduring poor weather conditions, and at night, by clearly indicating the location of the runway. The MALSR iscomprised of steady-burning white lights on top of seven stations (poles) located along the extended runwaycenterline covering a total distance of 2,400 feet in length; each station is separated by 200 feet. Each stationconsists of five 150W flood lights directed outward and upward away from the runway end. At the fifth stationthere are additional stations, one on either side of the centerline stations. In addition to the steady-burninglights, there are also Runway Alignment Indicator lights (RAILS), which are sequenced flashing lights locatedon top of the five outermost stations. The sequenced flashing lights improve a pilot’s ability to see the ApproachLighting System (ALS) when there are distracting lights in the <strong>Airport</strong> vicinity. The Runway 16 End does nothave approach lighting.Chapter 4 – Affected Environment 4-84 July 2011\\mawatr\ev\09228.00\reports\<strong>FEIS</strong>_Final_July_2011\<strong>PVD</strong>_CH04_Affected_Env_JUL_2011.doc
T.F. <strong>Green</strong> <strong>Airport</strong> <strong>Improvement</strong> <strong>Program</strong>Environmental Impact Statement and Final Section 4(f) EvaluationRunway Ends 16, 23, and 34 are equipped with VASI, which are two sets of lights; one at the start of therunway, and the other located along the runway. Each set of lights is designed so that the lights appear as eitherwhite or red, depending on the angle at which the lights are viewed. The lights are intended to signal to thepilot whether the aircraft is approaching the runway at the proper angle (i.e., on the glide slope).The Terminal includes 22 aircraft gates with a combination of loading jet bridges and ramp access. Generallighting of the area is to help approaching pilots identify their individual gate destinations and steer clear of anyobstructions. In addition, task lighting is necessary for servicing the aircraft while parked at the gate. Exteriorwall mounted floodlights provide general lighting to the apron, and task lighting is provided by portable unitsattached to the GSE servicing the aircraft.Most light sources do not represent a potential for annoyance unless they are unduly bright and aimed in thedirection of the viewer (a glare condition), or they are flashing intermittently (causing a distraction). Most of thelighting systems listed above are unobtrusive to the surrounding areas because they are on <strong>Airport</strong> propertyand are steady burning. Only the MALSR and the ALSF-II have the potential for annoyance, as they extendfarther out from the ends of the runways and have flashing components.4.17.2.2 Visual EnvironmentThe visual environment at and surrounding T.F. <strong>Green</strong> <strong>Airport</strong> is defined by the existing land uses in the area,which are predominantly commercial and mixed uses to the west and north, and residential uses to thenortheast, east, and south. Consistent with this pattern, most of the buildings at T.F. <strong>Green</strong> <strong>Airport</strong> are locatedalong the <strong>Airport</strong>’s western and northern edges, and away from the residential areas to the east and south.Post Road and <strong>Airport</strong> Road, which serve as gateways to the <strong>Airport</strong>, are highly developed commercialcorridors with uses that include shopping plazas, small office buildings, restaurants, gas stations, and manyairport dependent and airport-related businesses such as hotels, rental car businesses, and parking facilities.Their architecture is typical of commercial development along Post Road (U.S. Route 1) in this area ofRhode Island. The off-<strong>Airport</strong> buildings along Post Road and <strong>Airport</strong> Road are not considered to be historicallyor architecturally significant, and none are listed in the NRHP (see Section 4.7, Historic, Architectural,Archaeological, and Cultural Resources, for more detail). Existing <strong>Airport</strong> buildings and structures along Post Roadand <strong>Airport</strong> Road are consistent with typical airport uses: a passenger terminal, the terminal roadway system,surface and structured parking, airport office buildings to house employees, several aircraft hangars, andparking for airport service vehicles. The architecture of these <strong>Airport</strong> buildings and structures is consistent withthe surrounding architecture along Post Road and <strong>Airport</strong> Road.With the exception of the <strong>Airport</strong>’s north apron area (the area just south of <strong>Airport</strong> Road, which includes theeligible airport historic district), there are no historic architectural properties near enough to be affected visuallyby the <strong>Improvement</strong> <strong>Program</strong>. Within the eligible airport historic district, three properties are either listed oreligible for listing in the NRHP: Rhode Island State <strong>Airport</strong> Terminal (listed), Hangar No. 1 (eligible for listing),and Hangar No. 2 (eligible for listing). 262262 An historic property is afforded the same protection under Section 106 whether that property is listed in the National Register, or simply determined to beeligible for listing (16 U.S.C. 470 et seq.).Chapter 4 – Affected Environment 4-85 July 2011\\mawatr\ev\09228.00\reports\<strong>FEIS</strong>_Final_July_2011\<strong>PVD</strong>_CH04_Affected_Env_JUL_2011.doc
T.F. <strong>Green</strong> <strong>Airport</strong> <strong>Improvement</strong> <strong>Program</strong>Environmental Impact Statement and Final Section 4(f) Evaluation4.18 Energy Supply, Natural Resources, and Sustainable DesignThis section describes the Baseline Condition for Energy Supply, Natural Resources, and Sustainable Design.4.18.1 MethodologyFor the Baseline Condition, several major energy and natural resource topics were considered as they directlyrelate to the <strong>Airport</strong>. These include utility impacts, consumable materials, and fuel consumption related to bothaircraft and vehicles on the ground including airport and aircraft service vehicles.4.18.2 Affected EnvironmentThe operation of the <strong>Airport</strong> requires energy in the form of electricity, natural gas, Jet A fuel, aviation gasoline,motor gasoline, and diesel. This section describes the supply and demand for these various energy sources forBaseline conditions at the airport. Consideration is also given to sustainability planning requirements andfederal and state regulations associated with renewable energy. <strong>Airport</strong> construction and operations alsorequire non-energy related natural resources and manufactured products derived from natural resources. Theseinclude consumable construction materials such as wood, asphalt, metals, and concrete.4.18.2.1 Energy Supply and ConsumptionThis section discusses the primary energy and natural resource consuming elements of the <strong>Airport</strong>. Thisincludes stationary facilities, aircraft, GSE, ground support vehicles (GSV), and generators. Table 4-41 outlinesbaseline energy consumption data.Table 4-412004 Estimated Energy Consumption by Source CategorySourceStationary FacilitiesElectricityNatural GasAircraftJet AAviation Gas (AvGas)GSE/GSV/GeneratorsGasolineDieselSource: RIAC.Note: A public compressed natural gas station was constructed in 2006.GSE= Ground Support Equipment.GSV= Ground Support Vehicles.2004 Baseline15,537,298 kilowatts17,055,000 cubic feet47,020,665 gallons164,601 gallons62,177 gallons129,534 gallonsChapter 4 – Affected Environment 4-86 July 2011\\mawatr\ev\09228.00\reports\<strong>FEIS</strong>_Final_July_2011\<strong>PVD</strong>_CH04_Affected_Env_JUL_2011.doc
T.F. <strong>Green</strong> <strong>Airport</strong> <strong>Improvement</strong> <strong>Program</strong>Environmental Impact Statement and Final Section 4(f) EvaluationStationary FacilitiesElectricity and natural gas for the <strong>Airport</strong> is delivered by National Grid, the primary energy utility company fornearly all of Rhode Island. Electricity is used to light and cool the terminal buildings, provide 400 Hz power toaircraft at the gates, light the airfield and power the Navigational Aid System (NAVAIDS) equipment. Naturalgas is used to heat the terminal buildings.AircraftAircraft use of Jet A fuel and aviation gasoline at T.F. <strong>Green</strong> <strong>Airport</strong> is limited to landing, taxiing, idling, takeoff,and climbout. Fuel use by on-board APUs is included in the estimated energy consumption for Jet A and AvGasunder the Aircraft category in Table 4-41.Ground Service EquipmentGSE is owned and operated by individual airlines and includes baggage carts, movable staircases, andpushback tugs. Diesel and gasoline engines typically power this equipment. Baseline Condition fuel use of GSE,GSV, and generators that use gasoline and diesel is shown in Table 4-41.Motor VehiclesPrecise estimates on current fuel usage by motor vehicles associated with trips to and from the airport are notavailable. There is no public motor vehicle fueling station at T.F. <strong>Green</strong> <strong>Airport</strong>; however, a public accesscompressed natural gas (CNG) station was opened at the <strong>Airport</strong> in 2006.Renewable EnergyFAA Order 1050.1E encourages each Federal agency to expand the use of renewable energy in its activities. 263Rhode Island's Renewable Energy Standard requires the state's retail electricity providers to supply 16 percentof their retail electricity sales from renewable resources by the end of 2019. 264 Rhode Island has a goal for thestate government to buy 20 percent of its electricity from renewable energy resources by 2011.Natural ResourcesNon-energy related natural resources include consumable construction materials such as wood, asphalt, metals,and concrete in addition to potable water. Aside from water, significant quantities of non-energy related naturalresources are not consumed by the airport on a regular basis. Construction projects such as asphalt resurfacinghappen as needed. Other consumable products are used in relatively low volume. Potable water is used inrestroom facilities across the <strong>Airport</strong>, in aircraft maintenance facilities, and in landscaping.SustainabilityIt is the policy of the FAA, consistent with CEQ regulations implementing NEPA, to encourage the developmentof facilities that exemplify the highest standards of design including principles of sustainability. FAAOrder 1050.1E notes that, “All elements of the transportation system should be designed with a view to theiraesthetic impact, conservation of resources such as energy, pollution prevention, harmonization with the263 Executive Order 13123, <strong>Green</strong>ing the Government through Efficient Energy Management, 64 FR 30851, June 8, 1999.264 According to the most current Rhode Island State Energy Summary from the U.S. Department of Energy, website:apps1.eere.energy.gov/states/energy_summary.cfm/state=RI.Chapter 4 – Affected Environment 4-87 July 2011\\mawatr\ev\09228.00\reports\<strong>FEIS</strong>_Final_July_2011\<strong>PVD</strong>_CH04_Affected_Env_JUL_2011.doc
T.F. <strong>Green</strong> <strong>Airport</strong> <strong>Improvement</strong> <strong>Program</strong>Environmental Impact Statement and Final Section 4(f) Evaluationcommunity environment, and sensitivity to the concerns of the traveling public.” 265 The State of Rhode Islandhas also demonstrated a commitment to sustainability. All major facility projects of public agencies must bedesigned and constructed to at least the Leadership in Energy and Environmental Design (LEED) Certified or anequivalent high performance green building standard. 266RIAC has committed to managing the design, construction, operation, and maintenance of the <strong>Airport</strong> in asustainable way. The RIAC Board of Directors’ Environmental Policy of 2006 states that “RIAC will achieve itsmission through responsible environmental stewardship and the implementation of proactive environmentalprograms. The Corporation will integrate environmental considerations into all aspects of its strategic planningand business decision-making.” 267 The details of the policy cover topics of planning, natural resources, pollutionprevention, and compliance with regulations. It will be implemented and communicated by a clearmanagement commitment, and cooperative government and community relations. It also states that“Implementation of the policy is the responsibility of all employees.”265 FAA Order 1050.1E Environmental Impacts: Policies and Procedures, June 8, 2004.page A-58.266 R.I. Gen. Laws section 37-24-4 et seq.267 Board of Directors Environmental Policy. Rhode Island <strong>Airport</strong> Corporation.Chapter 4 – Affected Environment 4-88 July 2011\\mawatr\ev\09228.00\reports\<strong>FEIS</strong>_Final_July_2011\<strong>PVD</strong>_CH04_Affected_Env_JUL_2011.doc
T.F. <strong>Green</strong> <strong>Airport</strong> <strong>Improvement</strong> <strong>Program</strong>Environmental Impact Statement and Final Section 4(f) Evaluation5Environmental Consequences5.1 IntroductionThis chapter describes the environmental consequences of the <strong>FEIS</strong> Alternatives (No-Action, B2, and B4) for theenvironmental resource categories, as specified in FAA Order 1050.1E and characterized inChapter 4, Affected Environment. This chapter provides the necessary context to inform and support thediscussion in Chapter 3, Alternatives Analysis. The environmental consequences are presented as: (i) thesignificant environmental impacts based on guidance for significant adverse effects provided in FAA Order1050.1E; and (ii) other impacts based on additional impact analyses as required by federal, state, or localregulations. The impact analyses compare the <strong>FEIS</strong> Build Alternatives (Alternatives B2 and B4) to the No-ActionAlternative in the same analysis year for each environmental resource category to determine the effect(beneficial or adverse) of each alternative. The environmental impact analyses for the T.F. <strong>Green</strong> <strong>Airport</strong><strong>Improvement</strong> <strong>Program</strong> were conducted in accordance with the FAA Order 1050.1E, FAA Order 5050.4B, and theEnvironmental Desk Reference for <strong>Airport</strong> Actions. These comparisons are summarized below. The BaselineCondition (summarized in Chapter 4, Affected Environment) was developed at the start of the environmentalimpact analysis process to provide context. Measures proposed to avoid, reduce, or mitigate the potentialimpacts summarized in this chapter are presented for each environmental resource category in Chapter 6,Mitigation, of this <strong>FEIS</strong>.An overview of the environmental consequences of the No-Action Alternative and Alternatives B2 and B4 forthe planning period of 2015 through 2025 is provided in the following sections. Where appropriate supportingappendices are referenced for further information. Additionally, where data or information are pertinent, DEISsections are referenced, including DEIS appendices and Technical Reports. The DEIS Technical Reports arelisted in Chapter 1, Introduction and are provided along with the entire DEIS on the enclosed DVD. Theenvironmental impacts of each environmental category for Alternatives B2 and B4 are compared at the end ofthis chapter in Section 5.20, Environmental Consequences Summary, specifically in Tables 5-131 and 5-132. Thiscomparison is also presented at the end of Chapter 3, Alternatives Analysis, and informs the selection of thePreferred Alternative and the Environmentally Preferable Alternative.Chapter 5 - Environmental Consequences 5-1 July 2011\\mawatr\ev\09228.00\reports\<strong>FEIS</strong>_Final_July_2011\<strong>PVD</strong>_CH05_Environmental_Cons_JUL_2011.doc
T.F. <strong>Green</strong> <strong>Airport</strong> <strong>Improvement</strong> <strong>Program</strong>Environmental Impact Statement and Final Section 4(f) Evaluation5.1.1 Description of the <strong>FEIS</strong> Build AlternativesChapter 3, Alternatives Analysis, contains a detailed description of the No-Action Alternative and the elevenindividual safety and efficiency enhancement elements that comprise the T.F. <strong>Green</strong> <strong>Airport</strong> <strong>Improvement</strong><strong>Program</strong>. All the program elements are combined in different configurations to form Alternatives B2 and B4. Acomprehensive multi-level screening and evaluation process, also presented in Chapter 3, Alternatives Analysis,narrowed the alternatives under consideration to two: Alternative B2 and Alternative B4.5.1.1.1 No-Action AlternativeThe No-Action Alternative provides a base scenario against which to compare the impacts of Alternatives B2and B4. 268 The No-Action Alternative includes on- and off-<strong>Airport</strong> activities:On-<strong>Airport</strong> Activities• Ongoing periodic maintenance and minor modifications needed to maintain safe operations at the <strong>Airport</strong>• Airfield Maintenance Facility (AMF) and access roadway (completed 2007)• Full-length parallel Taxiway M supporting Runway 5-23 (completed 2008)• New Deicer Management System at an on-<strong>Airport</strong> location to be determined (to be completed by 2015)Activities Adjacent to the <strong>Airport</strong>• InterLink (previously referred to as the Intermodal Station; completed in October 2010) 269• Completed Part 150 VLAP and Current Part 150 VLAP (to be completed by 2015), as part of RIAC’s ongoingPart 150 NCP 270• Removal of the Winslow Park facilities within the current Runway 5 End RPZSee Figure 5-1 for the No-Action Alternative.5.1.1.2 Alternatives B2 and B4Table 5-1 summarizes the program elements for Alternatives B2 and B4. For Alternative B2, the safetyenhancement projects, including modifications to the Runway 16-34 RSAs would be complete by the end of 2015and the efficiency enhancement projects including extending Runway 5-23 would be complete by the end of2020. For Alternative B4, the safety enhancement projects, including modifications to the Runway 16-34 RSAs aswell as extending Runway 5-23 would be complete by the end of 2015. The remainder of the efficiencyenhancement projects would be complete by the end of 2020. See Figure 5-2 for the conceptual layouts ofAlternatives B2 and B4.268 According to FAA Order 1050.1E, Environmental Impacts: Policies and Procedures, NEPA requires a comparison of the future No-Action and future BuildAlternatives to determine those impacts that would be attributed to the proposed project.269 A new intermodal station located west of the airport entrance and Post Road that provides direct pedestrian access from the Amtrak Shore Line, RIPTAIntercity bus lines, and new consolidated rental car facilities to the T.F. <strong>Green</strong> <strong>Airport</strong> terminal.270 The Completed Part 150 VLAP was completed in 2009 and the Current Part 150 VLAP, a continuation of RIAC’s Part 150 NCP, was initiated in early 2010and is scheduled to be completed by 2015.Chapter 5 - Environmental Consequences 5-2 July 2011\\mawatr\ev\09228.00\reports\<strong>FEIS</strong>_Final_July_2011\<strong>PVD</strong>_CH05_Environmental_Cons_JUL_2011.doc
T.F. <strong>Green</strong> <strong>Airport</strong> <strong>Improvement</strong> <strong>Program</strong>Environmental Impact Statement and Final Section 4(f) EvaluationTable 5-1Alternatives B2 and B4<strong>Program</strong> Element Alternative B2 Alternative B4Safety Enhancement Elements All completed by the end of 2015 All completed by the end of 2015Upgrade Runway 16-34 Runway Safety Areas, including: X XRealign Off-<strong>Airport</strong> RoadwaysPartially Relocate <strong>Airport</strong> Road atTennessee AvenuePartially Relocate <strong>Airport</strong> Road atHasbrouck AvenueRelocate Delivery Drive X XRelocate Taxiway C X XDemolish Hangar No. 1 X XEfficiency Enhancement Elements All completed by the end of 2020 Runway 5-23 completed by the end of2015, remainder by the end of 2020)Extend Runway 5-23, including:Extend north and south to total of8,700 feetExtend south to total of 8,700 feet(Completed by the end of 2015)Realign Off-<strong>Airport</strong> Roadways 1 Fully Relocate <strong>Airport</strong> Road Realign Main Avenue(Completed by the end of 2015)Construct New Integrated Cargo Facility (Site 3) Site 3 Split Facility at Site 3Expand Passenger Terminal X XConstruct New Ground Support Equipment Facility X XConstruct New Belly Cargo Facility X XConstruct Fuel Farm X XExpand Automobile Parking Facilities X XReconfigure Terminal Access Roadways X XNote: See Figure 5-2 for Alternative B2 and Alternative B4.X Common program element.1 Runway 16-34 and Runway 5-23 would impact <strong>Airport</strong> Road differently: Runway 16-34 enhancements would result in a partial relocation of the western portion of<strong>Airport</strong> Road north of the Runway 16 End by the end of 2015, whereas Runway 5-23 extension for Alternative B2 would result in a full relocation of <strong>Airport</strong> Road to thenorth of both Runway 23 and 16 ends, connecting from Squantum Drive to Route 37 in 2020. Alternative B4 would not require a full relocation of <strong>Airport</strong> Road.5.1.2 Analysis YearsThe <strong>FEIS</strong> environmental consequences analysis assumes the following phasing schedule for Alternatives B2and B4:• 2015: Interim Build year (implementation of all Safety Enhancement Elements, including partial relocation of<strong>Airport</strong> Road. For Alternative B4 only, the extension of Runway 5-23 would be complete by the end of 2015);• 2020: Build year (all runway enhancements and other program elements, including EfficiencyEnhancements and roadway improvements completed and in operation); and• 2025: Design year (represents the future growth with all program elements in place for more than five years).For Alternative B4 only, RIAC is proposing an expedited construction schedule with the efficiency enhancementelement (the Runway 5-23 extension and associated realignment of Main Avenue) to be completed by the end of2015 along with the safety enhancements (Runway 16-34 and the partial relocation of <strong>Airport</strong> Road andDelivery Drive, demolition of Hangar No. 1, and relocation of Taxiway C). This schedule is possible forChapter 5 - Environmental Consequences 5-3 July 2011\\mawatr\ev\09228.00\reports\<strong>FEIS</strong>_Final_July_2011\<strong>PVD</strong>_CH05_Environmental_Cons_JUL_2011.doc
T.F. <strong>Green</strong> <strong>Airport</strong> <strong>Improvement</strong> <strong>Program</strong>Environmental Impact Statement and Final Section 4(f) EvaluationAlternative B4 because the number of parcels required for mandatory land acquisition for construction wouldbe substantially less than the number of parcels that would be required to construct Alternative B2. Therefore,all environmental impact categories affected by aviation activities, as well as associated construction impactsand cumulative effects, have been assessed under the 2015 analysis year for Alternative B4 (including noise,land use, socioeconomic, environmental justice, surface transportation, air quality, historical resources,Section 4(f) and Section 6(f) resources, construction, and cumulative impacts). For the purposes of the <strong>FEIS</strong>, it isassumed that the runway extension would come online by the end of 2015 for Alternative B4 and by the end of2020 for Alternative B2; therefore, project-related impacts and benefits associated with runway operations wereconsidered for these years. In accordance with the NEPA and CEQ regulations, this chapter providesinformation and analysis sufficient to compare Alternative B2, Alternative B4, and the No-Action Alternative.Table 5-2 summarizes the analysis years evaluated for resource category.Table 5-2Resource Categories Evaluated and <strong>FEIS</strong> Analysis YearsSectionAnalysis YearsNumber Resource Category 2015 2020 20255.3 Noise X X X5.4 Compatible Land Use X X X5.5 Social and Socioeconomic Impacts, and Environmental X X XJustice and Children’s Health and Safety Risks5.6 Surface Transportation X X X5.7 Air Quality X X X5.8 Historic, Architectural, Archaeological, and Cultural Resources X X X5.9 US Department of Transportation Act: Section 4(f), and Land X X Xand Water Conservation Fund Act: Section 6(f) Resources5.10 Wetlands and Waterways X5.11 Water Quality X X X5.12 Fish, Wildlife, and Plants X5.13 Federal Threatened and Endangered Species X5.14 Floodplains X5.15 Coastal Resources X5.16 Farmlands X5.17 Hazardous Materials, Pollution Prevention, and Solid Waste X X5.18 Light Emissions and Visual Environment X5.19 Energy Supply, Natural Resources, and Sustainable Design XNotes: Construction impacts are considered in each environmental category.The environmental resource category of ‘Wild and Scenic Rivers’ is not included because there are no wild or scenic rivers within the State of Rhode Island, asdefined by the Wild and Scenic Rivers Act of 1968.Chapter 5 - Environmental Consequences 5-4 July 2011\\mawatr\ev\09228.00\reports\<strong>FEIS</strong>_Final_July_2011\<strong>PVD</strong>_CH05_Environmental_Cons_JUL_2011.doc
T.F. <strong>Green</strong> <strong>Airport</strong> <strong>Improvement</strong> <strong>Program</strong>Environmental Impact Statement and Final Section 4(f) Evaluation5.1.3 Operations Forecast UpdateAs described in Chapter 3, Alternatives Analysis, the aviation activity forecast for the <strong>Airport</strong> was updated in 2009to be consistent with the FAA’s 2008 Terminal Area Forecast (TAF). This analysis was documented in the DEIS.Since the DEIS was filed, the No-Action Alternative forecast has again been revised to be consistent with the FAA’sDraft 2010 TAF, in accordance with FAA Order 5050.4B section 504 b, due to declining operations associated withthe national economic downturn. 271 The <strong>FEIS</strong> forecast is based on the 2010 Draft TAF plus an additional tenpercent for each aircraft operator category (see Section 3.9.2, <strong>FEIS</strong> Impact Analysis) and is referred to as the 2010<strong>FEIS</strong> No-Action Forecast. This revised forecast was considered in the <strong>FEIS</strong> environmental evaluation. The TAF isthe official FAA forecast of aviation activity at commercial service airports. These forecasts are prepared to meetthe budget and planning needs of FAA and provide information for use by state and local authorities, the aviationindustry, and the public. The TAF includes activity projections for air carriers, air taxi and commuters, generalaviation, and military airports in the NPIAS. Refer to Chapter 3, Alternatives Analysis, Section 3.9.2, <strong>FEIS</strong> ImpactAnalysis, for additional information on the revisions to the forecast.In both the 2009 and 2010 aircraft operations and passengers forecast updates, the forecasted flights associatedwith the runway extension would remain as anticipated in the original forecast. Based on recent market-specifichistorical passenger demand and other factors, it is reasonable to assume that 16 daily non-stop West Coastflights would occur at T.F. <strong>Green</strong> <strong>Airport</strong> if an adequate primary runway length were provided (refer toChapter 2, Purpose and Need for further details). Because of the need to revise the No-Action Alternative forecast,the FAA determined it was necessary to revise the analysis of the environmental and socioeconomic resources,specifically the impact categories of Noise, Land Use, Socioeconomic, Environmental Justice, SurfaceTransportation, Air Quality, Cultural Resources, Section 4(f), Hazardous Materials, and Water Quality). At thesame time the FAA determined it was prudent to use the most recent version of the INM to assess projectrelatednoise impacts. The noise model was re-run with fewer forecasted No-Action Alternative annualoperations and the Incremental Build Forecast. The latest version of the EDMS model was used in the air qualityassessment. Tables 5-3 and 5-4 summarize the operations and passenger activity level forecasts that formed thebasis of the <strong>FEIS</strong> environmental consequences analysis for Alternatives B2 and B4.Under the No-Action Alternative and Alternatives B2 and B4, operations continue to be lower than the BaselineCondition (2004). However, at the same time, the number of passengers are projected to increase under theNo-Action Alternative (in 2020 and 2025 only) and under Alternatives B2 and B4 (in 2015 for Alternative B4, andin 2020, and 2025 for both Alternative B2 and B4). This is because forecast passenger activity levels areanticipated to increase at a higher rate than operations due to more efficient utilization of aircraft by airlines.This greater efficiency would decrease operations while still accommodating greater passenger demandresulting in higher aircraft load factors (greater percentage of seats filled by paying passengers on each flight).271 FAA Order 5050.4B states that forecasts should be within 10 percent of the TAF for the 5-year analytical period and within 15 percent for the 10-year analytical period.Chapter 5 - Environmental Consequences 5-5 July 2011\\mawatr\ev\09228.00\reports\<strong>FEIS</strong>_Final_July_2011\<strong>PVD</strong>_CH05_Environmental_Cons_JUL_2011.doc
T.F. <strong>Green</strong> <strong>Airport</strong> <strong>Improvement</strong> <strong>Program</strong>Environmental Impact Statement and Final Section 4(f) EvaluationTable 5-3Aircraft Operations for 2010 <strong>FEIS</strong> No-Action, Incremental and Total Build Alternative ForecastsNo-ActionAlternativeDomestic LongDistance 2ExpandedCharter 3InternationalScheduled 4IncrementalBuild2004 1 121,428 0 0 0 0 121,4282015 No-Action & Alternative B2 93,500 0 0 0 0 93,5002015 Alternative B4 93,500 7,300 4 730 730 8,760 5 102,2602020 99,330 7,320 4 732 732 8,784 5 108,1142025 105,551 7,300 4 730 730 8,760 5 114,311Note: Alternatives B2 and B4 would result in a forecasted 24 additional flights daily, or 12 departures daily. Of the 24 additional flights, 20 would be Domestic LongDistance, 16 of which would be to the West Coast. The other four are additional flights to Las Vegas. For the purposes of the runway length utility analysis inChapter 3, Alternative Analysis the analysis evaluated the 16 West Coast flights (because service was already being provided to Las Vegas). A runway extensionwould provide more airlines the flexibility to use different aircraft in their fleets, thereby enhancing the likelihood that more than one airline and/or increased serviceby the existing airline would occur in the future.1 Actual operations, RIAC.2 Additional operations associated with additional non-stop service to Las Vegas and new non-stop service to West Coast destinations made possible due to theextension of Runway 5-23.3 Includes charter flights to Caribbean.4 Includes scheduled flights to London.5 Higher load factors are expected in 2025 compared to 2015.TotalBuildTable 5-4Enplaned-Deplaned Passenger 2010 <strong>FEIS</strong> No-Action, Incremental and Total Build AlternativeForecastsNo-Action Domestic Long Expanded International Incremental TotalAlternative Distance 2 Charter 3 Scheduled 4 Build Build2004 1 5,509,186 0 0 0 0 5,509,1862015 No-Action and Alternative B2 5,274,876 0 0 0 0 5,274,8762015 Alternative B4 5,274,876 548,187 124,100 93,440 765,727 5 6,040,6032020 5,844,797 549,689 124,440 93,696 767,825 5 6,612,6222025 6,519,307 614,395 124,100 93,440 831,935 5 7,351,2421 Actual passenger activity level, RIAC.2 Additional passengers made possible by additional non-stop service to Las Vegas and new non-stop service to West Coast destinations due to the extension ofRunway 5-23. Passengers would increase by 2025 with the same number of flights, or operations (see Table 5-3), due to anticipated increases in load factor.3 Includes passengers on charter flights to Caribbean.4 Includes passengers on scheduled flights to London.5 Higher load factors are expected in 2025 compared to 2015.5.1.4 Land Acquisition AssumptionsLand acquisitions (number of parcels, acreage, housing units, and businesses) were identified forthree categories for the <strong>Improvement</strong> <strong>Program</strong>:• Mandatory land acquisition, as defined by those areas that fall within the limits of disturbance forconstruction of <strong>Improvement</strong> <strong>Program</strong> elements;• Land acquisition for the project-related noise mitigation for homes exposed to noise levels at or aboveDNL 70 dB (with voluntary participation by residents); and• Land acquisition to clear the RPZ areas as recommended by the FAA (with voluntary participation by land owners).Chapter 5 - Environmental Consequences 5-6 July 2011\\mawatr\ev\09228.00\reports\<strong>FEIS</strong>_Final_July_2011\<strong>PVD</strong>_CH05_Environmental_Cons_JUL_2011.doc
T.F. <strong>Green</strong> <strong>Airport</strong> <strong>Improvement</strong> <strong>Program</strong>Environmental Impact Statement and Final Section 4(f) EvaluationFAA also factored in non-<strong>Improvement</strong> <strong>Program</strong>-related land acquisition under the No-Action Alternative,namely RIAC’s Part 150 NCP, which acquires homes through a VLAP for homes that would be exposed to noiselevels at or above DNL 70 dB (without the <strong>Improvement</strong> <strong>Program</strong>) according to an updated Noise ExposureMap (NEM). 272 Based on the 2008 Noise Exposure Map (NEM) update, 285 residential properties (280 housingunits) were identified as eligible for acquisition and were acquired in 2009 (referred to in this <strong>FEIS</strong> as theCompleted Part 150 VLAP). In early 2010, RIAC continued implementation of its Part 150 NCP based on the2020 NEM, which was accepted by the FAA on July 27, 2010. 273 The 2010 NEM update identified 115 residentialparcels as eligible for acquisition of which 70 properties have been acquired as of May 2011 (referred to in this<strong>FEIS</strong> as the Current Part 150 VLAP). The Current Part 150 VLAP is scheduled to be complete by 2015.The following lists the steps taken and assumptions made in determining the total number of parcels to beacquired for Alternatives B2 and B4.• The parcels deemed eligible for acquisition under a VLAP for future No-Action Alternative noise mitigation(a continuation of the RIAC Part 150 program) were identified by the 2020 NEM, accepted by the FAA onJuly 27, 2010. 274• The mandatory land acquisitions were identified by the limits of disturbance for construction ofAlternatives B2 and B4.Mandatory full acquisitions would occur when the entirety of a parcel would be within the limit of disturbance,when any portion of a parcel is within the limit of disturbance and a structure would be demolished, and whenapproximately two-thirds or more of the parcel would be within the limit of disturbance.A partial mandatory land acquisition would occur when approximately one-third or less of the parcel iswithin the limit of disturbance and no structures would be demolished.For businesses, a full mandatory land acquisition would occur if the entire parcel were within theconstruction limits, and/or if access or parking ratios would be reduced below zoning requirements, and/orif a portion of the site access or parking is within the limit of disturbance rendering the business inaccessible.• Voluntary full land acquisitions for project-related noise mitigation consistent with the Part 150 NCP(referred to as a Future Build VLAP) would occur when a residential parcel is fully or partially within theDNL 70 dB noise contour based on the final <strong>FEIS</strong> Alternatives and after consideration of mandatoryconstruction-related acquisitions. These properties are deemed eligible for acquisition upon issuance of theROD. (All residential properties identified as eligible for land acquisition as part of RIAC’s Part 150 NCPupdates, specifically the Completed and Current Part 150 VLAPs, are assumed to have been acquired by2015 as part of the No-Action Alternative.)For the purposes of the Alternative B2 <strong>FEIS</strong> analysis, it is assumed that residential properties would beacquired between 2020 and 2025 for project-related noise impacts in 2020. However, it is RIAC’sintention to begin to acquire residential parcels as soon as 2012, subject to availability of funding.272 RIAC’s Part 150 NCP was initiated by the 1986 NEM and NCP approval, and includes the1991 NEM update, 1995 NEM update, 2000 NCP revision, 2008NEM update, and 2010 NEM update.273 The 2020 NEM was derived from the Level 6 2020 No-Action Alternative DNL 70 dB noise contour with additional rounding, as documented in the DEIS.274 Ibid.Chapter 5 - Environmental Consequences 5-7 July 2011\\mawatr\ev\09228.00\reports\<strong>FEIS</strong>_Final_July_2011\<strong>PVD</strong>_CH05_Environmental_Cons_JUL_2011.doc
T.F. <strong>Green</strong> <strong>Airport</strong> <strong>Improvement</strong> <strong>Program</strong>Environmental Impact Statement and Final Section 4(f) EvaluationFor the purposes of the Alternative B4 <strong>FEIS</strong> analysis, it is assumed that residential properties would beacquired between 2015 and 2020 for project-related noise impact mitigation in 2015, and between 2020and 2025 for noise impact mitigation in 2020. However, it is RIAC’s intention to begin to acquireresidential parcels as soon as 2012, subject to availability of funding.The FAA and RIAC closely reviewed the project-related noise contours in order to maintainneighborhood cohesion and limit community disruption due to land acquisition. The FAA can onlyfund noise mitigation (sound insulation or land acquisition) on properties where noise levels caused bya project meet specific federal criteria. If a residential property is located inside the DNL 65 dB noisecontour then it is considered an incompatible land use and federal funds can be used for noisemitigation on that property. Most airports mitigate noise between the DNL 65 and 69 dB noise contoursby offering sound insulation, 275 and mitigate for noise at or above a level of DNL 70 dB by offering toacquire the property and relocate the occupants. FAA Order 5100.38 provides the following guidance tothe FAA on how it may consider additional properties eligible for noise mitigation: “...projects withinDNL 65 dB may be expanded beyond the DNL 65 dB contour to include a reasonable additionalnumber of otherwise ineligible parcels contiguous to the project area, if necessary to achieve equity inthe neighborhood. Neighborhood or street boundary lines may help determine what is reasonable, inaddition to numbers of properties.” 276 For the purposes of this <strong>FEIS</strong>, this concept of "neighborhoodequity," also referred to as "neighborhood rounding," has been applied where the FAA identified someresidential parcels outside the DNL 70 dB noise contour as eligible for federal noise mitigation funding(voluntary participation in a land acquisition program) as part of the <strong>FEIS</strong>. This includes homes whereany portion of the lot is within the DNL 70 dB noise contour, homes that would have been the fewremaining residences on the block (or dead-end street) after the project, or homes that would be leftisolated or surrounded by non-residential land use.For the purposes of the <strong>FEIS</strong> analysis, it is assumed that there would be 100 percent participation byresidential property owners in the VLAPs. 277• For the purposes of this <strong>FEIS</strong> analysis, voluntary full land acquisitions for RPZ areas would occur when a parcelfully or partially is within the limits of the newly created RPZs, as recommended by the FAA after considerationof mandatory construction-related acquisitions and land acquisitions for Future Build VLAPs. Under AlternativeB4, a newly created RPZ would be located at the Runway 5 End only. 278 (All residential properties identified aseligible for land acquisition as part of RIAC’s Part 150 NCP updates, specifically the Completed and Current Part150 VLAPs, are assumed to have been acquired by 2015 as part of the No-Action Alternative.)For Alternatives B2 and B4 RPZ-related acquisitions would be completed by the time the runwayextension is online and operational; however, this RPZ land acquisition timing is an estimate only. Landacquisition for RPZ clearing is recommended by the FAA and not considered required project mitigationand, therefore, contingent upon FAA funding availability.275 Includes residential units and non-residential noise-sensitive sites exposed to noise levels up to DNL 69.9 dB.276 FAA Order 5100.38C, <strong>Airport</strong> <strong>Improvement</strong> <strong>Program</strong> Handbook, U.S. Department of Transportation, Chapter 8, section 810.b, page 137, effective June 28, 2005.277 Under RIAC’s previous Part 150 VLAP efforts, participation was as high as 96 percent. More recently, as evident under the Current Part 150 VLAP,participation has declined slightly to approximately 90 percent. This decrease is due to the current economic conditions, including more stringent guidelinesfor obtaining mortgages. For the purposes of the EIS, 100 percent participation is assumed in order to disclose all potential land use changes related to landacquisition, and because property owners that initially elect not to participate in a VLAP continue to be eligible and could voluntarily participate at any time,contingent upon funding availability.278 For Alternative B4 only, since no changes are planned for the Runway 23 End, no additional acquisition of parcels in the Runway 23 RPZs is assumed.Chapter 5 - Environmental Consequences 5-8 July 2011\\mawatr\ev\09228.00\reports\<strong>FEIS</strong>_Final_July_2011\<strong>PVD</strong>_CH05_Environmental_Cons_JUL_2011.doc
T.F. <strong>Green</strong> <strong>Airport</strong> <strong>Improvement</strong> <strong>Program</strong>Environmental Impact Statement and Final Section 4(f) EvaluationFor the purposes of the <strong>FEIS</strong> analysis, it is assumed that there would be 100 percent participation forresidential parcels within the newly created RPZ areas. For commercial businesses located within theRPZ it is assumed that business owners would choose to not participate as most business types are notdisturbed by airport activities and are viewed by FAA criteria as compatible land uses. Additionally,some businesses benefit economically from proximity to an airport.RIAC has completed a Noise Land Reuse Plan for the “noise lands” acquired under its Part 150 NCP. This planincludes a compilation of all noise lands held by RIAC. There is no reasonably foreseeable redevelopment ofNoise Lands except for potential eligible relocation of Winslow Field. Therefore, any reuse plan for these areas forthe purposes of the NEPA analysis would be speculative as there are many potential reuse outcomes in differentareas around the <strong>Airport</strong> depending on a number of factors such as, the size of the available vacant land, the accessto that land, and the City of Warwick’s planning process. Upon completion of this <strong>FEIS</strong>, RIAC will update itsNoise Land Reuse Plan, in accordance with 14 CFR Part 150, as EIS projects are implemented or within 18 monthsof the issuance of the ROD, whichever comes first. RIAC will continue to consult with the City of Warwick todevelop compatible land uses for those lands deemed not required for airport purposes.5.1.5 New and Planned DevelopmentsThe cumulative impact assessments for noise, compatible land use, social and socioeconomic, transportation,and air quality take new and planned development into account. Table 5-5 lists the currently known newand/or planned, according to the City of Warwick Planning Department. New and planned developmentprojects are located in the City of Warwick and are currently being reviewed or have been approved by the Cityor are currently under construction.Table 5-5 New and Planned Developments in the Study Area 1Name of DevelopmentLocationType ofDevelopmentNumber ofHousingLots/UnitsArea(sf)Numberof HotelRoomsStatus ofDevelopmentBalise Car Dealership 1400 Post Road Commercial N/A 62,973 N/A Constructed 2Brookwood Estates Smile Court Single Family 7 lots N/A N/A Constructed 2Buckpell Estates 9-47 Davis Circle Single Family 5 lots N/A N/A Constructed 2Carpionato <strong>Green</strong>wich Avenue/Route 113 Office N/A 200,000 N/A Constructed 2Carpionato Residential <strong>Green</strong>wich Avenue Multi-Family 288 units N/A N/A ApprovedChepiwanoxet Post Road Residential 7 lots N/A N/A ApprovedCowesett Farm Blue Ridge Road and Cowesett Road Single Family 36 lots N/A N/A Master Plan ApprovedD’Ambra Parcel 800 Jefferson Boulevard Office/Hotel N/A 540,000 320 ApprovedDeFelice 3960 Post Road Office/Residential 10 units 8,364 N/A ConstructedForrest Ponds Condominiums 70 Turner Street Multi-Family 42 units N/A N/A Under ConstructionHouse of Hope 57 Fair Street Multi-Family 6 units N/A N/A Under ConstructionHouse of Hope 3188 Post Road Multi-Family/Office 4 units N/A N/A ConstructedInteglia Office Development Lori Ann Way and Metro CenterBoulevardOffice N/A 124,000 N/A One BuildingConstructed; SecondBuilding ApprovedChapter 5 - Environmental Consequences 5-9 July 2011\\mawatr\ev\09228.00\reports\<strong>FEIS</strong>_Final_July_2011\<strong>PVD</strong>_CH05_Environmental_Cons_JUL_2011.doc
T.F. <strong>Green</strong> <strong>Airport</strong> <strong>Improvement</strong> <strong>Program</strong>Environmental Impact Statement and Final Section 4(f) EvaluationTable 5-5New and Planned Developments in the Study Area 1 (continued)Name of DevelopmentLocationType ofDevelopmentNumberofHousingLots/UnitsArea(sf)Numberof HotelRoomsStatus ofDevelopmentKenneth Avenue Subdivision Extension of Kenneth Avenue Single-Family 4 lots N/A N/A Constructed 2Kent Hospital NA Hospital Expansion N/A 60,000 N/A Building Permit PendingLufkin Court NA Residential 4 lots N/A N/A Master Plan ApprovedMedical Office Building Orchard Avenue and Centerville Medical Office N/A 10,800 N/A Preliminary Approval(Chofay)RoadMedical Office Building (Roy) Tollgate Road Medical Office N/A 13,000 N/A ApprovedNorwood Estates Sargent/Cherry Streets Residential 6 lots N/A N/A ApprovedOffice Development International Way Office N/A 30,000 N/A Constructed 2Office Development Jefferson Boulevard and Malbone Office N/A 75,000 N/A Constructed 2Pond View Condominiums Post Road, Packard Street, and Multi-Family 6 units N/A N/A Constructed 2Winslow StreetPost Road Dunkin’ Donuts Post Road and Main Avenue Commercial N/A 13,410 N/A ApprovedRetail PlazaSpring <strong>Green</strong> ManorCondominiumsWarwick Avenue and <strong>Airport</strong> Road Multi-Family 35 units N/A N/A Approvals ExpiredSt. Elizabeth’s 140 Warwick Neck Avenue Elderly Housing 34 units N/A N/A Under ConstructionSt. Timothy’s Condominiums 101 Lake Shore Drive Multi-Family 14 units N/A N/A Constructed 2Sunny View Nursing Home 93 Corona Street Rehabilitation N/A 3,330 N/A In-ProcessCenterWarwick StationRedevelopment District(WSRD) 4Bounded by <strong>Airport</strong> Connector,Jefferson Boulevard, Post Road,Coronado Road, and <strong>Airport</strong> RoadMixed-Use N/A 1.5 Million NA PlannedWashington Trust 1471/1473 Warwick Avenue Bank N/A 4,270 N/A ApprovedSource: City of Warwick Planning Department (update memos dated September 7, 2006, March 10, 2009, June 10, 2009, and February 4, 2011).N/A Not Available 1 All identified projects are located in the City of Warwick and are currently being reviewed or have been approved by the city or are currently under construction.2 Constructed as of June 10, 2009; exact date not provided.3 Constructed as of February 4, 2011.4 The Warwick Station Redevelopment District (WSRD) development program has been expanded from 1.1 million gross square feet (GSF) to 1.5 million GSF, per the City update dated February 2011.5.2 Significance ThresholdsFor each environmental resource category, Alternatives B2 and B4 were compared to the No-Action Alternativeto determine the effect (beneficial or adverse) of the Alternative. This <strong>FEIS</strong> provides an analysis of whether thatimpact is significant, based on FAA guidance for significant adverse effects provided in FAA Order 1050.1E.Thresholds are summarized in Table 5-6. Significance thresholds identify the minimum attributes andcharacteristics that need to be present in a resource category (such as noise, water quality, or historic resources)in order for that category to be identified as potentially adversely affected by the Alternatives. Measuresproposed to avoid, reduce, or minimize the potential impacts are summarized in this chapter. Mitigationmeasures for impacted resources are presented in Chapter 6, Mitigation.Chapter 5 - Environmental Consequences 5-10 July 2011\\mawatr\ev\09228.00\reports\<strong>FEIS</strong>_Final_July_2011\<strong>PVD</strong>_CH05_Environmental_Cons_JUL_2011.doc
T.F. <strong>Green</strong> <strong>Airport</strong> <strong>Improvement</strong> <strong>Program</strong>Environmental Impact Statement and Final Section 4(f) EvaluationTable 5-6FAA Order 1050.1E Impact Thresholds for Significant Adverse EffectsIs there a SignificantAdverse Effect?Chapter 5 Alternative B2/Section Impact Category FAA Order 1050.1E Impact Threshold for Significant Adverse Effects Alternative B45.3 Noise When an action, compared to the no action alternative for the same timeframe, wouldYescause noise-sensitive areas located at or above DNL 65 dB to experience a noiseincrease of at least DNL 1.5 dB.5.4 Compatible Land Use See significance threshold for noise. Yes5.5 Social and For social and socioeconomic issues: When an action would cause: NoSocioeconomic Impacts • Extensive relocation, but sufficient replacement housing is unavailable;• Extensive relocation of community businesses that would cause a severeeconomic hardship for affected communities;• Disruption in local traffic patterns that would substantially reduce the level ofservice of roads serving the airport and surrounding communities; or• A substantial loss in the community tax base.Environmental Justice,Children’s Health andSafety RisksFor environmental justice issues: When an action would cause disproportionatelyhigh and adverse human health or environmental effects on minority and low-incomepopulations.For children’s health and safety risks: When an action would cause disproportionatehealth and safety risks to children.5.6 Surface Transportation None established. See significance threshold for social and socioeconomic issues. No5.7 Air Quality When a project or action exceeds one or more of the NAAQS. No5.8 Historic, Architectural,Archaeological, andCulturalWhen an action adversely affects a protected property and the responsible FAAofficial determines that the information from the State and/or Tribal HistoricPreservation Officer addressing alternatives to avoid adverse effects and mitigationYes5.95.105.10Section 4(f) ResourcesWetlands andWaterwaysWetlands andWaterways (continued)warrants further study.A significant impact would occur pursuant to NEPA when a proposed action eitherinvolves more than a minimal physical use of a Section 4(f) property or is deemed a“constructive use” substantially impairing the 4(f) property, and mitigation measuresdo not eliminate or reduce the effects of the use below the threshold of significance.When an action would:• Adversely affect a wetland’s function to protect the quality or quantity of a municipalwater supply, including sole source aquifers and a potable water aquifer.• Substantially alter the hydrology needed to sustain the affected wetland’svalues and functions or those of a wetland to which it is connected.• Substantially reduce the affected wetland’s ability to retain floodwaters or stormrunoff, thereby threatening public health, safety or welfare. The last termincludes cultural, recreational, and scientific public resources or property.Adversely affect the maintenance of natural systems supporting wildlife and fishhabitat or economically-important timber, food, or fiber resources of the affectedor surrounding wetlands.• Promote development that causes any of the above impacts.• Be inconsistent with applicable State wetland strategies.YesYesYesChapter 5 - Environmental Consequences 5-11 July 2011\\mawatr\ev\09228.00\reports\<strong>FEIS</strong>_Final_July_2011\<strong>PVD</strong>_CH05_Environmental_Cons_JUL_2011.doc
T.F. <strong>Green</strong> <strong>Airport</strong> <strong>Improvement</strong> <strong>Program</strong>Environmental Impact Statement and Final Section 4(f) EvaluationTable 5-6FAA Order 1050.1E Impact Thresholds for Significant Adverse Effects (continued)Chapter 5Section Impact Category FAA Order 1050.1E Impact Threshold for Significant Adverse Effects5.11 Water Quality When an action would not meet water quality standards. Potential difficulty inobtaining a permit or authorization may indicate a significant impact.5.12 Fish, Wildlife, and Plants For federally listed species: When the U.S. Fish and Wildlife Service or the NationalMarine Fisheries Service determines a proposed action would likely jeopardize aspecies’ continued existence or destroy or adversely affect a species’ critical habitat.Is there a SignificantAdverse Effect?Alternative B2/Alternative B4NoNo5.13 Threatened andEndangered SpeciesFor non-listed species: Consider scientific literature on and information from agencieshaving expertise addressing on the affected species. Consider information on: projecteffects on population dynamics; sustainability; reproduction rates; natural andartificial mortality (aircraft strikes); and the minimum population size needed tomaintain the affected population.See federally listed species under Fish, Wildlife, and PlantsNo5.14 Floodplains When notable adverse impacts on natural and beneficial floodplain values wouldoccur.Yes5.15 Coastal Resources None established. No5.16 Farmlands When the total combined score on Form AD-1006 ranges between 200 and 260.Impact severity increase as the total score approaches 260.No5.17 Hazardous Materials,Pollution Prevention, andSolid Waste5.18 Light Emissions andVisual Impact5.19 Natural Resources,Energy Supply andSustainable DesignWhen an action involves a property on or eligible for the National Priority List (NPL).Uncontaminated properties within a NPL site’s boundary do not always trigger thissignificant threshold.For solid waste: None established.For light emissions: When an action’s light emissions create annoyance to interferewith normal activities.For visual effects: When consultation with federal, state, or local agencies, tribes, orthe public shows these effects contrast with existing environmentsWhen an action’s construction, operation, or maintenance would cause demands thatwould exceed available or future (project year) natural resource or energy supplies.NoNoNoConstruction Impacts See significance threshold for the resource(s) construction would affect. NoNA Wild and Scenic Rivers None established. N/AN/A There are no wild and scenic rivers in Rhode Island.Chapter 5 - Environmental Consequences 5-12 July 2011\\mawatr\ev\09228.00\reports\<strong>FEIS</strong>_Final_July_2011\<strong>PVD</strong>_CH05_Environmental_Cons_JUL_2011.doc
T.F. <strong>Green</strong> <strong>Airport</strong> <strong>Improvement</strong> <strong>Program</strong>Environmental Impact Statement and Final Section 4(f) Evaluation5.3 NoiseIn accordance with FAA NEPA Orders, this section provides an overview of the impact analysis for changes innoise levels as a result of the proposed Alternatives B2 and B4 when compared to the No-Action Alternative.Section 5.4, Compatible Land Use, discusses noise impacts in terms of the amount of incompatible land area (inparcels and acres), specifically residential land uses.5.3.1 Regulatory ContextThe FAA is the primary agency responsible for regulating the noise environment, as specified by statutes andtheir implementing regulations. The FAA regulations, at 14 CFR Part 150, identify land uses normallycompatible with various exposures of individuals and properties to noise. 2795.3.2 Significance Threshold and Additional AnalysesThe noise analysis considers the impacts of Alternatives B2 and B4 as defined by the FAA’s thresholds ofsignificance, and also conducts additional noise analyses to gain a fuller understanding of the noiseenvironment.5.3.2.1 Finding: Significant Noise ImpactsThe significance threshold for changes in noise, in accordance with FAA Order 1050.1E, is when an action,compared to the no action alternative for the same timeframe, would cause noise-sensitive areas to experience anoise increase of at least DNL 1.5 dB at or above DNL 65 dB (Table 5-6). Table 5-7 lists the FAA-defined noisesignificance thresholds as well as slight to moderate levels of noise impact.Table 5-7DNL Noise Baseline Exposure Compared to Alternative ExposureDNL 65 dB or higher DNL 60 to 65 dB DNL 45 to 60 dBMinimum Change in DNL with Alternative 1.5 dB 3.0 dB 5.0 dBLevel of Impact Significant Slight to Moderate Slight to ModerateSource: FAA 1050.1E and the Environmental Desk Reference for <strong>Airport</strong> Actions.At the same time that the FAA revised the No-Action Alternative operations forecast, the FAA determined itwas prudent to use the most recent version of the INM to assess project-related noise impacts. The <strong>FEIS</strong> analysisutilizes the INM Version 7.0b, and also provides more accurate noise modeling data by slightly modifying theINM aircraft input types to provide more up-to-date information. These model input changes resulted inincreased modeled noise from these aircraft, resulting in larger <strong>FEIS</strong> noise contours when compared to the DEISLevel 6 contours and thus additional noise impacts under the No-Action Alternative and Alternatives B2 and B4conditions. The change from the DEIS to the <strong>FEIS</strong> analyses is due to the change in operations, the utilization ofthe most recent version of the INM noise model from version 7.0a to 7.0b, and a small change in model inputs.Under Alternative B2, in 2015, no housing units and no people are projected to experience a significant increase279 14 CFR Part 150, <strong>Airport</strong> Noise Compatibility Planning.Chapter 5 - Environmental Consequences 5-13 July 2011\\mawatr\ev\09228.00\reports\<strong>FEIS</strong>_Final_July_2011\<strong>PVD</strong>_CH05_Environmental_Cons_JUL_2011.doc
T.F. <strong>Green</strong> <strong>Airport</strong> <strong>Improvement</strong> <strong>Program</strong>Environmental Impact Statement and Final Section 4(f) Evaluationin noise levels because there would be no increase in aircraft operations and the RSA enhancements would notresult in a substantial change in aircraft operations with the relocated runway thresholds. Under Alternative B2,in 2020, 74 housing units (an estimated 174 people) are projected to experience a significant increase in noiselevels (increase of at least DNL 1.5 dB at or above DNL 65 dB). All 74 housing units have already been soundinsulated under a previous sound insulation program. In 2025, 49 housing units (an estimated 115 people) areprojected to experience a significant increase in noise levels. All 49 housing units have already been sound insulatedunder a previous sound insulation program. Alternative B2 would not result in significant noise increases at anynon-residential noise-sensitive sites. All residences exposed to significant noise levels would be eligible forsound insulation mitigation.Under Alternative B4, in 2015, 184 housing units (an estimated 432 people) are projected to experience asignificant increase in noise levels. Out of these 184 housing units, 161 housing units have already been soundinsulated under a previous sound insulation program. In 2020 under Alternative B4, 174 housing units (anestimated 409 people) are projected to experience a significant increase in noise levels (151 housing units havealready been sound insulated under a previous sound insulation program). In 2025, 108 housing units (anestimate of 254 people) are projected to experience a significant increase in noise levels (87 housing units havealready been sound insulated under a previous sound insulation program). Under Alternative B4, in 2015 and2020, two non-residential noise-sensitive sites would experience a significant noise increase: Jehovah’sWitnesses of Warwick (Site PW017) and Baha’i Faith (Site PW039). In 2025, these two non-residentialnoise-sensitive sites and one additional site (John Wickes School, SCH524) would experience a significantimpact under Alternative B4. All residences and non-residential noise-sensitive land uses exposed to significantnoise levels would be eligible for sound insulation mitigation. The John Wickes School and Baha’i Faith havealready been sound insulated as part of a previous sound insulation effort under the Part 150 NCP.5.3.2.2 Additional Analyses and MetricsFAA Order 1050.1E, in accordance with the Federal Interagency Committee on Noise (FICON) 280 in 1992,recommended that in addition to significant impacts, less than significant noise level changes are also identifiedfor noise-sensitive locations exposed to project-related noise level increases. FICON recommended reportingany changes in DNL of 3 dB or more between 60 and 65 dB DNL and increases of DNL 5 dB or more betweenthe 45 and 60 dB DNL contour. If it is determined that significant impacts in noise-sensitive areas are present,the FAA must evaluate whether there are 3.0 dB changes between the DNL 60 and 65 dB contours.Both the U.S. Department of Housing and Urban Development (HUD) and FAA consider noise-sensitive landexposed to noise levels of DNL 65 dB or above as incompatible and prescribe various ways to make the land281,282compatible with the airport environment. Under the FAA’s Noise and Land Use Compatibility <strong>Program</strong>,residences exposed to sound levels between DNL 65 dB and DNL 69 dB contour as a result of Alternatives B2and B4, would be eligible for sound insulation, and residences exposed to sound levels of DNL 70 dB and aboveas a result of Alternatives B2 and B4 would be eligible for participation in a VLAP.280 Federal Agency Review of Selected <strong>Airport</strong> Noise Analysis Issues, Federal Interagency Committee on Noise, Washington, D.C., August 1992.281 Environmental Criteria and Standards of the Department of Housing and Urban Development, 24 CFR Part 51; 44 Federal Register 40861,U.S. Department of Housing and Urban Development, Washington DC, July 12, 1979.282 Ibid.Chapter 5 - Environmental Consequences 5-14 July 2011\\mawatr\ev\09228.00\reports\<strong>FEIS</strong>_Final_July_2011\<strong>PVD</strong>_CH05_Environmental_Cons_JUL_2011.doc
T.F. <strong>Green</strong> <strong>Airport</strong> <strong>Improvement</strong> <strong>Program</strong>Environmental Impact Statement and Final Section 4(f) EvaluationComments received during both the agency and public scoping meetings noted that the day-night noise contourrepresented average annual noise conditions and did not adequately represent individual noise events such astaxiing or noise associated with a particular type of aircraft. To address agency and community concerns, the FAAdetermined that additional noise metrics would be added to the noise analyses conducted for the <strong>FEIS</strong>. Additionalnoise metrics are used to further describe aircraft noise levels for specific noise-sensitive locations and to assist publicunderstanding of the noise impacts. These metrics provide information that the DNL metric does not, such as thetime that a particular location experiences noise above a specified level and the maximum level at each of the sites.The Time-Above (TA) metric is given in terms of the total number of minutes. The maximum noise level (L max) helpsto characterize the magnitude of the noise event, but does not provide information regarding the duration of orcumulative exposure to the noise. These noise metrics were modeled using the same input data used to develop thenoise contours. It is important to note, that these metrics are used to provide additional details of the noiseenvironment and are not assessed to determine impacts since there are no applicable FAA criteria or standards.5.3.3 MethodologyFAA Order 1050.1E specifies a number of requirements, including which noise models are acceptable, whatconstitutes significant impact, and when additional noise analyses or metrics may be used. This sectionsummarizes the methods that were used to estimate noise from various noise sources. Refer to Appendix F.1, NoiseAssessment Methodology and INM Inputs, for further details on the noise assessment methodology. Information onacoustics and noise terminology is provided in DEIS Appendix F.1, Introduction/Acoustics and Noise Terminology.5.3.3.1 Models Used for this AnalysisFAA’s INM is the preferred model for assessing the noise impacts of airport development and determining thesignificance of changes in exposure. For the <strong>FEIS</strong> environmental consequences analysis for Alternatives B2and B4, the noise model was re-run with fewer forecasted No-Action Alternative annual operations and theIncremental Build Forecast (Tables 5-3 and 5-4). The latest version, INM Version 7.0b, was used to produce DNL75 dB, DNL 70 dB, DNL 65 dB, and DNL 60 dB contours as well as modeled levels at specific noise-sensitivesites. Figures 5-3 through 5-6 show the model flight tracks for Alternatives B2 and B4. The Traffic Noise Model(TNM) which is required for the evaluation of vehicular traffic changes was used to assess the roadway noiseimpacts and a spreadsheet model approved by the FAA for use on this project 283 was used to assess the noiseimpacts from the proposed Integrated Cargo facility. Refer to Appendix F.1, Noise Assessment Methodology and INMInputs, for further details on the INM model inputs and assumptions.5.3.3.2 Direct and Indirect Impacts MethodologyThis noise assessment evaluated three sources of noise to understand complete noise exposure resulting fromthe <strong>Improvement</strong> <strong>Program</strong> within the Noise Study Area (shown on Figure 4-1). The three sources include:• Noise associated with aircraft operations (or flights); 284• Cargo aircraft ground operations (for example, taxiing, idling, and ground power units); and• Traffic noise from vehicles (including trucks and cars) on off-<strong>Airport</strong> roadways.For 2015, two sources of program-related (resulting from Alternatives B2 and B4) noise were analyzed for theimpact assessment: aircraft noise from flight operations and traffic noise from the off-<strong>Airport</strong> roadway283 FAA Office of Environment & Energy, Approval of Spreadsheet Methodology, June 12, 2008.284 An operation is defined as a takeoff or a landing.Chapter 5 - Environmental Consequences 5-15 July 2011\\mawatr\ev\09228.00\reports\<strong>FEIS</strong>_Final_July_2011\<strong>PVD</strong>_CH05_Environmental_Cons_JUL_2011.doc
T.F. <strong>Green</strong> <strong>Airport</strong> <strong>Improvement</strong> <strong>Program</strong>Environmental Impact Statement and Final Section 4(f) Evaluationimprovements. The new Integrated Cargo Facility would not be completed by 2015, thus it was not included inthe 2015 analysis. For the full-build year (2020) and the full-build year plus five years (2025), all three sources ofprogram-related noise were analyzed: aircraft noise, cargo noise, and traffic noise.Total noise exposure was computed at representative noise-sensitive locations by logarithmically summing thenoise contributions of aircraft operations (arrivals and departures); aircraft ground operations (aircraft taxiingand queuing and engine run-ups); and vehicular traffic noise (off-<strong>Airport</strong> roadways improvements) to identifythe composite noise exposure at specific locations.Both HUD and the FAA define DNL 65 dB as the threshold of noise incompatibility with residential land uses. 285Thus, the DNL 65 dB contour is an important yardstick for population impact assessments. DNL noise exposurecontours show how the cumulative noise from T.F. <strong>Green</strong> <strong>Airport</strong>’s aircraft flight operations are predicted to bedistributed over the surrounding area on an average day. The DNL 65 dB contour also forms the basis for FAAeligibility for noise mitigation funding.The DNL 70 dB contour has been used at T.F. <strong>Green</strong> <strong>Airport</strong> as the basis of eligibility for the Part 150 VLAP. Allnon-compatible residential land use exposed to noise levels at or above DNL 70 dB would be acquired by 2015under the 2020 No-Action Alternative. The number of housing units on each acquired parcel was determinedthrough an analysis of computerized mapping data, or Geographic Information System (GIS). Then, using anestimated 2.35 persons per household, 286 the population counts for 2015, 2020, and 2025 were estimated. Thisdoes not include the total number of people and housing units that would be relocated part of theCompleted Part 150 VLAP and Current Part 150 VLAP, as described in Section 5.1.4, Land AcquisitionAssumptions. The DNL 60, 65, 70, and 75 dB noise contours for the No-Action Alternative are almost entirelywithin the City of Warwick, with a section of the DNL 60 dB contour extending into the City of Cranston.The noise analysis evaluated significant noise impacts due to aircraft noise on noise-sensitive land uses, (documentedby the number of impacted housing units and people), and forms the basis for assessing incompatible land uses(presented in Section 5.4, Compatible Land Use), impacts to historical sites (presented in Section 5.8, Historic,Architectural, Archaeological, and Cultural Resources), as well as impacts to public parks and recreation areas meetingSection 4(f) resources definitions (presented in Chapter 7, Final Section 4(f)/Section 6(f) Evaluation). 287As required by FHWA and RIDOT, the vehicular traffic noise analysis was performed for the loudest hour ofthe day which corresponded to the night-time (PM) peak hour for roadway traffic. Loudest-hour vehiculartraffic-noise levels were computed for the Baseline Condition, the No-Action Alternative, and Alternatives B2and B4 in the future forecast years of 2015, 2020 and 2025. It was assumed that the proposed roadwayimprovements would be constructed by 2020 for Alternative B2, and by the end of 2015 for Alternative B4, andthat any reasonable and feasible noise barriers would be constructed at the same time as the realigned orrelocated roadways. Per FHWA, noise impact occurs when the predicted design-year Build Alternative noiselevels in the project area "approach or exceed" the noise abatement criteria (NAC) during the loudest hour of theday. Noise-sensitive land uses potentially affected by the project are in Category B and consist of residential285 Environmental Criteria and Standards of the U.S. Department of Housing and Urban Development, 24 CFR Part 51; 44 Federal Register 40861,Washington DC, July 12, 1979.286 An average from U.S. Census data for 2004 in the Project Area.287 Section 4(f) of the U.S. Department of Transportation Act of 1966, codified at 49 U.S.C. section 303.Chapter 5 - Environmental Consequences 5-16 July 2011\\mawatr\ev\09228.00\reports\<strong>FEIS</strong>_Final_July_2011\<strong>PVD</strong>_CH05_Environmental_Cons_JUL_2011.doc
T.F. <strong>Green</strong> <strong>Airport</strong> <strong>Improvement</strong> <strong>Program</strong>Environmental Impact Statement and Final Section 4(f) Evaluationareas where outdoor activity occurs. The applicable NAC for exterior activities in Category B is 67 dBA L eq(h)(refer to Table A.4-2 of the DEIS Noise Supporting Attachment A.4, Vehicular Traffic Noise Technical Report).RIDOT defines the word "approach" to mean when the loudest-hour L eqequals 1 dB less than the NAC.Therefore, noise impact occurs when future build noise levels equal or exceed 66 dBA L eq, for ActivityCategory B. RIDOT analysis is consistent with FHWA protocol for conducting vehicular traffic noise impactassessments.Vehicular traffic-related noise impact also occurs when predicted design year noise levels substantially exceedbaseline noise levels. RIDOT uses a sliding scale that is based on baseline noise levels to define a “substantial”increase. Because noise barriers generally provide noise reductions of between 5 and 10 dB, they are not usuallyconsidered effective in quieter areas. A substantial increase as defined by RIDOT policy for the land uses affected bythis project is equal to or greater than 10 dB or more. For Category B land uses, wherever the predicted design-yearbuild alternative noise levels during the loudest hour of the day either (1) equal or exceed 66 dBA L eq, or (2) cause asubstantial increase over baseline noise levels, then consideration of vehicular traffic noise abatement measures isnecessary. Noise abatement will be considered reasonable and feasible unless it is found that such mitigationmeasures will cause adverse social, economic, or environmental effects that outweigh the benefits received.5.3.4 Impact AssessmentThis section presents the results of the noise impact assessment for the No-Action Alternative andAlternatives B2 and B4 in 2015, 2020, and 2025. Appendix F, Noise, provides further details, where noted.5.3.4.1 No-Action AlternativeThis section presents the results of the noise analysis for the No-Action Alternative in 2015, 2020, and 2025 tocompare to Alternatives B2 and B4 in order to assess potential project-related impacts.Population and Housing Impacts (Aircraft Noise Exposure) – 2015, 2020, and 2025Figure 5-7 depicts a comparison of the aircraft noise-exposure contours for the No-Action Alternative in 2015, 2020,and 2025. Table 5-8 summarizes the housing units that would be exposed to aircraft noise levels of 60 dB or moreunder the No-Action Alternative in 2015, 2020, and 2025. Table 5-9 summarizes the population that would beexposed to aircraft noise levels of 60 dB or more under the No-Action Alternative in 2015, 2020, and 2025.In 2015, under the No-Action Alternative, there would be an estimated 850 housing units (with an estimated 1,998people) located in areas within the contour encompassing DNL 65 dB and above. No people and no housing unitswould be exposed to aircraft noise levels between DNL 70 and 75 dB under the No-Action Alternative in 2015,2020, or 2025. These numbers exclude the number of people that would be relocated and the number of housingunits assumed to be acquired by 2015 under the Completed and Current Part 150 VLAPs (RIAC’s ongoing Part 150NCP). The residential areas included in these VLAP areas are shown on Figure 5-8. The population exposed tonoise levels of DNL 65 dB or above is projected to increase to 1,290 housing units (with an estimated 2,472 people)and 1,414 housing units (with an estimated 3,323 people) in 2020 and 2025, respectively, due to the increase in thenumber of aircraft operations over time unrelated to the <strong>Improvement</strong> <strong>Program</strong>.Chapter 5 - Environmental Consequences 5-17 July 2011\\mawatr\ev\09228.00\reports\<strong>FEIS</strong>_Final_July_2011\<strong>PVD</strong>_CH05_Environmental_Cons_JUL_2011.doc
T.F. <strong>Green</strong> <strong>Airport</strong> <strong>Improvement</strong> <strong>Program</strong>Environmental Impact Statement and Final Section 4(f) EvaluationTable 5-8No-Action Alternative: 2015, 2020, 2025 Aircraft Noise-Exposed Housing UnitsCityWarwickCranstonHousing Units by DNL value 1 Housing Units by DNL value 1 Housing Units by DNL value 12015 2020TotalAboveDNL65 dB>75 dB70 to75 dB65 to70 dB0 0 850 850 3,9890 0 0 0 060 to65 dB >75 dB70 to75 dB65 to70 dBTotalAboveDNL65 dB60 to65 dB0 0 1,290 1,290 4,5930 0 0 0 1142025>75 dB70 to75 dB65 to70 dBTotalAboveDNL65 dB60 to65 dB0 3 1,411 1,414 4,6980 0 0 0 143Total 0 0 850 850 3,989 0 0 1,290 1,290 4,707 0 3 1,411 1,414 4,841Source: HMMH, 2009.1 Excludes 280 housing units acquired under the Completed Part 150 VLAP and 135 units to be acquired under the Current Part 150 VLAP for a total of415 acquired housing units (to be completed by 2015).Table 5-9No-Action Alternative: 2015, 2020, 2025 Aircraft Noise-Exposed PopulationPopulation by DNL2015Population by DNL2020Population by DNL value 1202570 to 65 toTotalAboveDNL 60 to70 to 65 toTotalAboveDNL 60 to70 to 65 toTotalAboveDNL 60 toCity >75 dB 75 dB 70 dB 65 dB 65 dB >75 dB 75 dB 70 dB 65 dB 65 dB >75 dB 75 dB 70 dB 65 dB 65 dBWarwick 0 0 1,998 1,998 9,374 0 0 2,472 2,472 9,988 0 7 3,316 3,323 11,040Cranston 0 0 0 0 0 0 0 0 0 78 0 0 0 0 336Total 0 0 1,998 1,998 9,374 0 0 2,472 2,472 10,065 0 7 3,316 3,323 11,376Source: HMMH, 2011.Note: Some numbers may not add up due to rounding. Data is based on the 2000 Census. Although some 2010 census data was released in March 2011, a sufficientlevel of census data for the <strong>FEIS</strong> analysis was not released prior to the filing of the <strong>FEIS</strong>.1 Excludes 658 people who have been relocated under the Completed Part 150 VLAP and 317 people which would be relocated under the Current Part 150 VLAPrespectively for a total of 975 people relocated due to both programs (to be completed by 2015).No elderly subsidized housing development within the City of Warwick would be affected by noise levelsgreater than DNL 65 dB. The Charles Ford Terrace development, which is northeast of the <strong>Airport</strong> nearWarwick Avenue, would be exposed to noise levels close to DNL 65 dB (63.2 dB in 2015 to 64.2 dB by 2025) forthe No-Action Alternative in three modeled years (2015, 2020, and 2025). This facility is affected by flights fromRunway 5-23.The Environmental Desk Reference for <strong>Airport</strong> Actions indicates that the EIS must identify any non-residential noisesensitivesites within the DNL 60 dB noise contour in order to disclose any potential sites with a 3.0 dB changein noise levels between DNL 60 and 65 dB. 288 Figure 5-9 shows the location of non-residential noise-sensitivelocations within the 2025 DNL 60 dB contour of all of the Alternatives. Table 5-10 presents a comparison ofpredicted noise levels at non-residential noise-sensitive locations for the No-Action Alternative and AlternativesB2 and B4 in 2015, 2020, and 2025. No non-residential noise-sensitive locations would have a change of 3 dB innoise levels between DNL 60 and 65 dB for either Alternative B2 or B4.288 Environmental Desk Reference for <strong>Airport</strong> Actions, FAA, October 5, 2007, Chapter 17, section 8.b(2).Chapter 5 - Environmental Consequences 5-18 July 2011\\mawatr\ev\09228.00\reports\<strong>FEIS</strong>_Final_July_2011\<strong>PVD</strong>_CH05_Environmental_Cons_JUL_2011.doc
T.F. <strong>Green</strong> <strong>Airport</strong> <strong>Improvement</strong> <strong>Program</strong>Environmental Impact Statement and Final Section 4(f) EvaluationTable 5-10No-Action Alternative and Alternatives B2 and B4: Comparison of Computed DNL atNon-Residential Noise-Sensitive Sites within the DNL 60 dB Noise ContourComputed DNL (dB)201520202025B2 B4 No-Action B2 B4 No-Action B2Site 1 Name No-ActionB4Places of WorshipPW002 Saint Barnabas Episcopal Church59.9 59.9 60.1 59.7 59.7 60.0 60.3 60.3 60.6PW003 St. Catherine Church59.8 59.8 60.0 59.6 59.6 59.9 60.2 60.2 60.5PW004 Warwick Central Baptist59.6 59.6 59.9 59.4 59.4 59.7 60.0 60.0 60.3PW010 <strong>Green</strong>wood Community Church58.9 58.9 59.5 59.5 59.7 60.0 60.2 60.4 60.7PW012 St. Timothy's Mission Center58.3 58.3 58.5 58.8 59.3 59.0 59.5 60.0 59.6PW017 Jehovah's Witnesses of Warwick65.6 65.6 67.2 66.0 67.0 67.6 66.5 67.5 68.0PW020 Spring <strong>Green</strong> Memorial Baptist60.0 60.0 59.9 60.6 60.2 60.1 61.2 60.7 60.5PW029 Lakewood Baptist59.1 59.1 59.6 59.5 60.1 60.0 60.1 60.6 60.5PW033 Creating Women Ministries 262.9 62.9 62.1 63.4 63.9 62.7 64.1 64.5 63.3PW034 New Hope Worship Center 365.5 65.7 - 3 66.0 66.3 - 3 66.5 66.8 - 3PW039 Baha’i Faith 264.3 64.3 65.9 64.7 65.1 66.3 65.3 65.7 66.9PW042 Apponaug Pentecostal60.6 60.6 60.8 60.5 60.5 60.8 61.1 61.0 61.3PW043 Temple AM David61.8 61.8 61.5 62.5 62.1 61.8 63.1 62.7 62.3SchoolsSCH105 Happy Hollow Nursery59.0 59.0 59.6 59.5 60.3 60.1 60.1 60.8 60.6SCH498 Randall Holden58.7 58.7 58.5 59.2 59.7 59.1 59.9 60.3 59.7SCH512 Apponaug Christian59.8 59.8 60.1 59.6 59.6 59.9 60.3 60.2 60.5SCH517 Holliman School 260.2 60.2 59.9 60.1 60.0 59.8 60.7 60.5 60.4SCH518 Pilgrim High School 262.6 62.6 62.6 62.8 62.9 62.8 63.4 63.4 63.3SCH519 Francis School 259.1 59.1 59.2 59.4 59.5 59.5 60.0 60.0 60.0SCH523 St Rose of Lima 262.3 62.3 63.2 62.7 63.6 63.6 63.4 64.2 64.3SCH524 John Wickes School 262.3 62.3 64.0 62.8 63.7 64.4 63.5 64.3 65.0SCH526 E G Robertson School 259.2 59.2 59.7 59.6 59.7 60.1 60.1 60.2 60.5SCH531 NE Institute of Tech61.1 61.1 61.5 61.7 61.9 62.0 62.5 62.6 62.8SCH542 Building Blocks Center59.6 59.6 59.9 59.5 59.5 59.8 60.1 60.1 60.3SCH547 Westbay Community Action62.4 62.4 62.2 63.0 62.7 62.4 63.7 63.2 62.9SCH552 Magic Years Child61.3 61.3 61.7 61.4 61.4 61.8 62.1 62.0 62.4SCH677 Precious Years Day Care61.2 61.2 61.4 61.8 62.0 62.0 62.5 62.7 62.7LibrariesLIB039 Warwick Public Library Apponaug Branch 59.9 59.9 60.2 59.8 59.8 60.0 60.4 60.4 60.6LIB082 New England Institute of Technology61.0 61.0 61.4 61.6 61.8 62.0 62.4 62.5 62.7Source: HMMH, 2011.Notes: All facilities are located in the City of Warwick. Bold indicates significant increase in noise level (increase of at least DNL 1.5 dB at or above DNL 65 dB). Shadedvalues indicate that the site is newly exposed to a noise level of DNL 65 dB and above, which exceeds FAA guidelines for land use compatibility.1 See Figure 5-9 for locations.2 Sites within DNL 60 dB that have already been sound insulated. Schools have been sound insulated as part of a previous sound insulation effort under the Part 150 NCP.3 Site falls within area acquired through airport construction.PWSCHLIBPlaces of Worship.Public and Private Schools, Educational Institutions, or Day Care Facilities.Libraries.Chapter 5 - Environmental Consequences 5-19 July 2011\\mawatr\ev\09228.00\reports\<strong>FEIS</strong>_Final_July_2011\<strong>PVD</strong>_CH05_Environmental_Cons_JUL_2011.doc
T.F. <strong>Green</strong> <strong>Airport</strong> <strong>Improvement</strong> <strong>Program</strong>Environmental Impact Statement and Final Section 4(f) EvaluationAircraft Ground Noise (Integrated Cargo Facility Operations) – 2015, 2020, and 2025Under the No-Action Alternative, noise from cargo activities is not expected to result in significant impacts to nearbyneighborhoods or other noise-sensitive receptors. Overall the cargo noise levels decreased by approximately 1 dB dueto the decrease in operations from the revised No-Action Alternative <strong>FEIS</strong> forecast. A detailed discussion of thecumulative noise exposure (DNL) analysis and single-event (L max) analysis are provided in Appendix F, Noise.Vehicular Traffic Noise (Off-<strong>Airport</strong> Roadway <strong>Improvement</strong>s) – 2015, 2020, and 2025The No-Action Alternative involves only periodic maintenance and minor improvements needed to maintainsafe operations at T.F. <strong>Green</strong> <strong>Airport</strong>. There would be no changes to off-<strong>Airport</strong> roadways associated with theNo-Action Alternative. Noise-sensitive land uses within the vicinity of the Alternatives B2 and B4 roadwayimprovements likely to be impacted by vehicle traffic noise were evaluated under the No-Action Alternativeconditions (in 2015, 2020, and 2025) to compare to the future build conditions. Specifically, areas along PostRoad for Partially Relocated <strong>Airport</strong> Road (under both Alternatives B2 and B4) and along Main Avenue for theRealigned Main Avenue (under Alternative B4 only) are evaluated. The 2004 Baseline Condition vehicle trafficsound levels for these areas are also presented to serve as a baseline for comparison to future conditions.For Partially Relocated <strong>Airport</strong> Road, because the vehicular traffic noise analysis evaluates receptors only within500 feet of the proposed roadway changes, there are two different sets of No-Action Alternatives results in orderto directly compare to Alternatives B2 and B4. For the comparison to Alternative B2, where Partially Relocated<strong>Airport</strong> Road intersects Post Road at Tennessee Avenue is evaluated. For the comparison with Alternative B4,where Partially Relocated <strong>Airport</strong> Road intersects Post Road at Hasbrouck Avenue, is evaluated.Table 5-11 summarizes the computed vehicular traffic noise levels under the No-Action Alternative in 2015 orreceptors that would be within 500 feet of the roadway improvements for both Alternatives B2 and B4.Table 5-12 summarizes the computed 2020 and 2025 vehicular traffic noise levels under the No-ActionAlternative for receptors that would be within 500 feet of the Alternative B2 roadway improvements. Similarly,Table 5-13 summarizes the computed 2020 and 2025 No-Action Alternative vehicular traffic noise levels forreceptors that would be within 500 feet of the Alternative B4 roadway improvements.Under the No-Action Alternative, in 2015, projected traffic noise levels of areas likely to be impacted byAlternative B2 are expected be about the same as or slightly higher than traffic noise levels for the BaselineCondition. Under the 2015 No-Action Alternative, four homes located on the west side of Post Road would beimpacted by traffic noise (Table 5-11). In 2015, projected traffic noise levels with the No-Action Alternative forareas to be potentially impacted by Alternative B4 are expected be about the same as or slightly higher thantraffic noise levels compared to the Baseline Condition. Under the Baseline Condition, four housing units in thevicinity of <strong>Airport</strong> Road were exposed to traffic noise levels that approach or exceed the FHWA criteria fortraffic noise impact (Table 5-11). In 2015, the number of impacted homes near <strong>Airport</strong> Road would increase tofive under the No-Action Alternative. Under the Baseline Condition, 53 housing units in the vicinity of MainAvenue were exposed to traffic noise levels that approach or exceed the FHWA criteria for traffic noise impact.The same number of housing units would be exposed to traffic noise levels that approach or exceed the FHWAcriteria under the No-Action Alternative during that same timeframe. These residences would be affected eitherby traffic on Post Road and the west end of existing <strong>Airport</strong> Road in the vicinity of the Relocated <strong>Airport</strong> Roador by traffic on Main Avenue and Post Road in the vicinity of the Realigned Main Avenue.Chapter 5 - Environmental Consequences 5-20 July 2011\\mawatr\ev\09228.00\reports\<strong>FEIS</strong>_Final_July_2011\<strong>PVD</strong>_CH05_Environmental_Cons_JUL_2011.doc
T.F. <strong>Green</strong> <strong>Airport</strong> <strong>Improvement</strong> <strong>Program</strong>Environmental Impact Statement and Final Section 4(f) EvaluationTable 5-11No-Action Alternative: 1 2015 Summary of Vehicular Traffic NoiseTotal Number of HousingUnits Exposed to Levelsthat Approach orLoudest-hour Leq in dBA 2Exceed the FHWA NACIncreaseoverBaseline No-Action Baseline Baseline No-Action inRoadway Neighborhood 2004 in 2015 (dB) 2004 2015For Alternative B2 3East side of Post Road Tennessee Ave. to Route 37 47 - 62 47 - 62
T.F. <strong>Green</strong> <strong>Airport</strong> <strong>Improvement</strong> <strong>Program</strong>Environmental Impact Statement and Final Section 4(f) EvaluationTable 5-12No-Action Alternative: 2020 and 2025 Summary of Vehicular Traffic Noise for AreasPotentially Impacted by Alternative B2Total Number of HousingUnits Exposed to Levelsthat Approach or ExceedLoudest-hour Leq in dBA 1the FHWA NACIncreaseIncreaseover over No-Action inBaseline No-Action Baseline No-Action Baseline Baseline 2020Road Neighborhood 2004 in 2020 (dB) in 2025 (dB) 2004 and 2025East side of Post Rd Tennessee Ave to Route 37 3 41 - 62 42 - 63
T.F. <strong>Green</strong> <strong>Airport</strong> <strong>Improvement</strong> <strong>Program</strong>Environmental Impact Statement and Final Section 4(f) EvaluationTable 5-13No-Action Alternative: 2020 and 2025 Summary of Traffic Noise for Areas PotentiallyImpacted by Alternative B4Total Number of Housing UnitsExposed to Levels that ApproachLoudest-hour Leq in dBA 1or Exceed the FHWA NACIncreaseIncreaseoveroverBaseline No-Action Baseline No-Action Baseline Baseline No-Action No-ActionRoad Neighborhood 2004 in 2020 (dB) in 2025 (dB) 2004 in 2020 in 2025South side of Main Ave <strong>Green</strong>wood: Post to Gertrude 2 48 to 73 48 to 73 0 to 1 48 to 74 1 16 16 18North side of Main Ave <strong>Green</strong>wood: Post to Gertrude 2 49 to 73 49 to 74 0 to 1 49 to 74 0 to 1 13 13 13North side of Main Ave <strong>Green</strong>wood: Industrial to Inman 3 47 to 69 48 to 70 0 to 1 48 to 70 1 9 9 9South side of Main Ave <strong>Green</strong>wood: Gladys Ct to Buttonwoods 3 49 to 71 49 to 71 0 to 1 49 to 71 1 15 15 15South side of Main Ave <strong>Green</strong>wood: Graymore to Walnut Glen 3 43 to 52 43 to 52 0 to 1 43 to 53 1 0 0 0West side of Post Road Hillsgrove: Elkland to Pell 4 49 to 70 49 to 70 0 to 1 50 to 70 1 4 5 5East side of Post Road Lincoln Park: Tennessee Ave 4 50 to 56 51 to 56
T.F. <strong>Green</strong> <strong>Airport</strong> <strong>Improvement</strong> <strong>Program</strong>Environmental Impact Statement and Final Section 4(f) Evaluationis expected to dominate composite noise exposure at any receptors. In 2015, for the No-Action Alternative inareas potentially affected by Alternative B2, composite noise levels at seven locations exceed the FAA-definedresidential land use compatibility level of 65 dB. This number remains at seven locations in 2020 and increasesto nine locations in 2025 under the No-Action Alternative. In 2015, for the No-Action Alternative in areaspotentially affected by Alternative B4, composite noise levels at seven locations exceed the FAA-definedresidential land use compatibility level of 65 dB. This number increases to eight locations in 2020 and increasesto ten locations in 2025 under the No-Action Alternative.5.3.4.2 Alternative B2This section presents the results of the noise analysis for Alternative B2 in 2015, 2020, and 2025 and comparesthe results to the No-Action Alternative. Figures 5-3 and 5-4 show the modeled flight tracks for Alternative B2.Population and Housing Impacts (Aircraft Noise Exposure) – 2015The runway use and number of operations would not change for Alternative B2 in 2015 compared to theNo-Action Alternative; however, the runway thresholds would change under Alternative B2 compared to theNo-Action Alternative due to the runway safety area enhancements to Runway 16-34. These changes in turnwould result in changes to the shape of the noise contours and the number of housing units affected. Figure 5-10shows the noise contours associated with Alternative B2 in 2015. Table 5-14 summarizes the housing units thatwould be exposed to aircraft noise levels of DNL 60 dB or more under Alternative B2 in 2015.Table 5-14Alternative B2: 2015 Aircraft Noise-Exposed Housing UnitsHousing Units by DNL value, Housing Units by DNL value, Net Housing Unit Change BetweenNo-Action Alternative 1 Alternative B2 1,2 No-Action Alternative and Alternative B2Total Total TotalAbove Above Above70 to 65 to DNL 60 to 70 to 65 to DNL 60 to 70 to 65 to DNL 60 toCity >75 dB 75 dB 70 dB 65 dB 65 dB >75 dB 75 dB 70 dB 65 dB 65 dB >75 dB 75 dB 70 dB 65 dB 65 dBWarwick 0 0 850 850 3,989 0 0 853 853 3,976 0 0 3 3 -13Cranston 0 0 0 0 0 0 0 0 0 0 0 0 0 0 0Total 0 0 850 850 3,989 0 0 853 853 3,976 0 0 3 3 -13SignificantNoiseIncrease -- -- -- -- - 0 0 0 0 - 0 0 0 0 -Source: HMMH, 2011.Note: May include homes already sound insulated.1 Excludes 280 units have been purchased under the Completed Part 150 VLAP and 135 units assumed to be purchased by 2015 under the Current Part 150VLAP for a total of 415 acquired housing units.2 Excludes one unit acquired due to the Runway 16-34 RSA enhancement.Table 5-15 summarizes the population that would be exposed to aircraft noise levels of DNL 60 dB or moreunder Alternative B2 in 2015.Chapter 5 - Environmental Consequences 5-24 July 2011\\mawatr\ev\09228.00\reports\<strong>FEIS</strong>_Final_July_2011\<strong>PVD</strong>_CH05_Environmental_Cons_JUL_2011.doc
T.F. <strong>Green</strong> <strong>Airport</strong> <strong>Improvement</strong> <strong>Program</strong>Environmental Impact Statement and Final Section 4(f) EvaluationTable 5-15Alternative B2: 2015 Aircraft Noise-Exposed PopulationPopulation by DNL value,No-Action Alternative 1Population by DNL value,Alternative B2 1,2Net Population Change BetweenNo-Action Alternative and Alternative B2Total Total TotalAbove Above Above70 to 65 to DNL 60 to 70 to 65 to DNL 60 to 70 to 65 to DNL 60 toCity >75 dB 75 dB 70 dB 65 dB 65 dB >75 dB 75 dB 70 dB 65 dB 65 dB >75 dB 75 dB 70 dB 65 dB 65 dBWarwick 0 0 1,998 1,998 9,374 0 0 2,005 2,005 9,344 0 0 7 7 -30Cranston 0 0 0 0 0 0 0 0 0 0 0 0 0 0 0Total 0 0 1,998 1,998 9,374 0 0 2,005 2,005 9,344 0 0 7 7 -30SignificantNoiseIncrease - - - - - 0 0 0 0 - 0 0 0 0 -Source: HMMH, 2011.Note: Some numbers may not add up due to rounding.1 Excludes 658 people who have been relocated under the Completed Part 150 VLAP and 317 people which would be relocated by 2015 under the Current Part 150 VLAP for a total of 975 people.2 Excludes two people relocated due to the Runway 16-34 RSA enhancement.In 2015, Alternative B2 would expose three additional housing units and seven more people to noise levelsgreater than DNL 65 dB compared to the No-Action Alternative. No subsidized housing developments wouldbe exposed to noise levels greater than DNL 65 dB for Alternative B2 in 2015; in addition no subsidized housingunits would be newly exposed and none would be exposed to a significant noise increase.Significant Aircraft Noise Impacts – 2015: There are no significant noise impacts for any residential areas ornon-residential noise-sensitive sites for Alternative B2 in 2015, as shown in Tables 5-14 and 5-15, and Table 5-10,respectively.Aircraft Ground Noise (Integrated Cargo Facility Operations) - 2015There are no differences in the aircraft ground noise levels predicted at the <strong>Airport</strong> between the No-ActionAlternative and Alternative B2 in 2015, as no changes would be made to the Integrated Cargo Facility until after 2015.Vehicular Traffic Noise Impacts – 2015In 2015, the off-<strong>Airport</strong> roadway improvements under Alternative B2 consist of Partially Relocated <strong>Airport</strong> Road. Thewestern end of Partially Relocated <strong>Airport</strong> Road would terminate at a new intersection with Post Road in the vicinityof Tennessee Avenue. From Post Road, the roadway would extend to the southeast, bisecting the rental car facility,and tie into the existing <strong>Airport</strong> Road in the vicinity of Evergreen Avenue. Table 5-16 provides a summary ofprojected traffic noise levels and noise impact in the neighborhoods affected by Partially Relocated <strong>Airport</strong> Road.These neighborhoods are generally located at the west end of <strong>Airport</strong> Road along Post Road.As shown in Table 5-16, in 2015, Partially Relocated <strong>Airport</strong> Road would impact seven more dwelling units thanthe No-Action Alternative along the west side of Post Road between Kentucky and Delaware Avenues.However, along the west side of Post Road from Haverford to Pell Avenue, the number of housing unitsexposed to traffic noise levels that approach or exceed the relevant FHWA NAC for Activity Category B wouldremain the same. On the east side of Post Road, one housing unit located between existing Lincoln and AlabamaAvenues would be impacted in 2015, but would be acquired by 2020 as a result of Fully Relocated <strong>Airport</strong> Road.Chapter 5 - Environmental Consequences 5-25 July 2011\\mawatr\ev\09228.00\reports\<strong>FEIS</strong>_Final_July_2011\<strong>PVD</strong>_CH05_Environmental_Cons_JUL_2011.doc
T.F. <strong>Green</strong> <strong>Airport</strong> <strong>Improvement</strong> <strong>Program</strong>Environmental Impact Statement and Final Section 4(f) EvaluationTable 5-16Alternative B2: 2015 Summary of Traffic Noise Impacts by NeighborhoodRoadwayNeighborhoodBaseline2004Loudest-hour Leq in dBANo-Action2015Alt.B22015ChangeRelative toBaseline (dB)Total Number of Housing Units 1Exposed to Noise ImpactBaseline2004 2 No-Action2015East side of Post Road Tennessee Ave. to Route 37 47 to 62 47 to 62 49 to 65 0 to 4 0 0 1 3West side of Post Road Kentucky to Delaware Ave. 52 to 66 53 to 66 57 to 68 2 to 11 2 2 9West side of Post Road Haverford to Pell Ave. 44 to 67 44 to 67 50 to 67 -2 to 8 2 2 2Total - - - - 4 4 12Source: HMMH, 2009.1 These numbers of housing units take into account the property acquisitions that are required for the roadway improvements.2 For baseline conditions, the number of housing units exposed to “impact” represents those residences for which baseline traffic noise levels approach or exceed the FHWA NAC for Activity Category B for the loudest hour of the day. For Partially Relocated <strong>Airport</strong> Road, the number of impacted dwelling units is due to bothtraffic noise levels that approach or exceed the relevant FHWA NAC and that cause a substantial increase over baseline noise levels.3 The only traffic noise impact on the east side of Post Road is located between existing Lincoln and Alabama Avenues. In 2020, under Alternative B2, this propertywould be acquired as a result of Fully Relocated <strong>Airport</strong> Road.4 See Figure A.4-19 in DEIS Noise Supporting Attachment A.11, Supporting Report Graphics.Alt. B22015Composite Noise Impacts – 2015In 2015, aircraft operations are expected to dominate the noise environment in the vicinity of the <strong>Airport</strong> underAlternative B2 and none of the measurement sites would experience a significant noise increase (increase of at leastDNL 1.5 dB at or above DNL 65 dB) from composite noise levels. No locations are dominated by traffic noise or cargonoise. In the No-Action Alternative, composite noise levels at seven locations would exceed the FAA-defined residentialland use compatibility level of DNL 65 dB. This number remains at seven locations with Alternative B2 in 2015. Refer toTable F.3-3 in Appendix F.3, Composite Noise, presents summaries of composite noise exposure (DNL) at certainlocations from all three sources of project-related noise. The locations of the prediction sites are shown in Figure 4-2.Population and Housing Impacts (Aircraft Noise Exposure) – 2020 and 2025Figure 5-11 shows the noise contours associated with Alternative B2 in 2020 and 2025. Table 5-17 summarizes thehousing units that would be exposed to aircraft noise levels of 60 dB or more under Alternative B2 in 2020 and 2025.In 2020, Alternative B2 would expose two fewer housing units (an estimated five fewer people) to noise levels greaterthan DNL 65 dB compared to the No-Action Alternative. In 2025, Alternative B2 would expose 64 fewer housingunits (an estimated 150 fewer people) to noise levels greater than DNL 65 dB compared to the No-Action Alternative.This reduction is primarily attributable to homes assumed to be voluntarily acquired to clear the RPZ at theRunway 23 End and not to a reduction in noise levels. No subsidized housing developments will be exposed to noiselevels greater than DNL 65 dB for Alternative B2 in 2020 and 2025 (Table 5-17).In 2020 under Alternative B2, 15 housing units would be exposed to noise levels at or above DNL 70 dB. Theseunits would be eligible for participation in a VLAP for noise mitigation, and would be in addition to the unitsthat would already be acquired under the Current Part 150 VLAP (assumed to be acquired by 2015). For thepurposes of this <strong>FEIS</strong>, these units are assumed to be acquired between 2020 and 2025; however, it is RIAC’sintention to begin to acquire residential parcels as soon as 2012, subject to availability of funding. In 2025, anadditional 23 housing units would be newly exposed to DNL 70 dB and above due to Alternative B2. FutureBuild noise mitigation for noise impacts in 2025 would be determined based on revised noise contours andactual aircraft operations and would be implemented according to Part 150 guidelines.Chapter 5 - Environmental Consequences 5-26 July 2011\\mawatr\ev\09228.00\reports\<strong>FEIS</strong>_Final_July_2011\<strong>PVD</strong>_CH05_Environmental_Cons_JUL_2011.doc
T.F. <strong>Green</strong> <strong>Airport</strong> <strong>Improvement</strong> <strong>Program</strong>Environmental Impact Statement and Final Section 4(f) EvaluationTable 5-17Alternative B2: 2020 and 2025 Aircraft Noise-Exposed Housing UnitsHousing Units by DNL value,No-Action Alternative 12020TotalAboveDNL65 dBHousing Units by DNL value,Alternative B2 2,3,4202070 to 65 to60 to70 to 65 to60 to70 to 65 to60 toCity >75 dB 75 dB 70 dB65 dB >75 dB 75 dB 70 dB65 dB >75 dB 75 dB 70 dB65 dBWarwick 0 0 1,052 1,052 4,250 0 15 1,035 1,050 4,437 0 15 -17 -2 187Cranston 0 0 0 0 33 0 0 0 0 164 0 0 0 0 131Total 0 0 1,052 1,052 4,283 0 15 1,035 1,050 4,601 0 15 -17 -2 318TotalAboveDNL65 dBNet Housing Unit ChangeNo-Action Alternative and Alternative B2 2,3,42020SignificantNoiseIncrease 4 - - - - - 0 3 71 74 - 0 3 71 74 -Housing Units by DNL value,No-Action Alternative 12025TotalAboveDNL65 dBHousing Units by DNL value,Alternative B2 2,3,42025TotalAboveDNL65 dBTotalAboveDNL65 dBNet Housing Unit Change,No-Action Alternative and Alternative B2 2,3,42025TotalAbove>75 dB70 to75 dB65 to70 dBDNL65 dB60 to65 dB0 23 -87 -64 740 0 0 0 11070 to 65 to60 to70 to 65 to60 toCity >75 dB 75 dB 70 dB65 dB >75 dB 75 dB 70 dB65 dBWarwick 0 3 1,411 1,414 4,698 0 26 1,324 1,350 4,772Cranston 0 0 0 0 143 0 0 0 0 253Total0 3 1,411 1,414 4,841 0 26 1,324 1,350 5,025 0 23 -87 -64 184Increase 4 - - - - - 0 10 39 49 - 0 10 39 49 -SignificantNoiseSource: HMMH, 2011.1 Excludes 280 units which have been purchased under the Completed Part 150 VLAP and 135 units assumed to be purchased by 2015 under the Current Part150 VLAP for a total of 415 acquired housing units.2 All Alternative B2 counts exclude housing units acquired to due non-noise related land acquisition, including 67 housing units (including 40 units outside of the60dB contour in 2020 and five units outside the 60dB contour in 2025) that would be acquired due to construction by 2020, and 134 housing units would beeligible for acquisition due to the newly created RPZ.3 For 2025, the 36 housing units eligible for land acquisition as noise mitigation due to noise impacts in 2020 have been excluded from the impacted unit count.4 Represents the number of housing units and non-residential noise-sensitive sites affected by significant noise levels during a specific year and are not cumulative.Table 5-18 summarizes the population that would be exposed to aircraft noise levels of 60 dB and above underAlternative B2 in 2020 and 2025.Significant Aircraft Noise Impacts – 2020 and 2025: Figure 5-12 shows the areas of significant noise impactassociated with Alternative B2 in 2020 and 2025. Under Alternative B2, in 2020, 74 housing units (Table 5-17)and an estimated 174 people (Table 5-18) within the DNL 65 dB and above noise contour are projected toexperience a significant increase in noise levels (increase of at least DNL 1.5 dB at or above DNL 65 dB) andnone would experience a slight to moderate increase (DNL 3.0 dB or more between DNL 60 dB and 65 dB noiselevels). In 2025, 49 housing units (Table 5-17) and an estimated 115 people (Table 5-18) within the DNL 65 dBand above noise contour are projected to experience a significant increase in noise levels and none wouldexperience a slight to moderate increase under Alternative B2. Those housing units exposed to significant noiselevels would be eligible for sound insulation mitigation. Alternative B2 would not result in significant noiseincreases at any non-residential noise-sensitive sites.Chapter 5 - Environmental Consequences 5-27 July 2011\\mawatr\ev\09228.00\reports\<strong>FEIS</strong>_Final_July_2011\<strong>PVD</strong>_CH05_Environmental_Cons_JUL_2011.doc
T.F. <strong>Green</strong> <strong>Airport</strong> <strong>Improvement</strong> <strong>Program</strong>Environmental Impact Statement and Final Section 4(f) EvaluationTable 5-18Alternative B2: 2020 and 2025 Aircraft Noise-Exposed PopulationPopulation by DNL value,No-Action Alternative 12020TotalAboveDNL65 dBPopulation by DNL value,Alternative B2 2,32020TotalAboveDNL65 dBNet Population ChangeNo-Action Alternative andAlternative B2 2,32020TotalAboveDNL65 dB70 to 65 to60 to70 to 65 to60 to70 to 65 to60 toCity >75 dB 75 dB 70 dB65 dB >75 dB 75 dB 70 dB 65 dB >75 dB 75 dB 70 dB65 dBWarwick 0 0 2,472 2,472 9,988 0 35 2,432 2,468 10,427 0 35 -40 -4 439Cranston 0 0 0 0 78 0 0 0 0 385 0 0 0 0 307Total 0 0 2,472 2,472 10,065 0 35 2,432 2,468 10,812 0 35 -40 -4 746SignificantNoiseIncrease 4 - - - - - 0 7 167 174 - 0 7 167 174 -2025 2025 2025TotalTotalAboveAboveDNL 60 to70 to 65 to DNL 60 to70 to 65 to65 dB 65 dB >75 dB 75 dB 70 dB 65 dB 65 dB >75 dB 75 dB 70 dBCity >75 dB70 to75 dB65 to70 dBWarwick 0 7 3,316 3,323 11,040Cranston 0 0 0 0 336Total 0 7 3,316 3,323 11,376Increase 4 - - 2 - -SignificantNoiseSource: HMMH, 2011.Note: Some numbers may not add up due to rounding.0 61 3,111 3,173 11,2140 0 0 0 5950 61 3,111 3,173 11,8090 24 92 115 -TotalAboveDNL65 dB0 54 -205 -1500 0 0 00 54 -205 -1500 24 92 11560 to65 dB1742594331 Excludes 658 people who have been relocated under the Completed Part 150 VLAP and 317 people which would be relocated under the Current Part 150 VLAPfor a total of 975 people relocated due to both programs (to be completed by 2015).2 All Alternative B2 counts have excluded people relocated due to non-noise related land acquisition, including 157 people that would be relocated due toconstruction acquisitions by 2015 and 315 people would be eligible for relocation due to the newly created RPZ.3 For 2025, the 85 people that would be relocated due to land acquisition as noise mitigation for noise impacts in 2020 have been excluded from the impactedpopulation count.4 Represents the number of housing units and non-residential noise-sensitive sites affected by significant noise levels during a specific year and are not cumulative.Aircraft Ground Noise (Integrated Cargo Facility Operations) – 2020 and 2025The cargo noise analysis results indicate there would be no off-<strong>Airport</strong> noise impact due to cargo noise. Detailsare provided in Appendix F, Noise.-Vehicular Traffic Noise Impacts – 2020 and 2025Tables 5-19 and 5-20 summarize the computed vehicular traffic noise levels in 2020 and 2025, respectively in theneighborhoods that would be affected by vehicular traffic noise primarily due to the proposed full relocation of<strong>Airport</strong> Road from Warwick Avenue through the Spring <strong>Green</strong> neighborhood with a connection to Route 37.Chapter 5 - Environmental Consequences 5-28 July 2011\\mawatr\ev\09228.00\reports\<strong>FEIS</strong>_Final_July_2011\<strong>PVD</strong>_CH05_Environmental_Cons_JUL_2011.doc
T.F. <strong>Green</strong> <strong>Airport</strong> <strong>Improvement</strong> <strong>Program</strong>Environmental Impact Statement and Final Section 4(f) EvaluationTable 5-19Alternative B2: 2020 Summary of Traffic Noise Impacts by NeighborhoodTotal Number of HousingUnits 1 Exposed toLoudest-hour Leq in dBANoise ImpactBaseline No-Action Alt. B2ChangeRelative to Baseline No-Action Alt. B2Roadway Neighborhood 2004 2020 2020 Baseline (dB) 2004 2 2020 2 2020East side of Post Rd Tennessee Ave to Route 37 3 41 to 62 42 to 63 48 to 68 -3 to 17 0 0 7West side of Post Rd Kentucky to Delaware Ave 3 52 to 66 53 to 66 54 to 68 0 to 3 2 2 5West side of Post Rd Norwood 3 57 to 62 58 to 62 57 to 65 -1 to 3 0 0 0North side of FullyRelocated <strong>Airport</strong> RdSouth side of FullyRelocated <strong>Airport</strong> RdSpring <strong>Green</strong> (west of Harvest Rd to 46 to 70 2 47 to 70 2 51 to 73 -1 to >20 4 4 66Warwick Ave) 3,4East of Commerce Rd to Warwick Ave 3,4 41 to 51 42 to 52 56 to 76 5 to >20 0 0 28West side of Warwick Ave Hoxsie 4 53 to 60 54 to 61 49 to 58 -10 to 4 0 0 0East Side of Warwick Ave Squantum Dr to Manor Dr 4 49 to 64 49 to 64 49 to 66 0 to 5 0 0 2Total – - - - 6 6 108Source: HMMH, 2009.1 These numbers of housing units take into account the property acquisitions that are required for the roadway improvements and acquisitions for the newly created RPZ aswell as Current Part 150 VLAP and Future Build VLAPs.2 For baseline conditions and the No-Action Alternative, the number of housing units exposed to “impact” represents those residences for which baseline traffic noise levelsapproach or exceed the FHWA NAC for Activity Category B for the loudest hour of the day. For the Alternative B2 cases, the number of impacted housing units is due toboth traffic noise levels that approach or exceed the relevant FHWA NAC and that cause a substantial increase over baseline levels.3 See Figure A.4-20 in DEIS Noise Supporting Attachment A.11, Supporting Report Graphics.4 See Figure A.4-21 in DEIS Noise Supporting Attachment A.11, Supporting Report Graphics.Table 5-20Alternative B2: 2025 Summary of Traffic Noise Impacts by NeighborhoodTotal Number of HousingUnits 1 Exposed toLoudest-hour Leq in dBANoise ImpactBaseline No-Action Alt. B2ChangeRelative to Baseline No-Action Alt. B2Roadway Neighborhood 2004 2025 2025 Baseline (dB) 2004 2 2025 2 2025East side of Post Rd Tennessee Ave to Route 37 3 41 to 62 42 to 63 52 to 68 1 to 17 0 0 15West side of Post Rd Kentucky to Delaware Ave 3 52 to 66 53 to 67 58 to 68 2 to 6 2 2 5West side of Post Rd Norwood 3 57 to 62 58 to 62 60 to 66 2 to 4 0 0 2North side of FullyRelocated <strong>Airport</strong> RdSouth side of FullyRelocated <strong>Airport</strong> RdSpring <strong>Green</strong> (west of Harvest Rd46 to 70 2 47 to 70 54 to 74 0 to >20 4 4 89to Warwick Ave) 3,4East of Commerce Rd to Warwick Ave 3,4 41 to 51 42 to 52 61 to 77 10 to >20 0 0 33West side of Warwick Ave Hoxsie 4 53 to 60 54 to 61 53 to 60 -7 to 6 0 0 0East Side of arwick Ave Squantum Dr to Manor Dr 4 49 to 64 49 to 64 55 to 67 0 to 7 0 0 3Total – - - - 6 6 147Source: HMMH, 2009.1 These numbers of housing units take into account the property acquisitions that are required for the roadway improvements and acquisitions for the newly created RPZ aswell as Current Part 150 VLAP and Future Build VLAPs.2 For baseline conditions and the No-Action Alternative, the number of housing units exposed to “impact” represents those residences for which baseline traffic noise levelsapproach or exceed the FHWA NAC for Activity Category B for the loudest hour of the day. For the Alternative B2 case, the number of impacted housing units is due toboth traffic noise levels that approach or exceed the relevant FHWA NAC and that cause a substantial increase over baseline levels.3 See Figure A.4-20 in DEIS Noise Supporting Attachment A.11, Supporting Report Graphics.4 See Figure A.4-21 in DEIS Noise Supporting Attachment A.11, Supporting Report Graphics.Chapter 5 - Environmental Consequences 5-29 July 2011\\mawatr\ev\09228.00\reports\<strong>FEIS</strong>_Final_July_2011\<strong>PVD</strong>_CH05_Environmental_Cons_JUL_2011.doc
T.F. <strong>Green</strong> <strong>Airport</strong> <strong>Improvement</strong> <strong>Program</strong>Environmental Impact Statement and Final Section 4(f) EvaluationDEIS Noise Supporting Attachment A.4, Vehicular Traffic Noise Technical Report provides a detailed assessmentof program-related traffic noise, including detailed tables of computed traffic noise levels for each alternative.Traffic DNLs in 2020 would range from 48 to 76 dB at affected residences throughout the Study Area withAlternative B2. In 2025, the highest traffic DNLs are expected to increase by less than 1 dB over 2020 levels dueto projected growth in area traffic volumes.Under Alternative B2, in addition to the No-Action Alternative, 102 more housing units would be exposed totraffic noise impact for a total of 108 housing units. Table 5-20 summarizes the computed traffic noise levels in2025 in the neighborhoods that would be affected by traffic noise due to the proposed roadway improvements.As shown in the table, Alternative B2 would expose 89 housing units along the north side of Fully Relocated<strong>Airport</strong> Road to traffic noise impact by 2025. Alternative B2 also would impact 15 housing units at the east endof Fully Relocated <strong>Airport</strong> Road, where the reconstructed Lincoln Avenue would tie into the eastbound lanes ofthe new road. Under Alternative B2 in 2025, an additional 141 housing units would be newly exposed to trafficnoise, for a total of 147 housing units.Composite Noise – 2020 and 2025The DNL values at the noise measurement sites (see Figure 4-2) indicate that aircraft flight operations as well asvehicular traffic noise associated with the full relocation of <strong>Airport</strong> Road would influence the noise environmentin the vicinity of the <strong>Airport</strong> for 2020 and 2025 under Alternative B2. A complete listing of the composite noiselevels can be found in Appendix F.3, Composite Noise.Significant Composite Noise Impacts: In 2020 and 2025, Sites C6, R4 and R6 would experience a significantnoise increase (increase of at least DNL 1.5 dB at or above DNL 65 dB). Significant noise impacts at Site C6 aredue to Fully Relocated <strong>Airport</strong> Road; Site R4 is partially due to the extension of Runway 23 End and partiallydue to the addition of the Integrated Cargo facility; and R6 significant noise impact is due to aircraft noise fromextending the Runway 5 End south toward Main Avenue. Sites R4 and R6 are already located within the area ofan increase of at least DNL 1.5 dB at or above DNL 65 dB aircraft flight noise levels. Homes in these areas wouldbe eligible for sound insulation.Site C6 is located between the DNL 60 and 65 dB noise contours and the significant increase in noise is due to theFully Relocated <strong>Airport</strong> Road. Mitigation in the form of a noise barrier or berm (Number 5 in DEIS Figure F.A 4-12of DEIS Noise Supporting Attachment A.4, Vehicular Traffic Noise Technical Report) is proposed to reduce noiselevels in this neighborhood under Alternative B2. Tables F.3-5 and F.3-6 in Appendix F.3, Composite Noise, present asummary of the composite noise exposure for Alternative B2 from all project-related sources of noise.5.3.4.3 Alternative B4This section presents the results of the noise analysis for Alternative B4 in 2015, 2020, and 2025. Figures 5-5 and5-6 show the modeled flight tracks for Alternative B4.Population and Housing Impacts (Aircraft Noise Exposure) – 2015Figure 5-13 shows the noise contours associated with Alternative B4 in 2015. Table 5-21 summarizes the housingunits that would be exposed to aircraft noise levels greater than DNL 60 dB.Chapter 5 - Environmental Consequences 5-30 July 2011\\mawatr\ev\09228.00\reports\<strong>FEIS</strong>_Final_July_2011\<strong>PVD</strong>_CH05_Environmental_Cons_JUL_2011.doc
T.F. <strong>Green</strong> <strong>Airport</strong> <strong>Improvement</strong> <strong>Program</strong>Environmental Impact Statement and Final Section 4(f) EvaluationIn 2015, Alternative B4 would expose 111 additional housing units (an estimated 260 additional people) than theNo-Action Alternative to noise levels greater than DNL 65 dB. No subsidized housing units will be exposed tonoise levels greater than DNL 65 dB for Alternative B4 in any of the analysis years.Two housing units would be exposed to noise levels DNL 70 dB and above in 2015. For the purposes of this <strong>FEIS</strong>analysis, it is assumed that these properties would be acquired for noise mitigation between 2015 and 2020; however,it is RIAC’s intention to begin to acquire residential parcels as soon as 2012, subject to availability of funding. Theseunits would be in addition to the units that would already be acquired under the Current Part 150 VLAP.Table 5-21 Alternative B4: 2015 Aircraft Noise-Exposed Housing Units 1Housing Units by DNL value, Housing Units by DNL value, Net Housing Unit ChangeNo-Action Alternative Alternative B4 2 No-Action Alternative and Alternative B4Total Total TotalAbove Above Above70 to 65 to DNL 60 to 70 to 65 to DNL 60 to 70 to 65 to DNL 60 toCity >75 dB 75 dB 70 dB 65 dB 65 dB >75 dB 75 dB 70 dB 65 dB 65 dB >75 dB 75 dB 70 dB 65 dB 65 dBWarwick 0 0 850 850 3,989 0 2 959 961 4,167 0 2 109 111 178Cranston 0 0 0 0 0 0 0 0 0 48 0 0 0 0 48Total 0 0 850 850 3,989 0 2 959 961 4,215 0 2 109 111 226SignificantNoiseIncrease 3 -- -- -- -- - 0 2 182 184 - 0 2 182 184 -Source: HMMH, 2011.1 Excludes 280 units previously purchased under the Current Part 150 VLAP and 135 units assumed to be purchased by 2015 under the Current Part 150 VLAP fora total of 415 units.2 All Alternative B4 counts exclude housing units acquired due to non-noise-related land acquisition, including 11 housing units that would be acquired due toconstruction acquisitions for 2015 and 60 housing units would be eligible for acquisition due to the newly created RPZ.3 Represents the number of housing units and non-residential noise-sensitive sites affected by significant noise levels during a specific year and are not cumulative.Table 5-22 summarizes the population that would be exposed to aircraft noise levels of 60 dB and above underAlternative B4 in 2015. In 2015, five people would be newly exposed to noise levels of DNL 70 dB and above,primarily due to the extended Runway 5-23 coming on line.Significant Aircraft Noise Impacts – 2015: In 2015, 184 housing units (Table 5-21) and an estimated 432 people(Table 5-22) and are projected to experience a significant increase in noise levels (increase of at least DNL 1.5 dBat or above DNL 65 dB) and none would experience a slight to moderate increase (DNL 3.0 dB or more betweenDNL 60 dB and 65 dB noise levels). Figure 5-14 shows areas of a significant increase in noise exposure whencomparing Alternative B4 to the No-Action Alternative in 2015. The area exposed to a significant noise impactwould be on either side of Main Avenue on the south side of the <strong>Airport</strong>. This is due to the start of aircrafttakeoff which would be much closer to the existing Main Avenue than under the No-Action Alternative. Thoseresidences exposed to significant noise levels would be eligible for sound insulation mitigation.Chapter 5 - Environmental Consequences 5-31 July 2011\\mawatr\ev\09228.00\reports\<strong>FEIS</strong>_Final_July_2011\<strong>PVD</strong>_CH05_Environmental_Cons_JUL_2011.doc
T.F. <strong>Green</strong> <strong>Airport</strong> <strong>Improvement</strong> <strong>Program</strong>Environmental Impact Statement and Final Section 4(f) EvaluationTable 5-22 Alternative B4: 2015 Aircraft Noise-Exposed Population 1Population by DNL value,No-Action AlternativePopulation by DNL value,Alternative B4 2Net Population ChangeNo-Action Alternative and Alternative B4Total Total TotalAbove Above Above70 to 65 to DNL 60 to 70 to 65 to DNL 60 to 70 to 75 65 to DNL 60 toCity >75 dB 75 dB 70 dB 65 dB 65 dB >75 dB 75 dB 70 dB 65 dB 65 dB >75 dB dB 70 dB 65 dB 65 dBWarwick 0 0 1,998 1,998 9,374 0 5 2,254 2,259 9,792 0 5 256 261 418Cranston 0 0 0 0 0 0 0 0 0 113 0 0 0 0 113Total 0 0 1,998 1,998 9,374 0 5 2,254 2,259 9,905 0 5 256 261 531SignificantNoiseIncrease 3 - - - - - 0 5 428 432 - 0 5 428 432 -Source: HMMH, 2011.Note: Some numbers may not add up due to rounding.1 Excludes 658 people who have been relocated under the Completed Part 150 VLAP and 317 people which would be relocated under the Current Part 150 VLAPfor a total of 975 people relocated due to both programs (assumed to be completed by 2015).2 All Alternative B4 counts exclude people relocated due to non-noise related land acquisition, including 26 people that would be relocated due to constructionacquisitions for 2015 and 141 people would be eligible for relocation due to the newly created RPZ.3 Represents the number of housing units and non-residential noise-sensitive sites affected by significant noise levels during a specific year and are not cumulative.In 2015, two non-residential noise-sensitive sites, the Jehovah’s Witnesses of Warwick (Site PW017) and Baha’iFaith (Site PW039), would be exposed to a significant noise impact that would make them eligible for soundinsulation; however, Baha’i Faith has been sound insulated as part of a previous sound insulation effort underthe Part 150 NCP. Figure 5-9 shows the location of non-residential noise-sensitive locations within the broadestlimit of the 2025 DNL 60 dB contour of all of the Alternatives.Aircraft Ground Noise (Integrated Cargo Facility Operations) - 2015There are no changes in the noise levels predicted at the <strong>Airport</strong> between the No-Action Alternative andAlternative B4 in 2015, as no changes would be made to the Integrated Cargo Facility until after 2015.Vehicular Traffic Noise Impacts – 2015The same number of housing units would be impacted by vehicular traffic noise for Alternative B4 in 2015 whencompared to the No-Action Alternative. Vehicular traffic noise impacts in the neighborhoods would result fromthe Partially Relocated <strong>Airport</strong> Road and Realigned Main Avenue under Alternative B4. Main Avenue would berealigned to the south almost to Stevens Avenue between Gorham and Palace Avenues andInman/Buttonwoods Avenues. In 2015, the off-<strong>Airport</strong> roadway improvements under Alternative B4 consist ofPartially Relocated <strong>Airport</strong> Road along an alignment using Hasbrouck Avenue. The western end of PartiallyRelocated <strong>Airport</strong> Road would terminate at a new intersection with Post Road. From Post Road, the roadwaywould extend east along Hasbrouck Avenue, then southeast, connecting with existing Hallene Road and thenexisting <strong>Airport</strong> Road between Evergreen and Commerce Avenues. The neighborhoods near Partially Relocated<strong>Airport</strong> Road are generally located along Post Road near the western end of the existing <strong>Airport</strong> Road.Table 5-23 summarizes projected exterior traffic noise levels and noise impact in the neighborhoods affected byPartially Relocated <strong>Airport</strong> Road and Realigned Main Avenue under Alternative B4. DEIS Noise SupportingAttachment A.4, Vehicular Traffic Noise Technical Report, provides a detailed assessment of program-relatedtraffic noise, including detailed tables of computed traffic noise levels for each alternative.Chapter 5 - Environmental Consequences 5-32 July 2011\\mawatr\ev\09228.00\reports\<strong>FEIS</strong>_Final_July_2011\<strong>PVD</strong>_CH05_Environmental_Cons_JUL_2011.doc
T.F. <strong>Green</strong> <strong>Airport</strong> <strong>Improvement</strong> <strong>Program</strong>Environmental Impact Statement and Final Section 4(f) EvaluationTable 5-23Alternative B4: 2015 Summary of Traffic Noise Impacts by NeighborhoodTotal Number of Housing Units 1Loudest-hour Leq in dBAExposed to Noise ImpactChangeRelative toBaseline No-Action Alt. B4 Baseline Baseline No-Action Alt. B4Roadway Neighborhood 2004 2015 2015 (dB) 2004 2 2015 2015South side of Main Ave <strong>Green</strong>wood: Post to Gertrude 3 48 to 73 48 to 73 51 to 73 0 to 7 16 16 15North side of Main Ave <strong>Green</strong>wood: Post to Gertrude 3 49 to 73 49 to 74 48 to 72 -9 to 1 13 13 10North side of Main Ave <strong>Green</strong>wood: Industrial to Inman 4 47 to 69 48 to 70 48 to 70 -5 to 1 9 9 3South side of Main Ave <strong>Green</strong>wood: Gladys Ct to Buttonwoods 4 49 to 71 49 to 71 54 to 71 -6 to 16 15 15 20South side of Main Ave <strong>Green</strong>wood: Graymore to Walnut Glen 4 43 to 52 43 to 52 49 to 70 6 to 18 0 0 5West side of Post Road Hillsgrove: Elkland to Pell 5 49 to 70 49 to 70 50 to 70 -3 to 2 4 5 5East side of Post Road Lincoln Park: Tennessee Ave. 5 50 to 56 51 to 56 51 to 59 1 to 3 0 0 0Total - - - - 57 58 58Source: HMMH, 2009.1 These numbers of housing units take into account the property acquisitions that are required for the roadway improvements and acquisitions for the newly createdRPZ as well as Future Build and Current Part 150 VLAP noise acquisitions.2 For baseline conditions, the number of housing units exposed to “impact” represents those residences for which baseline traffic noise levels approach or exceedthe FHWA NAC for Activity Category B for the loudest hour of the day. For Partially Relocated <strong>Airport</strong> Road, the number of impacted dwelling units is due to bothtraffic noise levels that approach or exceed the relevant FHWA NAC and that cause a substantial increase over baseline noise levels.3 See Figure A.4-23 in DEIS Noise Supporting Attachment A.11, Supporting Report Graphics.4 See Figure A.4-24 in DEIS Noise Supporting Attachment A.11, Supporting Report Graphics.5 See Figure A.4-22 in DEIS Noise Supporting Attachment A.11, Supporting Report Graphics.Composite Noise – 2015In 2015, the projected DNL values at the composite noise sites indicate that aircraft flight operations woulddominate the noise environment and none of the measurement sites would experience a significant noiseincrease (increase of at least DNL 1.5 dB at or above DNL 65 dB) from composite noise levels. Table F.3-4 inAppendix F.3, Composite Noise, presents a summary of the composite noise exposure (DNL) for Alternative B4 in2015 from all program-related sources of noise.Population and Housing Impacts (Aircraft Noise Exposure) – 2020 and 2025Figure 5-15 shows the noise contours associated with Alternative B4 in 2020 and 2025. Table 5-24 summarizesthe housing units that would be exposed to aircraft noise levels of 60 dB and above under Alternative B4 in 2020and 2025.In 2020, 20 housing units would be exposed to noise levels DNL 70 dB and above due to Alternative B4 and,therefore, these units would be eligible for voluntary participation in a land acquisition program for noisemitigation. For the purposes of this <strong>FEIS</strong> analysis, it is assumed that these properties would be acquired fornoise mitigation between 2020 and 2025; however, it is RIAC’s intention to begin to acquire residential parcelsas soon as 2012, subject to availability of funding. In 2025, an additional six housing units would be exposed toDNL 70 dB due to Alternative B4 and, therefore, eligible for voluntary participation in a land acquisition program.Future noise mitigation would be determined based on revised noise contours and actual aircraft operations in2025 (a future FAA-approved NEM) and would be implemented according to Part 150 guidelines.Chapter 5 - Environmental Consequences 5-33 July 2011\\mawatr\ev\09228.00\reports\<strong>FEIS</strong>_Final_July_2011\<strong>PVD</strong>_CH05_Environmental_Cons_JUL_2011.doc
T.F. <strong>Green</strong> <strong>Airport</strong> <strong>Improvement</strong> <strong>Program</strong>Environmental Impact Statement and Final Section 4(f) EvaluationTable 5-24Alternative B4: 2020 and 2025 Aircraft Noise-Exposed Housing UnitsHousing Units by DNL value,No-Action Alternative 1Housing Units by DNL value,Alternative B4 2,3Net Housing Unit Change,No-Action Alternativeand Alternative B4 2,32020 2020 2020Total Total TotalAbove Above Above70 to 65 to DNL 60 to 70 to 65 to DNL 60 to 70 to 65 to DNL 60 toCity >75 dB 75 dB 70 dB 65 dB 65 dB >75 dB 75 dB 70 dB 65 dB 65 dB >75 dB 75 dB 70 dB 65 dB 65 dBWarwick 0 0 1,052 1,052 4,250 0 20 1,120 1,140 4,390 0 20 68 88 140Cranston 0 0 0 0 33 0 0 0 0 128 0 0 0 0 95Total 0 0 1,052 1,052 4,283 0 20 1,120 1,140 4,518 0 20 68 88 235SignificantNoiseIncrease 5 - - - - - 0 20 154 174 - 0 20 154 174 -Housing Units by DNL value,No-Action Alternative 1Housing Units by DNL value,Alternative B4 2,3,4Net Housing Unit Change,No-Action Alternative and Alternative B4 2,3,42025 2025 2025Total Total TotalAbove Above Above70 to 65 to DNL 60 to 70 to 65 to DNL 60 to 70 to 65 to DNL 60 toCity >75 dB 75 dB 70 dB 65 dB 65 dB >75 dB 75 dB 70 dB 65 dB 65 dB >75 dB 75 dB 70 dB 65 dB 65 dBWarwick 0 3 1,411 1,4 4,698 0 6 1,400 1,406 4,766 0 3 -11 -8 68Cranston 0 0 0 0 143 0 0 0 0 225 0 0 0 0 82Total 0 3 1,411 1,4 4,841 0 6 1,400 1,406 4,991 0 3 -11 -8 150SignificantNoiseIncrease 5 - - - - - 0 1 107 108 - 0 1 107 108 -Source: HMMH, 2011.1 Excludes 280 units previously purchased under the Current Part 150 VLAP and 135 units assumed to be purchased by 2015 under the Current Part 150 VLAP fora total of 415 units.2 All Alternative B4 counts exclude housing units acquired to due non-noise related land acquisition, including 11 housing units that would be acquired due toconstruction acquisitions by 2015 and 60 housing units would be eligible for acquisition due to the newly created RPZ.3 For 2020 and 2025, the two housing eligible for land acquisition as noise mitigation for noise impacts in 2015 have been excluded from the impacted unit counts.4 For 2025, the 67 housing units eligible for land acquisition as noise mitigation due to noise impacts in 2020 have been excluded from the impacted unit count.5 Represents the number of housing units and non-residential noise-sensitive sites affected by significant noise levels during a specific year and are not cumulative.In 2020, Alternative B4 would result in an additional 88 housing units (an estimate of 207 people) exposed to noiselevels at or above DNL 65 dB. In 2025, when compared to the No-Action Alternative, Alternative B4 would result ineight fewer housing units (an estimate of 19 fewer people) exposed to noise levels at or above DNL 65 dB.Table 5-25 summarizes the population that would be exposed to aircraft noise levels of DNL 60 dB or more underAlternative B4 in 2020 and 2025. In 2020, 47 people would be exposed to noise levels DNL 70 dB and above and,therefore, would be eligible for land acquisition as mitigation. By 2025, seven additional people would be exposedto sound levels DNL 70 dB and above. In 2020, 160 additional people would be exposed to noise levels betweenDNL 65 dB and 70 dB compared to the No-Action Alternative; in 2025, 26 fewer people would be exposed to noiselevels DNL 65 dB to 70 dB primarily due to a Future Build VLAP for noise mitigation.Chapter 5 - Environmental Consequences 5-34 July 2011\\mawatr\ev\09228.00\reports\<strong>FEIS</strong>_Final_July_2011\<strong>PVD</strong>_CH05_Environmental_Cons_JUL_2011.doc
T.F. <strong>Green</strong> <strong>Airport</strong> <strong>Improvement</strong> <strong>Program</strong>Environmental Impact Statement and Final Section 4(f) EvaluationTable 5-25Alternative B4: 2020 and 2025 Aircraft Noise-Exposed PopulationPopulation by DNL value,No-Action 12020TotalAbove>75 70 to 65 to DNL 60 toCity dB 75 dB 70 dB 65 dB 65 dBWarwick 0 0 2,472 2,472 9,988Cranston 0 0 0 0 78Total0 0 2,472 2,472 10,065Increase 5 - - - - -SignificantNoisePopulation by DNL value,Alternative B4 2,32020TotalAboveDNL65 dB>75 dB70 to75 dB65 to70 dB60 to65 dB0 47 2,632 2,679 10,3170 0 0 0 3010 47 2,632 2,679 10,6170 47 362 409 -Net Population ChangeNo-Action Alternative and Alternative B4 2,32020TotalAboveDNL65 dB>75 dB70 to75 dB65 to70 dB60 to65 dB0 47 160 207 3290 0 0 0 2230 47 160 207 5520 47 362 409 -Net Population ChangePopulation by DNL value, Population by DNL value, No-Action Alternative andNo-Action Alternative 1 Alternative B4 2,3,4 Alternative B4 2,3,42025 2025 2025TotalTotalAboveAboveDNLDNL65 dB65 dBTotalAboveDNL65 dBCity>75dB70 to75 dB65 to70 dB60 to65 dB >75 dB70 to75 dB65 to70 dB60 to65 dB >75 dB70 to75 dB65 to70 dB60 to65 dBWarwick 0 7 3,316 3,323 11,040 0 14 3,290 3,304 11,200 0 7 -26 -19 160Cranston 0 0 0 0 336 0 0 0 0 529 0 0 0 0 193Total 0 7 3,316 3,323 11,376 0 14 3,290 3,304 11,729 0 7 -26 -19 353SignificantNoiseIncrease 5 - - - - - 0 2 251 254 - 0 2 251 254 -Source: HMMH, 2011.Note: Some numbers may not add up due to rounding.1 Excludes 658 people who have been relocated under the Completed Part 150 VLAP and 317 people which would be relocated under the Current Part 150 VLAPfor a total of 975 people relocated due to both programs (to be completed by 2015).2 All Alternative B4 counts have excluded people relocated due to non-noise related land acquisition, including 26 people that would be relocated due toconstruction acquisitions and 141 people would be eligible for relocation due to acquisition for the newly created RPZ.3 For 2020 and 2025, the five additional people that would be relocated due to land acquisition as noise mitigation for noise impacts in 2015 have been excluded fromthe impacted unit counts.4 For 2025, the 157 additional people that would be relocated due to land acquisition as noise mitigation for noise impacts in 2020 making have been excluded fromthe impacted unit count.5 Represents the number of housing units and non-residential noise-sensitive sites affected by significant noise levels during a specific year and are not cumulative.Significant Aircraft Noise Impacts – 2020 and 2025: In 2020 under Alternative B4, 174 housing units (an estimateof 409 people) within the DNL 65 dB contour are projected to experience a significant increase in noise levels(increase of at least DNL 1.5 dB at or above DNL 65 dB) and none would experience a slight to moderateincrease (DNL 3.0 dB or more between DNL 60 dB and 65 dB noise levels). In 2025, one housing unit (anestimate of two people) within the DNL 70 dB contour and 107 housing units (an estimated 251 people) betweenDNL 65 to 70 dB contours are projected to experience a significant increase and none would experience a slightto moderate increase. Figure 5-16 shows areas of significant noise exposure when comparing Alternative B4 tothe No-Action Alternative in 2020 and 2025. Those residences exposed to significant noise levels would beeligible for sound insulation mitigation.Chapter 5 - Environmental Consequences 5-35 July 2011\\mawatr\ev\09228.00\reports\<strong>FEIS</strong>_Final_July_2011\<strong>PVD</strong>_CH05_Environmental_Cons_JUL_2011.doc
T.F. <strong>Green</strong> <strong>Airport</strong> <strong>Improvement</strong> <strong>Program</strong>Environmental Impact Statement and Final Section 4(f) EvaluationIn 2020, under Alternative B4, two non-residential noise-sensitive sites, the Jehovah’s Witnesses of Warwick(Site PW017) and Baha’i Faith (Site PW039), would be newly exposed to noise levels that would make themeligible for sound insulation; however, Baha’i Faith has been sound insulated as part of a previous soundinsulation effort under the Part 150 NCP. In 2025, the same two sites as 2020 and an additional site, the JohnWickes School, would result in a significant noise increase all of which would be eligible for sound insulationmitigation. The John Wickes School has also already been sound insulated as part of a previous soundinsulation effort under the Part 150 NCP. Figure 5-9 shows the location of non-residential noise-sensitivelocations within the 2025 DNL 60 dB contour of all of the Alternatives.Aircraft Ground Noise (Integrated Cargo Facility Operations) – 2020 and 2025The cargo noise analysis results indicate there would be no off-<strong>Airport</strong> noise impact due to cargo noise. Refer toAppendix F.2, Aircraft Ground Noise (Cargo) Analysis, for the complete analysis.Vehicular Traffic Noise Impacts – 2020 and 2025Under Alternative B4, the off-<strong>Airport</strong> roadway improvements of Partially Relocated <strong>Airport</strong> Road andRealigned Main Avenue would be complete by the end of 2015. Overall, the same number of housing unitswould be impacted by vehicular traffic noise in 2020 when compared to the No-Action Alternative. In 2025,vehicular traffic DNLs are expected to increase by less than one dB over 2020 levels due to projected growth inarea vehicular traffic volumes. Tables 5-26 and 5-27 summarize the computed exterior traffic noise levels in eachof the neighborhoods that would be affected by traffic noise due to the proposed roadway improvements(Realigned Main Avenue) for Alternative B4 in 2020 and 2025, respectively.Table 5-26Alternative B4: 2020 Summary of Traffic Noise Impacts by NeighborhoodTotal Number of Housing Units 1Loudest-hour Leq in dBAExposed to Noise ImpactChangeRelative toBaseline No-Action Alt. B4 Baseline Baseline No-Action Alt. B4Roadway Neighborhood 2004 2020 2020 (dB) 2004 2 2020 2 2020South side of Main Ave <strong>Green</strong>wood: Post to Gertrude 3 48 to 73 48 to 73 51 to 73 0 to 7 16 16 15North side of Main Ave <strong>Green</strong>wood: Post to Gertrude 3 49 to 73 49 to 74 48 to 72 -9 to 1 13 13 10North side of Main Ave <strong>Green</strong>wood: Industrial to Inman 4 47 to 69 48 to 70 48 to 70 -5 to 1 9 9 3South side of Main Ave <strong>Green</strong>wood: Gladys Ct to Buttonwoods 4 49 to 71 49 to 71 54 to 71 -4 to 16 15 15 20South side of Main Ave <strong>Green</strong>wood: Graymore to Walnut Glen 4 43 to 52 43 to 52 49 to 70 6 to 18 0 0 5West side of Post Road Hilsgrove: Elkland to Pell 5 49 to 70 49 to 70 50 to 70 -3 to 2 4 5 5East side of Post Road Lincoln Park: Tennessee Ave 5 50 to 56 51 to 56 51 to 59 1 to 3 0 0 0Total - - - 57 58 58Source: HMMH, 2009.1 These numbers of housing units take into account the property acquisitions that are required for the roadway improvements and acquisitions for the newly createdRPZ as well as Current Part 150 VLAP and Future Build VLAPs.2 For baseline conditions and the No-Action Alternative, the number of housing units exposed to “impact” represents those residences for which baseline trafficnoise levels approach or exceed the FHWA NAC for Activity Category B for the loudest hour of the day. For the Alternative B4 case, the number of impactedhousing units is due to both traffic noise levels that approach or exceed the relevant FHWA NAC and that cause a substantial increase over baseline levels.3 See Figure A.4-23 in DEIS Noise Supporting Attachment A.11, Supporting Report Graphics.4 See Figure A.4-24 in DEIS Noise Supporting Attachment A.11, Supporting Report Graphics.5 See Figure A.4-22 in DEIS Noise Supporting Attachment A.11, Supporting Report Graphics.Chapter 5 - Environmental Consequences 5-36 July 2011\\mawatr\ev\09228.00\reports\<strong>FEIS</strong>_Final_July_2011\<strong>PVD</strong>_CH05_Environmental_Cons_JUL_2011.doc
T.F. <strong>Green</strong> <strong>Airport</strong> <strong>Improvement</strong> <strong>Program</strong>Environmental Impact Statement and Final Section 4(f) EvaluationTable 5-27Alternative B4: 2025 Summary of Traffic Noise Impacts by NeighborhoodTotal Number of Housing Units 1Loudest-hour Leq in dBAExposed to Noise ImpactChangeRelative toBaseline No-Action Alt. B4 Baseline Baseline No-Action Alt. B4Roadway Neighborhood 2004 2025 2025 (dB) 2004 2 2025 2 2025South side of Main Ave <strong>Green</strong>wood: Post to Gertrude 3 48 to 73 48 to 74 51 to 74 0 to 8 16 18 15North side of Main Ave <strong>Green</strong>wood: Post to Gertrude 3 49 to 73 49 to 74 48 to 72 -9 to 1 13 13 10North side of Main Ave <strong>Green</strong>wood: Industrial to Inman 4 47 to 69 48 to 70 48 to 70 -5 to 1 9 9 3South side of Main Ave <strong>Green</strong>wood: Gladys Ct to Buttonwoods 4 49 to 71 49 to 71 55 to 71 -4 to 17 15 15 20South side of Main Ave <strong>Green</strong>wood: Graymore to Walnut Glen 4 43 to 52 43 to 53 49 to 70 7 to 18 0 0 5West side of Post Road Hillsgrove: Elkland to Pell 5 49 to 70 50 to 70 50 to 70 -3 to 2 4 5 5East side of Post Road Lincoln Park: Tennessee Ave. 5 50 to 56 51 to 56 52 to 59 1 to 3 0 0 0Total - - - - 57 60 58Source: HMMH, 2009.1 These numbers of housing units take into account the property acquisitions that are required for the roadway improvements and acquisitions for the newly createdRPZ as well as Current Part 150 VLAP and Future Build VLAPs.2 For baseline conditions and the No-Action Alternative, the number of housing units exposed to “impact” represents those residences for which baseline trafficnoise levels approach or exceed the FHWA NAC for Activity Category B for the loudest hour of the day. For the Alternative B4 case, the number of impactedhousing units is due to both traffic noise levels that approach or exceed the relevant FHWA NAC and that cause a substantial increase over baseline levels.3 See Figure A.4-23 in DEIS Noise Supporting Attachment.A.11, Supporting Report Graphics.4 See Figure A.4-24 in DEIS Noise Supporting Attachment.A.11, Supporting Report Graphics.5 See Figure A.4-22 in DEIS Noise Supporting Attachment A.11, Supporting Report Graphics.DEIS Noise Supporting Attachment A.4, Vehicular Traffic Noise Technical Report, provides a detailed assessmentof <strong>Improvement</strong> <strong>Program</strong>-related traffic noise, including detailed tables of computed traffic noise levels for eachalternative. Traffic DNLs in 2020 would range from 49.4 to 74.8 dB at affected residences throughout the StudyArea with Alternative B4. In 2025, traffic DNLs are expected to increase by less than 1 dB over 2020 levels due toprojected growth in area traffic volumes. Overall, the same number of housing units would be impacted bytraffic noise in 2020 when compared to the No-Action Alternative.Table 5-27 summarizes the computed traffic noise levels in each of the neighborhoods that would be affected bytraffic noise due to Alternative B4 in 2025. As shown in the table, the projected traffic noise levels wouldincrease slightly with respect to 2020, but no additional housing units would be exposed to traffic noise impactby 2025 with Alternative B4.Composite Noise – 2020 and 2025The DNL values at these sites indicate that aircraft flight operations would dominate the noise environment for2020 and 2025. In 2020 and 2025, no sites would experience a significant noise increase (increase of at leastDNL 1.5 dB at or above DNL 65 dB). Tables F.3-7 and F.3-8 in Appendix F.3, Composite Noise, present a summaryof the composite noise exposure (DNL) for Alternative B4 in 2020 and 2025, respectively from all programrelatedsources of noise.Chapter 5 - Environmental Consequences 5-37 July 2011\\mawatr\ev\09228.00\reports\<strong>FEIS</strong>_Final_July_2011\<strong>PVD</strong>_CH05_Environmental_Cons_JUL_2011.doc
T.F. <strong>Green</strong> <strong>Airport</strong> <strong>Improvement</strong> <strong>Program</strong>Environmental Impact Statement and Final Section 4(f) Evaluation5.3.5 Temporary Impacts from Short-Term Construction ActivitiesNoise levels would increase temporarily during the short-term construction activities associated withAlternatives B2 and B4. The degree of noise impact during construction would be a function of the number andtypes of equipment being used, and the distances between the construction equipment and the noise-sensitiveareas. Overall construction noise levels are governed primarily by the noisiest pieces of equipment operating ata given time. Table 5-28 provides typical maximum sound levels associated with various types of constructionequipment. During any particular activity, multiple pieces of equipment may be operating simultaneously andfor various durations throughout the construction period. Therefore, noise impact experienced by localresidents as a result of construction activities is not expected to occur during sleeping hours. Long-termdisruptions to aircraft traffic due to runway and taxiway closures are not expected to occur, and, thus, therewould be no increases in aircraft noise associated with construction.5.3.5.1 Alternative B2Noise levels would increase during short-term construction of Alternative B2. Construction activities areanticipated to begin in 2014 with the construction of Partially Relocated <strong>Airport</strong> Road and the Runway 16-34 RSAenhancements. In 2015, noise levels would increase during short-term construction of <strong>Airport</strong> Road and theRunway 16-34 RSA enhancements; however, these areas are not close to residential neighborhoods and would notimpact residents. Construction would extend through the end of 2020 depending on the program improvementelement under construction. Temporary increases in noise levels from construction activities would primarily beexperienced in neighborhoods north of the <strong>Airport</strong> (Norwood, Lincoln Park, Hoxie, and Spring <strong>Green</strong>), due to theconstruction of extended Runway 5-23 and Fully Relocated <strong>Airport</strong> Road. Neighborhoods to the south including<strong>Green</strong>wood, Oak Grove and Strawberry Field would be impacted by temporary increases in noise fromconstructing the extension of the Runway 5 End. Runway 5-23 and associated taxiway construction would resultin an increase in noise on both the north and south side of the <strong>Airport</strong>.Alternative B2 involves the construction of Fully Relocated <strong>Airport</strong> Road, which would be located in theneighborhood just north of the <strong>Airport</strong>. Runway 5-23 and associated taxiway construction would result in anincrease in noise on both the north and south side of the <strong>Airport</strong>. Residences along <strong>Airport</strong> property near theRunway 5 End of the <strong>Airport</strong> would experience some construction noise.Construction activity would mainly occur during normal working hours on weekdays. Therefore, noise impactexperienced by local residents as a result of construction activities is not expected to occur often during sleepinghours. Long-term disruptions to aircraft traffic due to runway and taxiway closures are not expected to occur,and, thus, there would be no increases in aircraft noise related to the construction activities.Chapter 5 - Environmental Consequences 5-38 July 2011\\mawatr\ev\09228.00\reports\<strong>FEIS</strong>_Final_July_2011\<strong>PVD</strong>_CH05_Environmental_Cons_JUL_2011.doc
T.F. <strong>Green</strong> <strong>Airport</strong> <strong>Improvement</strong> <strong>Program</strong>Environmental Impact Statement and Final Section 4(f) EvaluationTable 5-28Typical Construction Equipment Maximum Noise LevelsLmax at 50 feetLmax at 50 feetActivity Equipment (dBA) Activity Equipment (dBA)Building Demolition Excavator 81 Earthwork Scraper 84Mounted Impact Hammer (hoe ram) 90 Dozer 82Shears (on backhoe) 96 Roller 80Flat Bed Truck 74 Tractor 84Excavator 81Building Construction CraneMan Lift8175Flat Bed TruckGrader7485Grapple (on backhoe) 87 Bituminous Paving Paver 77Concrete Mixer Truck 79 Roller 80Concrete Pump TruckExcavator8181Front End LoaderVacuum Street Sweeper7982Flat Bed Truck 74 Flat Bed Truck 74Building Foundations CraneImpact Pile Driver81101Concrete Paving Concrete Mixer TruckGrader7985Vibratory Pile Driver 101 Roller 80Concrete Mixer Truck 79 Excavator 81Concrete Pump Truck 81 Flat Bed Truck 74ExcavatorGrapple (on backhoe)8187Airfield Demolition Mounted Impact Hammer (hoe ram)Excavator9081Auger Drill Rig 84 Slurry Trenching Machine 80Flat Bed Truck 74 Pavement Scarafier 90All Other Equipment > 5 HP 85Flat Bed Truck 74Source: Federal Highway Administration, Roadway Construction Noise Model, Version 1.0, February 2006; HMMH, 2008.5.3.5.2 Alternative B4Noise levels would increase during short-term construction of Alternative B4. Construction activities forAlternative B4 are anticipated to begin in 2013 with the construction of partially relocated <strong>Airport</strong> Road and theRunway 16-34 enhancements. In 2015 and 2020, noise levels would temporarily increase during the short-termconstruction activities of Alternative B4. Short-term construction activities are anticipated to extend through theend of 2020, depending on the program element under construction, and would primarily be experienced inneighborhoods south of the <strong>Airport</strong> (Oak Grove, <strong>Green</strong>wood Park, north side of Buttonwoods and StrawberryFields) due to the extension of Runway 5-23 to the south and Realigned Main Avenue. Lesser amounts oftemporary construction noise would be experienced north of the <strong>Airport</strong> (Hillsgrove and Lincoln Park) due tothe construction of the new Integrated Cargo Facility.Construction activity would mainly occur during normal working hours on weekdays. Therefore, noise impactexperienced by local residents as a result of construction activities is not expected to often occur during sleepinghours. Long-term disruptions to aircraft traffic due to runway and taxiway closures are not expected to occur,and, thus, there would be no increases in aircraft noise related to the construction activities.Chapter 5 - Environmental Consequences 5-39 July 2011\\mawatr\ev\09228.00\reports\<strong>FEIS</strong>_Final_July_2011\<strong>PVD</strong>_CH05_Environmental_Cons_JUL_2011.doc
T.F. <strong>Green</strong> <strong>Airport</strong> <strong>Improvement</strong> <strong>Program</strong>Environmental Impact Statement and Final Section 4(f) Evaluation5.3.6 Cumulative ImpactsCumulative impacts account for the impacts that result from the incremental impact of the action when added toother past, present, and reasonably foreseeable future actions. Cumulative impacts can result from individuallyminor, but collectively significant actions taking place over a period of time. Potential impacts associated withAlternatives B2 and B4 along with noise impacts from other, non-airport sources of noise have been assessedcumulatively within the Noise Study Area, as a standard part of the noise analysis. Specifically, the noise analysis:• Includes prior actions taken in the Baseline Condition;• Includes any reasonably foreseeable future actions under the No-Action Alternative;• Includes future build conditions (changes in aircraft flight noise levels and noise levels as a result of changeson airport property due to the relocation of the cargo facilities);• Considers any previous, ongoing, and future VLAPs, in accordance with the Part 150 program (excludedfrom any future aircraft noise impacts on noise-sensitive sites);• Considers potential noise levels impacts due to previous (existing) and expected vehicle traffic level changesto local roads without the <strong>Improvement</strong> <strong>Program</strong> (refer to Table 5-5 for a list of new and planneddevelopments in the City of Warwick) as well as future changing roadway alignments and traffic levelchanges airport ground cargo facilities, which are included as background conditions in the SurfaceTransportation traffic analysis (vehicle traffic model runs account for the predicted increase in transit usage asa result of InterLink, which opened in late 2010); and• Considers total composite noise exposure (computed at representative noise-sensitive locations) whichsums the noise contributions of aircraft operations (arrivals and departures), aircraft ground operations(aircraft taxiing and queuing and engine run-ups), and traffic noise (off-<strong>Airport</strong> roadways improvements) toidentify the composite noise exposure at specific locations.Under Alternatives B2 and B4, the DNL values at the composite noise sites indicate that noise from aircraft flightoperations are the most evident noise source in the noise environment. As shown previously under in each of therespective ‘Composite Noise’ sub-section for Alternatives B2 and B4 and analysis year, ground based noise sourcesdo contribute to noise levels, but they are dominated by aviation noise. Of the twenty-five composite noise sitesanalyzed, only one site in 2020 and two sites in 2025 have DNL values where aviation noise was less than 65 dB whilecomposite noise was greater than 65 dB DNL. These findings include:• Site C6 on Grotto Avenue, had modeled vehicular traffic noise levels greater than aviation noise levels,resulting in composite noise levels greater than 65 dB for Alternative B2 in 2020 and 2025.• Site C7 on Evergreen Avenue, had modeled cargo noise levels comparable to aviation noise levels, resultingin composite noise levels greater than 65 dB for No-Action Alternative and Alternative B4 in 2020 and forNo-Action Alternative and Alternative B4 in 2025.• Site P4 on Astral Street, had modeled vehicular traffic noise levels comparable to aviation noise levels,resulting in composite noise levels greater than 65 dB for No-Action Alternative (for B4 vehicular trafficconditions only) and Alternatives B2 and B4 in 2025.Chapter 5 - Environmental Consequences 5-40 July 2011\\mawatr\ev\09228.00\reports\<strong>FEIS</strong>_Final_July_2011\<strong>PVD</strong>_CH05_Environmental_Cons_JUL_2011.doc
T.F. <strong>Green</strong> <strong>Airport</strong> <strong>Improvement</strong> <strong>Program</strong>Environmental Impact Statement and Final Section 4(f) Evaluation5.3.7 Supplemental Noise MetricsAt the request of the public and agencies, during the EIS Scoping process, other noise metrics, in addition to DNL,were calculated to further describe the noise environment for Alternatives B2 and B4, and were compared to theNo-Action Alternative. Time Above (TA) and Number of Events above (N) a threshold and L maxnoise metrics werecomputed for each of the noise measurement sites (Figure 4-2) and non-residential noise-sensitive sites exposed tonoise levels at or above DNL 60 dB (Figure 5-9). While not required by the FAA, these metrics provide informationthat the DNL metric does not, such as the time that a particular location experiences noise above a specified level,the number of aircraft events causing noise above a specified level, and the maximum level at each of the sites. TheTA metric is given in terms of the total number of minutes. For example, if 65 dB is the specified threshold, themetric would be referred to as “TA-65.” There is no FAA standard for significant impact for these additionalmetrics and no threshold for incompatible land use for noise exposure measured in TA.The L maxhelps to characterize the magnitude of the noise, but does not provide information regarding the duration ofor cumulative exposure to the noise. These noise metrics were modeled using the same geographic and census inputdata used to develop the noise contours. Appendix F.4, Supplemental Noise Metrics, provides additional informationon the other noise metrics methodology and presents the full results. In general, the highest computed DNL and L maxvalues and longest TA values would occur at those sites closest to the <strong>Airport</strong> and most exposed to aircraft operationsunder all <strong>FEIS</strong> Alternatives.Each of the noise measurement site locations is described in DEIS Noise Supporting Attachment A.5, NoiseMonitoring, and shown on Figure 4-2. Tables 5-29 and 5-30 present the computed TA-75 at each of themeasurement sites and non-residential noise-sensitive sites with DNL above 60 dB, for the No-ActionAlternative and Alternatives B2 and B4 in 2015, 2020, and 2025. In general, the highest computed TA-75 wouldoccur at those sites closest to the <strong>Airport</strong> and most exposed to aircraft operations.Table 5-29 Comparison of Computed Time Above-75 at Noise Measurement Sites 1Computed TA-75 (minutes)2015 2020 2025Site 2 Address No-Action B2 B4 No-Action B2 B4 No-Action B2 B4P1 Gertrude Ave. 15.0 15.0 -- 3 -- 3 --- 3 -- 3 -- 3 -- 3 -- 3P2 Glen Drive 3.2 3.0 3.4 3.4 3.6 3.7 3.6 3.7 3.8P3 Commodore Ave. 12.9 12.9 -- 3 -- 3 -- 3 -- 3 -- 3 -- 3 -- 3P4 Louisiana Ave. 3.2 3.2 3.3 3.4 3.5 3.4 3.7 3.7 3.7S1 Winman Court 2.9 2.9 3.4 2.9 3.1 3.4 3.2 3.4 3.7S2 Alice Ave. 0.9 0.9 1.2 0.9 1.1 1.2 1.0 1.2 1.3S3 Rosegarden St. 4.6 4.6 5.5 5.1 6.2 5.8 5.6 6.7 6.3S4 Manolla Ave. 1.1 1.1 0.9 1.1 1.0 0.9 1.2 1.1 1.0S5 Wilbur Ave. 17.9 17.9 21.6 18.8 18.3 22.5 20.9 20.2 24.6S6 Grace St. 4 0.4 0.4 0.3 0.4 0.3 0.3 0.4 0.4 0.4S7 Spring <strong>Green</strong> Dr. 1.0 1.0 1.0 1.0 1.1 1.0 1.1 1.2 1.1S8 Collingwood Dr. 7.1 7.1 6.9 7.6 8.9 7.4 8.8 10.1 8.5Source: HMMH, 2011.TA Time above a threshold.1 “Time Above” means the time that a particular location experiences noise above a specified level. The TA metric is given in terms of the total number of minutes.For example, if 65 dB is the specified threshold, the metric would be referred to as “TA-65.”2 See Figure 4-2 for locations. (P - Long-term measurement sites, S - Short-term measurement sites).3 Included in acquisition due to airport construction or for noise mitigation.4 This site is located in Cranston; all other sites are in Warwick.Chapter 5 - Environmental Consequences 5-41 July 2011\\mawatr\ev\09228.00\reports\<strong>FEIS</strong>_Final_July_2011\<strong>PVD</strong>_CH05_Environmental_Cons_JUL_2011.doc
T.F. <strong>Green</strong> <strong>Airport</strong> <strong>Improvement</strong> <strong>Program</strong>Environmental Impact Statement and Final Section 4(f) EvaluationTable 5-30Comparison of Computed Time Above-75 at Non-Residential Noise-Sensitive SitesComputed TA-75 (minutes)2020 20252015Site 1 Name No-Action B2 B4 No-Action B2 B4 No-Action B2 B4PW002 Saint Barnabas Episcopal Church 3.6 3.6 4.1 3.6 3.9 4.1 3.9 4.1 4.5PW003 St. Catherine Church 3.3 3.3 3.9 3.3 3.6 3.9 3.7 3.9 4.2PW004 Warwick Central Baptist 3.2 3.2 3.8 3.2 3.5 3.8 3.5 3.8 4.1PW010 <strong>Green</strong>wood Community Church 2.5 2.5 2.6 2.8 2.8 3.0 3.3 3.2 3.5PW012 St. Timothy's Mission Center 1.2 1.2 1.4 1.3 1.7 1.4 1.6 1.9 1.7PW017 Jehovah's Witnesses of Warwick 9.0 9.0 10.5 9.3 10.6 10.9 10.2 11.4 11.7PW020 Spring <strong>Green</strong> Memorial Baptist 3.9 3.9 4.1 3.9 4.2 4.0 4.3 4.6 4.4PW029 Lakewood Baptist 2.8 2.8 3.3 3.2 3.7 3.6 3.5 4.1 4.0PW033 Creating Women Ministries 2 6.5 6.5 6.9 6.7 8.0 7.0 7.4 8.9 7.6PW034 New Hope Worship Center 8.2 8.1 8.5 8.9 9.1 9.2 9.4 9.6 9.8PW039 Baha’i Faith2 9.4 9.4 16.2 9.8 12.0 16.8 10.8 13.2 18.4PW042 Apponaug Pentecostal Church 4.4 4.4 5.2 4.5 4.9 5.2 5.0 5.3 5.7PW043 Temple AM David 5.6 5.6 5.8 5.8 6.3 6.0 6.4 6.9 6.5SCH105 Happy Hollow Nursery 2.8 2.8 3.3 3.2 3.9 3.7 3.5 4.2 4.1SCH498 Randall Holden 2.0 2.0 2.1 2.1 2.6 2.2 2.3 2.9 2.5SCH512 Apponaug Christian 3.7 3.7 4.3 3.7 3.9 4.3 4.1 4.3 4.7SCH517 Holliman School3 3.1 3.1 3.2 3.1 3.3 3.1 3.4 3.5 3.3SCH518 Pilgrim High School3 6.9 6.9 7.5 7.2 8.1 7.9 7.9 8.7 8.5SCH519 Francis School3 2.6 2.6 2.7 2.7 2.9 2.8 3.1 3.2 3.1SCH523 St. Rose of Lima3 6.7 6.7 8.9 7.0 9.7 9.2 8.0 10.7 10.3SCH524 John Wickes School3 7.4 7.4 11.2 7.5 10.2 11.5 8.4 11.2 12.7SCH526 E G Robertson School3 3.4 3.4 4.3 3.7 4.2 4.5 4.1 4.6 4.9SCH531 New England Institute of Technology 3.5 3.5 3.8 3.8 4.6 4.2 4.4 5.3 4.9SCH542 Building Blocks Center 3.4 3.4 4.0 3.4 3.7 3.9 3.8 4.0 4.3SCH547 Westbay Community Action 6.9 6.9 7.4 7.3 7.7 7.7 8.1 8.4 8.4SCH552 Magic Years Child 5.8 5.8 6.8 5.9 6.5 6.9 6.6 7.1 7.6SCH677 Precious Years Day Care 3.7 3.7 4.0 3.9 4.0 4.1 4.4 4.4 4.5LIB039 Warwick Public Library Apponaug Branch 3.7 3.7 4.2 3.7 3.9 4.2 4.1 4.2 4.6LIB082 New England Institute of Technology 3.5 3.5 4.0 3.8 4.7 4.3 4.4 5.4 5.0Source: HMMH, 2011.Notes: All facilities are located in the City of Warwick. This table lists only sites which have TA75 Sound Exposure Level at the sites within the 60 DNL. Refer to Table 529 footnote 1 for a brief description of “Time Above.”1 See Figure 4-2 for locations.2 Sites previously sound insulated.3 Schools within DNL 60 dB that have already been sound insulated as part of a previous sound insulation effort under the Part 150 NCP.PW Places of Worship.SCH Public and Private Schools, Educational Institutions, or Day Care Facilities; Note schools Aldrich Junior High, Cedar Hill School, <strong>Green</strong>wood School, and CrayonChild Care are within the 60 DNL for at least one alternative, but have TA75 values equal to zero.LIB Libraries.5.3.8 Comparison of Alternatives B2 and B4This section presents a comparison of noise exposure under the No-Action Alternative and Alternatives B2 andB4 for 2015, 2020, and 2025. Alternatives B2 and B4 would result in a significant increase in noise under all relevantanalysis years when compared to the No-Action Alternative. The FAA further evaluated the alternatives for slightto moderate impacts. The analysis determined that there were no 3.0 dB changes within the DNL 60-65 dBcontours, and no 5.0 dB increases in noise levels between DNL 45 and 60 dB at noise-sensitive sites.Chapter 5 - Environmental Consequences 5-42 July 2011\\mawatr\ev\09228.00\reports\<strong>FEIS</strong>_Final_July_2011\<strong>PVD</strong>_CH05_Environmental_Cons_JUL_2011.doc
T.F. <strong>Green</strong> <strong>Airport</strong> <strong>Improvement</strong> <strong>Program</strong>Environmental Impact Statement and Final Section 4(f) Evaluation5.3.8.1 Significant ImpactsTable 5-31 summarizes the population and housing units that would be exposed to a significant noise impactand, therefore, would be eligible for sound insulation mitigation, as a result of Alternatives B2 and B4.Table 5-31 Alternatives B2 and B4: Summary of Significant Impacts on Housing Units and Population 1,22015 Population and Housing 2020 Population and Housing 2025 Population and Housing Units by DNL value Units by DNL value Units by DNL value (Increase of at least DNL 1.5 dB at (Increase of at least DNL 1.5 dB at (Increase of at least DNL 1.5 dB ator above DNL 65 dB) or above DNL 65 dB) or above DNL 65 dB)Type Alt. B2 Alt. B4 Alt. B2 Alt. B4 Alt. B2 Alt. B4Housing Units -- 3 184 74 174 49 108Population -- 3 432 174 409 115 254Already Sound Insulated Under a Previous Sound Insulation Effort (Part 150 NCP)Housing Units 0 161 74 151 49 87Population 0 378 174 355 115 204Project-related Mitigation for Significant Noise ImpactsNon-Insulated Significantly Impacted NA 23 0 23 0 21Housing UnitsNon-Insulated Non-Residential Noise- NA 1 0 1 0 1Sensitive SitesSource: HMMH, 2011. U.S. Census Data, 2000.Note: Represents the number of housing units and non-residential noise-sensitive sites affected by significant noise levels during a specific year and are not cumulative.Impact numbers include homes already sound insulated. The actual number of homes required to be eligible for sound insulation would be the difference between theBuild Alternative impact and the number of previously sound insulated homes. Refer to Chapter 6, Mitigation for Alternative B4 for the actual number of homes eligiblefor sound insulation.1 Significant impacts are noise impacts that occur if analysis shows that the project would cause noise-sensitive areas to experience an increase of at least DNL 1.5 dB at orabove DNL 65 dB noise exposure when compared to the No-Action Alternative for the same timeframe. These residences would be eligible for sound insulation mitigation.2 Excludes people that would be relocated and housing units that would be acquired for construction, noise mitigation under a Future Build VLAP, and RPZ area clearing.3 Alternative B2 in 2015 is based only on runway safety enhancements with no changes in aircraft operations and, therefore, did not result in project-related significant noise impacts.In 2015, Alternative B2 would not result in significant noise impacts. Alternative B4 would result in a significantnoise increase to 184 housing units (an estimated 432 people) and none would experience a slight to moderateincrease. Alternative B4 would also expose two non-residential noise-sensitive sites, Jehovah’s Witnesses ofWarwick (Site PW017) and Baha’i Faith (Site PW039), to a significant noise impact in 2015 that would makethem eligible for sound insulation; however, Baha’i Faith has been sound insulated as part of a previous soundinsulation effort under the Part 150 NCP.In 2020, Alternative B2 would result in a significant increase noise exposure for 74 housing units (an estimated174 people), all units of which have already been sound insulated, and Alternative B4 would result in asignificant increase in noise exposure for 174 housing units (an estimated 409 people), all but 23 of which havealready been sound insulated (Table 5-31). The primary reason for the greater noise impacts under Alternative B4compared to Alternative B2 is that over 100 housing units impacted by noise under Alternative B4 would be acquiredfor construction purposes under Alternative B2. These include units that would be impacted by activities such asconstructing the Runway 23 End RPZ, which would not be cleared under Alternative B4 since no changes would bemade at the Runway 23 End. 289 No noise-sensitive sites would experience a slight to moderate increase for289 Clearing the Runway 23 RPZ under Alternative B2 would result in 74 residential units being eligible for acquisition at the Runway 23 End.Chapter 5 - Environmental Consequences 5-43 July 2011\\mawatr\ev\09228.00\reports\<strong>FEIS</strong>_Final_July_2011\<strong>PVD</strong>_CH05_Environmental_Cons_JUL_2011.doc
T.F. <strong>Green</strong> <strong>Airport</strong> <strong>Improvement</strong> <strong>Program</strong>Environmental Impact Statement and Final Section 4(f) EvaluationAlternatives B2 and B4 in 2020. Alternative B2 would not result in a significant noise increase at any nonresidentialnoise-sensitive sites in 2020. Alternative B4 would expose two non-residential noise-sensitive sites,Jehovah’s Witness of Warwick (Site PW017) and Baha’i Faith (Site PW039), to a significant noise impact thatwould make them eligible for sound insulation; however, Baha’i Faith has been sound insulated as part of aprevious sound insulation effort under the Part 150 NCP.In 2025, Alternative B2 would result in a significant noise increase to 49 housing units (an estimated 115people)–all units of which have already been sound insulated (Table 5-31) –and none would experience a slightto moderate impact. Alternative B2 would not result in a significant noise increase at any non-residential noisesensitivesites in 2025. Alternative B4 would result in a significant noise increase to 108 housing units (anestimated 254 people) and none would experience a slight to moderate increase in 2025. Alternative B4 wouldexpose three non-residential noise-sensitive sites: Jehovah’s Witnesses of Warwick (Site PW017); Baha’i Faith(Site PW039); and John Wickes School (SCH524) to a significant noise impact in 2025 that would make the siteseligible for sound insulation. The John Wickes School and Baha’i Faith have been sound insulated as part of aprevious sound insulation effort under the Part 150 NCP.5.3.8.2 Other Noise Impacts on Housing Units and PopulationTable 5-32 summarizes the housing units and number of people that would be newly exposed to noise levels betweenDNL 65 dB and 69 dB, and DNL 70 and above for Alternatives B2 and B4. The primary reason for the greater noiseimpacts for Alternative B4 compared to Alternative B2 is that the Runway 23 End RPZ would not be cleared underAlternative B4 since no changes would be made at the Runway 23 End. 290Table 5-32Alternatives B2 and B4: Comparison of Newly Noise-Exposed Housing Units and Population toDNL 65 dB and Above 1,2,32015 2020 2025Measure Alternative B2 Alternative B4 Alternative B2 Alternative B4 Alternative B2 Alternative B4Population and Housing Units Newly Exposed to Noise Levels Between DNL 65 dB and 69 dBHousing Units 5 209 156 203 156 188Population 12 491 367 477 367 442Population and Housing Units Newly Exposed to Noise Levels Above DNL 70 dBHousing Units 0 2 15 20 23 3Population 0 5 35 47 54 7Source: HMMH, 2011. U.S. Census Data, 2000.Notes: Represents the number of housing units and non-residential noise-sensitive sites affected by significant noise levels during a specific year and are not cumulative.May include homes already sound insulated. ‘Newly Exposed’ means the residential area was exposed to DNL levels below 65 dB under the future No-ActionAlternative and would be exposed at levels above DNL 65 dB under Alternatives B2 and B4. All housing units would be eligible for sound insulation mitigation.Alternative B4 exposes more people and units to noise levels greater then DNL 65 dB because the Runway 23 End RPZ would not be cleared for this alternative.Alternative B2 would result in 100 units eligible for voluntary participation in a land acquisition for the newly created Runway 23 End RPZ.1 Excludes homes acquired under the Completed Part 150 VLAP and the Current Part 150 VLAP (No-Action Alternative).2 Excludes people that would be relocated and housing units that would be acquired for construction, the Future Build VLAPs for noise mitigation, and RPZ area clearing.3 Represents a comparison between No-Action Alternative and Alternatives B2 and B4 for each analysis year.290 Clearing the newly created Runway 23 RPZ under Alternative B2 would result in 100 residential units being eligible for acquisition at the Runway 23 End.Chapter 5 - Environmental Consequences 5-44 July 2011\\mawatr\ev\09228.00\reports\<strong>FEIS</strong>_Final_July_2011\<strong>PVD</strong>_CH05_Environmental_Cons_JUL_2011.doc
T.F. <strong>Green</strong> <strong>Airport</strong> <strong>Improvement</strong> <strong>Program</strong>Environmental Impact Statement and Final Section 4(f) Evaluation5.3.8.3 Aircraft Ground Noise (Integrated Cargo Facility Operations)There is no predicted ground noise impact from cargo operations under Alternatives B2 and B4. Appendix F,Noise, contains a detailed analysis of aircraft ground noise.5.3.8.4 Vehicular Traffic Noise ImpactsDiffering roadway configurations result in different baseline comparisons for Alternatives B2 and B4. Tables 5-33 and 5-34 provide a summary of the number of housing units impacted by vehicular traffic noise forAlternative B2 and B4 compared to the No-Action Alternative, respectively. Table 5-33Alternative B2: Summary of Vehicular Traffic Noise Impacts (Number of Housing Units)Number of Housing Units Exposed to Noise Impact by Type of Impact 1Traffic Leq(h)SubstantialBoth Approach orApproaches or Exceeds Increase overExceed NAC andFHWA NACBaseline levels Substantial IncreaseNetIncrease 3AlternativeYearBaseline Condition 2 2004 8 – – 82015 4 0 0 4No-Action 2 2020 6 0 0 62025 6 0 0 62015 12 1 1 12Alternative B2 4 2020 62 97 51 1082025 77 131 61 147Source: HMMH, 20081 Per the RIDOT noise assessment guidelines, traffic noise impacts are only computed within 500 feet of proposed roadway alignments. Differing roadwayconfigurations therefore result in different baseline comparisons for Alternatives B2 and B4.2 For the Baseline Condition and No-Action Alternative, the number of housing units exposed to “impact” are those residences where baseline traffic noise levelsapproach or exceed the FHWA NAC for Activity Category B for the loudest hour of the day.3 Note that the number of dwelling units that both approach or exceed the NAC and produce a substantial increase also appear in the previous two columns. The“Net” increase is the sum of the first two columns of impacted housing units less the third.4 These numbers of housing units take into account the property acquisitions that are required for the roadway improvements (no runway extension) andconstruction of the RPZ as well as project-related noise mitigation and Current Part 150 VLAP.Table 5-34Alternative B4: Summary of Vehicular Traffic Noise Impacts (Number of Housing Units)Number of Housing Units Exposed to Noise Impact by Type of Impact 1AlternativeYearTraffic Leq(h)Approaches or ExceedsFHWA NACSubstantialIncrease overBaseline levelsBoth Approach orExceed NAC andSubstantial IncreaseNetIncrease 3Baseline Condition 2 2004 57 – – 572015No-Action 2 202020255858602015 53 12 7 58Alternative B4 4 2020 53 12 7 582025 53 12 7 58Source: HMMH, 2008Notes: See Table 5-33.000000585860Chapter 5 - Environmental Consequences 5-45 July 2011\\mawatr\ev\09228.00\reports\<strong>FEIS</strong>_Final_July_2011\<strong>PVD</strong>_CH05_Environmental_Cons_JUL_2011.doc
T.F. <strong>Green</strong> <strong>Airport</strong> <strong>Improvement</strong> <strong>Program</strong>Environmental Impact Statement and Final Section 4(f) Evaluation5.3.8.5 Composite NoiseIn 2015 under Alternatives B2 and B4, aircraft operations are expected to dominate the noise environment in thevicinity of the <strong>Airport</strong> and no sites would experience a significant increase in noise levels. In 2020 and 2025under Alternative B2, aircraft operations would dominate the noise environment in the vicinity of the <strong>Airport</strong>and three sites would experience a significant increase in noise levels, including C6, R4 and R6 (Figure 4-2).Under Alternative B4 in 2020 and 2025, the dominant noise source would be from aircraft flight operations andno sites would experience a significant increase in noise levels.5.3.9 Avoidance and MinimizationAlternatives B2 and B4 were specifically developed to minimize the extent of the impacts to the community.Previously eliminated Alternative B1 included an extension of Runway 5-23 to 9,350 feet. The noise contoursassociated with Alternative B1 would have been considerably larger than the extent of noise contours associatedwith Alternatives B2 and B4 with Runway 5-23 that would be extended to a total of 8,700 feet. Alternative B4minimizes the extent of the noise impacts to the north of the <strong>Airport</strong> more than Alternative B2 because it wouldextend the Runway 5 End only. Chapter 6, Mitigation presents the mitigation measures proposed fornoise-related significant impacts (increase of at least DNL 1.5 dB at or above DNL 65 dB) and other impacts (i.e.,vehicle traffic noise).5.4 Compatible Land UseIn accordance with FAA guidelines for NEPA analysis, this section provides an overview of the changes in landuse (in parcels and acres) as a result of Alternatives B2 and B4 due to changes in noise levels and physicalimpacts (land acquisition). Section 5.3, Noise, discusses significant increases (an increase of at least DNL 1.5 dBat or above DNL 65 dB) in aircraft noise in terms of housing units and population, and non-residential noisesensitivesites as well as other changes in noise. Significant impacts related to residential and business relocation(land acquisitions), disruption to traffic circulation patterns, loss of community tax base, and other communityimpacts are addressed in Section 5.5, Social and Socioeconomic, and Environmental Justice Populations and Children’sHealth and Safety Risks.5.4.1 Regulatory ContextFor purposes of this <strong>FEIS</strong>, land use compatibility is defined by FAA in 14 CFR.150, <strong>Airport</strong> Noise CompatibilityPlanning. Before the FAA can issue a grant, it needs to confirm that a proposed project is reasonably consistentwith the plans of public agencies such as the state or municipalities authorized to plan for development of thearea surrounding an airport. 291 The FAA Orders note that compatibility of existing and planned land uses in thevicinity of an airport is usually associated with the extent of the airport’s noise impacts and that if the noiseanalysis concludes that there is no significant impact, a similar conclusion usually may be drawn with respect tocompatible land use.291 FAA Order 5050.4B, paragraph 1203c.Chapter 5 - Environmental Consequences 5-46 July 2011\\mawatr\ev\09228.00\reports\<strong>FEIS</strong>_Final_July_2011\<strong>PVD</strong>_CH05_Environmental_Cons_JUL_2011.doc
T.F. <strong>Green</strong> <strong>Airport</strong> <strong>Improvement</strong> <strong>Program</strong>Environmental Impact Statement and Final Section 4(f) EvaluationThe compatible land use analysis must identify land uses that are normally compatible with various exposuresof individuals to noise levels. 292 As described previously under Section 5.3, Noise, the <strong>Airport</strong>’s Completed andCurrent Part 150 VLAPs, as part of RIAC’s ongoing Part 150 NCP, identified residences that are eligible fornoise abatement measures (sound insulation or land acquisition).5.4.2 Significance Threshold and Additional AnalysesThe compatible land use analysis considers impacts of Alternatives B2 and B4 as defined the FAA’s thresholdsof significance, and also conducts additional noise analyses to gain a full understanding of the futurecompatible land use conditions.5.4.2.1 Finding: Significant Land Use ImpactsAs presented previously in Table 5-6, the significance threshold for compatible land use impacts, in accordancewith the FAA Order 1050.1E, is the same as noise: when an action, compared to the No-Action Alternative forthe same timeframe, would cause noise-sensitive areas located at or above DNL 65 dB to experience a noiseincrease of at least DNL 1.5 dB at or above DNL 65 dB. Residences on these significantly impacted parcelswould be eligible for sound insulation mitigation.In 2015 under Alternative B2, no residential areas are projected to experience a significant increase in noiselevels because there would be no increase in aircraft operations. Under Alternative B4, several areas wouldexperience a significant increase in noise levels under all analysis years, including 2015 due to the expeditedconstruction schedule for extended Runway 5-23. In 2015 under Alternative B4, residential land uses (180parcels totaling approximately 32 acres) would be affected by significant increases in noise when compared tothe No-Action Alternative. These residential areas are located immediately adjacent to the Runway 5 and 23Ends, as shown on Figure 5-21.In 2020 under Alternative B2, 71 parcels totaling approximately 11.5 acres in 2020 and 48 parcels totalingapproximately seven acres in 2025 would experience a significant increase in noise levels. These parcels wouldbe located immediately adjacent to the Runway 5 and 23 Ends, as shown on Figure 5-18. Under Alternative B4in 2020 and 2025, residential land (169 parcels totaling approximately 30 acres, and 108 parcels totalingapproximately 18.5 acres, respectively) would be the largest land area affected by significant increases in noisedue to Alternative B4 when compared to the No-Action Alternative. These residential areas are locatedimmediately adjacent to the Runway 5 End, as shown on Figure 5-22. In both 2020 and 2025, Alternative B2would expose fewer acres of residential land uses to significant noise impacts than Alternative B4. This isbecause under Alternative B2, more residential acquisitions are required for construction of Fully Relocated<strong>Airport</strong> Road north of the <strong>Airport</strong> and therefore reduce the number of exposed residential parcels; and becauseunder Alternative B4 the extension of Runway 5-23 is to the south of the <strong>Airport</strong> resulting in increased aircraftoperations over a predominantly residential area. As discussed under Section 5.3, Noise, all noise-sensitive landuses impacted by a significant increase in noise would be eligible for sound insulation mitigation.292 14 CFR Part 150, <strong>Airport</strong> Noise Compatibility Planning, paragraph 150.7.Chapter 5 - Environmental Consequences 5-47 July 2011\\mawatr\ev\09228.00\reports\<strong>FEIS</strong>_Final_July_2011\<strong>PVD</strong>_CH05_Environmental_Cons_JUL_2011.doc
T.F. <strong>Green</strong> <strong>Airport</strong> <strong>Improvement</strong> <strong>Program</strong>Environmental Impact Statement and Final Section 4(f) Evaluation5.4.2.2 Additional AnalysesIn addition to evaluating the affects of significant noise impacts on noise-sensitive land uses (residential), thecompatible land use analysis also considers other noise impacts, such as noise-sensitive land uses and zoningdistricts exposed to noise levels of DNL 65 dB and above as well as the changes in land uses associated with themandatory land acquisition related to construction, and land acquisition for noise mitigation, andFAA-recommended clearing of the RPZ areas for Alternatives B2 and B4. In accordance with the Part 150 NCP,the compatible land use analysis identifies residential land (in parcels and acres; the number of housing unitsare presented where applicable for comparison purposes to the noise, and social and socioeconomic analyses)within the DNL 70 dB contour that would be eligible for voluntary participation in a land acquisition program.Also in accordance with Part 150, as identified under Section 5.3, Noise, residences located between the DNL 65dB and 70 dB contours would be eligible for sound insulation.For the purposes of this <strong>FEIS</strong>, 100 percent participation in the VLAPs is assumed in order to disclose allpotential land use changes related to land acquisition. Property owners that initially elect not to participate in aVLAP continue to be eligible and could voluntarily participate at any time, contingent upon fundingavailability. Additionally, throughout RIAC’s ongoing Part 150 <strong>Program</strong>, the rate that residents choose tovoluntarily participate in the program ranges from 90 to 95 percent on average. 293 Land acquired for noisemitigation under RIAC’s ongoing Part 150 NCP (Completed and Current Part 150 VLAPs) were assumed toalready be acquired under Alternatives B2 and B4 as part of the compatible land use assessment and are notconsidered project-related mitigation. 2945.4.3 MethodologyLand use compatibility assessments include consideration of direct and indirect project-related impacts andcumulative impacts. The focus of the analysis is compatibility of residential land uses with airport-related noise.The analysis also assesses the impacts of land acquisition on land use and zoning patterns in the City ofWarwick and evaluates consistency with applicable land use plans.5.4.3.1 Methodology for Identifying Compatible and Incompatible Land UsesLand use compatibility is defined by the FAA as “use of land that is identified as normally compatible with theoutdoor noise environment (or an adequately attenuated noise level reduction for any indoor activities involved)at the location because the yearly day-night average sound level is at or below that identified for that or similaruse.” 295 Based on the criteria presented in Table 5-35, all land uses are considered to be compatible with noise levelsless than DNL 65 dB. The FAA and HUD established the threshold of land use compatibility at DNL 65 dB basedon a nation-wide survey that measured public responses to aircraft noise, in particular levels of annoyance inrelation to aircraft noise. 296,297 Several land use categories (residential, public use, and outdoor music shells) are notconsidered to be compatible with noise levels of DNL 65 dB or higher. Where the community determines thatthese uses must be allowed within the DNL 65 dB, the FAA recommends that a noise reduction measures for293 More recently, as evident under the Current Part 150 VLAP, participation has declined slightly to approximately 90 percent. This decrease is due to the currenteconomic conditions, including more stringent guidelines for obtaining mortgages. For the purposes of this <strong>FEIS</strong>, 100 percent participation is assumed.294 The Completed Part 150 VLAP was completed in 2009 and the Current Part 150 VLAP, a continuation of RIAC’s Part 150 NCP, was initiated in early 2010 and isscheduled to be completed by 2015. The Alternative B2 and B4 VLAPs would begin as soon as 2012 for Alternative B4 and in 2020 for Alternative B2.295 14 CFR Part 150, <strong>Airport</strong> Noise Compatibility Planning, paragraph 150.7.296 FAA Order 1050.1E Environmental Impacts: Policies and Procedures, June 8, 2004.297 Environmental Criteria and Standards of the Department of Housing and Urban Development, Department of Housing and Urban Development, 24 Code ofFederal Regulations Part 51; 44 Federal Register 40861, Washington, DC, July 12, 1979.Chapter 5 - Environmental Consequences 5-48 July 2011\\mawatr\ev\09228.00\reports\<strong>FEIS</strong>_Final_July_2011\<strong>PVD</strong>_CH05_Environmental_Cons_JUL_2011.doc
T.F. <strong>Green</strong> <strong>Airport</strong> <strong>Improvement</strong> <strong>Program</strong>Environmental Impact Statement and Final Section 4(f) Evaluationaircraft operations be implemented to achieve allowable noise levels. Noise attenuation measures, such as soundinsulation that would reduce the noise level by 25, 30, or 35 dB, should be implemented in the design andconstruction of a structure. Commercial, industrial, and agricultural uses; however, are considered to becompatible with all noise levels and do not require noise level reduction measures.5.4.3.2 Compatible Land Use Impact Assessment MethodologyCompatible land use impacts (in parcels and acres) for the No-Action Alternative and Alternatives B2 and B4include the proposed land acquisitions and noise compatibility with existing land uses. The compatible land useanalysis also considers changes in noise levels on residential land uses, zoning districts, and non-residentialnoise-sensitive sites as well as consistency with applicable local, regional, and state land use plans and policiesfor Alternatives B2 and B4. Parameters evaluated for the direct land use impact assessment include:• The size (acreage), number of parcels, and general location of land uses requiring full property acquisitions,including those properties that would be acquired for construction (mandatory) or eligible for acquisitionfor under a Future Build VLAP or for RPZ clearing (as recommended by the FAA), as well as theidentification of partial property acquisitions.• The size (acreage), number of parcels, and general location of incompatible land uses (residential land usesexposed to a noise level of DNL 65 dB and above).• The size (acreage), number of parcels, and general location of land uses exposed to significant increases innoise levels of Alternatives B2 and B4 compared to the No-Action Alternative in order to determine if landuses would become incompatible (described further below).In order to identify the land uses (in parcels and acres) that would be affected by increases in noise underAlternatives B2 and B4, the future noise contours (2015, 2020, and 2025) for the No-Action Alternative andAlternatives B2 and B4 (2015 for Alternative B4 only, and 2020 and 2025) were superimposed over the baselineland use data, and the number of parcels and acreage of land use types were calculated. The residential landuses that would be exposed to DNL 65 dB and above were determined after first excluding the land acquisitionsthat would be required for construction (mandatory), the Current Part 150 VLAP, Future Build VLAPs, andFAA-recommended RPZ clearing purposes. Refer to Section 5.1.4, Land Acquisition Assumptions, for detailedassumptions for identifying properties to be acquired.Identification of Significant ImpactsChanges in land use compatibility were examined by comparing Alternatives B2 and B4 to the No-ActionAlternative in order to determine if significant noise impacts would occur (increase of at least DNL 1.5 dB at orabove DNL 65 dB) to incompatible land uses (residential and other noise-sensitive land uses), in accordancewith FAA Order 1050.1E (refer to Table 5-6 above). Section 5.3, Noise, identifies the significant changes in noiselevels on non-residential noise-sensitive sites for Alternatives B2 and B4.5.4.3.3 Temporary Impacts from Short-Term Construction Activities Assessment MethodologyImpacts to land use due to construction activities for the <strong>Improvement</strong> <strong>Program</strong> would be temporary and wouldbe associated with construction staging areas, and road closures or relocations. Details on the locations ofstaging areas and any road closures are not known at this time.Chapter 5 - Environmental Consequences 5-49 July 2011\\mawatr\ev\09228.00\reports\<strong>FEIS</strong>_Final_July_2011\<strong>PVD</strong>_CH05_Environmental_Cons_JUL_2011.doc
T.F. <strong>Green</strong> <strong>Airport</strong> <strong>Improvement</strong> <strong>Program</strong>Environmental Impact Statement and Final Section 4(f) EvaluationTable 5-35Federally Defined Land Use Compatibility with Annual Day-Night Average SoundLevel (DNL)Annual DNL in DecibelsLand Use 85ResidentialResidential other than mobile homes and transient lodgings Y N 2 N 2 N N NMobile home parksTransient lodgingsYYNN 2NN 2NN 2NNNNPublic UseSchools Y N 2 N 2 N N NHospitals and nursing homesChurches, auditoriums, and concert hallsGovernmental servicesYYY25 125 1Y30 130 125 1 NN30 1 NNNNNNTransportationParkingYYYYY 3Y 3 Y 4Y 4 Y 5Y 5 Y 5NCommercial UseOffices, business and professionalWholesale and retail building materials, hardware and farm equipmentRetail trade – generalUtilitiesYYYYYYYY25 1Y 325 1Y 3 30 1Y 430 1Y 4NY 5NY 5NNNNCommunication Y Y 25 1 30 1 N NManufacturing and ProductionManufacturing – generalPhotographic and OpticalAgriculture (except livestock) and forestryLivestock farming and breedingYYYYYYY 7Y 7 Y 325 1Y 8Y 8 Y 430 1Y 9NMining and fishing, resource production and extraction Y Y Y Y Y YRecreationalOutdoor sports arenas and spectator sports Y Y 6 Y 6 N N NOutdoor music shells, amphitheaters Y N N N N NNature exhibits and zoos Y Y N N N NAmusements, parks, resorts and camps Y Y Y N N NSource: FAA Order 1050.1E.Notes:Y (YES) – Land use and related structures compatible without restrictions;N (NO) – Land use and related structures are not compatible and should be prohibited.Noise Level Reduction (NLR) (outdoor to indoor) to be achieved through incorporation of noise attenuation into the design and construction of the structure.1 25, 30, or 35 – Land use or related structures generally compatible; measures to achieve NLR of 25, 30 or 35 dB must be incorporated into design or constructionof structure.2 Where the community determines that residential or school uses must be allowed, measures to achieve outdoor to indoor NLR of at least 25 dB and 30 dB shouldbe incorporated into building codes and be considered in individual approvals. Normal residential construction can be expected to provide a NLR of 20 dB, thusthe reduction requirements are often stated as 5, 10 or 15 dB over standard construction and normally assume mechanical ventilation and closed windows yearround. However, the use of NLR criteria will not eliminate outdoor noise problems.3 Measures to achieve NLR of 25 dB must be incorporated into the design and construction of portions of these buildings where the public is received, office areas,noise-sensitive areas or where the normal noise level is low.4 Measures to achieve NLR of 30 dB must be incorporated into the design and construction of portions of these buildings where the public is received, office areas,noise-sensitive areas or where the normal noise level is low.5 Measures to achieve NLR of 35 dB must be incorporated into the design and construction of portions of these buildings where the public is received, office areas,noise-sensitive areas or where the normal noise level is low.6 Land use compatible provided special sound reinforcement systems are installed.7 Residential buildings require an NLR of 25.8 Residential buildings require an NLR of 30.9 Residential buildings not permitted.Y 5NY 9NNNY 9NChapter 5 - Environmental Consequences 5-50 July 2011\\mawatr\ev\09228.00\reports\<strong>FEIS</strong>_Final_July_2011\<strong>PVD</strong>_CH05_Environmental_Cons_JUL_2011.doc
T.F. <strong>Green</strong> <strong>Airport</strong> <strong>Improvement</strong> <strong>Program</strong>Environmental Impact Statement and Final Section 4(f) Evaluation5.4.3.4 Cumulative Impacts MethodologyIn general, the cumulative impacts analysis includes an area-wide land use trends analysis with and withoutAlternatives B2 and B4. Cumulative impacts were assessed for the approximately 6,140-acre Study Area(Figure 4-6). Historical land uses were documented from the 1930s (the construction of the <strong>Airport</strong>) to thepresent day. Future land use changes are based on known planned and permitted developments to becompleted by 2020 (Table 5-5) as well as local and regional land use and Statewide Planning <strong>Program</strong> reportsfor projected growth trends analysis that project as far out as 2025.5.4.4 Impact AssessmentThis section summarizes the compatible land use impacts associated with proposed land acquisitions and noisecompatibility for Alternatives B2 and B4, and the No-Action Alternative. Compatible land use impacts arepresented in land area (parcels and acres) and for comparison purposes only housing units are presented, whereapplicable, to be consistent with the noise and social (housing) impact assessments of Sections 5.3, Noise, and5.5, Social and Socioeconomic, and Environmental Justice Populations and Children’s Health and Safety Risks,respectively. Reasonable consistency with the City of Warwick’s Zoning Ordinance and local, regional, and stateplanning efforts as well as cumulative impacts and short term impacts from temporary construction activitiesare also discussed. Section 5.3, Noise, identifies the significant changes in noise levels on non-residentialnoise-sensitive sites for the Alternatives B2 and B4.5.4.4.1 Induced DevelopmentNeither FAA nor RIAC has regulatory authority to control land uses; this falls under the jurisdiction of the Cityof Warwick through its Comprehensive Plan and Zoning Ordinance. Upon completion of this <strong>FEIS</strong> and inaccordance with FAA guidelines (specifically <strong>Program</strong> Guidance Letter 08-2, or PGL 08-2, dated February 1,2008), RIAC will update the T.F. <strong>Green</strong> <strong>Airport</strong> Noise Land Reuse Plan (as EIS projects are implemented orwithin 18 months of the issuance of the ROD, whichever comes first) for the areas that would be acquired underits Part 150 NCP, or “noise lands.” The noise lands are mostly zoned residential, and are generally surroundedby residential neighborhoods and accessed by residential streets. It is assumed that the noise lands would notcontinue as a residential use since this land use is incompatible with FAA-defined airport-related noise levels, andthat it would become airport property. Consistent with FAA guidance, RIAC will first evaluate if noise lands areneeded for airport purposes and if not, consideration may be given to non-noise-sensitive land uses, such ascommercial or recreational facilities. At this time, the City of Warwick’s Comprehensive Plan does not includerezoning these residential areas to commercial, retail, or other non-residential uses.Because the Noise Land Reuse Plan would be updated after issuance of the ROD, there are no reasonablyforeseeable redevelopment options for the noise lands, except for potential relocation of Winslow Field. Therefore,any reuse for these areas for the purposes of the <strong>FEIS</strong> would be speculative, as there are many potential reusepossibilities in different areas around the <strong>Airport</strong>, depending on the size of the available vacant land, access to thatland, and the City of Warwick’s planning process. RIAC will continue to consult with the City of Warwick todevelop compatible land uses for those lands deemed not required for airport purposes.Chapter 5 - Environmental Consequences 5-51 July 2011\\mawatr\ev\09228.00\reports\<strong>FEIS</strong>_Final_July_2011\<strong>PVD</strong>_CH05_Environmental_Cons_JUL_2011.doc
T.F. <strong>Green</strong> <strong>Airport</strong> <strong>Improvement</strong> <strong>Program</strong>Environmental Impact Statement and Final Section 4(f) EvaluationFurthermore, there is no indication that the No-Action Alternative or Alternatives B2 and B4 wouldindependently induce a significant amount of new development; therefore, no indirect impacts on land usefrom induced development are anticipated. The presence of the <strong>Airport</strong> has resulted in airport-related activitieslocated in the City of Warwick. According to the City’s Comprehensive Plan, future development plans includeindustrial, commercial, and retail uses along Jefferson Boulevard and mixed use development as part of theWarwick Station Redevelopment District (WSRD)—not along existing <strong>Airport</strong> Road or Main Avenue, where theareas of potential future acquisition would be. Therefore, in the future, it can be expected that establishedcommercial strips, such as Post Road and Jefferson Boulevard, will continue to experience changes in land usesthat could serve both passenger and cargo activity under the No-Action Alternative and Alternatives B2 and B4.5.4.4.2 No-Action AlternativeThis section summarizes the compatible land use impacts under the No-Action Alternative, which include landacquisition of residential land due to the continuation of RIAC’s Part 150 NCP, including the Completed andCurrent Part 150 VLAPs. Specifically, those residences located in areas exposed to noise levels of DNL 70 dBand above would be eligible for voluntary participation in an acquisition program. Direct land use impacts dueto the No-Action Alternative also include those non-compatible noise-sensitive land uses (residential) exposedto noise levels of DNL 65 dB and above.Land AcquisitionIn 2009, all seven phases of the Completed Part 150 VLAP were complete. The Completed Part 150 VLAPconsisted of 285 residential parcels consisting of 280 housing units located in seven noise-impacted areas inclose proximity to the <strong>Airport</strong>, of which RIAC has secured 270 accepted offers. While not all eligible propertyowners elected to participate in the Completed Part 150 VLAP they could voluntarily participate at any time,contingent upon funding availability. In early 2010, RIAC continued the Part 150 NCP based on an updatedNEM (accepted by the FAA), which was derived from the Level 6 2020 No-Action Alternative DNL 70 dB noisecontour with additional neighborhood rounding, as documented in the DEIS. The Current Part 150 VLAPincludes 115 residential parcels (consisting of 135 residential units) eligible for voluntary participation in anacquisition program due to non-project-related noise (shown on Figure 5-8 and presented below in Table 5-36).While the impacts are predicted to occur in 2020 for the No-Action Alternative, for the purposes of this <strong>FEIS</strong>, itis assumed that those homes would be acquired by 2015. As of January 2011, three phases of the Current Part150 VLAP have been initiated and 70 residential properties (out of 115) have opted to participate.To compare to the noise and socioeconomic impact assessments, Table 5-36 also presents the total residentialland (in parcels and acres) and housing units assumed to be acquired under a Future No-Action VLAP due topredicted increases in noise in 2025 based on the projected 2025 No-Action Alternative DNL 70 dB and abovenoise level (based on the <strong>FEIS</strong> noise contours). The 2025 noise contours are based on projected natural growth ofthe <strong>Airport</strong> without the <strong>Improvement</strong> <strong>Program</strong>. Actual future land acquisitions for noise mitigation would beidentified by a future FAA-accepted 2025 NEM.Chapter 5 - Environmental Consequences 5-52 July 2011\\mawatr\ev\09228.00\reports\<strong>FEIS</strong>_Final_July_2011\<strong>PVD</strong>_CH05_Environmental_Cons_JUL_2011.doc
T.F. <strong>Green</strong> <strong>Airport</strong> <strong>Improvement</strong> <strong>Program</strong>Environmental Impact Statement and Final Section 4(f) EvaluationTable 5-36No-Action Alternative: Residential Land Assumed to be Acquired under a No-ActionVoluntary Land Acquisition <strong>Program</strong>Analysis YearCurrent Part 150 VLAP 1LocationRunway 5 EndRunway 23 EndAcres16.013.029.00.00.80.8Parcels5956115033HousingUnits5580135033Sub-TotalTotal 2025 No-Action Noise Mitigation Acquisitions 2Runway 5 EndRunway 23 EndSub-TotalTotal Runway 5 End 16.0 59 55Total Runway 23 End 13.8 59 83Source: RIGIS: Field verification by VHB, Inc., 2005; City of Warwick Assessor’s Parcel Data.Note: Includes undeveloped or vacant residential parcels exposed to noise levels DNL 70 dB and above.1 Based on the FAA-accepted updated 2020 NEM, which includes residential land within the 2020 No-Action DNL 70 dB noise contour. All parcels are assumed to be acquired by 2015. As of January 2011, three phases of the Current Part 150 VLAP have been initiated and 70 residential properties (out of the 115) haveopted to participate.2 Assumed to be within the EIS 2025 DNL 70 dB noise contour for the No-Action Alternative (for comparison purposes). Actual future land acquisitions would beidentified by a future FAA-accepted NEM.Under the Current Part 150 VLAP, based on the FAA-accepted 2020 NEM, it is assumed that 59 residential parcels at theRunway 5 End and 56 residential parcels at the Runway 23 End (a total of 135 housing units) would be acquired by2015. As a result of non-project-related airport growth, in 2025, it is assumed that three residential parcels with threehousing units at the Runway 23 End would be exposed to noise levels of DNL 70 dB and above under the No-ActionAlternative and, therefore, eligible for acquisition under a Future VLAP (actual future land acquisitions would beidentified by a future FAA-accepted updated NEM). For this <strong>FEIS</strong> analysis, it is assumed that all eligible parcels wouldbe acquired. Because neither FAA nor RIAC has regulatory authority for controlling land uses, which fall under thejurisdiction of the City of Warwick through its Comprehensive Plan and Zoning Ordinance, there are no reasonablyforeseeable redevelopment options for the areas that would be acquired under the VLAP for the No-Action Alternative.Land Use CompatibilityThe future No-Action Alternative would result in an increase in certain areas being newly exposed to noiselevels of DNL 65 dB and above. 298 This is due to the predicted increase in aircraft operations in future yearswithout the extension of Runway 5-23. Figure 5-17 shows the generalized land use and No-Action Alternativenoise contours for 2015, 2020, and 2025. Table 5-37 presents the residential land uses that would be exposed tonoise levels of DNL 65 dB and above under the No-Action Alternative and Alternatives B2 and B4 in 2015, 2020,and 2025. Homes located in areas exposed to noise levels between DNL 65 dB and 69 dB would be eligible forsound insulation, while residential parcels exposed to DNL 70 dB and above would be eligible for landacquisition under the Current Part 150 VLAP, as presented previously in Table 5-36. 299298 Environmental Desk Reference for <strong>Airport</strong> Actions, FAA, October 5, 2007 Chapter 5, Compatible Land Use.299 14 CFR Part 150, Noise Compatibility Planning, paragraph 150.7, RIAC is undertaking a noise mitigation program, which has included land acquisition andsound insulation.Chapter 5 - Environmental Consequences 5-53 July 2011\\mawatr\ev\09228.00\reports\<strong>FEIS</strong>_Final_July_2011\<strong>PVD</strong>_CH05_Environmental_Cons_JUL_2011.doc
T.F. <strong>Green</strong> <strong>Airport</strong> <strong>Improvement</strong> <strong>Program</strong>Environmental Impact Statement and Final Section 4(f) EvaluationTable 5-37All Alternatives: Residential Land Exposed to DNL 65 dB and above in Study AreaParcels(TotalParcels)2015Percent of AcresTotal (TotalParcels Acres)Percent ofTotalAcresParcels(TotalParcels)2020Percent of AcresTotal (TotalParcels Acres)Percent ofTotalAcresParcels(TotalParcels)2025Percent ofTotalParcelsAcres(TotalAcres)Percent ofTotalAcresNo-Action 914Alternative 1 (1,082) 85% 148 (257) 58%Alternative 913B2 2,3,4 (1,090) 84% 148 (261) 57%1,103(1,287) 86% 187 (314) 60%1,128(1,290) 87% 195 (330) 59%1,438(1,670) 86% 256 (420) 61%1,359(1,559) 87% 238 (410) 58%Alternative 1,007B4 2,5 (1,167) 86% 175 (280) 63%1,156(1,340) 86% 205 (329) 62%1,389(1,670) 86% 244 (410) 60%Source: RIGIS; Field verification by VHB, Inc., 2005; City of Warwick Assessor’s Parcel Data.Note: All land uses fall within the City of Warwick. Total parcels and acres exposed to DNL 65 dB and above within the Study Area.1 Refer to Figure 5-17.2 Includes the No-Action Alternative residential land exposed to the DNL 65 dB noise level.3 Refer to Figure 5-18.4 As discussed in Section 5.3, Noise, while the runway use and number of operations would not change for Alternative B2 in 2015 compared to the No Action Alternative, the runway thresholds would change due to the runway safety area enhancements to Runway 16-34 in 2015 and, therefore, result in changes tothe shape of the noise contours and the incompatible land uses (residential) affected.5 Refer to Figures 5-21 and 5-22.Under the No-Action Alternative, between 2015 and 2020, the area of residential land (acres) that would be exposedto noise levels of DNL 65 dB and above would increase by approximately 26 percent. Between 2020 and 2025, thearea of residential land (acres) that would be exposed to noise levels of DNL 65 dB and above would increase byapproximately 37 percent under the No-Action Alternative. Land use compatibility (the amount of residential landexposed to DNL 65 dB and above) for Alternatives B2 and B4 are discussed further in the sections below.5.4.4.3 Alternative B2This section presents a summary of the compatible land use impacts (mandatory and voluntary landacquisitions, and changes in noise levels) under Alternative B2. Short-term impacts due to temporaryconstruction activities for Alternative B2 are also summarized.Land AcquisitionTable 5-38 summarizes the full parcels and acreage that would be acquired as a result of Alternative B2.Alternative B2 would require mandatory acquisition of 126 parcels, including residential, commercial,industrial, agriculture, undeveloped, and state-owned parcels totaling approximately 43.4 acres with67 residential units and 38 businesses by 2020 to accommodate construction. Forty-eight of these parcels totalingapproximately 16 acres (out of 126 parcels totaling 43.4 acres total) consisting of mostly commercial land useswould be acquired by 2015 for construction of the safety enhancements. For FAA-recommended RPZ clearing, atotal of 80 parcels (approximately 24 acres) consisting of mostly residential land (a total of 134 units) located atthe Runway 5 and 23 Ends would be acquired. Other uses that would fall within the newly created RPZ areasinclude commercial and industrial, and undeveloped, as noted in Table 5-38.Chapter 5 - Environmental Consequences 5-54 July 2011\\mawatr\ev\09228.00\reports\<strong>FEIS</strong>_Final_July_2011\<strong>PVD</strong>_CH05_Environmental_Cons_JUL_2011.doc
T.F. <strong>Green</strong> <strong>Airport</strong> <strong>Improvement</strong> <strong>Program</strong>Environmental Impact Statement and Final Section 4(f) EvaluationTable 5-38 Alternative B2: Summary of Full Land Acquisitions in 2020Noise Mitigation FAA-Recommended RPZConstruction (Mandatory) 1 (Voluntary) 2 Clearing (Voluntary) 3 TotalLand Use Parcels AcresUnits/Businesses Parcels AcresUnits/Businesses Parcels AcresUnits/Businesses Parcels AcresUnits/BusinessesResidential 65 13.7 67 units 41 9.0 36 units 64 17.0 134 units 170 39.7 237Commercial 46 19.5 37 NA NA NA 3 5.2 3 5 49 24.7 37and Industrial 4Agriculture 7 9.1 1 NA NA NA 0 0 0 7 9.1 1Undeveloped 6 7 0.9 0 NA NA NA 13 1.5 0 20 2.4 0State-owned 1 0.2 0 NA NA NA 0 0 0 1 0.2 0Total 126 43.4 67 units, 41 9 36 units 80 23.7 134 units, 247 76.1 237 units,38 businesses 3 businesses 41 businessesSource: RIGIS: Field verification by VHB, Inc., 2005; City of Warwick Assessor’s Parcel Data.Notes: All acquisitions are within the City of Warwick.NA Not Applicable. According to the FAA, commercial land uses are compatible with airport operations and, therefore, are not eligible for acquisition for noise mitigation.1 48 parcels (approximately 16 acres) of mostly commercial land uses would be acquired by 2015 for construction of the safety enhancements. 2 Assumes residential land acquisition between 2020 and 2025 for all parcels directly impacted by a noise level of DNL 70 dB and above in 2020 and those properties identified in order to maintain neighborhood cohesion and limit community disruption. However, it is RIAC’s intention to begin to acquire residentialparcels as soon as 2012, subject to availability of funding.3 RPZ clearing is FAA-recommended, not required and, therefore, RPZ-related property acquisition would be subject to funding availability.4 Includes commercial (sale of products and services), commercial/industrial mixed, and industrial land uses.5 For the purposes of the EIS analysis, it is assumed that there would be 100 percent participation for parcels within the newly created RPZ area. For commercialbusinesses located within the RPZ, it is anticipated that business owners would not choose to participate as most business types are not disturbed by airportactivities and are viewed by FAA criteria as compatible land uses. Additionally, some businesses benefit economically from proximity to an airport.6 Includes wetlands and forested land.As discussed in Section 5.3, Noise, while the runway use and number of operations would not change forAlternative B2 in 2015 compared to the No-Action Alternative, the runway thresholds would change underAlternative B2 compared to the No-Action Alternative due to the runway safety area enhancements toRunway 16-34. These changes in turn would result in changes to the shape of the noise contours and theincompatible land uses (residential) affected. Based on the <strong>FEIS</strong> 2015 DNL 70 dB noise contour, no residentialland would be exposed to noise levels that would result in property acquisition for noise mitigation in 2015.Under Alternative B2, a total of 41 residential parcels (totaling nine acres and consisting of 36 housing units)have been identified as eligible for noise mitigation acquisition under a Future Build VLAP (parcels that wouldbe exposed to noise levels of DNL 70 dB and above in 2020, and properties identified in order to maintainneighborhood cohesion and limit community disruption). For the purposes of this <strong>FEIS</strong> analysis, it is assumedthat these properties would be acquired between 2020 and 2025 for noise mitigation; however, it is RIAC’sintention to begin to acquire residential parcels as soon as 2012, subject to availability of funding. Theseproperties are located at the Runway 23 and 5 Ends.In 2025, 26 residential parcels (consisting of 23 units) would be exposed to noise levels of DNL 70 db and aboveand, therefore, eligible for land acquisition for noise mitigation. Actual eligible residential properties would bedetermined by a future FAA-accepted NEM (as discussed in Section 5.3, Noise).In addition to the full parcels in Table 5-38, Alternative B2 would result in a total of 27 parcels required for partial landacquisitions for construction (mandatory), the majority of which are related to the Fully Relocated <strong>Airport</strong> Road. Table 5-39provides the full list of land partial acquisitions for Alternative B2 by land use type and associated program element.Chapter 5 - Environmental Consequences 5-55 July 2011\\mawatr\ev\09228.00\reports\<strong>FEIS</strong>_Final_July_2011\<strong>PVD</strong>_CH05_Environmental_Cons_JUL_2011.doc
T.F. <strong>Green</strong> <strong>Airport</strong> <strong>Improvement</strong> <strong>Program</strong>Environmental Impact Statement and Final Section 4(f) EvaluationTable 5-39Alternative B2: Partial Parcels Required for Construction (Mandatory)Terminal Partially Fully IntegratedAccess Relocated Relocated Cargo TotalLand Use Type Runway 16 Runway 23 Roadways <strong>Airport</strong> Road <strong>Airport</strong> Road Facility <strong>Program</strong>Residential 0 0 0 0 8 0 8Commercial and Industrial 1 1 0 1 4 10 0 16Cropland 0 0 0 0 2 0 2Wetland 0 0 0 0 1 0 1Total 1 0 1 4 21 0 27Sources: RIGIS; Field verification by VHB, Inc., 2005; City of Warwick Assessor’s Parcel Data.1 Includes commercial (sale of products and services) and commercial and industrial mixed l land uses.The partial acquisitions required for Alternative B2, most of which affect commercial properties, are generallyrelated to the potential loss of parking area of businesses or back yard area of residences for both construction ofrunway enhancements and relocation of <strong>Airport</strong> Road.Land Use CompatibilityFigure 5-18 shows the land uses that would be exposed to the DNL 65 dB and above noise levels in 2015, 2020,and 2025 for Alternative B2 compared to the No-Action Alternative. The changes in land use compatibility forAlternative B2 in 2015, 2020, and 2025 are presented in Table 5-40. In comparison to the No-Action Alternative, by2025, Alternative B2 would result in fewer parcels of noise-sensitive land uses being newly exposed to federallydefined land use compatibility regulations for incompatible noise levels of DNL 65 dB and above, for residential landuses. 300 This reduction is attributed to the mandatory residential acquisitions for construction in 2015 and 2020,and land acquisition for noise mitigation and the RPZ areas (to be completed between 2020 and 2025).Table 5-40Alternative B2: Residential Land Exposed to DNL 65 dB and Above Compared to theNo-Action Alternative2015 1 2020 2025Alternative Parcels Acres Parcels Acres Parcels AcresNo-Action Alternative 914 148 1,103 187 1,438 256Alternative B2 913 148 1,128 195 1,359 238Alternative B2 Change from No-Action Alternative -1 0 +25 +8 -79 -18Percent Change -0.1% 0% +2% +4% -5% -7%Sources: RIGIS; Field verification by VHB, Inc., 2005; City of Warwick Assessor’s Parcel Data.Notes: All land uses fall within the City of Warwick. The residential land uses that would be exposed to DNL 65 dB and above were determined after first excluding thenon-project-related residential land acquisitions that would be acquired under the Completed and Current Part 150 VLAPs, and project-related mandatory (forconstruction) and residential land acquisitions (for noise mitigation and RPZ clearing).1 As discussed in Section 5.3, Noise, while the runway use and number of operations would not change for Alternative B2 in 2015 compared to the No-ActionAlternative, the runway thresholds would change due to the runway safety area enhancements to Runway 16-34 in 2015 and, therefore, result in changes to theshape of the noise contours and the incompatible land uses (residential) affected.300 14 CFR Part 150, Noise Compatibility Planning.Chapter 5 - Environmental Consequences 5-56 July 2011\\mawatr\ev\09228.00\reports\<strong>FEIS</strong>_Final_July_2011\<strong>PVD</strong>_CH05_Environmental_Cons_JUL_2011.doc
T.F. <strong>Green</strong> <strong>Airport</strong> <strong>Improvement</strong> <strong>Program</strong>Environmental Impact Statement and Final Section 4(f) EvaluationIn 2015, Alternative B2 would result in a slight decrease in the amount of residential land uses exposed to DNL 65 dBand above (by one parcel representing a less than one percent decrease) compared to the No-Action Alternative. Asdiscussed in Section 5.3, Noise, the shifting in noise contour is due to changes in runway thresholds due toconstruction of the runway safety area enhancements to Runway 16-34. No non-residential noise-sensitive siteswould be newly exposed to noise levels of DNL 65 dB and above under Alternative B2 in 2015.In 2020, Alternative B2 would result in an increase in the amount of residential land uses exposed to DNL 65 dBand above by 25 parcels totaling approximately eight acres (representing a four percent increase in land area)compared to the No-Action Alternative. This increase is due to an increase in operations and because theresidential acquisitions for the Future Build VLAP for noise mitigation would not be completed before 2020(acquisitions assumed to occur between 2020 and 2025). In 2020 under Alternative B2, one non-residentialnoise-sensitive site, Baha’i Faith (PW039), would be exposed to noise levels that would make the site eligible forsound insulation (DNL 65 dB and above when compared to the No-Action Alternative); however, this site hasbeen sound insulated as part of a previous sound insulation effort under the Part 150 NCP (Table 5-10).In 2025, Alternative B2 would decrease the amount of residential land uses exposed to DNL 65 dB and above by79 parcels totaling approximately 18 acres compared to the No-Action Alternative (representing a seven percentdecrease). This decrease is a result of the residential acquisitions for noise mitigation (to be acquired between2020 and 2025) as well as for construction and RPZ-clearing associated with Alternative B2. Alternative B2would not newly expose any non-residential noise-sensitive sites to noise levels of DNL 65 dB or above in 2025.Significant Impacts: There are no significant noise impacts for any residential areas or non-residentialnoise-sensitive sites for Alternative B2 in 2015 because runway use and number of operations would not changefor Alternative B2 in 2015 compared to the No-Action Alternative, as discussed in Section 5.3, Noise. UnderAlternative B2, residential land uses would experience a significant increase in noise levels (increase of at leastDNL 1.5 dB at or above DNL 65 dB) in 2020 and 2025. As discussed in Section 5.3, Noise, residences on theseparcels would be eligible for sound insulation mitigation. Table 5-41 presents residential land uses affected bysignificant increases in noise due to Alternatives B2 and B4 when compared to the No-Action Alternative.Figure 5-18 shows the areas of significant noise impacts for Alternative B2 in 2020 and 2025.Table 5-41Alternatives B2 and B4: Significant Noise Impacts to Residential Land Uses201520202025Alternative Parcels AcresHousingUnits Parcels AcresHousingUnits Parcels AcresHousingUnitsAlternative B2 0 0 0 71 11.5 74 48 7.0 49Alternative B4 180 32.0 184 169 30.0 174 108 18.5 108Sources: RIGIS; Field verification by VHB, Inc., 2005; City of Warwick Assessor’s Parcel Data.Notes: All land uses fall within the City of Warwick. The total number of residential parcels and acres exposed to a significant increase in noise levels were determinedafter first excluding the non-project-related residential land acquisitions that would be acquired under the Completed and Current Part 150 VLAPs, and projectrelatedresidential land acquisitions (for construction, noise mitigation, and RPZ clearing).Chapter 5 - Environmental Consequences 5-57 July 2011\\mawatr\ev\09228.00\reports\<strong>FEIS</strong>_Final_July_2011\<strong>PVD</strong>_CH05_Environmental_Cons_JUL_2011.doc
T.F. <strong>Green</strong> <strong>Airport</strong> <strong>Improvement</strong> <strong>Program</strong>Environmental Impact Statement and Final Section 4(f) Evaluation5.4.4.4 Alternative B4This section summarizes the compatible land use impacts (mandatory and voluntary land acquisition, andchanges in noise levels) due to Alternative B4 in 2015, 2020 and 2025. By the end of 2015, under Alternative B4,the safety enhancements as well as the Runway 5-23 extension would be in place. In 2020, all the <strong>Improvement</strong><strong>Program</strong> projects would be completed and the extended Runway 5-23 would have been in operation for fiveyears. Short-term impacts due to temporary construction activities for Alternative B4 are also summarized.Land AcquisitionTable 5-42 summarizes the parcels and acreage that would be acquired due to Alternative B4. Figures 5-19 and5-20 show the locations of proposed acquisition by acquisition type and land use category south and north of the<strong>Airport</strong>, respectively. In 2015, Alternative B4 would result in mandatory acquisition of39 parcels due to construction consisting of 16 residential parcels totaling 2.5 acres (consisting of 11 housing units)the majority of which would be for roadway improvements associated with Realigned Main Avenue and 23commercial parcels totaling 5.5 acres (consisting of 12 businesses) due to construction, the majority of which wouldbe for the Runway 16 runway safety enhancements. For the FAA-recommended RPZ clearing, Alternative B4would result in land acquisition of 64 residential parcels totaling 14 acres (consisting of 60 housing units) at theRunway 5 End. There are no Runway 23 End RPZ-related land acquisitions because the Alternative B4 Runway 23End RPZ would remain in the same location as the No-Action Alternative Runway 23 End RPZ.Table 5-42Alternative B4: Summary of Full Land AcquisitionsLand UseParcelsConstruction(Mandatory) 1Units/Acres BusinessesParcelsNoise MitigationVoluntary) 2Units/Acres BusinessesFAA-Recommended RPZClearing (Voluntary) 3Units/Parcels Acres BusinessesParcelsAcresTotalUnits/BusinessesResidential 16 2.5 11 units 77 4 18 4 69 units 4 64 14 60 157 34.5 140 unitsCommercial 5235.512 businesses11 units,NANANA69 units,Total39 8.0 12 businesses 77 18 0 businesses 64 14 60 180 40.0Sources: RIGIS; Field verification by VHB, Inc., 2005; City of Warwick Assessor’s Parcel Data.Notes: All acquisitions are within the City of Warwick.NA Not Applicable. According to the FAA, commercial land uses are compatible with airport operations and, therefore, are not eligible for acquisition for noisemitigation.000235.512 businesses140 units,12 businesses1 Would be acquired by 2015 due to the expedited Alternative B4 construction schedule.2 Assumes residential land acquisition between 2020 and 2025 for all parcels directly impacted by a noise level of DNL 70 dB and above in 2020 and thoseproperties identified in order to maintain neighborhood cohesion and limit community disruption. However, it is RIAC’s intention to begin to acquire residentialparcels as soon as 2012, subject to availability of funding.3 All RPZ clearing is proposed for the Runway 5 End. There are no Runway 23 End RPZ-related land acquisitions because the Alternative B4 Runway 23 End RPZwould remain in the same location as the No-Action Alternative Runway 23 End RPZ. RPZ clearing is FAA-recommended, not required and, therefore, RPZrelatedproperty acquisition would be subject to funding availability.4 For the purposes of this <strong>FEIS</strong> analysis, it is assumed that two parcels totaling 0.5 acres and containing two housing units would be acquired for noise mitigationbetween 2015 and 2020 for noise impacts beginning in 2015. However, it is RIAC’s intention to begin to acquire residential parcels as soon as 2012, subject toavailability of funding.5 Includes commercial (sale of products and services) and commercial and industrial mixed land use categories.Chapter 5 - Environmental Consequences 5-58 July 2011\\mawatr\ev\09228.00\reports\<strong>FEIS</strong>_Final_July_2011\<strong>PVD</strong>_CH05_Environmental_Cons_JUL_2011.doc
T.F. <strong>Green</strong> <strong>Airport</strong> <strong>Improvement</strong> <strong>Program</strong>Environmental Impact Statement and Final Section 4(f) EvaluationIn 2015, two residential properties consisting of two housing units located at the Runway 5 End would beexposed to noise levels of DNL 70 dB and above and, therefore would be eligible for voluntary participation in aFuture Build VLAP for noise mitigation. For the purposes of this <strong>FEIS</strong> analysis, it is assumed that theseproperties would be acquired between 2015 and 2020 for noise impacts beginning in 2015; however, it is RIAC’sintention to begin to acquire residential parcels as soon as 2012, subject to availability of funding.A total of 75 residential parcels totaling approximately 17.5 acres (consisting of 67 housing units) would beexposed to noise levels of DNL 70 dB and above in 2020 and, therefore, would be eligible for noise mitigationunder a Future Build VLAP (includes properties identified in order to maintain neighborhood cohesion andlimit community disruption). For the purposes of this <strong>FEIS</strong> analysis, it is assumed that these residentialproperties – all of which are located adjacent to and south of the Runway 5 End in the <strong>Green</strong>woodneighborhood (Figure 5-19) – would be acquired between 2020 and 2025 for noise mitigation.In 2025, six residential parcels (consisting of three housing units) would be exposed to noise levels of DNL 70 dBand above based on the <strong>FEIS</strong> 2025 DNL 70 dB and above noise contour (as presented in Section 5.3, Noise) and,therefore, eligible for voluntary participation in a Future Build VLAP for noise mitigation. Actual eligibleresidential properties would be determined by a future FAA-accepted NEM.In addition to the full parcels listed in Table 5-42, in 2015, Alternative B4 would require several partial landacquisitions for construction (affecting 16 parcels total). Table 5-43 provides a full list of land partial acquisitionsfor Alternative B4 by land use type and associated program element.Table 5-43Alternative B4: Partial Parcels Required for Construction (Mandatory)Land Use Type Runway 16 Runway 23 1 RoadwaysTerminalAccessPartiallyRelocated<strong>Airport</strong> RoadRealignedMain AvenueIntegratedCargo FacilityTotal<strong>Program</strong>Residential 1 NA 0 0 6 0 7Commercial and Industrial 2 0 NA 1 6 0 0 7State 0 NA 0 1 0 0 1Cemetery 0 NA 0 0 1 0 1Total 1 NA 1 7 7 0 16Sources: RIGIS; Field verification by VHB, Inc., 2005; City of Warwick Assessor’s Parcel Data.1 There are no Runway 23 End RPZ-related land acquisitions because the Alternative B4 Runway 23 End RPZ would remain in the same location as the No-ActionAlternative Runway 23 End RPZ.2 Includes commercial (sale of products and services), commercial and industrial mixed, and industrial land uses.The Alternative B4 partial land acquisitions would mostly affect residential and commercial properties locatedat the Runway 16 and 5 Ends. These partial acquisitions would generally include the loss of parking area ofbusinesses or back yard area of residences due to the Partially Relocated <strong>Airport</strong> Road and Realigned MainAvenue Project components.Chapter 5 - Environmental Consequences 5-59 July 2011\\mawatr\ev\09228.00\reports\<strong>FEIS</strong>_Final_July_2011\<strong>PVD</strong>_CH05_Environmental_Cons_JUL_2011.doc
T.F. <strong>Green</strong> <strong>Airport</strong> <strong>Improvement</strong> <strong>Program</strong>Environmental Impact Statement and Final Section 4(f) EvaluationLand Use Compatibility - 2015Figure 5-21 shows the land uses that would be exposed to the DNL 65 dB and above noise levels in 2015 forAlternative B4 compared to the No Action Alternative. The residential areas that would be exposed to DNL 65 dBand above under Alternative B4 in 2015 are presented in Table 5-44. In comparison to the No-Action Alternative, in2015, Alternative B4 would result in an increase of noise-sensitive land uses (residential) newly exposed tofederally-defined incompatible noise levels of DNL 65 dB and above. 301In 2015 under Alternative B4, the amount of residential land exposed to DNL 65 dB and above would increaseby 93 parcels totaling 27 acres (representing an approximately 18 percent increase in land area) in the totalamount of residential land area that would be incompatible compared to the No-Action Alternative. Thisincrease is due to an increase in operations and because it is assumed that residential acquisitions for noisemitigation would not to be acquired before 2015.Table 5-44Alternative B4: Residential Land Exposed to DNL 65 dBCompared to the No-Action Alternative (2015)2015Alternative Parcels AcresNo-Action Alternative 914 148Alternative B4 1,007 175Alternative B4 Change from No-Action AlternativePercent Change+93+10%+27+18%Sources: RIGIS; Field verification by VHB, Inc., 2005; City of Warwick Assessor’s Parcel Data.Notes: All land uses fall within the City of Warwick. The residential land uses that would be exposed to DNL 65 dB and abovewere determined after first excluding the non-project-related residential land acquisitions that would be acquired underthe Completed and Current Part 150 VLAPs, and for project-related mandatory (for construction).In 2015 under Alternative B4, one non-residential noise-sensitive site, Baha’i Faith (PW039), would be exposedto noise levels that would make the site eligible for sound insulation (DNL 65 dB and above when compared tothe No-Action Alternative); however, this site has been sound insulated as part of a previous sound insulationeffort under the Part 150 NCP.Significant Impacts - 2015: Under Alternative B4, several noise-sensitive areas (residential land uses) wouldexperience a significant increase in noise levels (increase of at least DNL 1.5 dB at or above DNL 65 dB).Residential land uses (180 parcels totaling approximately 32 acres consisting of 184 residential units) would bethe largest land area affected by significant increases in noise when compared to the No-Action Alternative in2015 (Table 5-41, presented previously). These residential areas are located immediately adjacent to theRunway 5 and 23 Ends (Figure 5-21). These residences would be eligible for sound insulation mitigation.301 14 CFR Part 150, Noise Compatibility Planning.Chapter 5 - Environmental Consequences 5-60 July 2011\\mawatr\ev\09228.00\reports\<strong>FEIS</strong>_Final_July_2011\<strong>PVD</strong>_CH05_Environmental_Cons_JUL_2011.doc
T.F. <strong>Green</strong> <strong>Airport</strong> <strong>Improvement</strong> <strong>Program</strong>Environmental Impact Statement and Final Section 4(f) EvaluationLand Use Compatibility – 2020 and 2025Figure 5-22 shows the land uses that would be exposed to the DNL 65 dB and above noise levels in 2020 and 2025 forAlternative B4 compared to the No-Action Alternative. The residential areas that would be exposed to DNL 65 dBand above under Alternative B4 in 2020 and 2025 are presented in Table 5-45.Table 5-45Alternative B4: Residential Land Exposed to DNL 65 dB Compared tothe No-Action Alternative (2020, 2025)AlternativeNo-Action AlternativeAlternative B4Alternative B4 Change from No-Action AlternativePercent ChangeParcels1,1031,156+53+5%2020 2025AcresParcels1871,4382051,389+18-49+10%-3%Acres256244-12-5%Sources: RIGIS; Field verification by VHB, Inc., 2005; City of Warwick Assessor’s Parcel Data.Notes: All land uses fall within the City of Warwick. The residential land uses that would be exposed to DNL 65 dB and above were determined after first excluding thenon-project-related residential land acquisitions that would be acquired under the Completed and Current Part 150 VLAPs, and project-related mandatoryresidential land acquisitions (for construction, noise mitigation, and RPZ clearing).Under Alternative B4 in 2020, the amount of residential land exposed to DNL 65 dB and above would increaseby 53 parcels totaling approximately 18 acres (representing a five percent increase in land area) in the amount ofresidential land area that would be incompatible compared to the No-Action Alternative. One non-residentialnoise-sensitive site, Baha’i Faith (PW039), would be exposed to noise levels that would make the site eligible forsound insulation (DNL 65 dB and above when compared to the No-Action Alternative) in 2020 underAlternative B4; however, this site has already been sound insulated as part of a previous sound insulation effortunder the Part 150 NCP (Table 5-10).In 2025, the amount of incompatible residential land would be reduced by 49 parcels totaling 12 acres(representing a five percent decrease in land area) under Alternative B4 compared to the No-Action Alternative.This decrease is due to mandatory residential land acquisitions for construction, noise mitigation under theFuture Build VLAP (to be acquired between 2020 and 2025), and the Runway 5 End RPZ clearing.Alternative B4 would newly expose the John Wickes School (SCH524) to noise levels of DNL 65 dB and abovewhen compared to the No-Action Alternative in 2025 (Table 5-10). The John Wickes School has already beensound insulated as part of a previous sound insulation effort under the Part 150 NCP.Significant Impacts – 2020 and 2025: Under Alternative B4, several areas would experience a significant increase innoise levels (increase of at least DNL 1.5 dB at or above DNL 65 dB). Residential land (169 parcels totalingapproximately 30 acres consisting of 174 units in 2020, and 108 parcels totaling approximately 18.5 acres consisting of108 units in 2025) would be affected by significant increases in noise due to Alternative B4 when compared to the No-Action Alternative (Table 5-41). These residential areas are located immediately adjacent to the Runway 5 End(Figure 5-22). Residences on these parcels would be eligible for sound insulation mitigation.Chapter 5 - Environmental Consequences 5-61 July 2011\\mawatr\ev\09228.00\reports\<strong>FEIS</strong>_Final_July_2011\<strong>PVD</strong>_CH05_Environmental_Cons_JUL_2011.doc
T.F. <strong>Green</strong> <strong>Airport</strong> <strong>Improvement</strong> <strong>Program</strong>Environmental Impact Statement and Final Section 4(f) Evaluation5.4.5 Consistency with Land Use Plans and ZoningThis section assesses how Alternatives B2 and B4 are consistent with the state, regional, and local land use plansand policies. The following plans were reviewed to assess project consistency (Table 4-6 of Chapter 4, AffectedEnvironment, of this <strong>FEIS</strong>):• Rhode Island State Guide Plan, 2002 (currently being updated); 302• Land Use 2025: Rhode Island’s State Land Use Policies and Plan, April 2006; 303• City of Warwick Comprehensive Plan, 2002 (currently being updated); 304• Warwick Station Redevelopment District Master Plan, 1998; 305• T.F. <strong>Green</strong> <strong>Airport</strong> Area Economic Redevelopment Plan, October 1996; 306• Apponaug Village Master Plan, 2004; 307• City of Cranston, Rhode Island Comprehensive Plan, 2005 (interim update); 308• City of Warwick Rhode Island Consolidated Plan/Action Plan, 2005-2009, 2009; and• Rhode Island Five-Year Strategic Housing Plan: 2006-2010, June 2006. 3095.4.5.1 Rhode Island State Guide PlanUnder Chapter 45-22.2 of the Rhode Island General Laws, Rhode Island Comprehensive Planning and Land UseRegulation Act the Rhode Island Statewide Planning <strong>Program</strong> (the state’s Metropolitan Planning Organization) isresponsible for coordinating the review and approval of local comprehensive plans, amendments, and updates.The State Guide Plan has four functions. It sets long-range policy (generally twenty years), provides a means toevaluate and coordinate projects or proposals of state importance, sets standards for local comprehensive plans,and serves as a general background information source on various topics. The State Guide Plan establishes thegoals, policies, and plans or plan elements for the physical, economic, and social development of the state. 310As a subsidiary of the Rhode Island Economic Development Corporation, RIAC’s projects must conform to theapplicable provisions of the State Guide Plan. 311 Similarly, as a state agency, 312 RIAC’s projects must fall withinthe State Guide Plan or such projects must conform to the applicable municipality’s comprehensive plan to theextent consistent with the State Guide Plan. 313Draft Element 640: State of Rhode Island <strong>Airport</strong> System PlanThe State Guide Plan includes a specific element related to airports–Element 640: State of Rhode Island <strong>Airport</strong>System Plan (dated March 1984). In 2010, RIAC and the Statewide Planning staff finalized a proposed302 State Guide Plan, Report Number 101, Rhode Island Statewide Planning <strong>Program</strong>, Rhode Island Department of Administration Information Services, June2001 (revisions through June 2002).303 Land Use 2025: Rhode Island State Land Use Policies and Plan, State Guide Plan Element 121, Report Number 109, Rhode Island Department ofAdministration Division of Planning Statewide Planning <strong>Program</strong>, April 2006.304 City of Warwick Comprehensive Plan, City of Warwick Planning Commission updated 2002.305 Warwick Station Redevelopment District Master Plan, City of Warwick Planning Department and City of Warwick Department of Economic Development, July 1998.306 T.F. <strong>Green</strong> <strong>Airport</strong> Area Economic Redevelopment Plan, prepared by Sasaki Associates for the City of Warwick and the Central Rhode Island DevelopmentCorporation, October 1996.307 Apponaug Village Master Plan, Apponaug Area <strong>Improvement</strong> Association and the City of Warwick, prepared by The Cecil Group, Inc. and Edwards andKelcey, October 2004.308 City of Cranston Rhode Island Comprehensive Plan, Cranston Planning Department, February 1992 (last amended in September 7, 2005).309 Rhode Island Five Year Strategic Housing Plan: 2006-2010. Report Number 110, State Guide Plan Element 423, June 2006. Rhode Island Division of Planning.310 State Guide Plan Guide: How to Prepare and Maintain A State Guide Plan Element, R.I. Statewide Planning <strong>Program</strong>, September 2003.311 R.I. Gen. Laws section 42-64-14.312 As defined in section 45-22.2-4(29) of the Rhode Island Comprehensive Planning and Land Use Act.313 R.I. Gen. Laws section 45-22.2-10(e).Chapter 5 - Environmental Consequences 5-62 July 2011\\mawatr\ev\09228.00\reports\<strong>FEIS</strong>_Final_July_2011\<strong>PVD</strong>_CH05_Environmental_Cons_JUL_2011.doc
T.F. <strong>Green</strong> <strong>Airport</strong> <strong>Improvement</strong> <strong>Program</strong>Environmental Impact Statement and Final Section 4(f) Evaluationamendment to this Element 640. A public hearing was held on May 4, 2011 to receive public comments on theproposed new plan element. The proposed amendment to Element 640 represents RIAC’s plan for the stateairport system through the year 2021. The plan is applicable to facilities at Block Island (BID), Newport – RobertF. Wood (UUU), North Central (SFZ), Quonset (OQU), T. F. <strong>Green</strong> (<strong>PVD</strong>) and Westerly (WST). The proposedupdate inventories existing facilities and outlines enhancements that will be required for each airport tofunction within its designated role and to meet current and projected air transportation needs of the state inbalance with surrounding communities. The updated Plan “provides a valuable foundation for a balanced andintegrated system of airports with clearly defined roles developed in consideration of state, regional and localgoals and polices.” 314While the update of this element is not intended to recommend, support, or endorsespecific runway extension alternatives at T.F. <strong>Green</strong> <strong>Airport</strong>, it does support the EIS process as the appropriatevehicle to determine the preferred alternative. Alternatives B2 and B4 are consistent with the stated goals of the2010 State Guide Plan.5.4.5.2 Land Use 2025: Rhode Island’s State Land Use Policies and PlanThe purpose of the Rhode Island’s State Land Use Policies and Plan is to “guide and coordinate the land use plans andregulations of municipalities and State agencies and to direct good, strategic projects at both the State andmunicipal level.” 315 One of the land use policies related to airports is to “Develop land in the immediate vicinity ofairports in a manner that will be compatible with airport operations and to seek to minimize adverse impacts, ifany, to pre-existing land uses.” 316 Alternatives B2 and B4 are compatible with this land use policy because eachalternative supports the development of land that is compatible with airport operations. Through the previous,Current Part 150 , and Future Build VLAPs, noise impacts on residential areas bordering the <strong>Airport</strong> would beminimized.5.4.5.3 Warwick Station Redevelopment District Master PlanThe 1998 Warwick Station Redevelopment District Master Plan (WSRD Master Plan) includes recommendations thatsupport the long-term goals of T. F. <strong>Green</strong> <strong>Airport</strong>, including intermodal connection opportunities for“seamless” travel for airport customers. 317 Specific recommendations include construction of an automatedpeople mover with direct connection from the WSRD to the <strong>Airport</strong> across Post Road. At the time of this <strong>FEIS</strong>filing this intermodal facility has been realized (InterLink) and the City of Warwick is currently drafting anupdate to the WSRD Master Plan.5.4.5.4 Consistency with City of Warwick Comprehensive Plan and ZoningControlling land uses or changing zoning regulations lies under the jurisdiction of the City of Warwick through itsComprehensive Plan and Zoning Ordinance, provided the comprehensive plan and ordinances are consistent withthe State Guide Plan. In general, the <strong>Improvement</strong> <strong>Program</strong> is reasonably consistent with the above-referenced landuse plans. RIAC has certified in a letter (included in Appendix C.6, RIAC Certifications and Assurances) that, as theairport sponsor, it has taken actions through zoning or other means to the extent reasonable to ensure the usesimmediately surrounding the <strong>Airport</strong> are compatible with airport operations.314 State of Rhode Island Statewide Planning <strong>Program</strong>, State Guide Plan Element 640: State of Rhode Island <strong>Airport</strong> System Plan Notice of Public Hearing,March 28, 2011.315 Rhode Island’s State Land Use Policies and Plan, p. v.316 Ibid, p. 2-12.317 Warwick Station Redevelopment District Master Plan, City of Warwick Planning Department and City of Warwick Department of Economic Development, July 1998.Chapter 5 - Environmental Consequences 5-63 July 2011\\mawatr\ev\09228.00\reports\<strong>FEIS</strong>_Final_July_2011\<strong>PVD</strong>_CH05_Environmental_Cons_JUL_2011.doc
T.F. <strong>Green</strong> <strong>Airport</strong> <strong>Improvement</strong> <strong>Program</strong>Environmental Impact Statement and Final Section 4(f) EvaluationCity of Warwick Comprehensive PlanThe <strong>Improvement</strong> <strong>Program</strong> addresses the recommendation in the 2002 City of Warwick Comprehensive Plan tominimize traffic congestion between Warwick Avenue and the <strong>Airport</strong> property boundary by improving access toRoute 37 through the proposed Fully Relocated <strong>Airport</strong> Road under Alternative B2. 318 Also, Alternative B2addresses the T.F. <strong>Green</strong> <strong>Airport</strong> Area Economic Redevelopment Plan recommendation to provide a connectionbetween <strong>Airport</strong> Road and Route 37 to facilitate easier access to the area and alleviate traffic congestion byproviding a new direct connection and discontinuing existing <strong>Airport</strong> Road. 319 Regarding wetland mitigation,the proposed mitigation for Alternative B4 would improve resources that are listed as priority resources in theComprehensive Plan under the Open Space and Recreation element (specifically, the Three Ponds Wetlandsystem and Mill Cove). Proposed wetland mitigation sites 8 and 12, if selected as part of the proposedmitigation program, would preserve and enhance these priority sites. Refer to Chapter 6, Mitigation, Section 6.9,Wetlands and Waterways for further details.While the City of Warwick Comprehensive Plan supports the creation of a direct connection between the <strong>Airport</strong>and the WSRD, as indicated under the “Services and Facilities” element, and implementation of noiseabatement programs and land use compatibility measures, including selective rezoning and establishment ofbuffer areas, it discourages the physical expansion of the <strong>Airport</strong> beyond the current fence line. 320 TheComprehensive Plan does not currently include provisions for rezoning airport noise lands (previous andfuture acquisition areas) or residential areas surrounding the <strong>Airport</strong> to allow commercial, retail, or othercompatible (non-residential) uses. At the time of the filing of this <strong>FEIS</strong>, the City of Warwick was in the processof updating its Comprehensive Plan (discussed further below). It is assumed that the <strong>Airport</strong>-related policies ofthe Comprehensive Plan would be amended in consideration of this <strong>FEIS</strong> and the revised State Guide Plan,<strong>Airport</strong> System Plan, Element 640 as part of the Comprehensive Plan update.Warwick Comprehensive Plan UpdateIn 2009, $85,000 in funding was awarded to the City of Warwick to update the Comprehensive Plan under theStatewide Planning <strong>Program</strong>’s Planning Challenge Grant <strong>Program</strong>. 321 Planning Challenge Grants areadministered by the Statewide Planning <strong>Program</strong> and funded with Federal Highway AdministrationMetropolitan Planning funds received by the state and allocated to the Statewide Planning <strong>Program</strong>, thedesignated Metropolitan Planning Organization for Rhode Island. The purpose of the grant program is toprovide funding for statewide, regional and local planning studies leading to the implementation of the StateGuide Plan, particularly Land Use 2025 and Transportation 2030.City of Warwick Zoning OrdinanceThe City of Warwick Zoning Ordinance (Zoning Ordinance) sets forth regulations and districts of allowable landuses. The City of Warwick’s definition of land use compatibility differs from the criteria defined by FAA, whichis related specifically to noise. Instead, the City bases compatibility on underlying zoning, and consistency withthe comprehensive plan. Because the <strong>Airport</strong> is located on state-owned property, the land is not specifically318 City of Warwick Comprehensive Plan, City of Warwick Planning Commission updated 2002.319 T.F. <strong>Green</strong> <strong>Airport</strong> Area Economic Redevelopment Plan, prepared by Sasaki Associates for the City of Warwick and the Central Rhode Island DevelopmentCorporation, October 1996.320 City of Warwick Comprehensive Plan, City of Warwick Planning Commission, updated 2002.321 Rhode Island Statewide Planning <strong>Program</strong> Press Release titled “$1 Million in Funding Awarded for Regional and Local Planning Initiatives”, 2009 (accessedat www.planning.ri.gov/misc/pcgawards.pdf on February 17, 2011).Chapter 5 - Environmental Consequences 5-64 July 2011\\mawatr\ev\09228.00\reports\<strong>FEIS</strong>_Final_July_2011\<strong>PVD</strong>_CH05_Environmental_Cons_JUL_2011.doc
T.F. <strong>Green</strong> <strong>Airport</strong> <strong>Improvement</strong> <strong>Program</strong>Environmental Impact Statement and Final Section 4(f) Evaluationsubject to the City of Warwick’s zoning regulations. RIAC projects are not subject to local zoning to the extentthat the zoning is inconsistent with the State Guide Plan. For each Alternative, this section provides anevaluation of the amount of residentially zoned land that would be exposed to noise levels of DNL 65 dB andabove as residential uses would be considered incompatible (under federal guidelines) under this level ofnoise. 322 As documented in Chapter 6, Mitigation, the land will be reused in a manner that is reasonably consistentwith local zoning through noise mitigation (sound insulation and land acquisition).No-Action AlternativeTable 5-46 presents the residential zoning district acreage that would be exposed to noise levels of DNL 65 dBand above in 2015, 2020 and 2025 under the No-Action Alternative. Figure 5-23 shows the No-ActionAlternative noise contours for 2015, 2020, and 2025 with generalized zoning.Table 5-46No-Action Alternative: Residential Zoning Districts Exposed to DNL 65 dB and Above2015 2020 2025Zoning District Acres Percent of Total Acres Percent of Total Acres Percent of TotalResidential 1 228 70% 286 72% 387 73%Sources: RIGIS; Field verification by VHB, Inc., 2005; City of Warwick Assessor’s Parcel Data.1 Includes Residence A-7 and A-10 zoning districts.Under the No-Action Alternative, areas that are currently zoned residential, according to the City of Warwick’szoning, would not be compatible with predicted noise levels according to federally defined land use compatibilityregulations for noise levels. 323 Residential zones (specifically, A-7 and A-10 zones) are most affected by the noiselevels of DNL 65 dB and above under the No-Action Alternative representing approximately 70 percent in 2015,72 percent in 2020, and 73 percent in 2025 of all zoning districts within the DNL 65 dB noise contour. Theseimpacted areas should be considered by the City for rezoning to include compatible (non-residential) land usesthat would be consistent with <strong>Airport</strong> operations.Alternative B2Under Alternative B2, a number of land use changes to the City of Warwick’s current zoning would be needed,including:• By 2015, the RSA enhancements for Runway 16, would require that land currently zoned residential,commercial, and industrial be converted to <strong>Airport</strong> land.• By 2020, the extension of Runway 5-23, would require that land currently zoned office is converted to<strong>Airport</strong> land.• The Future Build VLAP (residential acquisition as noise mitigation for noise impacts in 2020) would requirethat land currently zoned residential is converted to <strong>Airport</strong> land.• The land acquisitions for the FAA-recommended RPZ clearing, would require that land currently zonedresidential and industrial is converted to <strong>Airport</strong> land.322 FAA Order 1050.1E, Environmental Impacts: Policies and Procedures, March 20, 2006, 11b.1 (8).323 14 CFR Part 150, <strong>Airport</strong> Noise Compatibility Planning, paragraph 150.7.Chapter 5 - Environmental Consequences 5-65 July 2011\\mawatr\ev\09228.00\reports\<strong>FEIS</strong>_Final_July_2011\<strong>PVD</strong>_CH05_Environmental_Cons_JUL_2011.doc
T.F. <strong>Green</strong> <strong>Airport</strong> <strong>Improvement</strong> <strong>Program</strong>Environmental Impact Statement and Final Section 4(f) EvaluationUnder Alternative B2, areas that are currently zoned residential would not be compatible with predicted noiselevels according to federally-defined land use compatibility regulations for noise levels. 324 Table 5-47 presentsresidential zoning district acreage that would be exposed to noise levels of DNL 65 dB and above forAlternative B2 in 2020 and 2025 compared to the No-Action Alternative. Figure 5-24 shows the Alternative B2noise contours for 2015, 2020, and 2025 with generalized zoning.Table 5-47Alternative B2: Residential Zoning Districts Exposed to DNL 65 dB and Above (acres)No-Action Alternative Alternative B2 Change (%)Zoning District 2015 2020 2025 2015 2020 2025 2015 2020 2025Residential 1 228 286 387 230 308 383 1% 8% -1%Sources: RIGIS; Field verification by VHB, Inc., 2005; City of Warwick Assessor’s Parcel Data.1 Includes Residence A-7 and A-10 zoning districts.As discussed in Section 5.3, Noise, while the runway use and number of operations would not change for Alternative B2in 2015 compared to the No-Action Alternative, the runway thresholds would change under Alternative B2 comparedto the No-Action Alternative due to the runway safety area enhancements to Runway 16-34. These changes in turnwould result in a one percent increase in the extent of residential zoning districts that would be exposed to noise levelsof DNL 65 dB and above. Under Alternative B2 in 2020, there would be an increase of 22 acres, or eight percent, in theamount of residentially zoned land that would be exposed to noise levels of DNL 65 dB and above compared to the No-Action Alternative. In 2025, there would be a decrease of four acres, or one percent, in the amount of residentially zonedland that would be exposed to noise levels of DNL 65 dB and above compared to the No-Action Alternative. AlternativeB2 would change the existing land use by introducing a non-compatible use (airport operations) within residentialareas. It is anticipated that land will be made reasonably consistent with local zoning through implementation of RIAC’sPart 150 NCP, including sound insulation and land acquisition for noise mitigation, as documented inChapter 6, Mitigation.Alternative B4Under Alternative B4, a number of land use changes to the City of Warwick’s current zoning would be needed,including:• By 2015, the RSA enhancements for Runway 16, would require that land currently zoned residential,business, or industrial be converted to <strong>Airport</strong> land.• By 2015, the extension of Runway 5-23, would require that land currently zoned office is converted to<strong>Airport</strong> land.• The Future Build VLAP, would require that land currently zoned residential is converted to <strong>Airport</strong> land.(For the purposes of the EIS, properties are assumed to be acquired between 2015 and 2020 for noiseimpacts in 2015, and between 2020 and 2025 for noise impacts in 2020. However, it is RIAC’s intention tobegin to acquire residential parcels as soon as 2012, if funding is available).• The land acquisitions for the FAA-recommended RPZ clearing, would require that land currently zonedresidential be converted to <strong>Airport</strong> land.324 14 CFR Part 150, <strong>Airport</strong> Noise Compatibility Planning, paragraph 150.7.Chapter 5 - Environmental Consequences 5-66 July 2011\\mawatr\ev\09228.00\reports\<strong>FEIS</strong>_Final_July_2011\<strong>PVD</strong>_CH05_Environmental_Cons_JUL_2011.doc
T.F. <strong>Green</strong> <strong>Airport</strong> <strong>Improvement</strong> <strong>Program</strong>Environmental Impact Statement and Final Section 4(f) EvaluationUnder Alternative B4, areas that are currently zoned residential would not be compatible with predicted noise levelsaccording to federally defined land use compatibility regulations for noise levels. 325 Table 5-48 presents the residentialacreage in the district that would be exposed to noise levels of DNL 65 dB and above for Alternative B4 in 2015, 2020,and 2025 compared to the No-Action Alternative. Figures 5-25 and 5-26 show the Alternative B4 noise contoursfor 2015, and for 2020 and 2025 with generalized zoning, respectively.Table 5-48Alternative B4: Residential Zoning Districts Exposed to DNL 65 dB and Above (acres)No-Action Alternative Alternative B4 Change (%)Zoning District 2015 2020 2025 2015 2020 2025 2015 2020 2025Residential 1 228 286 387 274 323 396 20% 13% 2%Sources: RIGIS; Field verification by VHB, Inc., 2005; City of Warwick Assessor’s Parcel Data.1 Includes Residence A-7 and A-10 zoning districts.Under Alternative B4 in 2015, there would be an increase of 46 acres, or 20 percent, of residentially zoned landthat would be exposed to noise levels of DNL 65 dB and above when compared to the No-Action Alternative.This increase is partially due to the timing of residential land acquisitions beginning in 2015 (through 2020) and,therefore, are not removed from the zoning districts in 2015. Alternative B4 would result in an increase of37 acres representing a 13 percent increase in 2020 and, in 2025, Alternative B4 would result in an increase ofnine acres representing a two percent increase of residentially zoned land that would be exposed to noise levelsof DNL 65 dB and above when compared to the No-Action Alternative. Alternative B4 would change theexisting land use by introducing a non-compatible use (airport operations) within residential areas. The amountof incompatible land (zoned residential) is reduced in 2020 and 2025 due to the land acquisitions for noisemitigation. It is anticipated that this land will be made reasonably consistent with local zoning throughimplementation of RIAC’s Part 150 NCP, including sound insulation and land acquisition for project-relatednoise mitigation, as documented in Chapter 6, Mitigation.5.4.6 Temporary Impacts from Short-Term Construction ActivitiesImpacts to land use due to construction activities for the <strong>Improvement</strong> <strong>Program</strong> would be temporary and wouldbe associated with construction staging areas and road closures or relocations. Construction activities associatedwith the Alternatives B2 and B4 would be concentrated predominantly in areas that are currently residential, withsome commercial and industrial land located north and south of the <strong>Airport</strong> at the Runway 5-23 Ends due toextending Runway 5-23 to the north and relocating <strong>Airport</strong> Road (under Alternative B2), or due to extendingRunway 5-23 to the south and realigning Main Avenue (under Alternative B4). For construction of Alternative B2,acquisition and relocation of mostly commercial properties located at the Runway 16 End would be required by2015 for construction of the safety enhancements. Also under Alternative B2, 67 residential units and fourbusinesses would occur be acquired and relocated over multiple years (between 2015 and 2020), which wouldcause community disruption during this time. Additionally, there would be some disruption to businessesnorth of the <strong>Airport</strong> related to partial land acquisitions due to construction of Partially Relocated <strong>Airport</strong> Roadunder Alternative B2.325 CFR Part 150, <strong>Airport</strong> Noise Compatibility Planning, 14 CFR, definitions, paragraph 150.7.Chapter 5 - Environmental Consequences 5-67 July 2011\\mawatr\ev\09228.00\reports\<strong>FEIS</strong>_Final_July_2011\<strong>PVD</strong>_CH05_Environmental_Cons_JUL_2011.doc
T.F. <strong>Green</strong> <strong>Airport</strong> <strong>Improvement</strong> <strong>Program</strong>Environmental Impact Statement and Final Section 4(f) EvaluationFor construction of Alternative B4, acquisition and relocation of 11 residential units and 12 businesses wouldoccur over multiple years (by 2015) and would cause community disruption during this time. UnderAlternative B4, construction of Realigned Main Avenue south of the <strong>Airport</strong> would occur primarily on airportproperty, but would require full and partial land acquisitions that would cause disruption to residences south ofthe <strong>Airport</strong>. During construction of Partially Relocated <strong>Airport</strong> Road under Alternative B4 there would be somedisruption to businesses north of the <strong>Airport</strong> due mostly to partial land acquisitions and some full landacquisitions. A construction management plan will be implemented to minimize community disruption duringconstruction (see Chapter 6, Mitigation). Appendix H, Surface Transportation, of this <strong>FEIS</strong> provides detailedconstruction phasing plans for the off-<strong>Airport</strong> roadway improvements and describes the impact avoidancemethods developed for Alternative B4 as the Preferred Alternative. The construction phasing plans weredeveloped so that Main Avenue, <strong>Airport</strong> Road, and Post Road would remain open at all times. This is achievedthrough the use of lane shifts or use of temporary roadways in conjunction with potential nighttimeconstruction operations. During final design and construction phase, the construction phasing plans will requirefurther development and coordination among RIAC, RIDOT, the City of Warwick, and other entities, such asschools or entities that use the roadways for emergency access (such as hospitals or State Police).5.4.7 Cumulative ImpactsThe following analysis considers cumulative impacts to land use within the geographic area of the Study Area andidentified within the timeline discussed in the methodology section. Past land use changes, reasonably foreseeablefuture land use changes (i.e., known planned and permitted development and projected growth according to local,regional, and state plans and policies), and the potential land use impacts of Alternatives B2 and B4 are consideredto identify areas that would be more or less affected. Refer to Section 5.5, Social and Socioeconomic, EnvironmentalJustice and Children’s Health and Safety Risks, for a discussion of long-term community impacts and affects onbusinesses and the local and regional economies as well as affordable housing.5.4.7.1 Overview of Historical Land Use ChangesHistorically, the majority of <strong>Airport</strong>-related projects have impacted predominantly residential areas west, east,and south of the <strong>Airport</strong>. When the <strong>Airport</strong> was first dedicated in 1931, the predominant land uses surroundingthe <strong>Airport</strong> were undeveloped and agricultural with some residential. The <strong>Airport</strong> was originally 158 acres ofcleared brush and turf runways. The majority of the dense housing stock currently characterizing the residentialareas surrounding the <strong>Airport</strong> was built in the post-war housing boom beginning in the late 1940s and 1950s. Inthe 1960s, the <strong>Airport</strong> was expanded to include a passenger terminal (located on Post Road) and extendedrunways to accommodate jet airplanes. This runway extension discontinued an east-west connection to thesouth of the <strong>Airport</strong> along Strawberry Field Road limiting access to and isolating the Strawberry Fieldneighborhood. Runway 5-23 was further expanded to its existing length of 7,166 feet in 1983.In addition to <strong>Airport</strong> expansion, commercial development on Post Road gradually reduced much of theresidential area west of the <strong>Airport</strong>. Since the 1980s, new industrial development in the City of Warwick hasChapter 5 - Environmental Consequences 5-68 July 2011\\mawatr\ev\09228.00\reports\<strong>FEIS</strong>_Final_July_2011\<strong>PVD</strong>_CH05_Environmental_Cons_JUL_2011.doc
T.F. <strong>Green</strong> <strong>Airport</strong> <strong>Improvement</strong> <strong>Program</strong>Environmental Impact Statement and Final Section 4(f) Evaluationconcentrated to the west of the <strong>Airport</strong> in the Jefferson Boulevard corridor and vicinity, particularly MetroCenter, and the <strong>Airport</strong> Park area north of the <strong>Airport</strong>. 326Beginning in 1990, a voluntary sound insulation program has provided sound insulation to 1,534 homes and sevenschools surrounding the <strong>Airport</strong>. (As of December 2003, 23 non-residential noise-sensitive sites and two places ofworship have received sound insulation.) In 2001, the Completed Part 150 VLAP went into effect based on the 2000NEM update in order to reduce incompatible uses surrounding the <strong>Airport</strong>. The Completed Part 150 VLAPidentified 285 residential parcels (280 housing units) located in seven noise impacted areas in close proximity tothe <strong>Airport</strong> most of which were acquired by 2009. These properties were concentrated east and south of the <strong>Airport</strong>with some acquisitions north of the <strong>Airport</strong>.The majority of the developable land immediately surrounding the <strong>Airport</strong> has already been developed. Theland uses directly surrounding the <strong>Airport</strong> on the northern, eastern, and southern sides continue to remainprimarily residential, with the exception of the uses found along the major transportation corridors around theperimeter of the <strong>Airport</strong> (<strong>Airport</strong> Road to the north; Post Road to the west), and on the western side, arepredominantly commercial, including retail (products and services), office buildings, and a commercial andindustrial mix. In 2010, InterLink was completed providing direct pedestrian access from the T.F. <strong>Green</strong> <strong>Airport</strong>terminal to the MBTA commuter rail, additional RIPTA Intercity bus lines (some RIPTA bus lines currentlyprovide direct access the terminal), and new consolidated rental car facilities.5.4.7.2 Summary of Project-Related Land Use ChangesThe following summarizes land use impacts for the No-Action Alternative and Alternatives B2 and B4, whichprimarily includes the conversion of residential land to <strong>Airport</strong> property due to land acquisition as noisemitigation.No-Action AlternativeThe No-Action Alternative consists of on-<strong>Airport</strong> projects and the ongoing Part 150 NCP, including acquisitionof up to 115 residential parcels (totaling 29 acres) for noise mitigation to be acquired prior to the noise impact, in2015 (the Current Part 150 VLAP). The Current Part 150 VLAP would result in direct changes to land usessurrounding the <strong>Airport</strong>. The number of eligible properties are almost evenly split between the Runway 5 Endwhere 59 parcels are located in the <strong>Green</strong>wood neighborhood to the south of the <strong>Airport</strong> and the Runway 23End where 56 parcels are located north of the <strong>Airport</strong> in the Spring <strong>Green</strong> neighborhood.Alternative B2Land use changes as a result of the construction of Alternative B2 (mandatory full and partial land acquisitionsfor the Runway 5-23 extension, Runway 16 RSA enhancements, and the Partially and Fully Relocated <strong>Airport</strong>Roads) are concentrated at three ends of the <strong>Airport</strong> runways, and would result in a mix of residential,commercial and industrial uses that would change to <strong>Airport</strong> land. Specifically, the predominantly commercialland uses, in addition to some residential land, at the existing <strong>Airport</strong> Road and Post Road intersection wouldchange to <strong>Airport</strong> land as a result of the Runway 16 End RSA program element. The voluntary land acquisition326 City of Warwick Comprehensive Plan, City of Warwick Planning Commission, updated 2002.Chapter 5 - Environmental Consequences 5-69 July 2011\\mawatr\ev\09228.00\reports\<strong>FEIS</strong>_Final_July_2011\<strong>PVD</strong>_CH05_Environmental_Cons_JUL_2011.doc
T.F. <strong>Green</strong> <strong>Airport</strong> <strong>Improvement</strong> <strong>Program</strong>Environmental Impact Statement and Final Section 4(f) Evaluationprogram within the RPZs and a Future Build VLAP for noise mitigation (beginning in 2020) would result in thechange of residential land to <strong>Airport</strong> land.The construction of Fully Relocated <strong>Airport</strong> Road would result in major land use changes by convertingresidential, agricultural, commercial and industrial land uses north of the <strong>Airport</strong> to roadway or right-of-wayuses. The construction of Partially Relocated <strong>Airport</strong> Road would convert industrial and some commercial usesat the northern border of the <strong>Airport</strong> to roadway or right-of-way uses.As a result of Alternative B2, in 2020, the amount of incompatible residential land uses (in acres) would increaseby four percent compared to the No-Action Alternative. In 2025, Alternative B2 would result in a seven percentdecrease in the amount of incompatible land uses (in acres) compared to the No-Action Alternative due toresidential land acquisition for noise mitigation. In 2020, 62 parcels totaling eight acres and, in 2025, 46 parcelstotaling six acres of residential land would experience a significant increase in noise levels (increase of at leastDNL 1.5 dB at or above DNL 65 dB) and, therefore, would be eligible for sound insulation under Alternative B2.Alternative B4Under Alternative B4, land use changes as a result of mandatory land acquisitions for construction (theRunway 16 RSA, Partially Relocated <strong>Airport</strong> Road, and Realigned Main Avenue), including full and partialacquisitions would occur sooner (in 2015) than compared to Alternative B2. These acquisitions are concentratedat the Runway 16 and 5 Ends consisting of commercial and residential uses that would change to <strong>Airport</strong> land.Land acquisitions for noise mitigation and FAA-recommended RPZ clearing would be concentrated south of the<strong>Airport</strong> at the Runway 5 End and changed to <strong>Airport</strong> land.The predominantly commercial land uses, in addition to some residential land, at the existing <strong>Airport</strong> Road andPost Road intersection would change to <strong>Airport</strong> land as a result of the Runway 16 End RSA. The construction ofPartially Relocated <strong>Airport</strong> Road would convert commercial uses to roadway or right-of-way uses at thenorthern border of the <strong>Airport</strong>. The construction of Realigned Main Avenue would convert residential uses toroadway or right-of-way uses directly south of the <strong>Airport</strong>.As a result of Alternative B4, in 2015 and 2020, the amount of incompatible residential land uses (in acres)would increase by 18 percent and ten percent compared to the No-Action Alternative, respectively. Conversely,in 2025, Alternative B4 would result in a five percent decrease in the amount of incompatible land uses (in acres)compared to the No-Action Alternative due to residential land acquisition for noise mitigation. In 2015,181 parcels totaling 30 acres of residential land would be exposed to a significant increase in noise levels(increase of at least DNL 1.5 dB at or above DNL 65 dB) and, therefore, would be eligible for sound insulation.In 2020, 62 parcels totaling eight acres and, in 2025, 46 parcels totaling six acres of residential land wouldexperience a significant increase in noise levels (Table 5-41). In 2020 and 2025, these residences would be eligiblefor sound insulation.5.4.7.3 Overview of Future Land Use ChangesLand uses in the section of City of Warwick west of the <strong>Airport</strong> would continue to include more new commercialand mixed-use developments according to the known planned and permitted projects, including 1.5 million grosssquare feet of future mixed-use development in the WSRD (refer to Table 5-5). The planned WSRD, whichsurrounds InterLink, would include approximately 1.5 million gross square feet consisting of approximatelyChapter 5 - Environmental Consequences 5-70 July 2011\\mawatr\ev\09228.00\reports\<strong>FEIS</strong>_Final_July_2011\<strong>PVD</strong>_CH05_Environmental_Cons_JUL_2011.doc
T.F. <strong>Green</strong> <strong>Airport</strong> <strong>Improvement</strong> <strong>Program</strong>Environmental Impact Statement and Final Section 4(f) Evaluation640,000 square feet of office uses, 640,000 square feet of hotel and conference uses, and 220,000 square feet ofconvenience retail and entertainment uses, subject to City approval. 327 Additionally, it is anticipated that industrialdevelopment is likely to continue in the Jefferson Boulevard corridor west of the <strong>Airport</strong> and the <strong>Airport</strong> ParkArea north of the <strong>Airport</strong>. Future expansion of these uses along Post Road in the vicinity of the <strong>Airport</strong> is unlikelygiven the recommendations of the Comprehensive Plan, which discourage any further encroachment ofcommercial and institutional uses into residential neighborhoods in this area. (As previously discussed, at the timeof this filing the City has initiated the process of updating its Comprehensive Plan.) Future land use changes alsoinclude the residential land acquisitions under the Current Part 150 VLAP, as discussed previously under theNo-Action Alternative. Additionally, RIAC will consider reinstating the 15 property owners who elected not toparticipate under the Completed Part 150 VLAP as part of a ‘Future Phase’ contingent on funding availability.Refer to the DEIS Compatible Land Use Technical Report Chapter 5, Level 6 Environmental Consequences and Mitigation,Section 5.6, Cumulative Impacts Analysis, for a more detailed description of potential future land use changes.5.4.7.4 Summary of Cumulative ImpactsIn general, with or without the <strong>Improvement</strong> <strong>Program</strong>, the land uses in the section of City of Warwick west ofthe <strong>Airport</strong> would continue to include more new commercial and mixed-use developments according to theknown planned and permitted projects, such as the WSRD. Alternatives B2 and B4 would have no directimpacts in this area. Alternatives B2 and B4 would contribute to a cumulative loss of residential and commercialand industrial land due to land acquisition and the conversion of this land to airport land, airport vacant landcleared for RPZ or for a Future Build VLAP for noise mitigation, and off-<strong>Airport</strong> roads. In addition, theNo-Action Alternative and Alternatives B2 and B4 would result in an overall cumulative increase in the amountof non-compatible land uses exposed to noise.Table 5-49 includes a comparison of the cumulative residential land acquisitions, including the Current Part 150VLAP, those residential properties to be acquired for construction of Alternatives B2 or B4, future residentialland acquisitions for properties eligible for land acquisition for noise mitigation, and residential voluntaryacquisitions for the FAA-recommended clearing of the RPZ areas. Under the No-Action Alternative, cumulativeor continued land use changes are anticipated to the north and south of the <strong>Airport</strong> due to additional residentialparcels that would be eligible for acquisition. Table 5-49 shows that, cumulatively, Alternative B4 would resultin fewer overall residential land acquisitions compared to Alternative B2.Under the No-Action Alternative by 2025, cumulative, or continued, residential land use changes would beevident south and north (to new impact areas) of the <strong>Airport</strong> due to additional residential parcels that would beeligible for land acquisition because of noise increases (115 residential parcels consisting of 135 housing units)due to future growth in <strong>Airport</strong> operations without the <strong>Improvement</strong> <strong>Program</strong>. By 2025, due to Alternative B2,cumulative, or continued, land use changes are anticipated south and north (to newly impacts areas) of the<strong>Airport</strong> due to additional residential parcels that would be eligible for land acquisition because of noiseincreases (285 residential parcels consisting of 372 housing units). Alternative B2 would convert residentialparcels to <strong>Airport</strong> land or roadway north as well as south of the <strong>Airport</strong> to construct Runway 5-23, includingRPZ clearing at both ends, the RSA for Runway 16 (to the north only), Partially and Fully Relocated <strong>Airport</strong>327 The Warwick Station Redevelopment District development program has been expanded from 1.1 million gross square feet (gsf) to 1.5 million gsf, accordingto the City of Warwick Planning Department (correspondence dated February, 2011).Chapter 5 - Environmental Consequences 5-71 July 2011\\mawatr\ev\09228.00\reports\<strong>FEIS</strong>_Final_July_2011\<strong>PVD</strong>_CH05_Environmental_Cons_JUL_2011.doc
T.F. <strong>Green</strong> <strong>Airport</strong> <strong>Improvement</strong> <strong>Program</strong>Environmental Impact Statement and Final Section 4(f) EvaluationRoads (to the north only), and the Future Build VLAP beginning in 2020 for noise mitigation (residential landacquisitions both north and south). By 2025 under Alternative B4, cumulative, or continued, residential land usechanges would be evident south of the <strong>Airport</strong> due to additional residential parcels that would be eligible forland acquisition because of noise increases (272 residential parcels consisting of 275 units). Alternative B4 resultsin the acquisition of fewer housing units than Alternative B2 because it moves the extension farther south whereprevious land acquisition for noise-mitigation has been implemented.Cumulatively, by 2025, the amount of incompatible land use is reduced under both Alternatives B2 and B4 (aseven percent decrease in the amount of land area under Alternative B2 and a five percent decrease underAlternative B4). This decrease is a result of the residential land acquisition for noise mitigation under Future BuildVLAPs in combination with mandatory acquisition of residential parcels for construction and land RPZ areas.Table 5-49All Alternatives: Cumulative Full Residential Land Acquisition (Parcels and Housing Units)No-Action Alternative Alternative B2 Alternative B4Housing Housing HousingLand Use Type Parcels Units Parcels Units Parcels UnitsCurrent Part 150 VLAP 1 115 135 115 135 115 135<strong>Improvement</strong> <strong>Program</strong> (Mandatory)Runway Safety Area Enhancements NA NA 6 1 2 0Partially Relocated <strong>Airport</strong> Road NA NA 1 0 1 1Runway 5-23 Extension NA NA 0 0 0 0Fully Relocated <strong>Airport</strong> Road NA NA 58 66 NA NARealigned Main Avenue NA NA NA NA 13 10<strong>Improvement</strong> <strong>Program</strong> Sub-Total (Mandatory) NA NA 65 67 16 11Future Build VLAP (<strong>Improvement</strong> <strong>Program</strong> Noise Mitigation - Voluntary) 2 NA NA 41 3 36 3 77 4 69 4RPZ Areas (Voluntary) NA NA 64 134 64 60<strong>Improvement</strong> <strong>Program</strong> Total Sub-Total (Mandatory and Voluntary) NA NA 170 237 155 138Total Cumulative Residential Acquisition 5 115 135 285 372 272 275VLAP Voluntary Land Acquisition <strong>Program</strong>NA Not Applicable.1 Based on the FAA-accepted 2020 NEM (dated July 27, 2010). All parcels and housing units would be acquired by 2015.2 Assumes residential land acquisition between 2020 and 2025 for all parcels directly impacted by a noise level of DNL 70 dB (and eligible adjacent parcels) in2020. However, it is RIAC’s intention to begin to acquire residential parcels as soon as 2012, subject to availability of funding.3 For the purposes of this EIS analysis, it is assumed that two parcels totaling 0.5 acres and containing two housing units would be acquired for project-relatednoise mitigation between 2015 and 2020 for noise impacts beginning in 2015. However, it is RIAC’s intention to begin to acquire residential parcels as soon as2012, subject to availability of funding.4 Sum of the Current Part 150 VLAP and the <strong>Improvement</strong> <strong>Program</strong> Sub-Total (mandatory and voluntary) parcels and housing units.5.4.8 Comparison of Alternatives B2 and B4This section summarizes and compares the land use changes due to land acquisition and changes in noise levelson noise-sensitive land uses and zoning districts (residential) as well as non-residential noise-sensitive sites dueto the Alternatives B2 and B4. Both Alternatives B2 and B4 would result in mandatory and voluntary landacquisitions and in a significant increase in noise to noise-sensitive (residential) land uses.Chapter 5 - Environmental Consequences 5-72 July 2011\\mawatr\ev\09228.00\reports\<strong>FEIS</strong>_Final_July_2011\<strong>PVD</strong>_CH05_Environmental_Cons_JUL_2011.doc
T.F. <strong>Green</strong> <strong>Airport</strong> <strong>Improvement</strong> <strong>Program</strong>Environmental Impact Statement and Final Section 4(f) Evaluation5.4.8.1 Significant Land Use ImpactsBoth Alternatives B2 and B4 would result in a significant increase in noise (increase of at least DNL 1.5 dB at orabove DNL 65 dB) to noise-sensitive (residential) land uses (in 2020 and 2025 only under Alternative B2, and inall analysis years for Alternative B4 due to the expedited construction schedule). Under Alternative B4 in 2015,180 residential parcels totaling approximately 32 acres would be affected by significant increases in noise whencompared to the No-Action Alternative (Table 5-41). In both 2020 and 2025, Alternative B2 would expose lessresidential land uses to significant noise impacts (71 parcels totaling approximately 11.5 acres in 2020 and48 parcels totaling approximately seven acres in 2025) than Alternative B4 (169 parcels totaling approximately30 acres in 2020 and 108 parcels totaling approximately 18.5 acres in 2025) (Table 5-41). This is because underAlternative B2, more residential acquisitions are required for construction of Fully Relocated <strong>Airport</strong> Roadnorth of the <strong>Airport</strong> and because under Alternative B4 the extension of Runway 5-23 is to the south of the<strong>Airport</strong> would result in increased aircraft operations over a predominantly residential area. As discussed underSection 5.3, Noise, all noise-sensitive land uses impacted by a significant increase in noise would be eligible forsound insulation mitigation.5.4.8.2 Land AcquisitionIn 2020 under the No-Action Alternative, it is assumed that 59 parcels at the Runway 5 End and 56 parcels at theRunway 23 End would be acquired under the Current Part 150 VLAP. By 2020, Alternative B2 would result inthe acquisition of 247 residential, commercial, agriculture, and undeveloped parcels totaling76 acres for all land acquisition types (construction, noise mitigation, and FAA-recommended RPZ clearing),which is greater than the total amount of land acquisitions for Alternative B4 (180 residential and commercialparcels totaling approximately 40 acres).Cumulatively, Alternative B4 would result in the least amount of cumulative land use changes compared toAlternative B2 for both commercial and industrial (including agricultural) and residential land uses. AlternativeB4 would have fewer commercial land acquisitions resulting in the least amount of commercial and industrialland use changes to the north of the <strong>Airport</strong> compared to Alternative B2 (23 parcels containing 12 businessesversus 53 parcels containing 38 businesses, respectively). Alternative B4 results in fewer residential landacquisitions than Alternative B2 for construction, RPZ areas (Alternative B4 does not include Runway 23 EndRPZ area acquisitions), and the Future Build VLAP (272 parcels containing 275 units versus 285 parcelscontaining 372 units, respectively).5.4.8.3 Land Use CompatibilityRefer to Section 5.4.8.1, Significant Land Use Impacts, for a discussion of significant impacts related to compatibleland use. Between 2015 and 2020, the area of residential land (acres) that would be exposed to noise levels ofDNL 65 dB and above would increase by approximately 26 percent under the No-Action Alternative. Between2020 and 2025, the area of residential land (acres) that would be exposed to noise levels of DNL 65 dB and abovewould increase by approximately 37 percent under the No-Action Alternative.Under Alternative B4, residential land uses would become incompatible sooner than under Alternative B2 (by2015) due to the expedited construction schedule for Alternative B4. In 2020 and 2025, Alternative B4 wouldexpose slightly more parcels to noise levels of DNL 65 dB and above than Alternative B2, because underChapter 5 - Environmental Consequences 5-73 July 2011\\mawatr\ev\09228.00\reports\<strong>FEIS</strong>_Final_July_2011\<strong>PVD</strong>_CH05_Environmental_Cons_JUL_2011.doc
T.F. <strong>Green</strong> <strong>Airport</strong> <strong>Improvement</strong> <strong>Program</strong>Environmental Impact Statement and Final Section 4(f) EvaluationAlternative B2, more residential acquisitions are required for construction of Fully Relocated <strong>Airport</strong> Road andthe Runway 23 End RPZ north of the <strong>Airport</strong> and because under Alternative B4 the extension of Runway 5-23 isto the south of the <strong>Airport</strong> which would result in an increase in aircraft operations over a predominantlyresidential area.Under Alternative B2, no noise-sensitive sites would be newly exposed to noise levels of DNL 65 dB or above in2015. Under Alternative B4 in 2015 and under both Alternatives B2 and B4 in 2020, one non-residentialnoise-sensitive site, Baha’i Faith (PW039), would be exposed noise levels of DNL 65 dB and above that wouldmake it eligible for sound insulation; however, the building has already been sound insulated as part of aprevious sound insulation effort under the Part 150 NCP (Table 5-10). Under 2025, no sites would be newlyexposed to noise levels of DNL 65 dB and above under Alternative B2. Under Alternative B4, John WickesSchool (SCH524) would be exposed to noise levels of DNL 65 dB and above that would make it eligible forsound insulation; however, it has already been sound insulated as part of a previous sound insulation effortunder the Part 150 NCP (Table 5-10).Cumulatively, by 2025, Alternative B2 would result in the largest decrease in the extent of noise-sensitive(residential) land uses exposed to DNL 65 dB and above compared to the No-Action Alternative thanAlternative B4 (a seven percent decrease in the amount of land area versus a five percent decrease, respectively).The amount of incompatible land would be reduced under both Alternatives B2 and B4 due to the mandatoryresidential acquisitions for construction, noise mitigation (acquisitions under a Future Build VLAP), and thenewly created RPZ for Runway 5-23.5.4.9 Avoidance and MinimizationAlternative B2 was developed in part to avoid land use impacts to Main Avenue and Buckeye Brook south andnorth of the <strong>Airport</strong> and to minimize impacts to the residential communities both south of Main Avenue andnorth of the <strong>Airport</strong>.Alternative B4 was also developed to avoid land use impacts to the residential communities and businessesnorth of the <strong>Airport</strong> and Buckeye Brook both south and north of the <strong>Airport</strong>. It was developed to minimize theamount of construction-related residential and commercial land acquisition by limiting construction as much aspossible to land already owned by RIAC located south of the Runway 5 End. Proposed mitigation measures forsignificant and other land use impacts are described in Chapter 6, Mitigation.5.5 Social and Socioeconomic, and Environmental Justice and Children’s Healthand Safety RisksThis section provides an overview of the social and economic impact analysis as a result of the proposedAlternatives, compared to the No-Action Alternative. This section also presents the assessment ofproject-related impacts on environmental justice populations and children’s health and safety.Chapter 5 - Environmental Consequences 5-74 July 2011\\mawatr\ev\09228.00\reports\<strong>FEIS</strong>_Final_July_2011\<strong>PVD</strong>_CH05_Environmental_Cons_JUL_2011.doc
T.F. <strong>Green</strong> <strong>Airport</strong> <strong>Improvement</strong> <strong>Program</strong>Environmental Impact Statement and Final Section 4(f) Evaluation5.5.1 Regulatory ContextThe regulatory context and significance thresholds, in accordance with FAA Order 10501.E, related to the socialand socioeconomic, and environmental justice and children’s health and safety risk impact categories aredescribed below.5.5.1.1 Social and Socioeconomic Regulatory ContextFAA must meet Uniform Relocation Assistance and Real Property Acquisition Policies Act of 1970 328 (URA)requirements if an airport action involving FAA approval or funding would require purchasing real property ordisplacing people or businesses. The URA establishes minimum standards for protection and assistance forfederally funded projects requiring the acquisition of real property or displacement of persons from theirhomes, businesses, or farms. The URA offers protection for property owners through both involuntary andsome types of voluntary acquisitions. FAA guidance for projects that require or involve land acquisition andrelocation is provided in the FAA Advisory Circular 150/5100-17 and FAA Order 5100.37.5.5.1.2 Environmental Justice and Children’s Health and Safety Risk Regulatory ContextThe environmental justice and children’s health and safety risk analysis was prepared to address therequirements of the following statutes, regulations, and guidance documents:• Title VI of the Civil Rights Act of 1964;• Executive Order 13045, Protection of Children from Environmental Health Risks and Safety Risks;• Executive Order 12898, Federal Actions To Address Environmental Justice in Minority Populations and Low-Income Populations; 329• Department of Transportation Order 5610.2, Environmental Justice in Minority and Low-Income Populations; 330• FAA Order 1050.1E; and• The Council on Environmental Quality’s Environmental Justice: Guidance under the NationalEnvironmental Policy Act guide.” 331Executive Order 13045, Protection of Children from Environmental Health Risks and Safety Risks, directs federalagencies to make it a high priority to identify and assess environmental health risks and safety risks that maydisproportionately affect children. Environmental health risks and safety risks include risks to health or safety thatare attributable to products or substances that a child is likely to come into contact with or ingest, such as air, food,drinking water, recreational waters, soil, or products to which they might use or to which they may be exposed.5.5.2 Significance Thresholds and Additional AnalysesThe social and socioeconomic, and the environmental justice and children’s health and safety risks analysesconsider impacts of Alternatives B2 and B4 as defined by the FAA’s thresholds of significance. Other additionalanalyses were also conducted to gain a full understanding of the future social and socioeconomic andenvironmental justice conditions.328 Uniform Relocation Assistance and Real Property Acquisition Policies Act of 1970, 42 USC section 4601, et. seq., U.S. Department of Housing and Urban Development.329 Executive Order 12898 of February 11, 1994, Federal Actions To Address Environmental Justice in Minority Populations and Low-Income Populations,Federal Register Vol. 59, No. 32, February 16, 1994.330 Environmental Desk Reference for <strong>Airport</strong> Actions, FAA, October 5, 2007, Chapter 10, Environmental Justice, page 2.331 Environmental Justice: Guidance under the National Environmental Policy Act, CEQ, December 10, 1997. Website:www.ceq.eh.doe.gov/nepa/regs/EJ/justice.pdf.Chapter 5 - Environmental Consequences 5-75 July 2011\\mawatr\ev\09228.00\reports\<strong>FEIS</strong>_Final_July_2011\<strong>PVD</strong>_CH05_Environmental_Cons_JUL_2011.doc
T.F. <strong>Green</strong> <strong>Airport</strong> <strong>Improvement</strong> <strong>Program</strong>Environmental Impact Statement and Final Section 4(f) Evaluation5.5.2.1 Finding: No Significant Social and Socioeconomic ImpactsAs presented previously in Table 5-6, the significance threshold for impacts related to the social andsocioeconomic environment, in accordance with the FAA Order 1050.1E, is when an action would cause:extensive relocation, but sufficient replacement housing is unavailable; extensive relocation of communitybusinesses that would cause a severe economic hardship for affected communities; disruption in local trafficpatterns that would substantially reduce the level of service of roads serving the airport and surroundingcommunities; or a substantial loss in the community tax base.Alternatives B2 and B4 would not result in significant impacts to social and socioeconomic conditions because:• There would be sufficient replacement housing within the City of Warwick and surrounding communities.• There would be sufficient commercial space for relocating businesses within the City of Warwick and itssurrounding communities.• There would be no substantial reduction in the Level of Service of roads serving the airport and itssurrounding communities. Alternatives B2 and B4 would improve traffic circulation surrounding the<strong>Airport</strong>, specifically with the proposed improvements to <strong>Airport</strong> Road and the gateway to the <strong>Airport</strong> onPost Road (refer to Section 5.6, Surface Transportation).• There would be no substantial loss in community tax base. For Alternatives B2 and B4, the total potentialannual property tax loss (for land acquisitions) is less than one percent of the total annual tax revenue basefor the City of Warwick 332 ($1,173,997 would be lost annually starting in 2020, or 0.57 percent of the base,under Alternative B2 and $567,521 would be lost annually starting in 2020, or 0.28 percent of the base, underAlternative B4). Over time, cumulative decreases in City of Warwick property tax revenue would total$5.9 million by 2025 for Alternative B2 and $3.2 million by 2025 for Alternative B4. (These losses in propertytax revenue represent substantially less than one percent of the City or Warwick’s tax base for 2010 and,therefore, is not considered significant.)In addition, under either Alternative B2 or B4, the <strong>Airport</strong> would continue to serve and increase its role as asubstantial economic driver for the State of Rhode Island and the region by providing additional economicbenefits in the form of new jobs, increased on- and off-<strong>Airport</strong> spending and business revenues, and increasedstate tax revenues. Since Alternative B4 includes a Runway 5-23 extension by the end of 2015 it would result in80 percent greater economic gains between 2015 and the end of 2020 than Alternative B2 because of theexpedited construction schedule. (For the purposes of the <strong>FEIS</strong>, it is assumed that the runway extension wouldcome online in 2015 for Alternative B4 and in 2020 for Alternative B2; therefore, project-related impacts andbenefits associated with runway operations were considered for these years.) Specific economic benefitsassociated with Alternatives B2 and B4 include:• Alternative B4: Potential economic gains between 2015 and the end of 2020 would total $385 million inbusiness revenues in the City of Warwick and $816 million for the State of Rhode Island, and $13 million in332 Based on the City of Warwick’s 2010 estimated total local tax revenue base of $204,173,334, as provided by Rhode Island Municipal Affairs, Department ofAdministration.Chapter 5 - Environmental Consequences 5-76 July 2011\\mawatr\ev\09228.00\reports\<strong>FEIS</strong>_Final_July_2011\<strong>PVD</strong>_CH05_Environmental_Cons_JUL_2011.doc
T.F. <strong>Green</strong> <strong>Airport</strong> <strong>Improvement</strong> <strong>Program</strong>Environmental Impact Statement and Final Section 4(f) Evaluationstate tax revenue (sales and income taxes). Alternative B4 would begin to generate economic gains due tothe runway extension in 2015 compared to Alternative B2 where the runway would come on line by the endof 2020. After 2020, these potential economic gains would continue to result from Alternative B4.• Alternative B2: By the end of 2020, potential economic gains would total $63 million in business revenues inthe City of Warwick and $136 million for the State of Rhode Island, and $2 million in state tax revenue (salesand income taxes).• Cumulative gains in sales and income taxes would reach approximately $13.3 million under Alternative B2(between 2020 and 2025) and more than $22.7 million under Alternative B4 (between 2015 and 2025).Additionally, the following temporary construction-related economic benefits are expected for Alternative B2and Alternative B4:• Constructing Alternative B2 would directly generate a total of 803 jobs, $37.7 million in personal income,and nearly $92.1 million in business spending in the City of Warwick during the 2012 to 2020 constructionperiod. When including indirect and induced impacts, the total benefit would be 1,173 jobs, $50.1 million inincome, and $134.3 million in additional spending in the City of Warwick, and additional benefits statewide(1,227 jobs, $53.6 million in wages, and $161.5 million in business revenue).• Constructing Alternative B4 would directly generate a total of 872 jobs, $40.9 million in personal incomeand $90.6 million in business spending in the City of Warwick during the 2012 to 2020 construction period.When including indirect and induced impacts, the total benefit would be 1,335 jobs, $58.3 million in incomeand $157.8 million in additional spending in the City of Warwick, and additional benefits statewide.5.5.2.2 Social and Socioeconomic Additional AnalysesIn response to a request by the City of Warwick, the social and socioeconomic impact analysis also considerswhether the Alternatives B2 or B4 would result in substantial reductions of the subsidized housing stock withno replacement options or would significantly impact housing affordability by removing a substantial numberof units from the City of Warwick’s housing stock. 333 Section 5.5.6, Affordable Housing Analysis, below provides asummary of the affordable housing analysis (the full analysis is provided as Appendix G.2, Affordable HousingAnalysis, of this <strong>FEIS</strong>). A fiscal impacts assessment related to residential acquisitions for Alternatives B2 and B4was also conducted as part of this <strong>FEIS</strong> and is summarized below (the full analysis is provided as Appendix G.3,Fiscal Impacts). This assessment considers the effects on the City of Warwick municipal expenditures forrecycling and sanitation, composting, police and fire and rescue operations as well as school fiscal impacts.5.5.2.3 Finding: No Significant Environmental Justice, and Children’s Health and Safety Risk ImpactsAs presented previously in Table 5-6, the significance threshold for impacts to environmental justicepopulations and children’s health and safety, in accordance with the FAA Order 1050.1E, would occur when anaction would cause disproportionately high and adverse human health or environmental effects on minority333 There is no significance threshold specified for subsidized or low income housing impact analysis in FAA Order 1050.1E, and therefore this analysis hasbeen performed voluntarily in response to a request from the City of Warwick.Chapter 5 - Environmental Consequences 5-77 July 2011\\mawatr\ev\09228.00\reports\<strong>FEIS</strong>_Final_July_2011\<strong>PVD</strong>_CH05_Environmental_Cons_JUL_2011.doc
T.F. <strong>Green</strong> <strong>Airport</strong> <strong>Improvement</strong> <strong>Program</strong>Environmental Impact Statement and Final Section 4(f) Evaluationand low-income populations. A significant impact may also occur when an action would cause disproportionatehealth and safety risks to children.Disproportionate impacts to environmental justice populations and children’s health and safety are consideredonly for resources for which significant adverse impacts were identified. While there would be significant noiseand compatible land use impacts as well as relocation of residences and businesses associated withAlternatives B2 and B4, the effects of these impacts on minority and low-income populations would not, foreither minority groups or low-income groups, be disproportionate. These Environmental Justice-relatedimpacts, therefore, are not significant.As documented in the impact analyses for air quality and water quality (Sections 5.7, Air Quality and 5.11, WaterQuality, respectively) the Alternatives B2 and B4 would not result in significant impacts to air quality, drinkingwater, recreational waters, or other products or substances that a child might come into contact with or ingest.The T.F. <strong>Green</strong> <strong>Airport</strong> <strong>Improvement</strong> <strong>Program</strong> therefore would not result in disproportionate health or safetyrisks to children.5.5.3 MethodologyThis section summarizes the methods that were used to assess the social and socioeconomic, and environmentaljustice populations impacts, and children’s health and safety risk impacts (direct and indirect impacts,short-term temporary construction impacts and cumulative impacts) for the Alternatives. Refer toAppendix G.1, Social and Socioeconomic Impacts Methodology, for further detail on the social and socioeconomicmethodology.5.5.3.1 Social and Socioeconomic Impact MethodologyThe impact assessment of direct and indirect impacts on social and socioeconomic conditions under theAlternatives B2 and B4 compared to the No-Action Alternative is organized by:• Direct and indirect economic impacts or benefits to the local, regional, and state economies, includingaffected businesses and any appreciable change in employment due to the increase in aviation activity;• Changes in employment and businesses associated with commercial land acquisitions as well as changes intax revenue in the City of Warwick; and• Social impacts, including direct impacts on housing units and values due to land acquisition (e.g.,mitigation for noise impacts).The following sections provide an overview of the methodologies and assumptions for the <strong>FEIS</strong> socioeconomicimpact analyses. Refer to Appendix G.1, Social and Socioeconomic Impacts Methodology, for additional information.Aviation Activity MethodologyAlternatives B2 and B4 were evaluated for projected changes due to non-stop air service to long-distancedestinations by 2020 and 2025, including an increase in air operations, passengers and limited amounts of bellycargo at the <strong>Airport</strong>, which would lead to additional business conducted on-<strong>Airport</strong> to service airlines andChapter 5 - Environmental Consequences 5-78 July 2011\\mawatr\ev\09228.00\reports\<strong>FEIS</strong>_Final_July_2011\<strong>PVD</strong>_CH05_Environmental_Cons_JUL_2011.doc
T.F. <strong>Green</strong> <strong>Airport</strong> <strong>Improvement</strong> <strong>Program</strong>Environmental Impact Statement and Final Section 4(f) Evaluationpassengers, and off-<strong>Airport</strong> due to an increase in spending in Warwick and Rhode Island from visitors arrivingon the additional flights. This change in the destinations that could be reached directly from the <strong>Airport</strong> couldoffer opportunities for spillover business activities near the <strong>Airport</strong> to take advantage of the new service andcustomers. In the aviation activity impact assessment, direct impacts, as well as secondary impacts, are brokenout in three categories: on-<strong>Airport</strong> in Warwick; off-<strong>Airport</strong> in Warwick; and statewide in Rhode Island,including Warwick. Off- and on-<strong>Airport</strong> impacts based on aviation activity are limited to the additionaloperations and passengers forecast due to Alternatives B2 and B4 and do not include current airport activity orforecast activity of current conditions.Economic Direct and Indirect Impacts MethodologyThe impact assessment includes a detailed analysis of direct and indirect impacts on the local and regionaleconomies from Alternatives B2 and B4, including affected businesses and changes in employment as well aschanges to city and state tax revenues, and municipal services. Refer to Appendix G.1, Social and SocioeconomicImpacts Methodology, for further information on the methodology for the economic impact analyses.Direct and Indirect Impact Assessment for Affected Businesses and Employment MethodologyDirect impacts include economic activities associated with Alternatives B2 and B4 such as commercial landacquisitions with existing businesses that would be displaced. Parcel data from the City of Warwick Assessor’sDepartment were used to identify the commercial properties that would be affected by displacements. Thenumber of commercial land acquisitions, including the type, value and number of jobs of existing businesseswere identified for Alternatives B2 and B4. Direct impacts also include changes in employment, and state andlocal taxes due to increases in <strong>Airport</strong> operations and passengers.Indirect, or secondary and induced impacts (often referred to as multiplier effects or ripple effects) are based onexpected direct impacts. Indirect impacts are changes in business to business sales and induced impacts arechanges in consumer purchases supported by the additional workers’ income (or reduction of income) thatcome from direct impacts to the economy. Examples of indirect impacts include changes to orders for foodproducts for airport restaurants, merchandise to be sold by airport stores, goods to be sold by companiesserving visitors off-<strong>Airport</strong>, and accounting and legal services engaged by these establishments. These sales alsosupport jobs and wages of workers in businesses that serve consumers.Indirect economic impacts were derived from “input/output accounts” (I/O) maintained by the Bureau ofEconomic Analysis (BEA, U.S. Department of Commerce). The I/O accounts are a time series of detailed,consistent information on the flows of goods and services, linking the economic transactions of businesses withsuppliers. I/O accounts can be used to study the relative importance of an industry to all other industries and toestimate changes in regional economies. The accounts are an important tool for analysis because they show theproduction functions of individual industries and the interactions among producers and between producersand final users in the economy.Indirect economic impacts in this assessment are based on specific economic activities anticipated fromimplementing a Build Alternative, including displacement of businesses due to construction, or increases inon-<strong>Airport</strong> activity, off airport visitor spending and other off airport jobs. Potential displacement of businessesChapter 5 - Environmental Consequences 5-79 July 2011\\mawatr\ev\09228.00\reports\<strong>FEIS</strong>_Final_July_2011\<strong>PVD</strong>_CH05_Environmental_Cons_JUL_2011.doc
T.F. <strong>Green</strong> <strong>Airport</strong> <strong>Improvement</strong> <strong>Program</strong>Environmental Impact Statement and Final Section 4(f) Evaluationfrom construction and projected additional aviation activity are expected to have a series of negative or positiveeffects on the city and state economies. These impacts are measurable in business sales that support jobs andwages (for positive impacts) or diminish jobs and wages (for negative impacts). This methodology estimates thescales of additional economic activities in Warwick and Rhode Island that could take the form of increased ordecreased sales at established businesses, business formation or closings, or a combination of these dynamics.City of Warwick Property Tax Impact Assessment MethodologyThe value of the properties that would be acquired was calculated in order to identify the direct impacts (losses)to City property tax revenue due to residential land acquisitions. The City of Warwick’s 2010 estimated totallocal tax revenue base of $204,173,334 (provided by Rhode Island Municipal Affairs, Department ofAdministration) was developed to compare the tax impacts for Alternatives B2 and B4 to the overall local taxbase. The assessed values (based on the City of Warwick’s 2010 property assessment data) were used. Based onsales data assembled and analyzed under the Completed Part 150 VLAP as well as sales prices from theMultiple Listing Service, assessed values are considered to be equivalent to market values.City of Warwick Fiscal Impacts Assessment MethodologyThe estimated fiscal impacts related to residential acquisitions for Alternatives B2 and B4, in 2015 and 2020combined were analyzed and included effects on the City of Warwick municipal expenditures for recycling andsanitation, composting, police and fire and rescue operations. School fiscal impacts were also analyzed and arepresented separately. The municipal service and school impact costs were based on the estimated number ofresidential acquisitions for Alternatives B2 and B4 in 2015 and 2020. The following inputs were used in order tocalculate the impacts related to municipal services and schools:• Housing units that would be acquired under each Alternative were compared to Baseline Conditionhousing unit estimates (38,892) for the City of Warwick (provided by DemographicsNow);• Municipal and school expenditure and revenue data was based on the 2008 City of Warwick General FundBudget representing the most current data available;• Municipal service costs were calculated for recycling and sanitation, composting, police, and fire and rescueoperations based on the 2008 City of Warwick General Fund Budget, which was the most current dataavailable; and• Municipal and school expenditures were calculated on a net basis (municipal and school revenuessubtracted from municipal and school expenditures).Economic Impacts AssumptionsThe following assumptions were used in the economic impact analyses:• According to Rhode Island Department of Labor and Training, the total number of privatesector establishments and employees in Warwick are 3,315 and 48,478, respectively.• Annual Dollars reported are from 2006 and have not been inflated to 2020 or 2025 values.Chapter 5 - Environmental Consequences 5-80 July 2011\\mawatr\ev\09228.00\reports\<strong>FEIS</strong>_Final_July_2011\<strong>PVD</strong>_CH05_Environmental_Cons_JUL_2011.doc
T.F. <strong>Green</strong> <strong>Airport</strong> <strong>Improvement</strong> <strong>Program</strong>Environmental Impact Statement and Final Section 4(f) Evaluation• All mandatory commercial property acquisitions required for construction of the T.F. <strong>Green</strong> <strong>Airport</strong><strong>Improvement</strong> <strong>Program</strong> would be completed prior to construction initiation and in accordance with theURA. For the purposes of the <strong>FEIS</strong> economic impact analysis, because the current assessed value of 2010represents fair market value, 2010 is used as the year on which land acquisition cost is estimated. At thetime of acquisition, a property’s value would be determined through the appraisal process before a finalacquisition cost could be determined.• FAA-recommended RPZ-related land acquisitions would be voluntary (as stated previously inSection 5.1.4, Land Acquisition Assumptions) and it is assumed for this analysis that there would be100 percent participation by eligible residents. For commercial businesses located within the RPZ, it ispossible that owners would choose not to participate in the voluntary acquisition program since closeproximity to the <strong>Airport</strong> potentially provides economic benefits depending on the type of business.• Non-manufacturing jobs lost due to business displacement would be replaced in the area; manufacturingand warehousing sector jobs would not be replaced in Warwick or neighboring communities.• For purposes of this analysis, indirect and induced impacts are discussed together as secondary impactsand, therefore total impacts are the sum of direct and secondary impacts.Social and Housing Direct and Indirect Impacts MethodologyThe social and housing impact analysis is based on the identification of individual properties (residential,including, at the City of Warwick's request, affordable housing units ) that would be acquired to buildAlternatives B2 and B4 due to runway and roadway construction; land acquisition for noise mitigation(proposed for residential properties that would be exposed to DNL 70 dB and above); and land acquisitionwithin the newly created RPZ, as recommended by the FAA. The affected properties were identified usinginformation from the GIS database, which includes a compilation of RIGIS and parcel level informationprovided by the City of Warwick. The estimated City of Warwick housing stock of 38,892 units (according toDemographicsNow) serves as a baseline against which to evaluate <strong>Improvement</strong> <strong>Program</strong>-related impacts. 334 Inorder to identify the number and type of residential properties to be acquired, affected properties wereidentified by comparing the limit of disturbance for construction of the <strong>Airport</strong> enhancements, including theRPZ and noise mitigation land acquisition areas to the land use base. Field surveys and aerial photographs wereused to confirm the affected residential properties. Interviews with property owners and managers were used togather information on rents on larger properties of more than five units.A qualitative analysis of community disruption, including the impact to residential areas and neighborhoodsfrom changes in land use, was conducted based on the list of properties to be acquired as well as an analysis ofneighborhood conditions.334 The U.S. Census Bureau estimates numbers of housing units as 37,401 in 2006 (American Communities Survey).Chapter 5 - Environmental Consequences 5-81 July 2011\\mawatr\ev\09228.00\reports\<strong>FEIS</strong>_Final_July_2011\<strong>PVD</strong>_CH05_Environmental_Cons_JUL_2011.doc
T.F. <strong>Green</strong> <strong>Airport</strong> <strong>Improvement</strong> <strong>Program</strong>Environmental Impact Statement and Final Section 4(f) EvaluationSocial and Housing Impacts AssumptionsRefer to Section 5.1.4, Land Acquisition Assumptions, for assumptions on land acquisition for the Alternatives B2and B4. The following assumptions were used in the social and housing impact analysis:• Demographic impact estimates are based on the Study Area Baseline Condition and the 2000 Census. 335• All mandatory residential property acquisitions required for construction of the T.F. <strong>Green</strong> <strong>Airport</strong><strong>Improvement</strong> <strong>Program</strong> would be completed prior to construction initiation and in accordance with theURA. Property values are based on the 2010 City of Warwick property assessment data (as explained aboveunder ‘Economic Impacts Assumptions’).• New and planned developments that are part of the No-Action Alternative would be built by 2020 (as listedin Table 5-5).• Current zoning as identified by the City of Warwick Zoning Ordinance would remain in place.• Residences participating in the voluntary land acquisition program for noise mitigation would not bedeveloped for higher uses, such as industrial or commercial development, under the Alternatives. 336• The state definition of “affordable” housing types per Rhode Island General Laws 42-128-8.1 and 45-55-3was used. 337Temporary Impacts from Short-Term Construction Activities MethodologyConstruction investment in the <strong>Improvement</strong> <strong>Program</strong> would provide temporary economic benefits to people inWarwick and Rhode Island. Construction spending would generate jobs for the duration of the T.F. <strong>Green</strong><strong>Airport</strong> <strong>Improvement</strong> <strong>Program</strong>, which in turn would create wages and would lead to purchases of constructionmaterials and related services (indirect impacts), as well as construction workers spending their wages onconsumer purchases in the city and state (induced impacts).Temporary construction jobs and wages are based on estimated construction budgets of Alternatives B2 and B4.The line items of spending presented in the construction budget 338 were translated into IMPLAN industriesbased on the closest match of activity and industry, including: building construction; road construction;maintenance and repair of roads; maintenance and repair of buildings; and other maintenance and repair. Theresulting multipliers for each industry (for Warwick and Rhode Island) were used in compiling the totaleconomic impacts.The direct construction jobs generated for Alternatives B2 and B4 were comprised of the actual on-siteemployees (which only included construction laborers and foremen) along with the estimated support jobsrequired for construction activity. These supporting jobs would include secretaries, engineers, and managers(among others). The direct income was measured by applying the income per worker for each industry to its335 Although some 2010 census data was released in March 2011, a sufficient level of census data for the <strong>FEIS</strong> analysis was not released prior to the filing ofthe <strong>FEIS</strong>.336 Refer to Section 5.4, Compatible Land Use, for a description of RIAC’s current Noise Land Re-Use Plan and the City of Warwick’s current zoning ofresidential areas eligible for noise mitigation.337 Affordable housing is defined by the Rhode Island General Law 42-128-8.1. Available on the internet at: www.rilin.state.ri.us/statutes/.338 Two key adjustments were made to the original budget. First, the 10% contingency was removed from the total budget amount. The amount spent onEMAS was also removed, as this proprietary product is purchased outside Rhode Island and has no impact on Warwick’s or Rhode Island’s economy.Chapter 5 - Environmental Consequences 5-82 July 2011\\mawatr\ev\09228.00\reports\<strong>FEIS</strong>_Final_July_2011\<strong>PVD</strong>_CH05_Environmental_Cons_JUL_2011.doc
T.F. <strong>Green</strong> <strong>Airport</strong> <strong>Improvement</strong> <strong>Program</strong>Environmental Impact Statement and Final Section 4(f) Evaluationcorresponding direct jobs. The direct output (i.e., business sales) comes from the dollars of spending for eachindustry. Finally, the multipliers for jobs, income, and output were applied to their respective direct measuresby industry to achieve total economic impacts—including direct, indirect, and induced impacts. The resultingimpacts for Rhode Island are generally slightly higher than those for Warwick since there is leakage outside ofthe city that is captured in the state.Cumulative Impact MethodologyCumulative social impacts consider the historical and current land use changes and development, predictedfuture land use changes, and Alternatives B2 and B4 direct and indirect social impacts – all of which wereassessed for the Study Area. Economic impacts include employment trends analysis and an assessment of thetax benefits or losses for Warwick over the years. Historical data on local employment and tax revenue trends(according to the Rhode Island Department of Labor and Training (RIDLT) and Rhode Island EconomicDevelopment Corporation) were documented. Future projects (including approximately 1.5 million square feetof mixed use development surrounding InterLink as part of the WSRD) and projected impacts on employmentand taxes were also considered. Finally, the direct and indirect social and economic impacts of Alternatives B2and B4 were considered in order to identify cumulative impacts.5.5.3.2 Environmental Justice and Children’s Health and Safety Risk MethodologyEnvironmental justice and children’s health and safety risks assessments include consideration of directproject-related impacts and cumulative impacts to resources such as air quality and noise that may affectenvironmental justice populations and children’s health and safety. Effects of Alternatives B2 and B4 on fish, wildlife,and plants, wetlands, floodplains, hazardous materials, and endangered and threatened species would mostly occuron-<strong>Airport</strong> and would not impact environmental justice populations and children’s health and safety. Additionally,no significant coastal zone, water quality, and air quality impacts would occur as a result of Alternatives B2 and B4,and would similarly not affect environmental justice populations and children’s health and safety.Environmental Justice populations affected by land acquisition were considered and then excluded from theidentification of potential environmental justice populations affected by significant increases in noise. Inaccordance with the <strong>Airport</strong>’s ongoing Part 150 program, the compatible land use analysis identifies residentialland (in parcels and acres) within the DNL 70 dB contour that are eligible for acquisition 339 and residenceslocated between the DNL 65 dB and 69 dB contours would be eligible for sound insulation. The compatible landuse analysis also considers mandatory land acquisition related to construction and RPZ clearing forAlternatives B2 and B4.The analysis evaluates environmental justice populations within areas of mandatory land acquisition forconstruction and areas that would be eligible for acquisition under a Future Build VLAP (areas affected by noiselevels at or above DNL 70 dB and neighboring properties included in the Future Build VLAP). 340339 Residential properties that are not directly impacted by Project-related noise levels at or above the DNL 70 dB, but are indirectly affected are in certaincircumstances also eligible for voluntary land acquisition. At the discretion of the FAA, these residential properties were identified in order to maintainneighborhood cohesion and limit community disruption340 Under the Build Alternatives, the future noise mitigation program would be based on a 2020 Noise Exposure Map for Alternative B2 and 2015/2020 NoiseExposure Map for Alternative B4.Chapter 5 - Environmental Consequences 5-83 July 2011\\mawatr\ev\09228.00\reports\<strong>FEIS</strong>_Final_July_2011\<strong>PVD</strong>_CH05_Environmental_Cons_JUL_2011.doc
T.F. <strong>Green</strong> <strong>Airport</strong> <strong>Improvement</strong> <strong>Program</strong>Environmental Impact Statement and Final Section 4(f) EvaluationChanges in noise and land use would have the potential to affect residential areas that include minority,Hispanic, or low-income populations. In order to accommodate the Alternatives B2 and B4, off-<strong>Airport</strong>residential properties would be acquired and the residents or land uses would be relocated. Land acquisitionwould occur under both Alternative B2 and B4. FAA Order 1050.1E and 14 CFR Part 150 define the threshold ofsignificance for noise impacts (increase of at least DNL 1.5 dB at or above DNL 65 dB) to a noise-sensitiveresource when compared to the No-Action Alternative. Significant noise impacts would occur underAlternatives B2 and B4 and those residences and non-residential noise-sensitive sites (e.g., places of worship)would be eligible for sound insulation mitigation if they were not previously sound insulated.The U.S. Census Bureau collects separate data on Hispanic populations in addition to data on minoritypopulations because the concept of race is separate from the concept of Hispanic origin. The Bureau directsusers of the Census data to avoid combining race categories with Hispanic (a person could identify themselvesas both Hispanic and Black, Asian, or other race categories). Therefore, this analysis addresses minority andHispanic populations separately and the Hispanic population was not added to the total minority population toavoid the possibility of double counting.Impact MethodologyThe following methodologies were used to determine if the Alternatives B2 and B4 would result indisproportionately high and adverse impacts to minority, Hispanic, or low-income populations and to identifyany health and safety impacts to children.Determination of Significant ImpactsResults of the environmental consequences studies determine if significant impacts would occur underAlternatives B2 and B4. Determinations of significant effect were made in accordance with FAA Order 1050.1E,or other relevant federal or state regulations. The significant impacts were then evaluated for their potentialeffects to environmental justice populations.Identify Environmental Justice PopulationsMinority, Hispanic, and low-income populations were identified as described in Chapter 4, Affected Environmentand shown on Figure 4-13. The environmental justice analysis identifies the direct, physical impacts tosurrounding land uses and indirect effects of the Project, such as increased noise to noise-sensitive land uses.Also, a boundary of “maximum area of acquisition”, which includes proposed areas of land acquisition wasused to more specifically identify environmental justice impacts.Determine if Significant Impacts Disproportionately Affect Environmental Justice PopulationsEnvironmental justice is not an impact category standing alone. First, it must be determined if impacts in otherimpacts categories are significant or adverse (e.g., noise), and, if so, it is determined whether such impacts maybe felt disproportionately by minority or low-income communities. Since environmental justice considerationsdepend on the potential for significant impacts in other environmental categories, the area of analysis forenvironmental justice is the area of potential significant impacts for the other environmental impact categories.Census blocks or census block groups within the area of potential significant impacts were evaluated to identifyany with an environmental justice population above statewide averages. Analysis was then conducted toChapter 5 - Environmental Consequences 5-84 July 2011\\mawatr\ev\09228.00\reports\<strong>FEIS</strong>_Final_July_2011\<strong>PVD</strong>_CH05_Environmental_Cons_JUL_2011.doc
T.F. <strong>Green</strong> <strong>Airport</strong> <strong>Improvement</strong> <strong>Program</strong>Environmental Impact Statement and Final Section 4(f) Evaluationdetermine if the significant impacts of the environmental categories would disproportionately affectenvironmental justice populations. A disproportionate impact occurs if the adverse effects on environmentaljustice populations are appreciably more severe or greater in magnitude than the adverse effects experienced bythe non-minority or non-low-income populations.Children’s Health and Safety RiskHealth and safety risks to children include risks to health or safety that are attributable to products orsubstances that a child is likely to come into contact with or ingest, such as air, food, drinking water,recreational waters, soil, or products they might use or be exposed to. Analysis was conducted to determine ifsignificant air or water quality impacts would result from the Alternatives B2 and B4 and if these would occurin areas to which children have access.Cumulative Impact MethodologyPopulations affected by the Completed Part 150 VLAP and Current Part 150 VLAP (No-Action Alternative; as part ofRIAC’s Part 150 NCP) were evaluated to determine if this program would disproportionately impact environmentaljustice communities. Reasonably foreseeable developments in the City of Warwick were also considered.5.5.4 Social and Socioeconomic Impact AssessmentThe impact analysis identifies the economic benefits associated with Alternatives B2 and B4 to the City ofWarwick and the State of Rhode Island, which would include gains in jobs, wages, business revenues, and statesales and income taxes. These gains are associated with the additional aircraft operations and passengers thatcould be accommodated due to an extended Runway 5-23. In addition, the impact analysis identifies social andcommunity impacts based on the properties (residential and commercial), required for Alternatives B2 and B4due to runway construction as well as acquisitions under the Future Build VLAPs for residential properties thatwould be exposed to DNL 70 dB and above and land acquisitions associated with clearing the RPZs. The effectsof displaced businesses on employment and direct impacts (losses) to City property tax revenue due to landacquisitions are also presented as well as effects of short-term temporary construction activities. A cumulativeimpact assessment is also provided.5.5.4.1 No-Action AlternativeAviation activity impacts (direct and indirect) are discussed as they relate to ongoing airport operations underthe No-Action Alternative. Direct economic impacts (losses of jobs, income, and business revenues due tocommercial property acquisition) would not result from the No-Action Alternative because no land acquisitionwould be required. Direct social impacts presented below are due to residential land acquisition for theCompleted Part 150 VLAP and Current Part 150 VLAP (No-Action Alternative; as part of RIAC’s ongoingPart 150 NCP).Aviation Activity ImpactsThe following sections present the direct and indirect losses and benefits generated by T.F. <strong>Green</strong> <strong>Airport</strong> underthe No-Action Alternative. Direct impacts refer to the actual on-<strong>Airport</strong> effects of airport operations andpassenger activity associated with the No-Action Alternative. Indirect impacts include the total impact for theCity of Warwick and Rhode Island (secondary impacts added to the direct impacts).Chapter 5 - Environmental Consequences 5-85 July 2011\\mawatr\ev\09228.00\reports\<strong>FEIS</strong>_Final_July_2011\<strong>PVD</strong>_CH05_Environmental_Cons_JUL_2011.doc
T.F. <strong>Green</strong> <strong>Airport</strong> <strong>Improvement</strong> <strong>Program</strong>Environmental Impact Statement and Final Section 4(f) EvaluationOn-<strong>Airport</strong> impacts are generated by a combination of passengers and operations. Overall, future total (annual)aircraft operations are projected to decline under the No-Action Alternative in 2015, 2020, and 2025 whencompared to the Baseline Condition operations (2004), based on the FAA’s Draft 2010 TAF for T.F. <strong>Green</strong><strong>Airport</strong> (as directed by FAA Order 5050.4B section 504 b). This decline in projected future airport operations isdue to continuing changes in the aviation industry associated with the national economic downturn (aspreviously discussed in Section 5.1.3, Operations Forecast Update). Therefore, there would be a decline in directjobs, wages, and business revenue in most airport-related business sectors in 2015, 2020, and 2025. However,off-<strong>Airport</strong> visitor spending (indirect or secondary impacts) is based on passengers (not operations) which isprojected to decrease in 2015, but increase in 2020 and 2025 under the No-Action Alternative compared to theBaseline Condition. This increase is because forecast passenger activity levels are anticipated to increase at ahigher rate than operations due to more efficient utilization of aircraft by airlines (resulting in decreased“capacity”, or operations) while still accommodating greater passenger demand resulting in higher aircraft loadfactors (greater percentage of seats filled by paying passengers on each flight).Direct Aviation Activity ImpactsDirect impacts as a result of aviation activities would include the actual on-<strong>Airport</strong> effects of air operations andpassenger activity. Based on a projected decline in aircraft operations in 2015, 2020 and 2025, there would be lossesin annual jobs, wages and business sales for passenger airlines, airport operations, and support services whencompared to the Baseline Condition. Overall, in 2015, 2020, and 2025, total direct economic impacts would benegative for most airport-related business sectors (for Warwick and Rhode Island also), as presented in Table 5-50.Table 5-50No-Action Alternative: Aviation Activity-Related Direct Impacts from On-<strong>Airport</strong> EconomicImpacts (Losses and Gains)Jobs Wages Business SalesBusiness Sector 2015 2020 2025 2015 2020 2025 2015 2020 2025Passenger Airlines -91 -72 -52 -$4,860,000 -$3,853,000 -$783,000 -$8,488,000 -$6,729,000 -$4,851,000<strong>Airport</strong> Operations -126 -100 -72 -$6,744,000 -$5,346,000 -$1,086,000 -$17,591,000 -$13,945,000 -$10,054,000Car Rental -41 10 8 -$986,000 $251,000 $1,635,000 -$2,879,000 $733,000 $4,774,000Support Services -96 -76 -55 -$2,676,000 -$2,121,000 -$431,000 -$5,098,000 -$4,041,000 -$2,914,000Terminal businesses -19 5 4 -$340,000 $87,000 $563,000 -$814,000 $207,000 $1,350,000Parking, Bus and Taxi -14 3 3 -$263,000 $67,000 $436,000 -$550,000 $140,000 $912,000Total Direct 1 -387 -229 -163 -$15,868,000 -$10,916,000 -$5,528,000 -$35,420,000 -$23,634,000 -$10,782,000Warwick Total Impact 2 -538 -322 -229 -$21,515,000 -$14,752,000 -$7,392,000 -$43,389,000 -$28,643,000 -$12,551,000RI Total Impact 2 -739 -451 -322 -$27,759,000 -$19,088,000 -$9,654,000 -$52,231,000 -$34,322,000 -$14,772,000Sources: Rhode Island <strong>Airport</strong> Economic Impact Study, Wilbur Smith Associates, June 2006; IMPLAN; EDR Group.1 Direct impacts refer to the actual on-<strong>Airport</strong> effects of additional air operations and passenger activity generated by the Alternative.2 The “total impact” for the City of Warwick and Rhode Island include indirect impacts added to the direct impacts.Indirect Aviation Activity ImpactsOff-<strong>Airport</strong> expenditures in visitor-related industries, or visitor spending, including hotels, restaurants andbars, entertainment, retail, and local transportation is based on the number of projected passengers. Under theNo-Action Alternative in 2015, the number of passengers is projected to decrease when compared to theChapter 5 - Environmental Consequences 5-86 July 2011\\mawatr\ev\09228.00\reports\<strong>FEIS</strong>_Final_July_2011\<strong>PVD</strong>_CH05_Environmental_Cons_JUL_2011.doc
T.F. <strong>Green</strong> <strong>Airport</strong> <strong>Improvement</strong> <strong>Program</strong>Environmental Impact Statement and Final Section 4(f) EvaluationBaseline Condition, which would result in a loss in indirect jobs, income, and business sales for the City ofWarwick and Rhode Island. In 2020 and 2025, there would be additional passengers (despite decreasingoperations, as discussed above) under the No-Action Alternative when compared to the Baseline Condition.Table 5-51 presents the total indirect impacts (jobs, wages, and business sales) for the City of Warwick andRhode Island under the No-Action Alternative in 2015, 2020, and 2025.Table 5-51No-Action Alternative: Aviation Activity-Related Indirect Impacts from Off-<strong>Airport</strong> VisitorSpending and Jobs and Wages (Gains)WarwickRhode IslandTotal Impact 1 Jobs Wages Business Sales Jobs Wages Business Sales2015 -115 -$2,921,000 -$7,560,000 -655 -$17,946,000 -$47,326,0002020 29 $744,000 $1,925,000 167 $4,569,000 $12,051,0002025 190 $4,845,000 $12,538,000 1,087 $29,762,000 $78,489,000Sources: Rhode Island <strong>Airport</strong> Economic Impact Study, Wilbur Smith Associates, June 2006; IMPLAN, RIDLT; EDR Group.1 Total impacts include indirect impacts added to direct impacts.Overall, when considering indirect impacts, in 2015, the decline in aviation-related activities associated with theNo-Action Alternative is expected to result in an annual loss in state taxes (taxable income and sales) of$1.5 million in 2015, followed by gains of $144,000 in 2020, and $3.7 million in 2025 when compared to theBaseline Condition (Table 5-51). The bulk of these tax revenues projected for 2020 and 2025 would be generatedby new visitors (which occur because the number of passengers is projected to increase, despite the projecteddecline in aircraft operations, as discussed above) to Rhode Island.Social and Housing ImpactsThe Completed Part 150 VLAP was completed in 2009 and the Current Part 150 VLAP, initiated in early 2010 asa continuation of RIAC’s Part 150 NCP, is scheduled to be completed by 2015. Figure 5-8 shows the CompletedPart 150 VLAP areas. At the time of this <strong>FEIS</strong> filing, the Completed Part 150 VLAP has completed all sevenphases. The Completed Part 150 VLAP identified 285 residential parcels (280 housing units) located in sevennoise impacted areas in close proximity to the <strong>Airport</strong>, most of which were acquired by 2009. There are severalproperty owners that have elected not to participate in the Completed Part 150 VLAP; however, RIAC willconsider reinstating them under a future phase, contingent on funding availability.Direct Impacts to HousingUnder the No-Action Alternative, RIAC would continue the Current Part 150 VLAP as part of itsPart 150 NCP. Figures 5-19 and 5-20 show the parcels included in the Current Part 150 VLAP. The Current Part150 VLAP would result in acquisition of 59 residential parcels (55 housing units) at the Runway 5 End and56 residential parcels (80 housing units, including multi-family units) at the Runway 23 End for a total of115 parcels (135 housing units). 341 It is assumed that all eligible parcels would be acquired by 2015. No subsidizedlow- and moderate-income housing units would be acquired under Alternative B2 (refer toSection 5.5.6, Affordable Housing Analysis).341 Of the 135 housing units, 127 units are defined as affordable. Of the affordable units, there are 101 single-family units and 26 multi-family units.Chapter 5 - Environmental Consequences 5-87 July 2011\\mawatr\ev\09228.00\reports\<strong>FEIS</strong>_Final_July_2011\<strong>PVD</strong>_CH05_Environmental_Cons_JUL_2011.doc
T.F. <strong>Green</strong> <strong>Airport</strong> <strong>Improvement</strong> <strong>Program</strong>Environmental Impact Statement and Final Section 4(f) EvaluationIndirect Impacts to Housing AffordabilityThe reduction of housing stock as a result of the No-Action Alternative equates to 0.19 percent of the estimatedhousing stock in Kent County in 2006 and 0.36 percent of the estimated housing stock extant in Warwick in2006. If no replacement housing were constructed and if all relocated households settled within Kent County,overall vacancy rates would decrease by 0.18 percentage points in Kent County, holding all other factors equal.This reduction in vacancy rates could be expected to have some indirect impact on housing affordability byraising rents and home prices within the County, albeit only marginally.5.5.4.2 Alternative B2This section summarizes the results of the social and economic impacts analysis for Alternative B2 in 2020, and2025. Social and economic benefits, associated with Alternative B2 include additional jobs, wages, and businesssales associated with the additional aircraft operations and approximately 767,825 passengers annually thatcould be accommodated on the extended Runway 5-23 compared to the No-Action Alternative. These aviationrelatedactivities associated with Alternative B2 would benefit the City of Warwick, surrounding communities,and the State of Rhode Island annually starting in 2020. Social and economic negative impacts associated withAlternative B2 include impacts associated with residential and commercial land acquisition and the associatedloss of property tax revenue.Aviation Activity Impacts – 2020 and 2025The following sections summarize the direct and indirect economic impacts (gains) due to the increased aviationactivity associated with Alternative B2 in 2020 and 2025.Direct Aviation ImpactsUnder Alternative B2, no changes in aviation-related activities are expected in 2015 since the extension ofRunway 5-23 does not come on line until 2020. Direct impacts associated with the extension of Runway 5-23starting in 2020 would include the on-<strong>Airport</strong> effects of additional aircraft operations and passenger activity.Based on forecast increases of approximately 8,780 operations, and 767,825 passengers, an additional$16.0 million in business activities are expected at the <strong>Airport</strong> in 2020, increasing to more than $17.5 million by2025. These expenditures would support 223 new jobs, paying over $7.1 million in 2020, and 233 new jobs and$7.4 million in wages by 2025.342 These impacts are even greater when multiplier effects are taken into accountand have an impact on statewide employment, wages, and spending.Indirect Aviation ImpactsIn addition to passenger activity expected under the No-Action Alternative in 2020, approximately 767,825passengers are projected to use T.F. <strong>Green</strong> <strong>Airport</strong> as a result of Alternative B2. These additional passengers wouldgenerate off-<strong>Airport</strong> expenditures in visitor-related industries in addition to the visitor expenditures expectedfrom the No-Action Alternative, including hotels, restaurants and bars, entertainment, retail, and localtransportation. It is anticipated that visitors would spend an additional approximately $12.8 million in the City ofWarwick in 2020 and $13.8 million in 2025, while visitor spending throughout Rhode Island would be nearly$80 million in 2020 and $86.7 million in 2025. This visitor spending is expected to generate an additional 194 jobs in342 Derived from ratios of aviation business that were used for the <strong>Airport</strong> in the Rhode Island <strong>Airport</strong> Economic Impact Study - Update 2006.Chapter 5 - Environmental Consequences 5-88 July 2011\\mawatr\ev\09228.00\reports\<strong>FEIS</strong>_Final_July_2011\<strong>PVD</strong>_CH05_Environmental_Cons_JUL_2011.doc
T.F. <strong>Green</strong> <strong>Airport</strong> <strong>Improvement</strong> <strong>Program</strong>Environmental Impact Statement and Final Section 4(f) Evaluationthe City of Warwick and over 1,108 in the State by 2020. By 2025, visitor spending is expected to support over anadditional 210 jobs in the City of Warwick and over 1,200 statewide, again including economic multiplier effects.Based on the 2020 and 2025 forecasts, the increased airport activity is expected to generate 342 jobs in the City ofWarwick by 2020 and 391 jobs by 2025. The leading sectors would be hospitality (96 jobs in 2020 and 120 by 2025 inaddition to what are expected to support additional visitor spending), technology (44 jobs in 2020 and 47 jobs by2025) and wholesaling (16 jobs in 2020 and 18 in 2025). For the City of Warwick, activity in all sectors would resultin a direct gain of $6.2 million in wages and $20.0 million in business revenues in 2020 and $7.0 million in wagesand $22.7 million in business revenues in 2025. Additional gains would accrue to the City of Warwick throughmultiplier effects, as well as to Rhode Island as a whole. Overall, it is estimated this growth could create additionalproperty tax revenue for the City due to the commercial space demands anticipated (approximately 117,000 squarefeet in 2020 increasing to approximately 134,000 square feet in 2025 based on current vacancy rates).Total Aviation ImpactsAlternative B2 would result in increased aviation activity and would provide opportunities for increasedaviation-related business activity (such as warehouse, repair services, retail services for additional airline andairport employees) and other airport-reliant businesses (such as manufacturers, universities, research anddevelopment organizations and services businesses). <strong>Airport</strong>-related businesses have located along Post Road as aresult of previous airport expansions. As a result, Post Road has become a major commercial corridor. Theseopportunities for increased business activity would moderate jobs lost due to commercial land acquisitionsassociated with Alternative B2. Table 5-52 summarizes the total economic impacts for Alternative B2.Table 5-52Alternative B2 Aviation Activity: Related Total Economic Impacts (Gains) in the City ofWarwick and State of Rhode Island in 2020 and 2025Alternative B2 - Total Economic Impact (Annual) 1Type of impact 2020 2 2025 3City of WarwickTotal Impacts to JobsTotal Impacts to Personal Taxable IncomeTotal Impacts to Taxable Business RevenueState of Rhode IslandTotal Additional JobsTotal Impacts to Personal Taxable IncomeTotal Impacts to Taxable Business Revenue797$24,908,000$63,328,0001,813$53,104,000$135,998,000873$27,021,000$69,961,0001,967$57,416,000$147,538,000Source: ADE, IMPLAN, Rhode Island <strong>Airport</strong> Economic Study (Wilbur Smith Associates, June 2006), RIDLT.1 Includes direct and indirect impacts from on-<strong>Airport</strong> business activities, visitor spending, and development of spin off-<strong>Airport</strong>-related business in the City.2 Represents the total economic gains (jobs, taxable income and taxable business revenue) generated in 2020 as a result of the Build Alternative.3 Represents the total economic gains, including those already created in 2020 as a result of the Build Alternative (i.e., there would be 76 additional jobs created in2025 over 2020).Chapter 5 - Environmental Consequences 5-89 July 2011\\mawatr\ev\09228.00\reports\<strong>FEIS</strong>_Final_July_2011\<strong>PVD</strong>_CH05_Environmental_Cons_JUL_2011.doc
T.F. <strong>Green</strong> <strong>Airport</strong> <strong>Improvement</strong> <strong>Program</strong>Environmental Impact Statement and Final Section 4(f) EvaluationGiven the additional flight operations associated with the Alternative B2, by 2025, a total of 873 jobs would becreated in the City of Warwick (an additional 76 jobs from 2020) and 1,967 throughout Rhode Island (anadditional 154 jobs from 2020), with the bulk being generated by new on-<strong>Airport</strong> spending.An additional component of the economic impact from Alternatives B2 and B4 is the taxable income and sales taxthat would be derived from new on-<strong>Airport</strong> business, visitor spending, and spin-off <strong>Airport</strong>-reliant businesses inthe City of Warwick. Overall, new airport-related activities associated with Alternative B2 are expected toannually generate over $2 million dollars in state taxes by 2020. The bulk of these revenues would be producedby new visitors to Rhode Island. Overall cumulative gains state-wide would reach an estimated $331.4 millionin personal taxable income and $850.2 million in taxable business revenues associated with Alternative B2.Business and Employment Impacts – 2020This section summarizes the direct impacts to businesses and employment due to commercial land acquisitionsfor construction and FAA-recommended RPZ clearing as well as indirect impacts to the community associatedwith Alternative B2. No businesses would be displaced under a Future Build VLAP because business uses arenot considered incompatible land uses with predicted noise levels.Table 5-53 summarizes the displaced businesses and jobs lost associated with commercial property acquisitions dueto mandatory construction.Based on anticipated mandatory acquisitions for construction, Alternative B2 would result in a loss of parcels thatinclude 38 businesses and 309 jobs. Thirty-two businesses would be displaced due to the shift in Runway 16 to thenorth, while an additional four businesses would be displaced by the Fully Relocated <strong>Airport</strong> Road.Alternative B2 would require the acquisition of <strong>Airport</strong> Plaza located at the intersection of <strong>Airport</strong> Road andPost Road due to construction of the Runway 16-34 Runway Safety Area enhancements.Table 5-53 also indicates the number of “most threatened” businesses and jobs, including personal taxable incomeand taxable business revenue impacts, although Alternative B2 is expected to generate limited warehousing andmanufacturing jobs five or more years after the parcels are taken. 343 Without immediate relocation or absorption,total direct losses in employment from these businesses would result in a total loss of 39 jobs, $1.5 million in wagesand $5.7 million in business revenues for Warwick. For Rhode Island, without immediate relocation or absorption,total direct losses in employment from these businesses would result in a total loss of 78 jobs, $3.9 million inwages, and $15.1 million in business sales. Parcels containing three firms and 96 jobs fall within the RPZ andwould be displaced on a voluntary basis. Acquisition of land within the RPZ is an FAA recommendation and isnot a required action for lands where people do not assemble. Therefore, RPZ-related property acquisition wouldbe subject to funding availability and the willingness of land owners to participate.343 Unlike the manufacturing/warehousing jobs created due to increased aviation activity, which are motivated to locate within Warwick specifically to be nearthe airport, businesses being displaced by an Alternative are not specifically motivated to relocate near the airport and will therefore be consideringlocations throughout the state or beyond, based on cost, availability and industry-specific operational considerations.Chapter 5 - Environmental Consequences 5-90 July 2011\\mawatr\ev\09228.00\reports\<strong>FEIS</strong>_Final_July_2011\<strong>PVD</strong>_CH05_Environmental_Cons_JUL_2011.doc
T.F. <strong>Green</strong> <strong>Airport</strong> <strong>Improvement</strong> <strong>Program</strong>Environmental Impact Statement and Final Section 4(f) EvaluationTable 5-53Alternative B2: Economic Impacts (Losses) in 2020 due to Business Displacement forConstruction (Mandatory)Total AffectedType Business Businesses 1 Square Feet JobsAgriculture 1 0 3Health Care 0 0 0Manufacturing 2 17,659 24Other Services 9 3,476 7Restaurant 10 22,432 166Retail 15 109,952 97Warehouse 1 11,785 12Total 38 165,304 309Most Threatened Businesses 2Personal Taxable Taxable BusinessType Business Businesses 1 Square Feet Jobs Income RevenuesAgriculture 1 - 3 ($32,000) ($120,000)Manufacturing 2 17,659 24 ($1,050,000) ($4,962,000)Warehouse 1 11,785 12 ($381,000) ($644,000)Total Direct Impacts 4 29,443 39 ($1,463,000) ($5,725,000)Total Impacts in Warwick 3 n/a n/a 64 ($3,032,000) ($11,459,000)Total Impacts in RI 4 n/a n/a 78 ($3,861,000) ($15,136,000)Sources: City of Warwick Assessors Data Base and site visits to document number of businesses, Dunn and Bradstreet, Urban Land Institute and Energy InformationAdministration to estimate direct employment. RI Department of Labor and Training to calculate wages per job. IMPLAN modeling package calibrated for Warwickand Rhode Island to estimate total impacts. EDR Group.1 Businesses displaced due to acquisition of properties for all program elements.2 Businesses and jobs unlikely to relocate within the City of Warwick due to limited vacant and developable industrial lands.3 Total Impacts include direct and indirect impacts using multiplier effects.4 Total Impacts in Rhode Island include total impacts in the City of Warwick.NA No building square footage is associated with property (i.e., the lot of a car rental place), or no businesses or jobs are associated with square footage.City of Warwick Property Tax Impacts - 2020Table 5-54 presents the total property taxes (residential and commercial) that would be lost to the City ofWarwick in either 2015 or 2020 due to land acquisitions for construction, RPZ clearing, and a Future BuildVLAP beginning in 2020 for each element of Alternative B2. Residential acquisitions are presented below underSocial and Housing Impacts – 2020.Chapter 5 - Environmental Consequences 5-91 July 2011\\mawatr\ev\09228.00\reports\<strong>FEIS</strong>_Final_July_2011\<strong>PVD</strong>_CH05_Environmental_Cons_JUL_2011.doc
T.F. <strong>Green</strong> <strong>Airport</strong> <strong>Improvement</strong> <strong>Program</strong>Environmental Impact Statement and Final Section 4(f) EvaluationTable 5-54Alternative B2: Direct Annual Property Tax Impacts (Losses)Safety Enhancement Elements 1 Efficiency Enhancement Elements 2Terminal FullyPartially Area and Relocated IntegratedRelocated Access <strong>Airport</strong> CargoTax and Acquisition Type Runway 16 Runway 34 <strong>Airport</strong> Road Runway 5 Runway 23 3 Road Road Facility TotalResidential Property Acquisition –Mandatory for Construction $1,264 $0 $0 $0 $0 $0 $165,334 $0 $166,598Residential Property Acquisition –Voluntary Noise (2020) 4 $0 $0 $0 $36,129 $53,279 $0 $0 $0 $89,408Residential Property Acquisition –Voluntary RPZ 5 $0 $0 $0 $100,968 $137,915 $0 $0 $0 $238,883Commercial Property Acquisition –Mandatory for Construction $499,570 $0 $35,241 $0 $0 $0 $32,969 $0 $567,780Commercial Property Acquisition –Voluntary RPZ 5,6 $0 $0 $0 $0 $111,328 $0 $0 $0 $111,328Total Direct Tax ImpactsMandatory (Property Taxes) $500,834 $0 $35,241 $0 $0 $0 $198,303 $0 $734,378Total Direct Tax ImpactsVoluntary (Property Taxes) $0 $0 $0 $137,097 $302,522 $0 $0 $0 $439,619Source: City of Warwick Assessor’s Office, The Tax Foundation and RI MapStats from FedStats, VHB, RKG Associates, Inc, EDR Group.1 Assumes annual tax loss starting in 2015.2 Assumes annual tax loss starting in 2020.3 Includes acquisitions associated with the proposed extension of Runway 23 and the relocated road for the Airfield Maintenance Facility.4 Assumes annual tax loss starting in 2020 because for the purposes of the Alternative B2 <strong>FEIS</strong> analyses, residential properties are assumed to be acquiredbetween 2020 and 2025; however, it is RIAC’s intention to begin to acquire residential parcels as soon as 2012, subject to funding availability).5 RPZ clearing is an FAA recommendation, and is not a required action. Therefore, RPZ-related property acquisition would be voluntary and subject to funding availability.6 For the purposes of this <strong>FEIS</strong>, it is assumed that there would be 100 percent participation by property owners in a voluntary program; however, for commercialbusinesses located within the RPZ, it is possible that owners would choose not to participate in the voluntary acquisition program. RPZ clearing is a FAArecommendation,and is not a required action. Therefore, RPZ-related property acquisition would be subject to funding availability.Starting in 2015, under Alternative B2, up to approximately $536,075 in commercial and some residentialproperty taxes would be lost to the City of Warwick due to the safety enhancements, including PartiallyRelocated <strong>Airport</strong> Road (to be completed by the end of 2015). Starting in 2020, an additional $637,922 in annualtax revenue would be lost to the City of Warwick due to the efficiency enhancements, including $198,303 lostdue to residential and commercial land acquisitions required for construction of Fully Relocated <strong>Airport</strong> Roadand $439,619 lost due to land acquisition associated with a Future Build VLAP and newly created RPZ for atotal annual loss of $1,173,997 under Alternative B2. This represents less than one percent of the City’s projectedlocal tax revenue base for 2010 ($204,173,334). The majority of residential property taxes lost are associated withresidential acquisitions under a Future Build VLAP ($238,883 per year). Direct losses in commercial property taxrevenue due to the required acquisitions for construction would total $567,780 per year, representing 0.3 percentof the City’s total property tax base. An additional $111,328 of commercial property taxes would be lost due toland acquisition associated with clearing the RPZ for Runway 23. For the purposes of this <strong>FEIS</strong>, it is assumedthat there would be 100 percent participation; however, for commercial businesses located within the RPZ, it ispossible that owners would choose not to participate since close proximity to the <strong>Airport</strong> potentially provideseconomic benefits depending on the type of business.Chapter 5 - Environmental Consequences 5-92 July 2011\\mawatr\ev\09228.00\reports\<strong>FEIS</strong>_Final_July_2011\<strong>PVD</strong>_CH05_Environmental_Cons_JUL_2011.doc
T.F. <strong>Green</strong> <strong>Airport</strong> <strong>Improvement</strong> <strong>Program</strong>Environmental Impact Statement and Final Section 4(f) EvaluationUnder Alternative B2, land acquisition for RSA enhancements to Runway 16-34 and Partially Relocated <strong>Airport</strong>Road (the safety enhancements) would be completed by the end of 2015, and land acquisition for extendingRunway 5-23 to 8,700 feet and Fully Relocated <strong>Airport</strong> Road (the efficiency enhancements) would be completedby 2020. Beginning in 2015, the cumulative property tax losses associated with safety enhancements would total$2.7 million by 2020. Beginning in 2020, an additional $637,922 in annual property tax losses associated with theefficiency enhancements would total $3.2 million by 2025. Cumulatively, by 2025, approximately $5.9 million inresidential and commercial property tax revenue would be lost to the City of Warwick due to Alternative B2.All results are for direct property tax losses from property acquisitions and do not account for the offsettingeffects of increased economic activity within the City resulting from the aviation enhancements.According to a review of the current real estate market and based on the Current Part 150 VLAP, there aresufficient mitigation opportunities (available real estate) to relocate residents and businesses in or around Warwickunder Alternative B2. For businesses, as of 2010, there is some vacancy in existing office and industrial propertieswithin the City of Warwick; therefore, there is considerable opportunity for relocating the displaced businesses(with the exception of manufacturing, or “most threatened,” businesses) to vacant or underdeveloped land on PostRoad and elsewhere in the City. To the extent that residences and businesses relocate within the City of Warwick,this would reduce the loss of property tax revenue as well as local jobs, personal taxable income, and local taxablebusiness revenues. Property owners may also make improvements to their new properties, which could also offsetthe property tax lost through land acquisition associated with Alternative B2.Municipal Fiscal Impacts - 2020The total estimated cost to provide municipal services (recycling and sanitation, composting, police, fire andrescue) to the housing units to be acquired under Alternative B2 (residential acquisitions are presented belowunder Social and Housing Impacts – 2020) would be approximately $221,430 annually, while school costs areestimated to be about $934,680 annually. From an overall fiscal impact perspective, it is unlikely that theacquisition of residential units will result in cost savings to City of Warwick as it is likely that most of thehouseholds affected by the residential acquisitions will relocate within Warwick and, therefore, would simplyshift their demand for municipal and school services to another neighborhood within the city, which mayimpact the demand for services in that neighborhood, particularly enrollments in individual schools.Social and Housing Impacts - 2020The following sections summarize the direct and indirect impacts to housing (including housing affordability) dueto residential land acquisitions for construction, noise mitigation, and FAA-recommended RPZ clearing as well asindirect impacts to the community beginning in 2020 for Alternative B2.Direct Impacts to HousingTable 5-55 summarizes the impacts to housing in 2020 due to the residential land acquisitions associated withAlternative B2. All land acquisition is shown for each runway end by acquisition type in Figures 5-19 and 5-20(shown previously).Chapter 5 - Environmental Consequences 5-93 July 2011\\mawatr\ev\09228.00\reports\<strong>FEIS</strong>_Final_July_2011\<strong>PVD</strong>_CH05_Environmental_Cons_JUL_2011.doc
T.F. <strong>Green</strong> <strong>Airport</strong> <strong>Improvement</strong> <strong>Program</strong>Environmental Impact Statement and Final Section 4(f) EvaluationTable 5-55 Alternative B2: Residential Units to be Acquired (2020)Type of Residential UnitConstruction(Mandatory) 1Noise Mitigation(Voluntary) 2 RPZs (Voluntary) Total for Alternative B2Single-family units 51 32 50 133Multi-family units 16 4 84 104Total 67 36 134 237Source: VHB and RKG Associates, Inc.Note: Assumes 100 percent participation in a Future Build VLAP beginning in 2020 for noise mitigation.1 One home would be acquired by 2015 for the safety enhancements.2 Homes exposed to noise levels of DNL 70 dB and above in 2020 (to be acquired between 2020 and 2025).Overall, Alternative B2 would result in acquisition of 237 housing units (133 single-family units and 104multi-family units). Sixty-seven residential units (51 single-family and 16 multi-family) would be acquired forconstruction (mandatory) of the extension of Runway 5-23 and Fully Relocated <strong>Airport</strong> Road. Thirty-six residentialunits (32 single-family and four multi-family units) could be acquired under a Future Build VLAP between 2020and 2025 for noise mitigation. For FAA-recommended RPZ clearing, 134 residential units (50 single-family and84 multi-family) would be eligible for acquisition. No subsidized low- and moderate-income housing units wouldbe acquired under Alternative B2 (refer to Section 5.5.6, Affordable Housing Analysis).Indirect Impacts to Housing AffordabilityUnder Alternative B2, the total reduction in housing units (both affordable and non-affordable units) would be237 units. These housing units equate to 0.33 percent of the estimated 2006 housing stock in Kent County(72,914 units) and 0.63 percent of the estimated housing stock in Warwick (37,401 units). 344 If no replacementhousing were constructed and if all relocated households settled within Kent County, overall vacancy rateswould decrease by 0.31 percentage points in Kent County to 4.64 percent from the 2006 Kent County level of4.95 percent. 345 This reduction in vacancy rates could potentially have an indirect impact on housingaffordability by raising rents and home prices within the County.Significant Impacts: There would be no significant social and socioeconomic impacts under Alternative B2 because:• There would be sufficient replacement housing within Warwick and its surrounding communities.• There would be sufficient commercial space for relocating businesses within Warwick and its surroundingcommunities.• There would be no substantial reduction in the Level of Service of roads serving the airport and itssurrounding communities. Alternative B2 would improve traffic circulation surrounding the <strong>Airport</strong>,specifically with the proposed Fully Relocated <strong>Airport</strong> Road and the <strong>Airport</strong> gateway improvements onPost Road (refer to Section 5.6, Surface Transportation).• There would be an insubstantial loss in community tax base. For Alternative B2, the total potential propertytax loss (for mandatory and voluntary land acquisitions) is under one percent (0.75 percent) of the total taxbase for the City of Warwick.344 Source for estimated housing stock: U.S. Census Bureau, 2006, American Community Survey data.345 The loss of units and corresponding impact on vacancy rates is greater if one also takes into account the 135 units lost under the 2009 Part 150 VLAP fornoise mitigation.Chapter 5 - Environmental Consequences 5-94 July 2011\\mawatr\ev\09228.00\reports\<strong>FEIS</strong>_Final_July_2011\<strong>PVD</strong>_CH05_Environmental_Cons_JUL_2011.doc
T.F. <strong>Green</strong> <strong>Airport</strong> <strong>Improvement</strong> <strong>Program</strong>Environmental Impact Statement and Final Section 4(f) Evaluation5.5.4.3 Alternative B4This section summarizes the results of the social and economic impacts analysis for Alternative B4 in 2015, 2020,and 2025. Social and economic benefits associated with Alternative B4 include additional jobs, wages, and businesssales activity associated with the additional aircraft operations and passengers that could be accommodated onextended Runway 5-23. These aviation-related activities would benefit the City of Warwick, surroundingcommunities, and the State of Rhode Island. Social and economic negative impacts associated with Alternative B4include impacts associated with residential and commercial land acquisition and loss of tax revenue.Aviation Activity Impacts – 2015, 2020, and 2025The following sections summarize the direct and indirect economic impacts related to aviation activities forAlternative B4 in 2015, 2020, and 2025.Direct Aviation ImpactsDirect impacts associated with the extension of Runway 5-23 during 2015 would include the on-<strong>Airport</strong> effects ofadditional aircraft operations and passenger activity. Based on forecast compared to the No-Action Alternative,increases of approximately 8,760 operations, and 765,727 passengers, an additional $16.9 million in businessactivities are expected at the <strong>Airport</strong> in 2015, increasing to more than $17.5 million by 2025. These expenditureswould support 223 jobs, paying over $7.1 million in 2020 and 233 new jobs and $7.4 million in wages by 2025. 346These impacts are even greater when multiplier effects are taken into account and have an impact on statewideemployment, wages, and spending.Indirect Aviation ImpactsIn addition to passenger activity expected under the No-Action Alternative, approximately 765,720 passengersare projected to use T.F. <strong>Green</strong> <strong>Airport</strong> as a result of Alternative B4 These additional passengers would lead tooff-<strong>Airport</strong> expenditures in visitor-related industries in addition to the visitor expenditures expected from theNo-Action Alternative, including hotels, restaurants and bars, entertainment, retail, and local transportation.The majority of impacts would occur by the end of 2015, with visitor expenditures of an additional $12.7 millionin the City of Warwick and more than $79.9 million statewide. This visitor spending when the runway extensioncomes online is expected to generate an additional 194 jobs in the City of Warwick and over 1,107 in the State.The changes between 2015 and 2020 would be small, with a greater increase occurring in 2025. It is anticipated thatvisitors would spend about an additional $12.8 million in the City of Warwick in 2020 and $13.8 million in 2025,while visitor spending throughout Rhode Island would be nearly $80 million in 2020 and $86.7 million in 2025when compared to the No-Action Alternative. Visitor spending is expected to generate an additional 194 jobs inthe City of Warwick and 1,108 in the State by 2020. By 2025, visitor spending is expected to support over anadditional 210 jobs in the City of Warwick and over 1,200 statewide, including economic multiplier effects.The increased air carrier activity would provide opportunities for increased aviation-related business activity(such as repair services, retail services for additional airline and airport employees) and other airportreliantbusinesses (such as manufacturers, universities, research and development organizations, and346 Derived from ratios of aviation business that were used for the <strong>Airport</strong> in the Rhode Island <strong>Airport</strong> Economic Impact Study - Update 2006.Chapter 5 - Environmental Consequences 5-95 July 2011\\mawatr\ev\09228.00\reports\<strong>FEIS</strong>_Final_July_2011\<strong>PVD</strong>_CH05_Environmental_Cons_JUL_2011.doc
T.F. <strong>Green</strong> <strong>Airport</strong> <strong>Improvement</strong> <strong>Program</strong>Environmental Impact Statement and Final Section 4(f) Evaluationservice businesses). 347 Based on the 2015, 2020, and 2025 forecasts, the increased airport activity due to theproposed <strong>Improvement</strong> <strong>Program</strong> is expected to generate an additional 341 jobs in the City of Warwick in 2015, noadditional jobs by 2020 and 391 more jobs by 2025. For the City of Warwick, activity in all sectors would result in adirect gain of $6.2 million in wages and $20.0 million in business revenues in 2015 and $7.0 million in wages, thesame in 2020, and $22.7 million in business revenues by 2025. Additional gains would accrue to the City ofWarwick through multiplier effects, as well as to Rhode Island as a whole. Overall, it is estimated that this growthcould create additional property tax revenue for the City of Warwick due to the commercial space demandsanticipated (approximately 117,000 square feet in 2015 increasing to approximately 134,000 square feet in 2025based on current vacancy rates).Total Aviation ImpactsThe increase in aviation activity associated with Alternative B4 would provide opportunities for aviation-relatedbusiness activity (such as warehouse, repair services, retail services for additional airline and airport employees) andother air-reliant businesses (such as manufacturers, universities, research and development organizations, andservices businesses) as seen along Post Road as a result of previous airport expansions. These impacts wouldmoderate jobs lost due to commercial land acquisitions associated with Alternative B4. Table 5-56 summarizes thetotal economic impacts for Alternative B4.Table 5-56Aviation Activity: Related Total Economic Impacts (Gains) in the City of Warwick and State ofRhode IslandAlternative B4 - Total Economic Impacts (Annual) 1Type of impact 2015 2 2020 3 2025 4City of WarwickTotal Impacts to Jobs 796 797 873Total Impacts to Personal Taxable Income $24,936,000 $24,908,000 $27,021,000Total Impacts to Taxable Business Revenue $64,240,000 $63,328,000 $69,961,000State of Rhode IslandTotal Additional Jobs 1,810 1,813 1,967Total Impacts to Personal Taxable Income $53,089,000 $53,104,000 $57,416,000Total Impacts to Taxable Business Revenue $135,964,000 $135,998,000 $147,538,000Source: ADE, IMPLAN, Rhode Island <strong>Airport</strong> Economic Study (Wilbur Smith Associates, June 2006), RIDLT.1 Includes direct and indirect impacts from on-<strong>Airport</strong> business activities, visitor spending, and development of spin off-<strong>Airport</strong>-related business in the City.2 Represents the total economic gains (jobs, taxable income and taxable business revenue) generated in 2015 as a result of the Build Alternative.3 Represents the total economic gains, including those already created in 2015 as a result of the Build Alternative (i.e., there would be one additional job created in2020 over 2015).4 Represents the total economic gains, including those already created in 2015 as a result of the Build Alternative (i.e., there would be 77 additional jobs created in2025 over 2015 and 76 additional jobs created in 2025 over 2020).347 The <strong>Airport</strong> Development Economics Model (ADE-2) was used to determine direct off-airport increases in business activity due to the implementation ofAlternative B2 or B4. In addition to the 2020 and 2025 Analysis Conditions, the model relies on the local mix of industries, land use and both economic andpopulation growth rates.Chapter 5 - Environmental Consequences 5-96 July 2011\\mawatr\ev\09228.00\reports\<strong>FEIS</strong>_Final_July_2011\<strong>PVD</strong>_CH05_Environmental_Cons_JUL_2011.doc
T.F. <strong>Green</strong> <strong>Airport</strong> <strong>Improvement</strong> <strong>Program</strong>Environmental Impact Statement and Final Section 4(f) EvaluationGiven the additional flight operations under the 2015, 2020, and 2025 scenarios, by 2025 approximately 873 jobswould be created in the City of Warwick and 1,967 jobs throughout Rhode Island, with the bulk being generatedby new on-<strong>Airport</strong> spending. Under Alternative B4, cumulative gains within the City of Warwick between 2015and 2025 would reach $276.2 million in personal taxable income and $707.8 million in taxable business revenues.Business and Employment Impacts – 2015 and 2020This section summarizes the direct impacts to businesses and employment due to commercial land acquisitions forconstruction (mandatory) and indirect impacts to the community associated with Alternative B4. No businesseswould be displaced for the FAA-recommended RPZ clearing or under a Future Build VLAP because business usesare not considered incompatible land uses with predicted noise levels. Table 5-57 summarizes the displacedbusinesses and jobs lost associated with commercial property acquisitions due to mandatory construction.Table 5-57Alternative B4: Economic Impacts (Losses) in 2015 due to Business Displacement for Construction(Mandatory)Total AffectedType Business Businesses 1 Square Feet JobsAgriculture 0 0Health Care 0 0Manufacturing 1 8,021 7Other Services 3 3,476 6Restaurant 3 12,292 34Retail 2 6,056 5Warehouse 3 9,371 7Total 12 39,215 59Most Threatened Businesses 2 Personal Taxable BusinessType Business Businesses 1 Square Feet Jobs Taxable Income RevenuesAgriculture 0 0 0 $0 $0Manufacturing 1 8,021 7 ($302,000) ($1,428,000)Warehouse 2 9,371 7 ($227,000) ($385,000)Total Direct Impacts NA NA 14 ($529,000) ($1,813,000)Total Impacts in Warwick 3 NA NA 23 ($1,027,000) ($3,243,000)Total Impacts in RI 4 NA NA 28 ($1,308,000) ($4,031,000)Sources: City of Warwick Assessors Data Base and site visits to document number of businesses, Dunn and Bradstreet, Urban Land Institute and Energy InformationAdministration to estimate direct employment. RI Department of Labor and Training to calculate wages per job. IMPLAN modeling package calibrated for Warwickand Rhode Island to estimate total impacts. EDR Group.Notes: All displacement due to construction would occur in 2015 due to Runway 16 and the Partially Relocated <strong>Airport</strong> Road. Subsequent acquisitions are of small partsof parcels that do not affect the businesses and jobs that may be located on them. NA No building square footage is associated with property (i.e., the lot of acar rental place), or no businesses or jobs are associated with square footage.1 Businesses displaced due to land acquisition of commercial properties for all program elements.2 Businesses and jobs unlikely to relocate within the City of Warwick due to limited vacant and developable industrial lands.3 Total Impacts include direct and indirect impacts using multiplier effects.4 Total Impacts in Rhode Island include total impacts in the City of Warwick.Based on anticipated acquisitions for Runway 16 and Partially Relocated <strong>Airport</strong> Road, Alternative B4 would resultin an anticipated loss of parcels including 12 businesses and 59 jobs. Unlike Alternative B2, Alternative B4 would notChapter 5 - Environmental Consequences 5-97 July 2011\\mawatr\ev\09228.00\reports\<strong>FEIS</strong>_Final_July_2011\<strong>PVD</strong>_CH05_Environmental_Cons_JUL_2011.doc
T.F. <strong>Green</strong> <strong>Airport</strong> <strong>Improvement</strong> <strong>Program</strong>Environmental Impact Statement and Final Section 4(f) Evaluationrequire acquisition of <strong>Airport</strong> Plaza. Forty-five of the affected jobs are likely to relocate within the City of Warwick.Table 5-57 indicates the number of “most threatened” businesses, although Alternative B4 is expected to generatelimited warehousing and manufacturing jobs five or more years after the parcels are taken. 348 Without immediaterelocation or absorption, total direct losses in employment from these businesses would result in a total loss of23 jobs, $1.0 million in total losses of direct wages and $3.2 million in total losses of direct business revenues inWarwick. For Rhode Island, without immediate relocation or absorption, total direct losses in employment fromthese businesses would result in a total loss of 28 jobs, $1.3 million in wages, and $4.0 million in businessrevenues. Any job losses would be expected to be offset by the gains in employment and economic activityresulting from Alternatives B2 and B4.City of Warwick Property Tax Impacts – 2015 and 2020Table 5-58 presents the total property taxes (residential and commercial) that would be lost to the City ofWarwick due to land acquisitions for construction and under a Future Build VLAP for project-related noisemitigation. Residential acquisitions are presented below under the ‘Social and Housing Impacts’ sections.Table 5-58Alternative B4: Direct Annual Property Tax Impacts (Losses)Safety Enhancement Elements 1 Efficiency Enhancement Elements 1PartiallyTerminalRelocated Area and RealignedTax and Acquisition Type Runway 16 Runway 34 <strong>Airport</strong> Road Runway 5 Runway 23 Access Roads Main Avenue TotalResidential Property Acquisiti on – $0 $0 $1,264 $0 $0 $0 $27,787 $29,051Mandatory Constructi onResidential Property Acquisiti on – $0 $0 $0 $6,291 $0 $0 $0 $6,291Voluntary Noise (2015) 2Residential Property Acquisiti on – $0 $0 $0 $195,905 $0 $0 $0 $195,905Voluntary Noise (2020) 3Residential Property Acquisiti on – $0 $0 $0 $180,609 NA 4 $0 $0 $180,609Voluntary Runway 5 End RPZ 4Commercial Property Acquisiti on – $125,510 $0 $30,155 $0 $0 $0 $0 $155,665Mandatory ConstructionTotal Direct Tax Impacts $125,510 $0 $31,419 $0 $0 $0 $27,787 $184,716Mandatory (Property Taxes)Total Direct Tax Impacts $0 $0 $0 $382,805 $0 $0 $0 $382,805Voluntary (Property Taxes)Source: City of Warwick Assessor’s Office, The Tax Foundation and RI MapStats from FedStats, VHB, RKG Associates, Inc., EDR Group.Note: No property tax losses related to the Integrated Cargo Facility. NA=Not Applicable.1 Annual tax loss first starting in 2015 except for residential property acquisition for noise mitigation for noise impacts in 2020 (see table note 3 below).2 Assumes total annual tax loss first starting in 2015 because for the purposes of the Alternative B4 <strong>FEIS</strong> analysis, residential properties are assumed to beacquired between 2015 and 2020; however, it is RIAC’s intention to begin to acquire residential parcels as soon as 2012, subject to funding availability).3 Assumes annual tax loss starting in 2020 because for the purposes of the Alternative B4 <strong>FEIS</strong> analyses, residential properties are assumed to be acquiredbetween 2020 and 2025; however, it is RIAC’s intention to begin to acquire residential parcels as soon as 2012, subject to funding availability).4 For the purposes of this <strong>FEIS</strong>, it is assumed that there would be 100 percent participation by property owners in a voluntary program. RPZ clearing is a FAArecommendation,and is not a required action. Therefore, RPZ-related property acquisition would be subject to funding availability.348 Unlike the manufacturing/warehousing jobs created due to increased aviation activity, which are motivated to locate within Warwick specifically to be nearthe airport, businesses being displaced by either Alternative B2 or Alternative B4 are not specifically motivated to relocate near the airport and willtherefore be considering locations throughout the state or beyond, based on cost, availability, and industry-specific operational considerations.Chapter 5 - Environmental Consequences 5-98 July 2011\\mawatr\ev\09228.00\reports\<strong>FEIS</strong>_Final_July_2011\<strong>PVD</strong>_CH05_Environmental_Cons_JUL_2011.doc
T.F. <strong>Green</strong> <strong>Airport</strong> <strong>Improvement</strong> <strong>Program</strong>Environmental Impact Statement and Final Section 4(f) EvaluationStarting in 2015, up to approximately $371,616 in annual property tax revenue (residential and commercial;mandatory and voluntary; excluding residential acquisitions associated with the 2020 Future Build VLAP)would be lost to the City of Warwick, representing less than a half of one percent of the City’s projected local taxrevenue base for 2010 ($204,173,334). The majority of residential property taxes lost starting in 2015 would bedue to acquisitions for noise mitigation and Runway 5 End RPZ clearing ($186,900 per year). Direct losses inannual commercial property tax revenue due to the required acquisitions for construction would total$155,665 per year starting in 2015 representing less than a half of one percent of the City’s total 2010 propertytax revenue base. Starting in 2020, an additional $195,905 of residential property tax revenue could be lostannually due to residential acquisitions for noise mitigation under a Future Build VLAP.Under Alternative B4, from 2015 to 2025 cumulative property tax losses (for residential and commercialproperties) associated with safety enhancements would total approximately $1.6 million. Cumulative propertytax losses associated with the efficiency projects would total $1.1 million by 2020 (starting in 2015) all of which isresidential tax losses associated with extending the Runway 5-23 to 8,700 feet. An additional $195,905 in annualresidential property tax losses to the City of Warwick would begin in 2020 due to residential acquisitions fornoise mitigation totaling $979,525 by 2025. Cumulatively, Alternative B4 would reduce the total amount of taxescollected by the City of Warwick by a total of $3.2 million by 2025 (starting in 2015).As discussed in greater detail in Appendix G.4, Conceptual Relocation Plan, according to a review of the currentreal estate market and based on the Current Part 150 VLAP, sufficient mitigation opportunities (available realestate) are available to relocate residents and businesses in or around Warwick under Alternative B4. Forbusinesses, as of 2010, there is some vacancy in existing office and industrial properties within the City ofWarwick; therefore, there is considerable opportunity for relocating the displaced businesses (with theexception of manufacturing, or “most threatened”, businesses) to vacant or underdeveloped land on Post Roadand elsewhere in the City. To the extent that residences and businesses relocate within the City of Warwick, thiswould reduce the loss of property tax revenue as well as local jobs, personal taxable income, and local taxablebusiness revenues. Property owners may also make improvements to their new properties, which could alsooffset the property tax lost through land acquisition associated with Alternative B4.City of Warwick Fiscal Impacts – 2015 and 2020The total estimated cost to provide municipal services (recycling and sanitation, composting, police, fire andrescue) to the housing units to be acquired under Alternative B4 in 2015 (residential acquisitions are presentedbelow under Social and Housing Impacts – 2015) is about $68,204 annually, while school costs are estimated to beabout $287,897 annually. From an overall fiscal impact perspective, it is unlikely that the acquisition ofresidential units will result in cost savings to City of Warwick as it is likely that most of the households affectedby the residential acquisitions will relocate within Warwick and therefore simply shift their demand formunicipal and school services to another neighborhood within the City, which may impact the demand forservices in that neighborhood, particularly enrollments in individual schools. Another offsetting factor for theloss of property tax revenue is the economic benefits to the City of Warwick from the increased economicactivities projected to result from Alternatives B2 and B4.Chapter 5 - Environmental Consequences 5-99 July 2011\\mawatr\ev\09228.00\reports\<strong>FEIS</strong>_Final_July_2011\<strong>PVD</strong>_CH05_Environmental_Cons_JUL_2011.doc
T.F. <strong>Green</strong> <strong>Airport</strong> <strong>Improvement</strong> <strong>Program</strong>Environmental Impact Statement and Final Section 4(f) EvaluationThe total estimated cost to provide municipal services (recycling and sanitation, composting, police, fire andrescue) to the housing units to be acquired beginning in 2020 (residential acquisitions are presented belowunder Social and Housing Impacts – 2020) is approximately $62,598 annually, while school costs are estimated tobe about $264,234 annually. From an overall fiscal impact perspective, it is unlikely that the acquisition ofresidential units would result in cost savings to City of Warwick as it is likely that most of the householdsaffected by the residential acquisitions will relocate within Warwick and, therefore, shift their demand formunicipal and school services to another neighborhood within the City, which may impact the demand forservices in that neighborhood, particularly enrollments in individual schools.Social and Housing Impacts – 2015The following sections summarize the direct and indirect impacts to housing (including housing affordability)due to residential land acquisitions for construction, noise mitigation, and FAA-recommended RPZ clearing aswell as indirect impacts to the community.Direct Impacts on HousingTable 5-59 summarizes the impacts to housing in 2015 due to the residential land acquisitions associated withAlternative B4. All land acquisitions are shown for each runway end by acquisition type in Figures 5-19 and5-20 (shown previously).Table 5-59 Alternative B4: Residential Units to be Acquired (2015)Construction Noise Mitigation RPZsType of Residential Unit (Mandatory) (Voluntary) 1 (Voluntary) Total for Alternative B4Single-family units 11 2 58 71Multi-family units 0 0 2 2Total 11 2 60 73Source: VHB and RKG Associates, Inc.Note: Assumes 100 percent participation in a Future Build VLAP for noise mitigation. 1 For the purposes of this EIS analysis, it is assumed that two parcels totaling 0.5 acres and containing two housing units would be acquired for noise mitigation between 2015 and 2020 for noise impacts (homes exposed to noise levels of DNL 70 dB and above beginning in 2015). However, it is RIAC’s intention to begin toacquire residential parcels as soon as 2012, subject to availability of funding.Overall, in 2015, Alternative B4 would result in acquisition of 73 housing units (71 single-family units and twomulti-family units). Eleven single-family residential units would be acquired for construction of the extension ofRunway 5-23 and Realigned Main Avenue. Two residential units (all single-family units) would be exposed tonoise levels of DNL 70 dB and above in 2015 (due to the expedited construction schedule for Alternative B4)and, therefore, would be eligible for participation in a Future Build VLAP for noise mitigation. ForFAA-recommended RPZ clearing, 60 residential units (58 single-family and two multi-family) would be eligiblefor participation in a land acquisition program under Alternative B4. No subsidized Low- and Moderate-IncomeHousing units would be acquired under Alternative B4 (refer to Section 5.5.6, Affordable Housing Analysis).Indirect Impacts on Housing AffordabilityUnder Alternative B4 in 2015, the total reduction in housing units (mandatory and voluntary; affordable andnon-affordable units) would be 73 units. This housing stock equates to approximately 0.10 percent andChapter 5 - Environmental Consequences 5-100 July 2011\\mawatr\ev\09228.00\reports\<strong>FEIS</strong>_Final_July_2011\<strong>PVD</strong>_CH05_Environmental_Cons_JUL_2011.doc
T.F. <strong>Green</strong> <strong>Airport</strong> <strong>Improvement</strong> <strong>Program</strong>Environmental Impact Statement and Final Section 4(f) Evaluation0.20 percent of the estimated 2006 housing stocks in Kent County (72,194 units) and the City of Warwick(37,401 units), respectively. If no replacement housing were constructed and if all relocated households settledwithin Kent County, overall vacancy rates would decrease by 0.096 percentage points in Kent County to4.86 percent from the 2006 Kent County level of 4.95 percent. 349 This reduction in vacancy rates may have anindirect adverse impact on housing affordability by raising rents and home prices within the County.Social and Housing Impacts – 2020The following sections summarize the direct impacts to housing due to residential land acquisitions for noise mitigationand FAA-recommended RPZ clearing as well as indirect impacts (housing affordability) beginning in 2020.Direct Impacts on HousingAs previously presented, under Alternative B4, all mandatory and some residential land acquisition wouldoccur by or in 2015 in order to extend Runway 5-23, realign Main Avenue, enhance the Runway 16-34 safetyareas, and partially relocate <strong>Airport</strong> Road (Table 5-59). In 2020, an additional 69 residential units(67 single-family and two multi-family units) would be exposed to noise levels of DNL 70 dB and above and,therefore, would be eligible for participation in a Future Build VLAP for noise mitigation. All of these units arelocated at the Runway 5 End (Figure 5-19). No subsidized Low- and Moderate-Income Housing units would beacquired (refer to Section 5.5.6, Affordable Housing Analysis).Indirect Impacts on Housing AffordabilityThe total housing stock to be acquired under Alternative B4 (140 housing units) equates to approximately0.19 percent of the estimated 2006 housing stock in Kent County (72,194 units) and 0.37 percent of the estimatedhousing stock in Warwick (37,401 units). If no replacement housing were constructed and if all relocatedhouseholds settled within Kent County, overall vacancy rates would decrease by 0.18 percentage points in KentCounty, holding all other factors equal, to 4.77 percent from the 2004 Kent County baseline level of4.95 percent. 350 This reduction in vacancy rates may have an indirect adverse impact on housing affordability byraising rents and home prices within the County.Significant Impacts: There are no significant impacts under Alternative B4 because:• There would be sufficient replacement housing within Warwick and its surrounding communities.• There would be sufficient commercial space for relocating businesses within Warwick and its surroundingcommunities.• There would be no substantial reduction in the Level of Service of roads serving the airport and itssurrounding communities. Alternative B4 would improve traffic circulation surrounding the <strong>Airport</strong>,specifically with the proposed improvements to <strong>Airport</strong> Road and Main Avenue, and the <strong>Airport</strong> gatewayimprovements on Post Road (refer to Section 5.6, Surface Transportation).349 Vacancy rate numbers are rounded to the nearest 1/100th of 1 percent. The loss of units and corresponding impact on vacancy rates is greater if one alsotakes into account the Current Part 150 VLAP.350 The loss of units and corresponding impact on vacancy rates is greater if one also takes into account the Current Part 150 VLAP.Chapter 5 - Environmental Consequences 5-101 July 2011\\mawatr\ev\09228.00\reports\<strong>FEIS</strong>_Final_July_2011\<strong>PVD</strong>_CH05_Environmental_Cons_JUL_2011.doc
T.F. <strong>Green</strong> <strong>Airport</strong> <strong>Improvement</strong> <strong>Program</strong>Environmental Impact Statement and Final Section 4(f) Evaluation• There would be an insubstantial loss in community tax base. For Alternative B4, the total potential propertytax loss (for mandatory and voluntary land acquisitions) is under one percent (0.35 percent) of the total taxbase for the City of Warwick.5.5.4.4 Short-Term Impacts from Construction ActivitiesConstructing Alternative B2 would directly generate a total of 803 jobs, $37.7 million in personal taxable income,and nearly $92.1 million in business spending in Warwick during the 2012 to 2020 construction period. Whenincluding indirect and induced impacts, the total benefit would be 1,173 jobs, $50.1 million in income, and$134.3 million in output in Warwick, and additional benefits statewide (1,227 jobs, $53.6 million in wages, and$161.5 million in business revenue). Constructing Alternative B4 would directly generate a total of 872 jobs,$40.9 million in personal income and $90.6 million in business spending in Warwick during the 2012 to 2020construction period. When including indirect and induced impacts, the total benefit would be 1,335 jobs, $58.3million in income and $157.8 million in output in Warwick, and additional benefits statewide.5.5.4.5 Social and Socioeconomic Cumulative ImpactsThis section summarizes the cumulative impacts to both the social and economic environment within theStudy Area. Past major community and economic changes, foreseeable future impacts on communities (knownplanned or permitted development (Table 5-5) and projected growth according to local, regional, and state plansand policies) and on Warwick’s economy (employment and taxes) as well as the potential community andeconomic impacts of Alternatives B2 and B4 are considered to identify neighborhoods that would be more orless affected. Appendix G.1, Social and Socioeconomic Impacts Methodology, provides a description of themethodology for this cumulative analysis.Economic Cumulative ImpactsThis section describes the historical economic impact trends, the foreseeable future economic impacts and theeconomic benefits and impacts associated with Alternatives B2 and B4 of the T.F. <strong>Green</strong> <strong>Airport</strong> <strong>Improvement</strong><strong>Program</strong>. Specifically, economic impacts assessed in this analysis include changes, over time, in employmentand tax revenue to the City of Warwick.Historical Economic TrendsTable 5-60 presents the average annual employment in the City of Warwick over almost three decades.Historically, over the past 30 years, the City of Warwick experienced job losses in traditional soft goodsmanufacturing industries, but experienced rapid growth of lower-wage services and retail businesses. From1980 through 2006, the City of Warwick’s private sector job base grew from 30,322 to 53,070, implying anaverage annual absorption of 875 jobs per year in the City’s economy. After 2006, average annual employmentbegan to decline through 2009 implying an average annual loss of 1,790 jobs per year. This overall trend isconsistent with the northeast United States. 351 In constant dollars, the property tax levy has increased by1.6 percent annually from 2000 to 2010. 352351 Data provided by the State of Rhode Island Municipal Affairs, Department of Administration.352 Warwick Tax Collector Audit (FY 2000 and 2010), adjusted for inflation using the Consumer Price Index (CPI-U for Northeast-urban), Bureau of LaborStatistics, U.S. Department of Labor.Chapter 5 - Environmental Consequences 5-102 July 2011\\mawatr\ev\09228.00\reports\<strong>FEIS</strong>_Final_July_2011\<strong>PVD</strong>_CH05_Environmental_Cons_JUL_2011.doc
T.F. <strong>Green</strong> <strong>Airport</strong> <strong>Improvement</strong> <strong>Program</strong>Environmental Impact Statement and Final Section 4(f) EvaluationTable 5-60 Average Annual Employment in the City of Warwick (1980 - 2010)Average Annual Average Annual Average AnnualYear Employment Year Employment Year Employment1980 30,322 1991 36,899 2002 46,4781981 31,412 1992 38,744 2003 47,1081982 30,501 1993 39,195 2004 47,6231983 30,971 1994 40,124 2005 48,4821984 32,841 1995 41,604 2006 53,0701985 34,346 1996 42,766 2007 52,5921986 36,188 1997 43,003 2008 50,5211987 38,533 1998 43,299 2009 47,8101988 39,540 1999 45,187 2010 45,906 11989 40,357 2000 46,4081990 37,002 2001 46,567Sources: Rhode Island Department of Labor and Training and Rhode Island Economic Development Corporation.1 Second quarter of 2010 only. Full year data not available at the time of the filing of this <strong>FEIS</strong>.Future Economic TrendsThe City of Warwick is Rhode Island’s second-largest city and the hospitality and retailing center of the state. Onegoal of the City’s economic development strategy is to derive more local benefits out of the traffic and businessgenerated by the <strong>Airport</strong>. 353 Top priorities for achieving this include: developing the inventory of good commercialsites; establishing a community development corporation to administer innovative business loans; developingcommuter and freight rail services; and promoting the amenity of the City’s Narragansett Bay location.Various development projects are new and planned (including approved or permitted at the time of the filing ofthis <strong>FEIS</strong>; refer to Table 5-5) in the City of Warwick in the same time frame that the <strong>Improvement</strong> <strong>Program</strong>elements would come on line. These projects total nearly 2.6 million square feet in retail, office, and hotel space,which is estimated to accommodate approximately 3,900 jobs, based on standard averages of jobs per square foot.Full absorption of these new facilities into the Warwick economy may take up to 10 years (or longer) based on recentpast trends. Table 5-61 presents the estimated job capacity for these new and planned projects by development type.353 City of Warwick Planning Department, City of Warwick Comprehensive Plan, 2002.Chapter 5 - Environmental Consequences 5-103 July 2011\\mawatr\ev\09228.00\reports\<strong>FEIS</strong>_Final_July_2011\<strong>PVD</strong>_CH05_Environmental_Cons_JUL_2011.doc
T.F. <strong>Green</strong> <strong>Airport</strong> <strong>Improvement</strong> <strong>Program</strong>Environmental Impact Statement and Final Section 4(f) EvaluationTable 5-61Approved and Permitted New Development and Estimated Job CapacityEstimated Ratio of Square Feet Estimated Job CapacityPlanned Development 1,2 Square Feet per Job at Full OccupancyOffice 1,077,800 400 2,695Hotel 870,000 1,700 512Retail 613,410 850 722Total 2,561,210 -- 3,928Source: City of Warwick Planning Department, Square foot ratios are from the Urban Land Institute, the Energy Information Administration, Boston RedevelopmentAuthority and the Southern California Association of Governments. (2007)1 Refer to Table 5-5 for a list of new and planned projects, according to the City of Warwick Planning Department (correspondence dated February 2011).2 Includes the planned Warwick Station Redevelopment District.Based on historical trends expressed in constant 2010 dollars, the property tax levy of the City of Warwick isprojected to be $239.9 million in 2020 and $260.1 million in 2025. The nearly 1.5 million square feet of newlyapproved and permitted commercial development (excluding projects that have already been constructed, asidentified in Table 5-5, and are captured in the 2010 property tax levy) in the City of Warwick (including theWSRD) is expected to generate more than $7 million annually in property taxes after full development based oncurrent tax rates, property values, and construction costs.Economic Impacts of the Alternatives B2 and B4Alternative B2 is likely to displace 39 industrial jobs, while Alternative B4 is likely to displace 14 jobs inmanufacturing and warehousing. From 1980 through 2005, the City lost an average of 229 manufacturing jobs peryear. However, most recently from 2002, the rate of loss has been 80 manufacturing jobs per year. Even thoughAlternatives B2 and B4 are expected to generate some manufacturing-related jobs, these new jobs would not bereplace the displaced jobs due to differences in type of manufacturing, technology, time lag in construction, and theprojected growth in aviation activity due to the <strong>Improvement</strong> <strong>Program</strong>. State-wide, by 2025, Alternatives B2 and B4are expected to generate approximately 1,967 new employment opportunities of various types.As presented in Table 5-62 the current amount of retail, office, and hotel space approved and or permitted fordevelopment in the WSRD and in other parts of the City of Warwick greatly exceeds the amount of space expectedto be displaced by Alternatives B2 and B4. However, these planned and proposed projects do not address thespace needed for displaced industrial and warehousing businesses and jobs. Depending on the type and amountof space each individual firm requires, these users are more likely to relocate outside of the City of Warwick.Table 5-62Maximum Potential Cumulative Job Impacts due to Construction-Related Acquisitions(Mandatory) by Alternative B2 and B4Direct Job Displacement (losses)Potentially SuitableManufacturing and Warehousing Jobs for Approved and Permitted Development 1Alternative B2 39 286Alternative B4 14 511 Represents the total number of jobs shown below minus the most threatened jobs.Chapter 5 - Environmental Consequences 5-104 July 2011\\mawatr\ev\09228.00\reports\<strong>FEIS</strong>_Final_July_2011\<strong>PVD</strong>_CH05_Environmental_Cons_JUL_2011.doc
T.F. <strong>Green</strong> <strong>Airport</strong> <strong>Improvement</strong> <strong>Program</strong>Environmental Impact Statement and Final Section 4(f) EvaluationIf all the jobs displaced by Alternative B2 and Alternative B4 were relocated in these new facilities, they wouldaccount for 13 percent and three percent, respectively, of the available capacity. The approved and permittedspace would not be suitable for manufacturers and other industrial users, such as construction workers.However, there would be temporary construction jobs generated by the construction of the <strong>Airport</strong><strong>Improvement</strong> <strong>Program</strong> projects beginning in 2012 through 2020 (refer to Section 5.5.4.4, Short-Term ConstructionImpacts). In addition, the new development would provide capacity for new off-<strong>Airport</strong> jobs generated by theincrease of aviation activity due to Alternatives B2 and B4, as well as jobs that would be generated fromemployment growth forecast under the No-Action Alternative.The approximately $7 million annually in property taxes after full development of the new and plannedcommercial developments (based on current tax rates, property values, and construction costs) would offset theannual commercial property taxes lost to the City of Warwick as a result of Alternative B2 ($679,108 forcommercial property acquisitions) and Alternative B4 ($155,665 for commercial property acquisitions).Social and Housing Cumulative ImpactsThis section describes the social and housing cumulative impacts based on historical social impact trends,foreseeable future development as well as the potential social and housing impacts associated with AlternativesB2 and B4 for the neighborhoods surrounding the <strong>Airport</strong>, including:• Spring <strong>Green</strong>, northeast;• Hoxsie, including Lakeview Terrace (which abuts the eastern edge of the <strong>Airport</strong>) and Strawberry Field(which abuts the southeast edge of the <strong>Airport</strong>), east of the <strong>Airport</strong>;• Wildes Corner and Kettle Corner, southeast and far southeast, respectively;• <strong>Green</strong>wood, including <strong>Green</strong>wood Park, south;• Apponaug, southwest;• Hillsgrove, including Oak Grove (which abuts the southwestern edge of the <strong>Airport</strong>), west;• Lincoln Park, northwest; and• Norwood, north.Historical Social and Housing TrendsHistorically, the majority of <strong>Airport</strong>-related development projects have impacted the Hillsgrove, Hoxie,Strawberry Field, and <strong>Green</strong>wood and <strong>Green</strong>wood Park neighborhoods west, east, and south of the <strong>Airport</strong>,respectively – most of which were predominantly residential. Over time, land surrounding the <strong>Airport</strong> has beendeveloped as commercial and retail uses, or has been acquired and converted into <strong>Airport</strong> property.Future Social and Housing TrendsIn the future, it is anticipated that commercial and industrial development would likely continue in the vicinityof the <strong>Airport</strong>, specifically in the Jefferson Boulevard corridor and the <strong>Airport</strong> Park area as well as alongChapter 5 - Environmental Consequences 5-105 July 2011\\mawatr\ev\09228.00\reports\<strong>FEIS</strong>_Final_July_2011\<strong>PVD</strong>_CH05_Environmental_Cons_JUL_2011.doc
T.F. <strong>Green</strong> <strong>Airport</strong> <strong>Improvement</strong> <strong>Program</strong>Environmental Impact Statement and Final Section 4(f) EvaluationPost Road and the Warwick Station Redevelopment District west of the <strong>Airport</strong>. 354 As a result of the CurrentPart 150 VLAP, residential land surrounding the <strong>Airport</strong> would become <strong>Airport</strong> property due to acquisition fornoise mitigation under the No-Action Alternative. In general, with or without the <strong>Improvement</strong> <strong>Program</strong>,development trends which may affect communities in the western section of the Hillsgrove neighborhood withmore new commercial and mixed-use developments, according to the known planned and permitted projects.These developments are consistent with existing uses.Social and Housing Impacts of Alternatives B2 and B4Alternatives B2 and B4 would contribute to a cumulative loss of housing units and residential neighborhoodsdue to the conversion of residential land to <strong>Airport</strong> land through acquisition (237 units total for Alternative B2and 140 units total for Alternative B4). Alternatives B2 and B4 would also lead to changes in commercial andretail land use around the existing intersection of Post Road and <strong>Airport</strong> Road and along existing <strong>Airport</strong> Road.Alternatives B2 and B4 would contribute to the cumulative social (housing) impacts on the <strong>Green</strong>woodneighborhood south of the <strong>Airport</strong> due to additional land acquisitions (for both a Future Build VLAP and RPZclearing at the Runway 5 End). Alternative B4 would result in greater impacts on the <strong>Green</strong>wood neighborhoodsouth of the <strong>Airport</strong> compared to Alternative B2 due to mandatory acquisitions for Realigned Main Avenue.Under Alternative B2, the full relocation of <strong>Airport</strong> Road and the newly created Runway 23 End RPZ wouldhave a disruptive effect on the Spring <strong>Green</strong> neighborhood and existing roadway circulation (more so thanAlternative B4 which does not include changes to the Runway 23 End RPZ).5.5.4.6 Comparison of Social and Socioeconomic Impacts from the No-Action Alternative andAlternatives B2 and B4This section compares the direct and indirect impacts to social and socioeconomic conditions from theNo-Action Alternative and Alternatives B2 and B4.Significant ImpactsAlternatives B2 and B4 would not result in significant impacts related to social and socioeconomic conditions, asdescribed under Section 5.5.2.1, Finding: No Significant Social and Socioeconomic Impacts.Aviation Activity ImpactsUnder either Alternative B2 or B4, the <strong>Airport</strong> would continue to serve as a substantial additional economicdriver for the State of Rhode Island and the region by providing additional economic benefits in the form ofnew jobs, increased on- and off-<strong>Airport</strong> spending and business revenues, and increased state tax revenues. Referto Tables 5-63 and 5-64 for the direct and indirect economic gains in the City of Warwick and total economicgains in Rhode Island, respectively. Over the long term, Alternatives B2 and B4 have similar annual economiceffects, but Alternative B4 initiates those effects 5 years earlier, and does so in each of the five years beforeAlternative B2 produces any effects.354 City of Warwick Comprehensive Plan, City of Warwick Planning Department, 2002.Chapter 5 - Environmental Consequences 5-106 July 2011\\mawatr\ev\09228.00\reports\<strong>FEIS</strong>_Final_July_2011\<strong>PVD</strong>_CH05_Environmental_Cons_JUL_2011.doc
T.F. <strong>Green</strong> <strong>Airport</strong> <strong>Improvement</strong> <strong>Program</strong>Environmental Impact Statement and Final Section 4(f) EvaluationTable 5-63 Alternatives B2 and B4: Direct and Indirect Economic Impacts (Gains) in the City of Warwick 1Alternative B2 - Total Impact (Annual)Alternative B4 - Total Impact (Annual)Type of impact 2015 2020 2025 2015 2020 2025Direct Additional Jobs 0 553 607 552 553 607Indirect Additional Jobs 0 244 266 244 244 266Total Impacts to Jobs 0 797 873 796 797 873Direct Impacts to Personal Taxable Income 0 $16,556,000 $17,927,000 $16,543,000 $16,556,000 $17,927,000Indirect Impacts to Personal Taxable Income 0 $8,352,000 $9,094,000 $8,393,000 $8,352,000 $9,094,000Total Impacts to Personal Taxable Income 0 $24,908,000 $27,021,000 $24,936,000 $24,908,000 $27,021,000Direct Impacts to Taxable Business Revenue 0 $46,458,000 $51,413,000 $47,303,000 $46,458,000 $51,413,000Indirect Impacts to Taxable Business Revenue 0 $16,870,000 $18,548,000 $16,937,000 $16,870,000 $18,548,000Total Impacts to Business Revenue 0 $63,328,000 $69,961,000 $64,240,000 $63,328,000 $69,961,000Source: ADE, IMPLAN, Rhode Island <strong>Airport</strong> Economic Study (Wilbur Smith Associates, June 2006), RIDLT.Note: Gains are not cumulative; represents the total economic gains, including those already created in the previous analysis years as a result of Alternatives B2 and B4.1 Includes direct and indirect impacts from on-<strong>Airport</strong> business activities, visitor spending and development of spin off-<strong>Airport</strong>-related business in the City.Table 5-64 Alternatives B2 and B4: Total Economic Impacts (Gains) in Rhode Island 1Alternative B2 - Total Impact (Annual)Alternative B4 - Total Impact (Annual)Type of impact 2015 2020 2025 2015 2020 2025Total Additional Jobs 0 1,813 1,967 1,810 1,813 1,967Total Impacts to Personal Taxable Income 0 $53,104,000 $57,416,000 $53,089,000 $53,104,000 $57,416,000Total Impacts to Taxable Business Revenue 0 $135,998,000 $147,538,000 $135,964,000 $135,998,000 $147,538,000Source: Rhode Island <strong>Airport</strong> Economic Study (Wilbur Smith Associates, June 2006), RIDLT. ADE, IMPLAN.Note: Gains are not cumulative; represents the total economic gains, including those already created in the previous analysis years as a result of Alternatives B2 and B4.1 Includes direct and indirect impacts from on-<strong>Airport</strong> business activities, visitor spending and development of spin off-<strong>Airport</strong>-related business in the State.Since Alternative B4 includes a Runway 5-23 extension by 2015, this alternative would result in 80 percentgreater economic gains between 2015 and the end of 2020 than Alternative B2 because of the expeditedconstruction schedule (economic gains to begin in 2015). Potential economic gains for Alternative B4 between2015 and the end of 2020 would total $385 million in business revenues in the City of Warwick and $816 millionfor the State of Rhode Island, and $13 million in state tax revenue (sales and income taxes). This is beforeAlternative B2 would begin to generate economic gains at the end of 2020 due to the runway extension. By theend of 2020, Alternative B2, potential economic gains would total approximately $63 million in businessrevenues in the City of Warwick and approximately $136 million for the State of Rhode Island, andapproximately $2 million in state tax revenue (sales and income taxes).Economic ImpactsCommercial land acquisitions would result in displacement of businesses resulting in changes to employmentin the City of Warwick and in the State of Rhode Island. Alternative B4 would displace fewer firms and jobs(12 firms consisting of 59 jobs) compared to Alternative B2 (38 firms consisting of 309 jobs). Table 5-65 comparesthe direct and indirect economic impacts (job gains or losses) for Alternatives B2 and B4.Chapter 5 - Environmental Consequences 5-107 July 2011\\mawatr\ev\09228.00\reports\<strong>FEIS</strong>_Final_July_2011\<strong>PVD</strong>_CH05_Environmental_Cons_JUL_2011.doc
T.F. <strong>Green</strong> <strong>Airport</strong> <strong>Improvement</strong> <strong>Program</strong>Environmental Impact Statement and Final Section 4(f) EvaluationTable 5-65Summary of Direct and Indirect Impacts to Employment in the City of WarwickAlternative B2Alternative B42015 2020 2025 2015 2020 2025Direct Impacts to the City of Warwick 1Jobs Created due to Increased <strong>Airport</strong> Activity 0 553 607 552 553 607Jobs Lost due to Land Acquisitions 2 0 (84) (84) (0) (14) (14)Net Change 0 469 523 552 539 593Total Impacts to the City of Warwick 3Jobs Created due to Increased <strong>Airport</strong> Activity 0 797 873 796 797 873Jobs Lost due to Land Acquisitions 2 0 (74) (74) (14) (14) (14)Net Change 0 723 799 782 774 850Sources: IMPLAN, RIDLT, ADE, the RIAC Economic Study, VHB, Inc., EDR Group.1 Direct Impacts include businesses displaced due to land acquisition of commercial properties for all program elements.2 Total “most threatened” jobs lost due to the displacement of businesses due to commercial land acquisitions for the Build Alternatives. The “most threatened” jobs are industrial and warehousing jobs because these businesses unlikely to relocate within the City of Warwick due to limited vacant and developable industrial lands.3 Total Impacts include direct and indirect impacts using multiplier effect.Alternative B2 would not result in job growth in 2015. Alternative B4 would introduce 782 total jobs to Warwickin 2015. In 2020, the No-Action Alternative would result in net job growth of 29 total jobs in Warwick(Table 5-51) where as Alternatives B2 and B4 would result in a much more substantial net job growth inWarwick (723 and 774 total jobs, respectively, as presented in Table 5-65). In 2025, the No-Action Alternativewould result in 107 net new total jobs in Warwick. Alternatives B2 and B4 would result in almost or over 800 netnew total jobs in Warwick (799 total jobs and 850 total jobs, respectively, as presented in Table 5-65).Impacts to TaxesCumulatively, Alternative B2 would result in an increase in State of Rhode Island non-property taxes (includingsales and income taxes) and a decrease in the City of Warwick property taxes for an overall increase in taxrevenue of approximately $986,000 in 2020. Alternative B4 would result in a greater overall increase in taxrevenue of approximately $1.6 million in 2020 due to non-property tax revenue gains and property tax losses.Increases in state sales and income tax revenue are related to on-<strong>Airport</strong> and off-<strong>Airport</strong> spending by visitorsand <strong>Airport</strong>-related workers as well as impacts of anticipated local off-<strong>Airport</strong> job attraction generated byairline and other <strong>Airport</strong>-related business activities. Cumulative gains in sales and income taxes between 2020and 2025 would reach approximately $13.3 million under Alternative B2. Cumulative gains in sales and incometaxes between 2015 and 2025 would reach more than $22.7 million under Alternative B4. Cumulative decreasesin City of Warwick property tax revenue would total $5.9 million by 2025 for Alternative B2 and $3.2 million by2025 for Alternative B4.Municipal Fiscal ImpactsMunicipal costs for general and administrative services are not anticipated to be impacted due to the relativelysmall potential change in population that may occur as a result of Alternative B2 or B4 (less than one percentassuming all residents of acquired units elect to relocate in the City of Warwick).Chapter 5 - Environmental Consequences 5-108 July 2011\\mawatr\ev\09228.00\reports\<strong>FEIS</strong>_Final_July_2011\<strong>PVD</strong>_CH05_Environmental_Cons_JUL_2011.doc
T.F. <strong>Green</strong> <strong>Airport</strong> <strong>Improvement</strong> <strong>Program</strong>Environmental Impact Statement and Final Section 4(f) EvaluationDirect Social and Housing ImpactsAlternative B2 would require acquiring more residential units (67 units) than Alternative B4 (11 units) forconstruction, both representing less than one percent of the City of Warwick’s housing stock. Alternative B4would result in higher number of residential acquisitions (69 units total by 2020) for noise mitigation comparedto Alternative B2 (36 units total by 2020). Alternative B2 would result in the highest number of acquisitions forthe RPZs (134 units) compared to Alternative B4 (60 units).5.5.4.7 Social and Socioeconomic Impact Avoidance and MinimizationAlternative B2 was developed in part to avoid land acquisition near Main Avenue (which would result in therelocation of residences and businesses and, therefore, property tax losses) and to minimize land acquisition tothe residential communities both south of Main Avenue and north of the <strong>Airport</strong>.Due to the significant impacts associated with the other alternatives, Alternative B4 was developed to minimizeimpacts to residential communities and businesses and Buckeye Brook south and north of the <strong>Airport</strong>. It wasdeveloped to minimize the amount of construction-related residential and commercial land acquisition bylimiting construction as much as possible to land located south of the Runway 5 End already owned by RIAC.Under Alternative B4, designing the Runway 5 End in order to allow for effective and efficient realignment ofMain Avenue would avoid the need to tunnel Main Avenue.5.5.5 Environmental Justice and Children’s Health and Safety Risks Impact AssessmentThis section presents the results of the environmental justice and children’s health and safety risk impact assessmentsfor the No-Action Alternative and Alternatives B2 and B4 in 2015, 2020, and 2025. As documented in Section 5.7, AirQuality, and Section 5.11, Water Quality, Alternatives B2 and B4 would not result in significant impacts to air quality,drinking water, recreational waters, or other products or substances that a child might come into contact with oringest. The T.F. <strong>Green</strong> <strong>Airport</strong> <strong>Improvement</strong> <strong>Program</strong> therefore would not result in any health or safety impacts tochildren, including any that are disproportionate to such impacts on the general population. This issue is not furtheranalyzed in this <strong>FEIS</strong>. Impacts to environmental justice populations from land acquisitions and increases to noiselevels are assessed in the following sections. The mandatory or voluntary land acquisition may cause significantcommunity disruption and, therefore, are considered in this evaluation. This analysis addresses minority andHispanic populations separately; the Hispanic population was not added to the total minority population to avoidthe possibility of double counting.5.5.5.1 No-Action AlternativeThere are three minority census blocks and two Hispanic census blocks that fall within the land acquired underthe Completed Part 150 VLAP. There are no low-income census block groups within the Completed Part 150VLAP Areas. Table 4-18 in Chapter 4, Affected Environment, shows the environmental justice populations withinthe Completed Part 150 VLAP.This <strong>FEIS</strong> assumes that RIAC would continue the Part 150 <strong>Program</strong> as part of the analysis to acquire those homesimpacted by noise (exposed to DNL 70 dB and above due to <strong>Airport</strong> operations) unrelated to the proposed<strong>Improvement</strong> <strong>Program</strong>. The Current Part 150 VLAP is based on the FAA-approved NEM (dated July 27, 2010).Table 5-66 shows the environmental justice populations within the acquisition areas for the Current Part 150 VLAP.Chapter 5 - Environmental Consequences 5-109 July 2011\\mawatr\ev\09228.00\reports\<strong>FEIS</strong>_Final_July_2011\<strong>PVD</strong>_CH05_Environmental_Cons_JUL_2011.doc
T.F. <strong>Green</strong> <strong>Airport</strong> <strong>Improvement</strong> <strong>Program</strong>Environmental Impact Statement and Final Section 4(f) EvaluationTable 5-662020 No-Action Alternative Current Part 150 VLAP Impacts Affecting EnvironmentalJustice PopulationsEnvironmental JusticePercent Affected ByPercent Impacts Borne byEnvironmental Justice StatewidePopulation Runway 16 Runway 34 Runway 5 Runway 23 Populations AverageMinority 0% 0% 4.3% 7.2% 6.0% 15.0%Hispanic 0% 0% 1.0% 2.5% 1.8% 8.7%Low-Income 0% 0% 3.2% 0% 3.2% 11.9%Source: 2000 U.S. Census. (Full census blocks acquired by the Rhode Island <strong>Airport</strong> Corporation since 2000 were changed to zero population.)Notes: Percentages in tables represent the environmental justice population affected divided by the total population affected to determine if a disproportionate impactwould be felt by the environmental justice population. Percentages from left to right are not additive. More detailed population data is listed inAppendix G.5, Environmental Justice Findings.1 Population data are the sum of all 2000 U.S. Census blocks (minority; Hispanic) or census block groups (low-income) within areas of significant impact.Of the total population that would be affected by the Current Part 150 VLAP, 6.0 percent is identified asminority. This percentage does not exceed the statewide average of 15.0 percent for a minority population. Ofthe total population that would be affected by the Current Part 150 VLAP, 1.8 percent is identified as Hispanic.This percentage does not exceed the statewide average of 8.7 percent for a Hispanic population. The low-incomepopulation represents 3.2 percent of the total population affected. This percentage does not exceed the statewideaverage of 11.9 percent for low-income impacts. The individual categories of minority populations such asAfrican American are listed in Chapter 4, Affected Environment with their respective state averages. In a reviewof the impacts by African-American, American Indian, Asian, Native Hawaiian, some other race, and mixedrace populations separately, FAA found that no individual group would be disproportionately affected by theNo-Action Alternative. A disproportionate impact is defined as an impact on an environmental justice communitythat is greater in percentage terms than the group’s percentage of the overall state population.There is an Asian population impacted by the No-Action Alternative that constitutes a minority population, asdefined by DOT Order 5610.2, but not one as defined by CEQ. The impacts borne by this Asian population would notbe appreciably more severe than the non-minority population so there would not be a disproportionately high andadverse effect as that term is defined in the DOT Order 5610.2. Therefore, the Current Part 150 VLAP would notdisproportionately affect environmental justice communities.5.5.5.2 Alternative B2Significant noise and compatible land use impacts would occur under Alternative B2, as discussed in Section 5.3,Noise. Additionally, mandatory land acquisition for construction would be required on the Runway 16 End, along thePartially Relocated <strong>Airport</strong> Road, for the Integrated Cargo Facility, on the Runway 23 End, and along the FullyRelocated <strong>Airport</strong> Road, as discussed in Section 5.4, Compatible Land Use. An increase of at least DNL 1.5 dB at orabove DNL 65 dB would occur in various locations on the Runway 16, Runway 23, and Runway 5 Ends under the2020 and 2025 conditions. Residential properties that would be affected by noise levels at or above DNL 70 dB in 2020and some neighboring properties (for neighborhood cohesion) would be eligible for acquisition under a Future BuildVLAP. Alternative B2 also includes land acquisition areas within the Runway 5 and 23 End RPZs. Table 5-67summarizes the percentage of the minority, Hispanic, and low-income populations affected by these impactscompared to the total impacted population. Figures 5-27 through 5-30 show Alternative B2 impacts andenvironmental justice communities north and south of the <strong>Airport</strong>, respectively.Chapter 5 - Environmental Consequences 5-110 July 2011\\mawatr\ev\09228.00\reports\<strong>FEIS</strong>_Final_July_2011\<strong>PVD</strong>_CH05_Environmental_Cons_JUL_2011.doc
T.F. <strong>Green</strong> <strong>Airport</strong> <strong>Improvement</strong> <strong>Program</strong>Environmental Impact Statement and Final Section 4(f) EvaluationTable 5-67 Alternative B2: Land Acquisition and Noise Impacts Affecting Environmental Justice Populations 1Environmental JusticePopulationMandatory Land Acquisition(2020)Safety Enhancement ElementsRunway 16 Runway 34PartiallyRelocated<strong>Airport</strong> RoadEfficiency Enhancement ElementsRunway 5 Runway 23IntegratedCargoFacilityFullyRelocated<strong>Airport</strong> RoadPercent ImpactsBorne byEnvironmentalJusticePopulationsStatewideAvg.Percent Minority Affected 0% 0% 0% 0% 2.1% 0% 5.0% 4.2% 15.0%Percent Hispanic Affected 0% 0% 0% 0% 1.0% 100.0% 4.2% 4.3% 8.7%Percent Low-Income 0% 0% 0% 0% 2.4% 0% 0% 2.4% 11.9%Future Build VLAP 2 (2020)Percent Minority Affected 0% 0% NA 0% 0.0% NA NA 0% 15.0%Percent Hispanic Affected 0% 0% NA 0% 2.7% NA NA 2.7% 8.7%Percent Low-Income 0% 0% NA 0% 5.1% NA NA 5.1% 11.9%Significant Noise Impacts(2020 and 2025)Percent Minority Affected 0% 0% NA 4.0% 0% NA NA 4.0% 15.0%Percent Hispanic Affected 0% 0% NA 2.6% 0% NA NA 2.6% 8.7%Percent Low-Income 0% 0% NA 0% 0% NA NA 0% 11.9%Voluntary Land Acquisitionwithin the RPZs 3 (2020)Percent Minority Affected 0% 0% NA 1.1% 15.8% NA NA 3.0% 15.0%Percent Hispanic Affected 0% 0% NA 0% 0% NA NA 0% 8.7%Percent Low-Income 0% 0% NA 0% 0% NA NA 0% 11.9%Source: 2000 U.S. Census. (Full census blocks acquired by the Rhode Island <strong>Airport</strong> Corporation since 2000 were changed to zero population.)Notes: Percentages in tables represent the environmental justice population affected divided by the total population affected to determine if a disproportionate impactwould be felt by the environmental justice population. Percentages from left to right are not additive. More detailed population data is listed inAppendix G.5, Environmental Justice Findings.1 Population data are the sum of all 2000 U.S. Census blocks (minority; Hispanic) or census block groups (low-income) within areas of significant impact.2 Residential Land exposed to noise levels of DBL 70 dB and above in 2020, and some neighboring properties would be eligible for voluntary acquisition under aFuture Build VLAP.3 RPZ clearing is a FAA-recommendation, and is not a required action. Therefore, RPZ-related property acquisition would be subject to funding availability.Land acquisition for the Integrated Cargo Facility would occur within a 100 percent Hispanic census block (with atotal population of six individuals). However, the property being taken is a vacant forested parcel and part of acommercial property. The resident population in this census block would not be impacted by the land acquisition.This analysis addresses minority and Hispanic populations separately and the Hispanic population was not addedto the total minority population to avoid the possibility of double counting. However, based on the impacts tominority populations as documented in this environmental justice analysis the demographic data indicates thateven if the impacted Hispanic population was added to the impacted non-Hispanic population this aggregateamount would not suggest that minorities as a whole were disproportionately affected by Alternative B2.Significant Impacts: In a review of the impacts to African-American, American Indian, Asian, Native Hawaiian, someother race, and mixed race populations separately, FAA found that no individual group would be disproportionatelyaffected by Alternative B2. Alternative B2 would not have a disproportionate and high adverse effect on minority,Chapter 5 - Environmental Consequences 5-111 July 2011\\mawatr\ev\09228.00\reports\<strong>FEIS</strong>_Final_July_2011\<strong>PVD</strong>_CH05_Environmental_Cons_JUL_2011.doc
T.F. <strong>Green</strong> <strong>Airport</strong> <strong>Improvement</strong> <strong>Program</strong>Environmental Impact Statement and Final Section 4(f) EvaluationHispanic, or low-income populations as a result of mandatory land acquisition for construction, land acquisition undera Future Build VLAP beginning in 2020, significant noise impacts, or land acquisition within the RPZs.5.5.5.3 Alternative B4Significant noise and compatible land use impacts would occur under Alternative B4 starting in 2015 because of theexpedited construction schedule. Additionally, mandatory land acquisition would be required on the Runway 16 End,along the Partially Relocated <strong>Airport</strong> Road, for the Integrated Cargo Facility, and along Realigned Main Avenue. Anincrease of at least DNL 1.5 dB at or above DNL 65 dB would occur south of the Runway 5 End under the predicted2015, 2020, and 2025 noise conditions. Residential parcels that would be affected by noise levels at or above DNL 70 dBin 2020 and some neighboring properties would be eligible for participation in a Future Build VLAP. Table 5-68summarizes the percent minority, Hispanic, and low-income compared to the total impacted population.Table 5-68 Alternative B4: Land Acquisition and Noise Impacts Affecting Environmental Justice Populations 1Environmental JusticePopulationSafety Enhancement ElementsRunway 16 Runway 34PartiallyRelocated<strong>Airport</strong> Road Runway 5 Runway 23Efficiency Enhancement ElementsIntegratedCargoFacilityRealignedMain AvenuePercent ImpactsBorne byEnvironmentalJusticePopulationsStatewideAvg.Mandatory Land Acquisition(2015)Percent Minority AffectedPercent Hispanic AffectedPercent Low-IncomeFuture Build VLAP 2 (2020)Percent Minority AffectedPercent Hispanic AffectedPercent Low-IncomeSignificant Noise Impacts(2015, 2020, and 2025)Percent Minority AffectedPercent Hispanic AffectedPercent Low-IncomeVoluntary Land Acquisitionwithin the RPZs 3 (2015)Percent Minority AffectedPercent Hispanic AffectedPercent Low-Income0%0%0%0%0%0%0%0%0%0%0%0%0%0%0%0%0%0%0%0%0%NANANANANANA0%0%0%0%0%0%4.9%2.3%9.4%0%0%0%0%0%0%NANANA0.9%0%0%0%0%0%NANANANANANA0.9%0%0%Source: 2000 U.S. Census. (Full census blocks acquired by the Rhode Island <strong>Airport</strong> Corporation since 2000 were changed to zero population.)Notes: Percentages in tables represent the environmental justice population affected divided by the total population affected to determine if a disproportionate impactwould be felt by the environmental justice population. Percentages from left to right are not additive. More detailed population data is listed inAppendix G.5, Environmental Justice Findings.1 Population data are the sum of all 2000 U.S. Census blocks (minority; Hispanic) or census block groups (low-income) within areas of significant impact.2 Residential Land exposed to noise levels of DBL 70 dB and above in 2020, and some neighboring properties would be eligible for voluntary acquisition under aFuture Build VLAP . No 2015 Future Build VLAP parcels would impact new census blocks or block groups that had not previously been impacted.3 RPZ clearing is a FAA-recommendation, and is not a required action. Therefore, RPZ-related property acquisition would be subject to funding availability.0%0%0%0%0%5.1%0%0%0%0%0%0%NANANANANANA4.4%1.5%0%NANANANANANA4.0%1.3%0%0%0%5.1%4.9%2.3%9.4%15.0%8.7%11.9%15.0%8.7%11.9%15.0%8.7%11.9%15.0%8.7%11.9%Chapter 5 - Environmental Consequences 5-112 July 2011\\mawatr\ev\09228.00\reports\<strong>FEIS</strong>_Final_July_2011\<strong>PVD</strong>_CH05_Environmental_Cons_JUL_2011.doc
T.F. <strong>Green</strong> <strong>Airport</strong> <strong>Improvement</strong> <strong>Program</strong>Environmental Impact Statement and Final Section 4(f) EvaluationAlternative B4 includes land acquisition areas within the Runway 5 End RPZ. 355 Figures 5-27 through 5-30 showAlternative B4 impacts and environmental justice communities north and south of the <strong>Airport</strong>, respectively.This analysis addresses minority and Hispanic populations separately and the Hispanic population was notadded to the total minority population to avoid the possibility of double counting. However, based on theimpacts to minority populations as documented in this environmental justice analysis the demographic dataindicates that even if the impacted Hispanic population was added to the impacted non-Hispanic populationthis aggregate amount would not suggest that minorities as a whole were disproportionately affected byAlternative B4.Significant Impacts: In a review of the impacts to African-American, American Indian, Asian, Native Hawaiian,some other race, and mixed race populations separately, FAA found that no individual group would be affecteddisproportionately by Alternative B4. Alternative B4 would not have a disproportionate and high adverse effecton minority, Hispanic, or low-income populations as a result of mandatory land acquisition for construction, orland acquisition under a Future Build VLAP or for FAA-recommended RPZ clearing.There is an Asian population that would be affected by significant noise impacts under Alternative B4 (seeTable G.5-7 of Appendix G.5, Environmental Justice Findings) that constitutes a minority population, as definedby DOT Order 5610.2, but not one as defined by CEQ. The impacts borne by this Asian population would not beappreciably more severe than the non-minority population so there would not be a disproportionately high andadverse effect as that term is defined in the DOT Order 5610.2.5.5.5.4 Cumulative Impacts to Environmental Justice PopulationsActions taken by the FAA and RIAC pursuant to Executive Order 12898 (after 1994) that had the potential toimpact environmental justice populations include land acquisition under the Current Part 150 VLAP and FutureBuild VLAPs. The Completed Part 150 VLAP is an on-going program based on a 1993 Part 150 noise study,which included a voluntary sound insulation and land acquisition program (updated in 2003). Table 4-18 inChapter 4, Affected Environment shows the population that would be affected by the Completed Part 150 VLAPand documents that it does not disproportionately affect environmental justice communities. There is nowell-defined cohesive minority, Hispanic, or low-income population group in the vicinity of the <strong>Airport</strong> thathas previously experienced disproportionate impacts. The Current Part 150 VLAP is based on theFAA-approved <strong>FEIS</strong> 2020 No-Action Alternative DNL 70 dB noise contour as well as a number of impactedparcels under Level 5, as identified by the Level 5 2020 Noise Exposure Map (2008). As shown in Table 5-66, theCurrent Part 150 VLAP would also not disproportionately affect environmental justice communities.Future developments in the Study Area are not anticipated to disproportionately impact environmental justicepopulations. The majority (approximately 98.8 percent) of the developable land surrounding the <strong>Airport</strong> hasalready been developed. There are several known planned mixed-use and commercial and retail developments,including the WSRD west of the <strong>Airport</strong>, the Fain Farm parcel north of the <strong>Airport</strong>, and a site onJefferson Boulevard (Table 5-5). It is anticipated that industrial uses will likely continue to grow in the JeffersonBoulevard corridor and the <strong>Airport</strong> Park Area. The WSRD would have a positive impact on the low-income355 There are no Runway 23 End RPZ-related land acquisitions because the Alternative B4 23 End RPZ would remain in the same location as the No-Action 23End RPZ.Chapter 5 - Environmental Consequences 5-113 July 2011\\mawatr\ev\09228.00\reports\<strong>FEIS</strong>_Final_July_2011\<strong>PVD</strong>_CH05_Environmental_Cons_JUL_2011.doc
T.F. <strong>Green</strong> <strong>Airport</strong> <strong>Improvement</strong> <strong>Program</strong>Environmental Impact Statement and Final Section 4(f) Evaluationcensus block group adjacent to the proposed development by providing better access to transportation servicesand possibly employment. Neither of Alternative B2 nor Alternative B4 would have disproportionate and highadverse land acquisition and noise effects on minority, Hispanic, or low-income populations, and therefore wouldnot add to cumulative disproportionate impacts to environmental justice populations, or cause the past andforeseeable future impacts to become severe and disproportionate.5.5.5.5 Comparison of Alternatives B2 and B4 Impacts to Environmental Justice PopulationsThis section compares the environmental justice and children’s health and safety impacts of Alternatives B2 and B4.Significant ImpactsNeither Alternative B2 nor B4 would result in significant impacts to environmental justice populations orchildren’s health or safety risks.Land AcquisitionThe T.F. <strong>Green</strong> <strong>Airport</strong> <strong>Improvement</strong> <strong>Program</strong> would not have a disproportionate and high adverse effect onminority, Hispanic, or low-income populations.Alternative B2 would have the greatest mandatory land acquisition impacts to minority, Hispanic, andlow-income populations. Overall, Alternative B2 would have the greatest mandatory land acquisition impactsto environmental justice communities, but the impacts are not disproportionate.Alternative B2 would have the greatest residential land eligible for acquisition under a Future Build VLAP asthe acquisition relates to environmental justice communities. (The residential land eligible for acquisition isbased upon noise levels within the DNL 70 dB and includes some neighboring properties). Neither AlternativeB2 nor B4 would cause any Future Build VLAP impacts to minority populations. Alternative B2 would have aFuture Build VLAP impacts to Hispanic populations; Alternative B4 would not have any such impacts.Alternatives B2 and B4 would have the same Future Build VLAP impacts to low-income populations. In noinstance are the land acquisition impacts for either Alternative disproportionate.Alternative B2 would have the greatest RPZ acquisition impacts to minority populations. Neither Alternative B2nor Alternative B4 would have RPZ acquisition impacts to Hispanic or low-income populations. Overall,Alternative B2 would have the greatest RPZ acquisition impacts to minority populations. In no instance are thenoise acquisition impacts for either Alternative disproportionate.Noise ImpactsAlternative B4 would have the greatest significant noise impact to environmental justice communities.Alternative B4 would have the greatest significant noise impacts (increase of at least DNL 1.5 dB at or aboveDNL 65 dB) to minority populations and low-income populations. Alternative B2 would have the greatest noiseimpacts to Hispanic populations. The impacts are not disproportionate.Chapter 5 - Environmental Consequences 5-114 July 2011\\mawatr\ev\09228.00\reports\<strong>FEIS</strong>_Final_July_2011\<strong>PVD</strong>_CH05_Environmental_Cons_JUL_2011.doc
T.F. <strong>Green</strong> <strong>Airport</strong> <strong>Improvement</strong> <strong>Program</strong>Environmental Impact Statement and Final Section 4(f) Evaluation5.5.5.6 Environmental Justice and Children’s Health and Safety Risks Avoidance and MinimizationRefer to Section 5.4.9, Avoidance and Minimization, and Section 5.5.4.7, Social and Socioeconomic Impact Avoidanceand Minimization, for a discussion on avoidance and minimization measures taken that relate to environmentaljustice populations.5.5.6 Affordable Housing AnalysisThe housing affordability impact assessment, conducted at the request of the City of Warwick, includes direct andindirect impacts on affordable housing units (land acquisition) due to the No-Action Alternative and Alternatives B2and B4. This section presents a summary of this assessment. The complete affordable housing impact assessment isprovided in Appendix G.2, Affordable Housing Analysis.5.5.6.1 Affordable Housing Analysis MethodologyTo determine the effects of property acquisition related to airport expansion on the affordable housing stock,two approaches were used. First, properties were evaluated to see if they met the state definition of affordablehousing. Properties with rents or market values at or below the affordable level are referred to in this documentas “affordable” housing. Second, consideration was given to low-and moderate-income housing that issubsidized by a municipal, state, or federal source, and is managed by a public entity or non-profit organization.Properties in this category are referred to as “subsidized low- and moderate-income” housing rather than “lowor moderate income housing” for greater clarity. The only subsidized low- and moderate-income housing in theStudy Area consists of multi-family housing.The State definition of “affordable” housing types (per RI General Law 42-128-8.1 and 45-53-3) is as follows:• Affordable homeownership properties must be affordable to households earning 120 percent of AreaMedian Income (AMI). Rhode Island Housing provided a calculation of the affordable home price in theCity of Warwick for 2- and 3- bedroom homes in 2010. This amount is $221,501 for a 2-bedroom home and$247,019 for a 3-bedroom home.• Affordable rental properties must be affordable to households earning 80 percent of AMI. Rhode IslandHousing also provided a calculation of the 2010 affordable rents for the City of Warwick. These are$1,622 per month for a 2-bedroom apartment, and $1,802 per month for a 3-bedroom apartment.• The State’s definition of Low- and Moderate-Income Housing (per the Rhode Island General Law 45-53-3) isapplied to any discussions of affordable housing that is subsidized. This includes any housing built oroperated by any public agency or any nonprofit organization or by any limited equity housing cooperativeor any private developer that is subsidized by a federal, state, or municipal government subsidy under anyprogram to assist the construction or rehabilitation of housing affordable to low- or moderate-incomehouseholds. 356356 Rhode Island Low- and Moderate-Income Housing Act, RI General Law 45-53-3.Chapter 5 - Environmental Consequences 5-115 July 2011\\mawatr\ev\09228.00\reports\<strong>FEIS</strong>_Final_July_2011\<strong>PVD</strong>_CH05_Environmental_Cons_JUL_2011.doc
T.F. <strong>Green</strong> <strong>Airport</strong> <strong>Improvement</strong> <strong>Program</strong>Environmental Impact Statement and Final Section 4(f) EvaluationThe affordable rents and house price points, as defined by the State, were then compared to the estimated rentsand market price of the residential properties to be acquired (mandatory and voluntary). Single-family homes ofunder 1,200 square feet were assumed to be two-bedroom properties; homes over 1,200 square feet wereassumed to be three-bedroom properties. Interviews with property management agents (or tenants, in caseproperty management agents were unavailable) were used to gather information on rents for larger propertiesof more than five units. Properties with rents or market values at or below the affordable level are referred to inthis document as “affordable” housing. The market sales price of homes to be acquired was assumed to be100 percent of the sum of the 2010 assessed land and building value. Refer to Appendix G.2, Affordable HousingAnalysis for further detail on methodology and assumptions used in the affordable housing analysis.5.5.6.2 Affordable Housing Impact AssessmentThis section presents the direct and indirect affordable housing impacts related to the Current Part 150 VLAPunder the No-Action Alternative, which is scheduled to be complete in 2015 as a continuation of RIAC’sPart 150 NCP.No-Action AlternativeOf the 135 units total to be acquired as part of the Current Part 150 VLAP, 134 units, or 99 percent, areconsidered affordable housing units where 108 units are affordable single-family units and 26 units areaffordable multi-family units. No subsidized low- and moderate- income housing units would be acquiredunder the No-Action Alternative. Approximately $15.2 million in estimated subsidies would be needed toreplace the units lost with new housing units serving the same price point.Alternative B2Of the 237 total housing units to be acquired under Alternative B2, 235 units total (131 single-family and104 multi-family) are affordable representing 99 percent of all residential acquisitions for Alternative B2(Table G.2-4 of Appendix G.2, Affordable Housing Analysis). The Four Seasons Apartments (totaling 84 one- tothree-bedroom units), 12 units at 45 Alabama Avenue, and eight units in two- to five- family structurescomprise the 104 affordable multi-family units to be acquired, which are located north of the <strong>Airport</strong>. Nosubsidized low- and moderate-income housing units would be acquired under Alternative B2.Alternative B4Of the 140 total units to be acquired under Alternative B4, 135 units total, or 96 percent (131 single-family andfour multi-family), are considered affordable (Table G.2-5 of Appendix G.2, Affordable Housing Analysis). Units intwo- to five- family structures located south of the <strong>Airport</strong> comprise the four affordable multi-family units to beacquired. No subsidized low- and moderate-income housing units would be acquired under Alternative B4.5.5.6.3 Cumulative Impacts to Housing AffordabilityCumulatively, since the initiation of RIAC’s Part 150 VLAP, a total of 652 residential units would be acquired by2025 as part of Alternative B2. Under the Completed Part 150 VLAP as of 2009, a total of 280 units have beenacquired. In addition, as part of the Current Part 150 VLAP up to 135 units would be acquired and underAlternative B2 a total of 237 units would be acquired for construction, noise mitigation, and FAA-recommendedRPZ clearing. Based on the high percentage, 99 percent, of the number of affordable housing units acquired forChapter 5 - Environmental Consequences 5-116 July 2011\\mawatr\ev\09228.00\reports\<strong>FEIS</strong>_Final_July_2011\<strong>PVD</strong>_CH05_Environmental_Cons_JUL_2011.doc
T.F. <strong>Green</strong> <strong>Airport</strong> <strong>Improvement</strong> <strong>Program</strong>Environmental Impact Statement and Final Section 4(f) Evaluationthe No-Action Alternative and Alternative B2 and 96 percent for Alternative B4, it is assumed that all of theCompleted Part 150 VLAP units were affordable housing units per the state law definition. The Alternative B2acquisitions equate to 0.9 percent of the 2004 housing stock in Kent County, and 1.7 percent of the 2004affordable housing stock in the City of Warwick. This cumulative loss of housing stock could potentially havean indirect adverse impact on housing affordability by raising rents and home prices within the County.Cumulatively, since the initiation of RIAC’s Part 150 VLAP, a total of 555 residential units would be acquired by2025 as part of Alternative B4. This includes 280 units acquired under the Completed Part 150 VLAP, up to135 units for the Current Part 150 VLAP as part of the No-Action Alternative, and all residential units acquiredunder Alternative B4 (140 units). These acquisitions equate to 0.8 percent of the 2004 affordable housing stock inKent County, and 1.4 percent of the 2004 housing stock in Warwick. This cumulative loss of housing stock intheory could have an indirect adverse impact on housing affordability by raising rents and home prices withinthe County.5.5.6.4 Comparison of the No-Action Alternative and Alternatives B2 and B4While no subsidized low- and moderate-income housing units would be impacted by Alternatives B2 and B4,the residential acquisitions would reduce the affordable housing stock in the City. Table 5-69 summarizes andcompares the impacts to affordable housing units for Alternatives B2 and B4.Table 5-69 Summary of Impacts to Affordable and Subsidized Low- and Moderate-Income Housing 1No-ActionType of Housing Units Alternative Alternative B2 Alternative B4Subsidized Low- and Moderate-Income Housing units 0 0 0Affordable Single-family units, including units potentially acquired108 131 131under a Future Build VLAPAffordable Multi-Family units, including units potentially acquired26 104 4under a Future Build VLAPTotal 134 235 135Note: No affordable or subsidized housing units would be required to be acquired for construction.1 Assumes 100 percent participation in a Future Build VLAP for noise mitigation and land acquisition program for clearing of the RPZs for Runway 5-23. RPZ clearingis a FAA-recommendation, and is not a required action. Therefore, RPZ-related property acquisition would be subject to funding availability.Under the No-Action Alternative, up to 108 affordable single-family units and 26 affordable multi-family unitswould be acquired under the Current Part 150 VLAP. Alternatives B2 and B4 would require the acquisition ofaffordable housing units for both construction and under a Future Build VLAP beginning in 2020.Alternative B2 would acquire up to 235 affordable units, including 104 multi-family units. Alternative B4 wouldacquire up to 135 affordable units, including four multi-family units.Chapter 5 - Environmental Consequences 5-117 July 2011\\mawatr\ev\09228.00\reports\<strong>FEIS</strong>_Final_July_2011\<strong>PVD</strong>_CH05_Environmental_Cons_JUL_2011.doc
T.F. <strong>Green</strong> <strong>Airport</strong> <strong>Improvement</strong> <strong>Program</strong>Environmental Impact Statement and Final Section 4(f) Evaluation5.6 Surface TransportationThis section presents the impact analysis for changes in surface transportation as a result of Alternatives B2 andB4 as compared to the No-Action Alternative. Information in support of the analysis presented in this section,including traffic volume networks, and capacity analysis tables and results are included in Appendix H, SurfaceTransportation.By 2015, Alternative B2 (Figure 5-2) would require the relocation of Delivery Drive from <strong>Airport</strong> Road toPost Road (U.S. Route 1, intersecting approximately opposite Earlham Way) and a partial relocation of<strong>Airport</strong> Road to intersect Post Road at Tennessee Avenue. To accommodate Partially Relocated <strong>Airport</strong> Road,Post Road would be improved from <strong>Airport</strong> Road to Route 37; Dewey Avenue and Hallene Road wouldmaintain access with Partially Relocated <strong>Airport</strong> Road; and Tennessee Avenue would become a dead-endcul-de-sac. By 2020, <strong>Airport</strong> Road would be fully relocated to the north to connect directly to Route 37. PartiallyRelocated <strong>Airport</strong> Road would remain open between Post Road and Commerce Drive to serve <strong>Airport</strong> needs.The reconstruction of the Warwick Ave and Squantum Drive intersection is proposed in order to accommodatethe new Fully Relocated <strong>Airport</strong> Road segment (refer to Chapter 3, Alternatives Analysis, for further details).Under Alternative B4 (Figure 5-2), there is no full relocation of <strong>Airport</strong> Road and no direct connection toRoute 37. However, a portion of <strong>Airport</strong> Road would be partially relocated from Post Road to east of EvergreenAvenue. The Partially Relocated <strong>Airport</strong> Road would intersect Post Road at Hasbrouck Avenue. To support therelocation, the driveway to the Ann & Hope parcel would be realigned so that it approaches Post Road directlyopposite Partially Relocated <strong>Airport</strong> Road; Dewey Avenue, Hallene Road, and Evergreen Avenue wouldmaintain access with partially Relocated <strong>Airport</strong> Road; and Post Road would be improved from TennesseeAvenue to the vicinity of Haverford Road. Delivery Drive would also be relocated from <strong>Airport</strong> Road toPost Road. Main Avenue would be shifted to the south at the Runway 5 End on <strong>Airport</strong> land. All Alternative B4roadway infrastructure changes would take place by the end of 2015.5.6.1 Regulatory ContextAll construction and modification affecting the State Highway (Route 37) Right-of-Way will be regulated andcontrolled by RIDOT. Physical Alteration Permits through RIDOT would be required for curb-cuts, new andremoved traffic signals, and new roadway alignments for State Highway Right-of-Way. Additionally, any roadthat will intersect a State Highway Right-of-Way must be approved through application for and issuance of aPhysical Alteration Permit. This includes municipal or other road design, construction, or reconstruction. Trafficimpact studies are required to be submitted to RIDOT when a proposed development or redevelopment willgenerate 100 or more added (new) vehicle trips per hour during the adjacent roadway’s peak hour, or whenchanges are proposed in an area already suffering congestion, at the judgment or discretion of RIDOT, andwhen a traffic signal is warranted due to the additional trips generated.Chapter 5 - Environmental Consequences 5-118 July 2011\\mawatr\ev\09228.00\reports\<strong>FEIS</strong>_Final_July_2011\<strong>PVD</strong>_CH05_Environmental_Cons_JUL_2011.doc
T.F. <strong>Green</strong> <strong>Airport</strong> <strong>Improvement</strong> <strong>Program</strong>Environmental Impact Statement and Final Section 4(f) Evaluation5.6.2 Significance Thresholds and Additional AnalysesThe surface transportation analysis considers impacts of Alternatives B2 and B4 as defined in the FAA’sthresholds of significance defined under social and socioeconomic impacts, and also conducts other additionaltraffic analyses to gain a full understanding of roadway and airport access conditions.5.6.2.1 Finding: No Significant Surface Transportation ImpactsThe significance threshold for surface transportation (which is listed under the social and socioeconomicsignificance thresholds), in accordance with the FAA Order 1050.1E, is when an action would cause disruption inlocal traffic patterns that would substantially reduce the level of service of roads serving the <strong>Airport</strong> andsurrounding communities (Table 5-6). Alternative B2 and Alternative B4 would not result in significant surfacetransportation impacts since neither would cause a substantial reduction in the Level of Service (LOS) 357 of roadsserving the airport and its surrounding communities. The results show that there would be no freeway segment,ramp merge and diverge area, or freeway weave segment capacity constraints on the <strong>Airport</strong> Connector or Route37 and that there would be no locations that would degrade to LOS E or LOS F as a result of Alternative B2. UnderAlternative B2, there would be no substantial reduction in the LOS of roads serving the <strong>Airport</strong> and itssurrounding communities. Alternative B2 would improve traffic circulation surrounding the <strong>Airport</strong>, specificallywith the Fully Relocated <strong>Airport</strong> Road and the <strong>Airport</strong> gateway improvements on Post Road.For Alternative B4, the results show that there would be no freeway segment or ramp merge and diverge areacapacity constraints on the <strong>Airport</strong> Connector or Route 37 and that there would be no locations that woulddegrade to LOS E or LOS F as a result of Alternative B4. Under Alternative B4, there would be no substantialreduction in the LOS of roads serving the <strong>Airport</strong> and its surrounding communities. Alternative B4 also wouldimprove traffic circulation surrounding the <strong>Airport</strong>, specifically with the proposed improvements to<strong>Airport</strong> Road and Main Avenue, and the <strong>Airport</strong> gateway improvements on Post Road (U.S. Route 1).5.6.2.2 Additional AnalysesIn addition to the LOS analysis conducted to identify significant impacts, the surface transportation impactassessment considered parking, public transportation, and bicycle transportation at the <strong>Airport</strong> and its surroundings.5.6.3 MethodologyThis section summarizes the methods used to assess the No-Action Alternative and Alternatives B2 and B4. Thefollowing regulations and standards were consulted to identify appropriate methodologies for the surfacetransportation analysis:• Federal Highway Administration (FHWA) 55 FR 42670 (October 22, 1990) amended by policy FR Doc. 98-3460(February 11, 1998)• Transportation Engineering Handbook, James Pline (ed.), 5th ed. Institute of Transportation Engineers:Washington, D.C.357 The term “level of service” (LOS) is used to denote the different operating conditions that occur under select traffic volume loads. It is a qualitative measurethat considers a number of factors including traffic demands, roadway geometry, speed, signal operations, travel delay, and freedom to maneuver. Thelevel of service designation is an index ranging from A to F, with LOS A representing the best operating conditions and LOS F representing the worstoperating conditions.Chapter 5 - Environmental Consequences 5-119 July 2011\\mawatr\ev\09228.00\reports\<strong>FEIS</strong>_Final_July_2011\<strong>PVD</strong>_CH05_Environmental_Cons_JUL_2011.doc
T.F. <strong>Green</strong> <strong>Airport</strong> <strong>Improvement</strong> <strong>Program</strong>Environmental Impact Statement and Final Section 4(f) Evaluation• 2000 Highway Capacity Manual (HCM 2000), Transportation Research Board• Manual on Uniform Traffic Control Devices (MUTCD), USDOT, 2009 Edition5.6.3.1 Vehicular Transportation MethodologyThe Statewide Travel Demand Model (Statewide Model) maintained by the Rhode Island Statewide Planning<strong>Program</strong> was used to forecast future 2015, 2020, and 2025 No-Action Alternative traffic growth on and aroundthe <strong>Airport</strong> based on predicted land uses changes, including households, employment, and airport-relatedactivity (deplanements and enplanements). Predicted land use changes around the <strong>Airport</strong> not associated withthe <strong>Improvement</strong> <strong>Program</strong> were also included in the model. An adjustment was made to future StatewideModel runs to account for the predicted increase in transit usage as a result of InterLink, the new intermodalstation that opened in late 2010.An annual growth rate for each Study Area intersection was determined using the Statewide Model. The 2015,2020, and 2025 No-Action Alternative weekday morning and evening peak hour turning movement volumenetworks were determined. Manual adjustments were applied to account for rental car shifts and the potentialretail development on Commerce Drive off <strong>Airport</strong> Road. These adjustments incorporate consideration ofcumulative impacts in the analysis.Model runs for Alternatives B2 and B4 were prepared by updating the No-Action Alternative model conditionto reflect the expected changes in airport employment, aircraft enplanements or deplanements, thereconfiguration of <strong>Airport</strong> facilities including cargo, GSE facilities, other ancillary uses, and the transportationroadway network changes. For both Alternatives B2 and B4, the 2015 model run includes the safetyenhancements. For Alternative B4, the 2015 model run also assumed the extension of Runway 5-23 with itsassociated aircraft enplanements or deplanements would be in place. The 2020 and 2025 model runs for bothAlternatives B2 and B4 assumed full build of both the safety and efficiency enhancements. The 2025 model runsfor both Alternatives B2 and B4 reflects the natural increase in operations and passengers five years after the full<strong>Improvement</strong> <strong>Program</strong> would be in place. These 2025 model runs were prepared by updating the 2020 modelruns for projected changes in land use at and around the <strong>Airport</strong>.Vehicle miles traveled (VMT) and vehicle hours traveled (VHT) were obtained from the 2015, 2020, and 2025Statewide Model results. VMT is a measure of the total number of miles of vehicular travel on an average day withinthe Study Area. VHT is a measure of the total number of hours of vehicular travel on an average day within theStudy Area.The resulting peak hour volumes were used as inputs into traffic operations analyses, which evaluated how well theinfrastructure would handle the demands placed on it during the morning and evening peak hours. This LOSevaluation was prepared for Study Area intersections, freeway segments, and ramps.When compared to the No-Action Alternative, the LOS assessment for Alternatives B2 and B4 revealed locationswhere traffic flow for specific movements or an overall intersection would degrade to unacceptable LOS E orLOS F levels. For the roadway changes associated with the Alternative B2 safety enhancements (to be completedby the end of 2015), the analysis focuses on construction-related changes associated with the relocated intersectionChapter 5 - Environmental Consequences 5-120 July 2011\\mawatr\ev\09228.00\reports\<strong>FEIS</strong>_Final_July_2011\<strong>PVD</strong>_CH05_Environmental_Cons_JUL_2011.doc
T.F. <strong>Green</strong> <strong>Airport</strong> <strong>Improvement</strong> <strong>Program</strong>Environmental Impact Statement and Final Section 4(f) Evaluationof Post Road and Partially Relocated <strong>Airport</strong> Road and the new intersection of Post Road and Relocated DeliveryDrive. These are the only two locations expected to show a difference in traffic volume (when compared to theNo-Action Alternative) in 2015. A complete analysis of physical changes and traffic operations was conducted forAlternative B4 in 2015 since increased aircraft enplanements or deplanements resulting from the extension ofRunway 5-23 would result in differences in traffic volumes at most Study Area locations.Alternatives B2 and B4 would result in land acquisitions and land use relocations. Although traffic demandsgenerated by each business and residential acquisition could have been subtracted out of the peak hournetworks, the analyses did not account for these potential traffic reductions. Instead, the traffic analyses assumethat nearby replacement development would occur.5.6.3.2 Parking MethodologyThe parking analysis documents and compares the on- and off-<strong>Airport</strong> parking supplies associated with theNo-Action Alternative and Alternatives B2 and B4 in 2015, 2020, and 2025.5.6.3.3 Public Transportation and Bicycle Transportation MethodologyThe effects of Alternatives B2 and B4 on the surrounding public transportation and bicycle transportationsystems were determined by overlaying the proposed future roadway plan onto the existing system networksand qualitatively examining the potential effects. For public transportation systems, Rhode Island Public TransitAuthority (RIPTA) bus routes and system maps (available at www.ripta.com) were referenced. For bicycleroutes, RIDOT maps for the State of Rhode Island were referenced.5.6.4 Impact AssessmentThis section summarizes the direct and indirect effects of the No-Action Alternative and Alternatives B2 and B4on the surface transportation system in the Study Area. Though temporary in nature, surface transportationimpacts related to construction activities are also discussed. The transportation analysis is by nature cumulative,because it takes background conditions over time into account.Direct impacts are those that would be a direct consequence of Alternatives B2 and B4, such as altered trafficdemands from changes in the roadway system or increased traffic demands that would result from the increasein enplanements attributable to the Alternatives. Indirect impacts would be caused by the Alternatives B2 andB4, but occur later in time or are farther removed in distance from the Study Area. Indirect impacts arereasonably foreseeable, such as induced traffic demands from other roadways because of the modified roadwaynetwork. Other examples of indirect impacts include quality of life factors, such as enhanced east-west mobilityand neighborhood circulation.5.6.4.1 No-Action AlternativeThe No-Action Alternative does not include a runway extension or the increased traffic due to the additionalenplanements or deplanements associated with a longer runway. The No-Action Alternative does not physically alterany roadways or intersections off-<strong>Airport</strong> to accommodate the increase in on-<strong>Airport</strong> activities that would occurregardless of the <strong>Improvement</strong> <strong>Program</strong>.Chapter 5 - Environmental Consequences 5-121 July 2011\\mawatr\ev\09228.00\reports\<strong>FEIS</strong>_Final_July_2011\<strong>PVD</strong>_CH05_Environmental_Cons_JUL_2011.doc
T.F. <strong>Green</strong> <strong>Airport</strong> <strong>Improvement</strong> <strong>Program</strong>Environmental Impact Statement and Final Section 4(f) EvaluationThis section summarizes the direct impacts under the No-Action Alternative. Indirect impacts are notanticipated because the No-Action Alternative would not independently induce a significant amount of newdevelopment. No short-term impacts due to temporary construction activities would exist for the No-ActionAlternative as these projects are on-<strong>Airport</strong>.Vehicular Traffic ImpactsThe No-Action Alternative assumes planned or on-going physical and operational changes that would occur to theroadways and intersections serving the <strong>Airport</strong> in 2015, 2020, and 2025. The off-<strong>Airport</strong> changes that are notassociated with the No-Action Alternative include construction of InterLink, planned and approved roadways, signaltiming, and other safety enhancements, and planned and speculative land developments in the Study Area(Table 5-5).Effects on Daily TrafficWeekday daily traffic volumes for key roadway segments under the No-Action Alternative are compared to theBaseline Condition. Traffic volumes are expected to remain constant or increase along all segments consideredbetween the Baseline Condition (2004) and in 2015, 2020, and 2025, with the highest increases on the <strong>Airport</strong>Connector. These increases are attributable to expected changes in regional traffic as a result of planneddevelopments, changes in the surface transportation infrastructure, forecasted changes in <strong>Airport</strong> activity(enplanements, deplanements, and employment) not associated with the <strong>Improvement</strong> <strong>Program</strong>, and forecastedchanges in employment and population in the area.Key findings related to traffic growth under the No-Action Alternative through 2025 include:• Route 37 – Daily traffic on Route 37 between I-95 and Post Road would increase by 3.2 percent (0.1 percentannually) by the year 2025;• <strong>Airport</strong> Road – Traffic on <strong>Airport</strong> Road between Post Road and Commerce Drive would increase by3.4 percent (0.2 percent annually);• Post Road (U.S. Route 1) – Traffic increases on Post Road vary by location:2.5 percent (0.1 percent annually) between Pell Avenue and Connecticut Avenue;2.7 percent (0.1percent annually) between Coronado Road and Haverford Road; and5.9 percent (0.3 percent annually) between the <strong>Airport</strong> Connector and Coronado Road;• Jefferson Boulevard – Traffic on Jefferson Boulevard between <strong>Airport</strong> Connector and Coronado Road wouldincrease by 3.0 percent (0.1 percent annually);• <strong>Airport</strong> Connector – Between Jefferson Boulevard and Post Road, traffic would increase by 11.3 percent(0.5percent annually) and between I-95 and Jefferson Boulevard, traffic would increase by 10.7 percent(0.5 percent annually); and• Main Avenue – Traffic on Main Avenue between Post Road and Industrial Drive would increase by3.0 percent (0.1 percent annually).Chapter 5 - Environmental Consequences 5-122 July 2011\\mawatr\ev\09228.00\reports\<strong>FEIS</strong>_Final_July_2011\<strong>PVD</strong>_CH05_Environmental_Cons_JUL_2011.doc
T.F. <strong>Green</strong> <strong>Airport</strong> <strong>Improvement</strong> <strong>Program</strong>Environmental Impact Statement and Final Section 4(f) EvaluationEffects on VMT and VHTThis section documents the effects of the No-Action Alternative on vehicle trip lengths and durations. Adecrease in VMT indicates shorter trip lengths, more direct routes of travel, or less traffic demand through thearea. A decrease in VHT indicates shorter trip durations, travel on less congested routes, or less traffic demand.Assuming traffic demands are held constant, it is possible to show increases in VMT with correspondingdecreases in VHT if drivers choose longer trips that bypass congested roadways. Similarly, if drivers choosemore congested roadways that are more direct over longer ones that are uncongested then there would be anincrease in VHT and a decrease in VMT.Changes in VMT and VHT were determined using the Statewide Model for the model’s traffic analysis zones(TAZs) that generally comprise the Study Area. VMT is predicted to increase by 8.5 percent by 2015,11.4 percent by 2020, and 17.2 percent by 2025 under the No-Action Alternative when compared to the BaselineCondition. VHT is expected to increase by 11.4 percent by 2015, 18.1 percent by 2020, and 28.4 percent by 2025under the No-Action Alternative when compared to the Baseline Condition. These increases in VMT and VHTare attributable to more vehicle trips on the roadway network traveling on more congested routes.Effects on Peak Hour Traffic Flow (Level of Service)This section documents the No-Action Alternative morning and evening peak hour traffic flow. At twolocations, existing LOS E or LOS F capacity constraints would be exacerbated by increased traffic under theNo-Action Alternative:• Post Road (U.S. Route 1) at Lincoln Avenue – During the evening peak hour, the overall intersection woulddegrade from LOS E to LOS F under the No-Action Alternative in 2015, 2020, and 2025. This is primarily theresult of a heavy eastbound left-turn volume (410 to 440 vehicles, depending on the year) fromLincoln Avenue onto Post Road that is not provided a protected traffic signal phase.• <strong>Airport</strong> Road at Warwick Avenue – During the evening peak hour, the overall intersection would continueto operate at LOS E under the No-Action Alternatives in 2015 and 2020. Under the No-Action Alternative in2025, the intersection would degrade from LOS E to LOS F. This is primarily the result of heavy volumes onall approaches where the signal is operating near capacity.The No-Action Alternative (2015, 2020, and 2025) would result in LOS E or LOS F conditions at seven locations:• Post Road (U.S. Route 1) at <strong>Airport</strong> Road – During the evening peak hour, the overall intersection woulddegrade from LOS D to LOS E under the No-Action Alternative in 2025.• <strong>Airport</strong> Road at Commerce Drive – The added traffic from planned development off Commerce Drivewould result in LOS F operations from LOS B in the evening peak hour in 2015, 2020, and 2025.• <strong>Airport</strong> Road at Warwick Avenue – During the morning peak hour, the overall intersection would degradefrom LOS D to LOS E under the No-Action Alternative in 2015, 2020, and 2025. In the evening peak, theintersection would continue to operate at LOS E under the No-Action Alternatives in 2015 and 2020. Underthe No-Action Alternative in 2025, the intersection would degrade to LOS F during the evening peak hour.Chapter 5 - Environmental Consequences 5-123 July 2011\\mawatr\ev\09228.00\reports\<strong>FEIS</strong>_Final_July_2011\<strong>PVD</strong>_CH05_Environmental_Cons_JUL_2011.doc
T.F. <strong>Green</strong> <strong>Airport</strong> <strong>Improvement</strong> <strong>Program</strong>Environmental Impact Statement and Final Section 4(f) Evaluation• Main Avenue at Industrial Drive – The evening peak hour operations would degrade from LOS D to theLOS E under the No-Action Alternative in 2025 only.• Main Avenue at Jefferson Boulevard – During the morning peak hour, the overall intersection woulddegrade from LOS C to LOS E under the No-Action Alternative in 2025. The evening peak hour woulddegrade from LOS D to LOS E under the No-Action Alternative in 2020 and 2025.• Jefferson Boulevard at Coronado Road / Kilvert Street – The evening peak hour would degrade fromLOS D to LOS E under the No-Action Alternative in 2025 only.• <strong>Airport</strong> Road at Evergreen Avenue – The evening peak hour would degrade from LOS B to LOS F under theNo-Action Alternative in 2015, 2020, and 2025. This condition would apply only to approximately five additionalvehicles on Evergreen Avenue, as traffic increases on <strong>Airport</strong> Road would result in fewer gaps for EvergreenAvenue traffic to complete turning maneuvers. The peak hour volume of traffic on Evergreen Avenue is not highenough to warrant a traffic signal based on signal warrant analysis procedures. 358 Nearby traffic signals along<strong>Airport</strong> Road may provide gaps in the traffic stream, which could help Evergreen Avenue traffic turn onto<strong>Airport</strong> Road.The planned improvements associated with InterLink at the intersection of Jefferson Boulevard, Coronado Roadand Kilvert Street would accommodate future traffic growth to the year 2020 without degrading LOS. Theevening peak hour would degrade from LOS D to LOS E under the No-Action Alternative in 2025. The plannedtraffic signals at the intersections of Jefferson Boulevard and the <strong>Airport</strong> Connector ramps would accommodatefuture 2025 traffic demands (LOS B or better).Effects on Freeway Segments and RampsThe results show that there would be no freeway segment, ramp merge and diverge area, or freeway weavesegment capacity constraints on the <strong>Airport</strong> Connector or Route 37 under the No-Action Alternative.Parking ImpactsThe No-Action Alternative would not increase the parking supply on the <strong>Airport</strong>, nor would it impact theprivately owned off-<strong>Airport</strong> public parking facilities on Post Road and <strong>Airport</strong> Road that serve airport travelers.An additional 149 parking spaces became available in Garage A when the rental car companies relocated toInterLink in October 2010.Public Transportation ImpactsThe No-Action Alternative would improve the public transportation system in the Study Area by providingregional commuter rail service to the <strong>Airport</strong> via InterLink (construction was completed in early 2010) as well asunder Alternatives B2 and B4. The No-Action Alternative would not physically impact the existing RIPTA bustransportation system in the Study Area because there are no off-<strong>Airport</strong> roadway modifications that wouldresult in changes to RIPTA bus routes.358 Manual on Uniform Traffic Control Devices, U.S. Department of Transportation, 2009 Edition.Chapter 5 - Environmental Consequences 5-124 July 2011\\mawatr\ev\09228.00\reports\<strong>FEIS</strong>_Final_July_2011\<strong>PVD</strong>_CH05_Environmental_Cons_JUL_2011.doc
T.F. <strong>Green</strong> <strong>Airport</strong> <strong>Improvement</strong> <strong>Program</strong>Environmental Impact Statement and Final Section 4(f) EvaluationPedestrian and Bicycle Transportation ImpactsThe No-Action Alternative would improve pedestrian links to the <strong>Airport</strong> with the connection to InterLink.None of the designated Statewide Bicycle Routes or Neighborhood Bicycle Routes in the Study Area would beaffected by the No-Action Alternative. None of the roadways classified by RIDOT as “Suitable Roads” forbicycle travel would be altered. 3595.6.4.2 Alternative B2This section presents the results of the surface transportation analysis for Alternative B2 in 2015, 2020, and 2025.Vehicular Traffic Impacts – 2015No additional passenger demand would be generated by Alternative B2 in 2015; therefore, there would be noincrease in traffic volumes compared to the No-Action Alternative. All impacts occurring under Alternative B2in 2015 can be considered direct impacts associated with the construction of the safety enhancements andassociated roadway improvements. The safety enhancements include modifying the Runway 16-34 RSAs, whichrequires relocating a portion of <strong>Airport</strong> Road (from the intersection of Post Road and Tennessee Avenue, to justwest of Evergreen Avenue). The Partially Relocated <strong>Airport</strong> Road would include the following components:• Partially Relocated <strong>Airport</strong> Road would have 6-foot sidewalks and two 12-foot travel lanes in eachdirection;• Dewey Avenue and Hallene Road would maintain access with Partially Relocated <strong>Airport</strong> Road;• Tennessee Avenue would become a dead-end cul-de-sac;• Post Road (U.S. Route 1) would be improved from <strong>Airport</strong> Road to Route 37. Post Road would be modifiedto provide 11-foot travel lanes and turn lanes with one-foot shoulders; sidewalks would also be maintainedon both sides of the road; and• Delivery Drive would be relocated. Instead of intersecting <strong>Airport</strong> Road, Delivery Drive would intersectPost Road approximately opposite Earlham Way. This new driveway along Post Road would beunsignalized.At the time of this <strong>FEIS</strong> filing, there were no known specific land use plans for the remaining parcels served byPartially Relocated <strong>Airport</strong> Road and, therefore, traffic generation projections were not made for these uses. Theintersection of Partially Relocated <strong>Airport</strong> Road and Post Road would be designed to accommodate projected2015 <strong>Airport</strong> Road traffic volumes.Effects on Daily Traffic - 2015Compared to the No-Action Alternative, Alternative B2 would result in only one roadway segment that wouldexperience a change in Average Annual Daily Traffic (AADT; expressed in vehicles per day) in 2015: Post Roadbetween Pell Avenue and Connecticut Avenue. On this segment of Post Road, AADT would decrease from40,500 vehicles per day (vpd) under the No-Action Alternative to 39,100 vpd under Alternative B2 (a decrease of3.5 percent). This results from relocating the intersection of Post Road and <strong>Airport</strong> Road.359 A Guide to Cycling in the Ocean State, 2005 to 2006; prepared by Rhode Island Department of Transportation.Chapter 5 - Environmental Consequences 5-125 July 2011\\mawatr\ev\09228.00\reports\<strong>FEIS</strong>_Final_July_2011\<strong>PVD</strong>_CH05_Environmental_Cons_JUL_2011.doc
T.F. <strong>Green</strong> <strong>Airport</strong> <strong>Improvement</strong> <strong>Program</strong>Environmental Impact Statement and Final Section 4(f) EvaluationEffects on VMT and VHT - 2015Compared to the No-Action Alternative, Alternative B2 would result in only a minor decrease in VMT in 2015(from 1,147,700 to 1,147,200 – a decrease of less than 0.1 percent). There would be no change in VHT forAlternative B2.Effects on Peak Hour Traffic Flow (Level of Service) - 2015Because Partially Relocated <strong>Airport</strong> Road is necessary only to provide sufficient land area to improve theRunway 16-34 RSAs, there would be no additional vehicle trips expected in 2015 under Alternative B2.Therefore, only two intersections show operational changes in 2015 under Alternative B2:• Post Road (U.S. Route 1) at Partially Relocated <strong>Airport</strong> Road and Fire Station driveway – This relocatedintersection would operate at LOS D in both the morning and evening peak hours in 2015, with slightlylower overall delay when compared to the No-Action Alternative. The relocated intersection would bedesigned to accommodate all movements at the intersection, including the fire station driveway, asmovements regularly occur throughout the day. In addition, the traffic signal would be equipped withhard-wire preemption, allowing the fire station staff to control the signal from inside the firehouse or a firetruck at times when they are dispatched for an emergency.• Post Road (U.S. Route 1) at Relocated Delivery Drive – Relocating Delivery Drive would create a newunsignalized driveway along Post Road. The only vehicles using Delivery Drive would be <strong>Airport</strong> deliveryvehicles (approximately 35 vehicles per hour during the morning and evening peak hours). General trafficwould be prohibited from entering or exiting the <strong>Airport</strong> at this location. Because traffic volumes onDelivery Drive are low, a traffic signal is not warranted or recommended at this driveway. Without a signal,vehicles exiting Delivery Drive would operate at LOS F during the evening peak hour in 2015. However, theLOS F only applies to the 35 vehicles exiting Delivery Drive, not to the vehicles on Post Road (an average ofone vehicle every two minutes). General traffic on Post Road would not be affected. 360Effects on Freeway Segments and Ramps - 2015Since traffic volumes along all freeway segments, ramp merge and diverge areas, and freeway weave segments are notimpacted by Alternative B2 in 2015, capacity analysis results at these locations are identical to the No-Action Alternative.There would be no freeway segment, ramp merge and diverge area, or freeway weave segment capacity constraints onthe <strong>Airport</strong> Connector or Route 37. Further, there would be no locations that degrade to LOS E or LOS F.Parking Impacts - 2015In 2015, Alternative B2 would not impact the parking supply on the <strong>Airport</strong>. Alternative B2 would requireacquisition of property privately owned by <strong>Airport</strong> Valet (at 717 <strong>Airport</strong> Road) that is currently used for valetparking and holds approximately 180 vehicles. This property would be acquired for construction of the Runway16 RSA. Alternative B2 would also impact the facilities and operations in the rental car maintenance area, whichwould be bisected by the proposed alignment of Partially Relocated <strong>Airport</strong> Road. Rental car companies would360 Of the 35 vehicles, approximately 5 vehicles are expected to turn left and the remaining 30 vehicles are expected to turn right, based on observed trafficmovements. The 35 vehicles per hour average to about one vehicle every two minutes.Chapter 5 - Environmental Consequences 5-126 July 2011\\mawatr\ev\09228.00\reports\<strong>FEIS</strong>_Final_July_2011\<strong>PVD</strong>_CH05_Environmental_Cons_JUL_2011.doc
T.F. <strong>Green</strong> <strong>Airport</strong> <strong>Improvement</strong> <strong>Program</strong>Environmental Impact Statement and Final Section 4(f) Evaluationcontinue to perform maintenance at their existing locations, and the buildings and parking areas at the rentalcar site would need to be reconfigured.Public Transportation Impacts - 2015In 2015, Alternative B2 could result in minor changes to two RIPTA bus routes (Routes 1 and 20), which operateon Post Road north of the <strong>Airport</strong>. These routes could see minor changes such as relocated bus stop locationsalong that section of Post Road. Other RIPTA routes that serve the <strong>Airport</strong> (Routes 3, 8, 14, 29, and 66) thatoperate in the area would be unaffected by Alternative B2 in 2015.Pedestrian and Bicycle Transportation Impacts - 2015None of the designated Statewide Bicycle Routes or Neighborhood Bicycle Routes in the Study Area would beaffected by Alternative B2 in 2015. None of the roadways classified by RIDOT as “Suitable Roads” for bicycletravel would be altered.Neighborhood Circulation Impacts - 2015Under Alternative B2 in 2015, parcels on the following streets would result in minor modifications to access:• <strong>Airport</strong> Road• Senator Street• Dewey Ave• Hallene RoadAccess to the routes would be provided via Partially Relocated <strong>Airport</strong> Road or Tennessee Avenue, rather thanexisting <strong>Airport</strong> Road as occurs today.Vehicular Traffic Impacts – 2020/2025The increased passenger demands expected under Alternative B2 in 2020 would result in additional traffic inthe Study Area. Fully Relocated <strong>Airport</strong> Road would be completed by 2020 to connect directly to Route 37.Partially Relocated <strong>Airport</strong> Road from Post Road to Commerce Drive (constructed by 2015) would remain opento serve <strong>Airport</strong> needs. But, to remain clear of the Runway 5-23 Object Free Area, Partially Relocated <strong>Airport</strong>Road would be discontinued east of Commerce Drive. All traffic volumes that are currently using <strong>Airport</strong> Roadas an east-west through connection or that are projected to use Partially Relocated <strong>Airport</strong> Road in 2015 areassumed instead to use Fully Relocated <strong>Airport</strong> Road under Alternative B2 in 2020 and 2025.Traffic volumes along Partially Relocated <strong>Airport</strong> Road are associated with the Integrated Cargo Facility,parcels exclusively served by Partially Relocated <strong>Airport</strong> Road, and rental car facility maintenance activities.Traffic associated with the new Integrated Cargo Facility would access the area via the intersection of FullyRelocated <strong>Airport</strong> Road at Commerce Drive. Given the substantial decrease in traffic volume at this intersectionwith Post Road due to a shift in traffic volumes to Fully Relocated <strong>Airport</strong> Road, no operational issues areforeseen under Alternative B2 in 2020 or 2025 and the intersection was not analyzed.Chapter 5 - Environmental Consequences 5-127 July 2011\\mawatr\ev\09228.00\reports\<strong>FEIS</strong>_Final_July_2011\<strong>PVD</strong>_CH05_Environmental_Cons_JUL_2011.doc
T.F. <strong>Green</strong> <strong>Airport</strong> <strong>Improvement</strong> <strong>Program</strong>Environmental Impact Statement and Final Section 4(f) EvaluationConstructed by 2020, an improved Terminal Area Roadway would consist of a new Post Road “GatewayEntrance” to the <strong>Airport</strong>, South Access Road, a South Circulation Road, a Service Area Road, and alterations tothe Lower and Upper Level Terminal Roadways. The existing <strong>Airport</strong> access to Post Road south of the <strong>Airport</strong>Connector (Aviation Avenue opposite Donald Avenue) would be closed. East of the <strong>Airport</strong>, the existing<strong>Airport</strong> Road would be discontinued west of Harmony Court and it is assumed that the traffic signal at HadeCourt and Etta Street would be removed. The Fully Relocated <strong>Airport</strong> Road would be designed withappropriate accommodations for pedestrians and cyclists.Effects on Daily Traffic – 2020/2025Under Alternative B2 in 2020 and 2025, in addition to new <strong>Airport</strong>-generated traffic to the Study Area, existingnon-<strong>Airport</strong> related traffic patterns would be altered. Existing non-<strong>Airport</strong> trips would be induced to and fromStudy Area roadways as a result of expected transportation modifications. Shifts in regional traffic, unrelated tothe <strong>Airport</strong>, would occur between Post Road, Main Avenue, and other roadways throughout the region toRoute 37 and Fully Relocated <strong>Airport</strong> Road. These shifts would occur because Fully Relocated <strong>Airport</strong> Roadprovides a more direct, less congested east-west connection between Route 37 and Warwick Avenue. Once theseregional shifts occur, capacity on local roadways would increase and an opportunity for local traffic to altertravel patterns would also occur.Compared to the No-Action Alternative, Alternative B2 would decrease daily traffic on four roadway segments:• Post Road (U.S. Route 1) between Pell Avenue and Connecticut Avenue –A 33.2 percent decrease in dailytraffic in 2020 is expected between Pell Avenue and Connecticut Avenue caused by Fully Relocated <strong>Airport</strong>Road completion. In 2025, a decrease of 33.9 percent is expected;• Post Road (U.S. Route 1) between <strong>Airport</strong> Connector and Coronado Road – A 0.3 percent decrease isexpected in 2020;• <strong>Airport</strong> Connector between Jefferson Boulevard and Post Road – <strong>Airport</strong> Connector traffic would decreaseby 2.5 percent in 2020 and by 4.3 percent on this segment in 2025; and• <strong>Airport</strong> Connector between I-95 and Jefferson Boulevard: Daily traffic is expected to decrease by 2.1 percentin 2020 and by 3.6 percent in 2025.Compared to the No-Action Alternative, increases in daily traffic would occur on six roadway segments underAlternative B2:• Route 37 – Daily traffic on Route 37 between I-95 and Post Road is expected to increase by 22.1 percentcompared to the No-Action Alternative in 2020 and by 21.5 percent in 2025;• Fully Relocated <strong>Airport</strong> Road – <strong>Airport</strong> Road traffic would increase by 13.9 percent between Post Road andCommerce Drive in 2020 and by 12.8 percent in 2025;• Post Road (U.S. Route 1) – Traffic changes along Post Road from Alternative B2 in 2020 and 2025, whencompared to the No-Action Alternative, vary by location:Chapter 5 - Environmental Consequences 5-128 July 2011\\mawatr\ev\09228.00\reports\<strong>FEIS</strong>_Final_July_2011\<strong>PVD</strong>_CH05_Environmental_Cons_JUL_2011.doc
T.F. <strong>Green</strong> <strong>Airport</strong> <strong>Improvement</strong> <strong>Program</strong>Environmental Impact Statement and Final Section 4(f) EvaluationBetween Coronado Road and Haverford Road, a 0.9 percent increase is expected in 2020 and a1.2 percent increase is expected in 2025; Between the <strong>Airport</strong> Connector and Coronado Road, a 1.2 percent increase is expected in 2025;• Jefferson Boulevard – Traffic on Jefferson Boulevard between <strong>Airport</strong> Connector and Coronado Road wouldincrease by 2.7 percent in 2025. No change is expected in 2020; and• Main Avenue – Traffic on Main Avenue between Post Road and Industrial Drive would increase by1.7 percent in 2020 and by 0.7 percent in 2025.Effects on VMT and VHT – 2020/2025Alternative B2 would result in decreases in VMT and VHT in both 2020 and 2025 compared to the No-ActionAlternative. Under Alternative B2, VMT would decrease by 1.2 percent in both 2020 and 2025. VHT woulddecrease by 2.4 percent in both 2020 and 2025. VMT and VHT would decrease because Alternative B2 provides amore direct connection to Route 37, which shortens trip lengths for east-west traffic from the Route 37interchange or points north on Post Road. Moreover, this east-west link from Route 37 to Fully Relocated<strong>Airport</strong> Road would be uninterrupted, whereas today this traffic flow passes through the busy signalizedintersection of Post Road and <strong>Airport</strong> Road.Effects on Peak Hour Traffic Flow (Level of Service) – 2020/2025Morning and evening peak hour traffic flow would improve at seven locations under Alternative B2 whencompared with the No-Action Alternative:• Post Road (U.S. Route 1) at Lincoln Avenue – During the evening peak hour in both 2020 and 2025, overallintersection operations would improve from LOS F under the No-Action Alternative to LOS C underAlternative B2. During the morning peak hour, intersection operations would improve from LOS C underthe No-Action Alternative to LOS B under Alternative B2 in both years. While the intersection is projectedto experience increases in traffic volume when compared to the No-Action Alternative, Alternative B2would modify intersection geometry and signal timing and coordination as part of Fully Relocated <strong>Airport</strong>Road. These improvements would result in operational improvements. These modifications includedesignating Lincoln Avenue as one-way westbound between Post Road and Fully Relocated <strong>Airport</strong> Road.Vehicles destined to Fully Relocated <strong>Airport</strong> Road from Post Road would turn at this intersection, andvehicles traveling westbound on Fully Relocated <strong>Airport</strong> Road that are destined to Post Road wouldintersect with Post Road under the existing Route 37 ramp interchange.• Fully Relocated <strong>Airport</strong> Road at Commerce Drive – During the 2020 and 2025 evening peak hours, theoverall intersection operations would improve from LOS F under the No-Action Alternative to LOS Dunder Alternative B2. The improvements are primarily a result of geometric and signal upgrades at thisintersection associated with Fully Relocated <strong>Airport</strong> Road.• Existing <strong>Airport</strong> Road at Warwick Avenue – During the 2020 morning and evening peak hours, operationsat this location would improve from LOS E under the No-Action Alternative to LOS C under Alternative B2.Chapter 5 - Environmental Consequences 5-129 July 2011\\mawatr\ev\09228.00\reports\<strong>FEIS</strong>_Final_July_2011\<strong>PVD</strong>_CH05_Environmental_Cons_JUL_2011.doc
T.F. <strong>Green</strong> <strong>Airport</strong> <strong>Improvement</strong> <strong>Program</strong>Environmental Impact Statement and Final Section 4(f) EvaluationIn 2025, the intersection would operate at LOS E during the morning peak hours and LOS F during eveningpeak hours under the No-Action Alternative, and would improve to LOS C during both periods under theAlternative B2. These improvements are a result of geometric and signal timing and phasing improvementsthat would be completed (as part of Fully Relocated <strong>Airport</strong> Road construction) to add capacity, reducedelays and vehicle queuing, and to assist turning maneuvers. 361• Main Avenue at Groveland Avenue – The 2025 morning peak hour operations would improve from LOS Bunder the No-Action Alternative to LOS A under Alternative B2. During the evening peak hour, operationswould improve from LOS C under the No-Action Alternative to LOS B under Alternative B2 in 2020 andfrom LOS D under the No-Action Alternative to LOS B under Alternative B2 in 2025. The improvementswould result primarily from minor traffic signal timing changes.• Main Avenue at Industrial Drive – The 2020 evening peak hour operations would improve from LOS Dunder the No-Action Alternative to LOS B under Alternative B2. In 2025, the No-Action Alternative isexpected to result in LOS E operation of this intersection during the evening peak hour. Alternative B2would improve intersection operations to LOS C. The improvement would result primarily from minortraffic signal timing changes.• Main Avenue at Jefferson Boulevard – The 2020 morning peak hour operations would improve from LOS Dunder the No-Action Alternative to LOS C under Alternative B2. The 2020 evening peak hour operationswould improve from LOS E under the No-Action Alternative to LOS D under Alternative B2. Theimprovement would result primarily from minor traffic signal timing. However in the 2025 morning andevening peak hours, this intersection is projected to continue to operate at LOS E under Alternative B2, asdiscussed in more detail in the next section.• Jefferson Boulevard at Coronado Road and Kilvert Street – In 2025, evening peak hour operations wouldimprove from LOS E under the No-Action Alternative to LOS D under Alternative B2. The improvement wouldresult primarily from minor traffic signal timing changes.In addition to improving operations at these seven locations, the termination of the existing <strong>Airport</strong> Road westof Harmony Court could allow for the removal of the traffic signal at the intersection of <strong>Airport</strong> Road and HadeCourt and Etta Street. Due to the decreased traffic volume on <strong>Airport</strong> Road (where the road is effectively adead-end to general traffic), this location would no longer meet the warrants for traffic signal operation.However, as part of the full design of this intersection, a formal approval process for removing a traffic signalwould have to be completed by RIAC and approved by RIDOT.One location with LOS E or LOS F capacity constraints under the No-Action Alternative would continue tooperate at LOS E or LOS F levels under Alternative B2:361 From 2002 to 2004, a total of 89 crashes occurred at this intersection, which is the second highest crash frequency of all the Study Area intersections (referto Table I.2-6 of Chapter I.2, Affected Environment, for the crash data from RIDOT records). This frequency likely results from long queues and the difficultyof making left turns at this intersection under existing conditions.Chapter 5 - Environmental Consequences 5-130 July 2011\\mawatr\ev\09228.00\reports\<strong>FEIS</strong>_Final_July_2011\<strong>PVD</strong>_CH05_Environmental_Cons_JUL_2011.doc
T.F. <strong>Green</strong> <strong>Airport</strong> <strong>Improvement</strong> <strong>Program</strong>Environmental Impact Statement and Final Section 4(f) Evaluation• Main Avenue at Jefferson Boulevard – This intersection is projected to operate at LOS E during the morningand evening peak hours under the No-Action Alternative in 2025. Under Alternative B2, this intersection isprojected to continue to operate at LOS E during the morning and evening peak hours in 2025. This isprimarily the result of heavy volumes on all approaches where the signal is operating at or near capacity.Alternative B2 would result in LOS E or LOS F conditions at two locations:• Post Road (U.S. Route 1) at Relocated Delivery Drive –Relocating Delivery Drive would create a newunsignalized driveway along Post Road. The only vehicles using Delivery Drive would be <strong>Airport</strong> deliveryvehicles (approximately 40 vehicles per hour during the morning and evening peak hours in both 2020 and2025). General traffic would be prohibited from entering or exiting the <strong>Airport</strong> at this location. Becausetraffic volumes on Delivery Drive are low, a traffic signal is not warranted or recommended at thisintersection. Without a signal, vehicles exiting Delivery Drive would operate at LOS F during the eveningpeak hour in 2020 and 2025. However, the LOS F only applies to the 40 vehicles exiting Delivery Drive, notto the vehicles on Post Road (an average of one vehicle every minute and a half). General traffic on PostRoad would not be affected. 362• Post Road (U.S. Route 1) at Donald Avenue – Under Alternative B2, the ramp at Aviation Avenue (oppositeDonald Avenue) would be closed and the existing traffic signal removed. The existing signal is needed inorder to facilitate the flow of <strong>Airport</strong>-bound traffic from the <strong>Airport</strong> Connector turning right on Post Road,then left on Aviation Avenue. Once Aviation Avenue is closed, the traffic signal would no longer bewarranted under Alternative B2. Removing the traffic signal would likely improve traffic flow along PostRoad. However, vehicles exiting Donald Avenue would operate at LOS E during the morning peak hour andLOS F during the evening peak hours in 2020. Vehicles exiting Donald Avenue would operate at LOS F duringthe morning and evening peak hours in 2025. Donald Avenue is not a through street, but rather a driveway toseveral commercial properties on Post Road, including a restaurant and a health and fitness center. The LOS Eor LOS F applies only to vehicles exiting Donald Avenue turning left to Post Road northbound. There is noway to improve the projected LOS at this driveway without keeping the existing traffic signal, which wouldnot be warranted under Alternative B2. This driveway is expected to operate like other unsignalizeddriveways along Post Road. Before the traffic signal could be removed, a formal approval process forremoving the signal would have to be completed by RIAC and approved by RIDOT as part of the full designprocess for this location. Should RIDOT choose to retain the traffic signal, traffic operations for vehicles exitingthe driveway would improve and delays along Post Road would continue as they are today.Effects on Freeway Segment and Ramp – 2020/2025The results show that there would be no freeway segment, ramp merge and diverge area, or freeway weavesegment capacity constraints on the <strong>Airport</strong> Connector or Route 37 and that there would be no locations thatwould degrade to LOS E or LOS F as a result of Alternative B2.362 Of the 40 vehicles, approximately 5 vehicles are expected to turn left and the remaining 35 vehicles are expected to turn right, based on observed trafficmovements. The 40 vehicles per hour average to one vehicle every minute and a half.Chapter 5 - Environmental Consequences 5-131 July 2011\\mawatr\ev\09228.00\reports\<strong>FEIS</strong>_Final_July_2011\<strong>PVD</strong>_CH05_Environmental_Cons_JUL_2011.doc
T.F. <strong>Green</strong> <strong>Airport</strong> <strong>Improvement</strong> <strong>Program</strong>Environmental Impact Statement and Final Section 4(f) EvaluationSignificant Impacts: Based on the traffic analysis, under Alternative B2, there would be no substantial reductionin the LOS of roads serving the <strong>Airport</strong> and its surrounding communities. Alternative B2 would improve trafficcirculation surrounding the <strong>Airport</strong>, specifically with the Fully Relocated <strong>Airport</strong> Road and the <strong>Airport</strong> gatewayimprovements on Post Road.Parking Impacts – 2020/2025In addition to the No-Action Alternative and 2015 Alternative B2 parking impacts, by 2020 Alternative B2would increase the parking supply on-<strong>Airport</strong> by constructing a new 2,000-space long-term commercial parkingGarage G on part of the existing long-term parking lot adjacent to Strawberry Field Road. The three-storygarage would result in a net increase of approximately 1,300 long-term commercial parking spaces, as700 spaces from the existing Long-Term Parking Lot would be lost to this construction. Employee parkingwould be consolidated in Long-Term Parking E.Public Transportation Impacts – 2020/2025Alternative B2 would result in minor changes to some of the RIPTA bus routes in the Study Area. The routesthat serve the <strong>Airport</strong> directly (Routes 14, 20, and 66) would see minor changes in circulation patterns on the<strong>Airport</strong>. The routes that currently use Post Road to access the <strong>Airport</strong> (Routes 14 and 20) would use the newPost Road “Gateway Entrance” instead. Routes 1 and 20, which operate on Post Road north of the <strong>Airport</strong>,could see minor changes such as relocated bus stop locations along that section of Post Road. Route 3, whichoperates on Warwick Avenue, could see similar changes. Other RIPTA routes that operate in the area(Routes 8 and 29) would be unaffected by Alternative B2.The RIDOT Park-and-Ride lot on the north side of <strong>Airport</strong> Road at Evergreen Avenue would be relocated aspart of Alternative B2.Pedestrian and Bicycle Transportation Impacts – 2020/2025None of the designated Statewide Bicycle Routes or Neighborhood Bicycle Routes in the Study Area would beaffected by Alternative B2. Roadway widening along Warwick Avenue and the increased traffic could impactthe designation of the roadway segment as a “Suitable Road” for bicycle travel by RIDOT. Squantum Drive isclassified as a “Most Suitable Road” for cycling. This designation could be altered due to the proposedalignment of Squantum Drive with Fully Relocated <strong>Airport</strong> Road. The Fully Relocated <strong>Airport</strong> Road wouldmake appropriate accommodations for pedestrians and cyclists.Neighborhood Circulation Impacts – 2020/2025The roadway infrastructure modifications under Alternative B2 would alter traffic circulation through roadclosures, discontinuances, and new connections. While plans are at the conceptual level, portions of severalresidential public streets are likely to have modified access and circulation resulting from the relocation of<strong>Airport</strong> Road, including:• Wyoming Avenue• Minnesota Avenue• Alabama AvenueChapter 5 - Environmental Consequences 5-132 July 2011\\mawatr\ev\09228.00\reports\<strong>FEIS</strong>_Final_July_2011\<strong>PVD</strong>_CH05_Environmental_Cons_JUL_2011.doc
T.F. <strong>Green</strong> <strong>Airport</strong> <strong>Improvement</strong> <strong>Program</strong>Environmental Impact Statement and Final Section 4(f) Evaluation• Lincoln Avenue• Harvest Road• Sand Pond Road• Easton Avenue• Potomac Road• Lydick Avenue at Apollo Street• Tennessee AvenueOther predominantly non-residential public streets that would likely be altered under Alternative B2 include:• Commerce Drive• <strong>Airport</strong> Road• Post Road (intersection modifications only)• Warwick Avenue (intersection modifications only)• Hasbrouck Avenue• Roseland Avenue• Delivery Drive• Senator Street• Dewey Ave• Hallene RoadFinal roadway alignments, road closures, discontinuances, and new connections would be determined by RIACand RIDOT, and notification to the public and affected parties would follow RIDOT protocol.5.6.4.3 Alternative B4This section presents the results of the surface transportation analysis for Alternative B4 in 2015, 2020, and 2025.An assessment of the relocation of the Winslow Park ball fields is provided in Appendix J, Section 4(f) andSection 6(f) Resources.Vehicular Traffic Impacts – 2015Alternative B4 would generate additional passenger demands and thus additional vehicle trips in 2015 due tothe expedited construction schedule for the extension of Runway 5-23, which would require realigningMain Avenue to the south between Palace Avenue and Brentwood Avenue. Main Avenue would be designed toinclude 11-foot travel lanes with one-foot shoulders. The design will incorporate bicycle and pedestrianaccommodation into roadway projects where practicable. There are no new signals proposed along RealignedMain Avenue (the intersection of Realigned Main Avenue and Groveland Avenue would remain signalized)and the current functional classification would remain the same. While the design speed of Realigned MainAvenue would be reduced by five miles per hour to 40 miles per hour, the posted speed limit would remain at35 miles per hour. The realignment of Main Avenue would not impact its designation as a hurricane evacuationroute by the State of Rhode Island Emergency Management Agency.Chapter 5 - Environmental Consequences 5-133 July 2011\\mawatr\ev\09228.00\reports\<strong>FEIS</strong>_Final_July_2011\<strong>PVD</strong>_CH05_Environmental_Cons_JUL_2011.doc
T.F. <strong>Green</strong> <strong>Airport</strong> <strong>Improvement</strong> <strong>Program</strong>Environmental Impact Statement and Final Section 4(f) EvaluationThere is no full relocation of <strong>Airport</strong> Road and no direct connection to Route 37 under Alternative B4; however,a portion of <strong>Airport</strong> Road would be partially relocated from Post Road to east of Evergreen Avenue (near theintersection of Post Road and <strong>Airport</strong> Road) to accommodate runway safety area enhancements toRunway 16-34. Specifically:• Partially Relocated <strong>Airport</strong> Road would intersect with Post Road (U.S. Route 1) at existing HasbrouckAvenue. The relocated intersection would be located approximately 250 feet to the south of the existingsignalized intersection of Post Road and the Ann & Hope driveway. Under Alternative B4, the driveway tothe Ann & Hope parcel would be realigned so that it approached Post Road directly opposite PartiallyRelocated <strong>Airport</strong> Road, forming a four-way intersection. The Partially Relocated <strong>Airport</strong> Road roadwaysection will be evaluated in final design.• Dewey Avenue, Hallene Road, and Evergreen Avenue would maintain access with Partially Relocated<strong>Airport</strong> Road.• To accommodate Partially Relocated <strong>Airport</strong> Road, Post Road would be improved from Tennessee Avenuesouth to the vicinity of Haverford Road. The Post Road roadway section will be evaluated in final design.• Delivery Drive would be relocated. Instead of intersecting with Partially Relocated <strong>Airport</strong> Road, DeliveryDrive would intersect with Post Road, at the current Atwood Grill location. This new driveway along PostRoad would be unsignalized.• The Partially Relocated <strong>Airport</strong> Road and Realigned Main Avenue designs would include appropriateaccommodations for pedestrians and cyclists.Effects on Daily Traffic - 2015Traffic volumes under Alternative B4 in 2015 were compared to those under the No-Action Alternative in 2015.Under Alternative B4, new traffic in the Study Area would be <strong>Airport</strong>-generated resulting from the extension ofRunway 5-23. Unlike Alternative B2, the extension of Runway 5-23 would occur in 2015, not in 2020.In 2025, Alternative B4 would result in increased traffic on all roadway segments studied, when compared to theNo-Action Alternative. The increases range from 0.2 percent to 2.9 percent in 2015.Effects on VMT and VHT - 2015Alternative B4 would result in minor increases in VMT and VHT in 2015 when compared to the No-ActionAlternative, with VMT projected to increase by 0.4 percent and VHT projected to increase by 0.5 percent in 2015.This increase is attributable to traffic related to the runway extension being complete prior to any of the otherproposed efficiency changes (which would be completed between 2015 and 2020). The VMT and VHT resultsare in contrast to Alternative B2, which is projected to decrease VMT and have no impact to VHT in the StudyArea in 2015.Chapter 5 - Environmental Consequences 5-134 July 2011\\mawatr\ev\09228.00\reports\<strong>FEIS</strong>_Final_July_2011\<strong>PVD</strong>_CH05_Environmental_Cons_JUL_2011.doc
T.F. <strong>Green</strong> <strong>Airport</strong> <strong>Improvement</strong> <strong>Program</strong>Environmental Impact Statement and Final Section 4(f) EvaluationEffects on Peak Hour Traffic Flow (Level of Service) - 2015Morning and evening peak hour traffic flow at one intersection would improve under Alternative B4 whencompared with the No-Action Alternative:• Post Road (U.S. Route 1) at Partially Relocated <strong>Airport</strong> Road and Ann & Hope driveway – In 2015, morningpeak hour operations would improve from LOS D under the No-Action Alternative to LOS C underAlternative B4. The relocated intersection would be designed to accommodate all movements at theintersection, including vehicles entering and exiting the relocated Ann & Hope driveway.Four locations with LOS E or LOS F capacity constraints under the No-Action Alternative would continue tooperate at LOS E or LOS F levels under Alternative B4:• Post Road (U.S. Route 1) at Lincoln Avenue – During the evening peak hour, this intersection would operateat LOS F under the No-Action Alternative and under Alternative B4.• <strong>Airport</strong> Road at Evergreen Avenue – During the evening peak hour, this intersection would operate atLOS F under the No-Action Alternative and under Alternative B4.• <strong>Airport</strong> Road at Commerce Drive – During the evening peak hour, this intersection would operate at LOS Funder the No-Action Alternative and under Alternative B4.• <strong>Airport</strong> Road at Warwick Avenue – During the morning and evening peak hours, this intersection wouldoperate at LOS E under the No-Action Alternative and under Alternative B4.Alternative B4 would result in LOS E or LOS F conditions at one location:• Post Road (U.S. Route 1) at Relocated Delivery Drive – Relocating Delivery Drive would create a newunsignalized driveway along Post Road. The only vehicles using Delivery Drive would be <strong>Airport</strong> deliveryvehicles (approximately 35 vehicles per hour during the morning and evening peak hours). General trafficwould be prohibited from entering or exiting the <strong>Airport</strong> at this location. The intersection of Post Road andRelocated Delivery Drive would operate at LOS F during the evening peak hour in 2015. However, theLOS F only applies to the 35 vehicles exiting Delivery Drive (an average of one vehicle every two minutes).General traffic on Post Road would not be affected. 363Effects on Freeway Segments and Ramps - 2015The results show that there would be no freeway segment or ramp merge and diverge area capacity constraintson the <strong>Airport</strong> Connector or Route 37 and that there would be no locations that would degrade to LOS E or LOSF as a result of Alternative B4 in 2015.Parking Impacts - 2015In 2015, Alternative B4 would not impact the parking supply on the <strong>Airport</strong>. Alternative B4 would requireacquisition of property privately owned by <strong>Airport</strong> Valet (at 717 <strong>Airport</strong> Road) that is currently used for valetparking and holds approximately 180 vehicles. This property would have to be acquired to construct the363 Of the 35 vehicles, approximately 5 vehicles are expected to turn left and the remaining 30 vehicles are expected to turn right, based on observed trafficmovements. The 35 vehicles per hour average to about one vehicle every two minutes.Chapter 5 - Environmental Consequences 5-135 July 2011\\mawatr\ev\09228.00\reports\<strong>FEIS</strong>_Final_July_2011\<strong>PVD</strong>_CH05_Environmental_Cons_JUL_2011.doc
T.F. <strong>Green</strong> <strong>Airport</strong> <strong>Improvement</strong> <strong>Program</strong>Environmental Impact Statement and Final Section 4(f) EvaluationRunway 16 End RSA. Alternative B4 would also impact the facilities and operations in the rental carmaintenance area, but to a lesser extent than Alternative B2. Under Alternative B4, the proposed alignment ofPartially Relocated <strong>Airport</strong> Road would only impact the southern portion of the rental car property. Rental carcompanies would continue to do maintenance at their existing locations, and the buildings and parking areas atthe rental car site would need some reconfiguring under Alternative B4.Public Transportation Impacts - 2015In 2015, Alternative B4 could result in minor changes to two RIPTA bus routes: Routes 1 and 20. These routesoperate on Post Road north of the <strong>Airport</strong> and could see minor changes such as relocated bus stop locationsalong that section of Post Road. Route 8, which operates on Main Avenue, could see similar changes as a resultof the realignment of that road. Other RIPTA routes that serve the <strong>Airport</strong> (Routes 14 and 66) would beunaffected by Alternative B4 in 2015, as would other RIPTA routes that operate in the area (Routes 3 and 29).The RIDOT Park-and-Ride lot on the north side of <strong>Airport</strong> Road at Evergreen Avenue would be relocated aspart of Alternative B4.Pedestrian and Bicycle Transportation Impacts - 2015None of the designated Statewide Bicycle Routes or Neighborhood Bicycle Routes in the Study Area would beaffected by Alternative B4 in 2015. None of the roadways classified by RIDOT as “Suitable Roads” or “MostSuitable Roads” for bicycle travel would be altered. 364 The Partially Relocated <strong>Airport</strong> Road and Realigned MainAvenue designs would include appropriate accommodations for pedestrians and cyclists.Neighborhood Circulation Impacts - 2015The roadway infrastructure modifications under Alternative B4 would alter traffic circulation through roadclosures, discontinuances, and new connections. While plans are at the conceptual level, in order toaccommodate Partially Relocated <strong>Airport</strong> Road portions of the following public streets are likely to havemodified access and circulation:• <strong>Airport</strong> Road• Hasbrouck Avenue• Delivery Drive• Dewey Avenue• Hallene Road• Evergreen AvenueWith the exception of Delivery Drive, access to these six roadways would be provided via Partially Relocated<strong>Airport</strong> Road. Delivery Drive access would be provided via Post Road at the current location of theAtwood Grill (just to the north of Vanderbilt Road).364 A Guide to Cycling in the Ocean State, 2005 to 2006; prepared by Rhode Island Department of Transportation.Chapter 5 - Environmental Consequences 5-136 July 2011\\mawatr\ev\09228.00\reports\<strong>FEIS</strong>_Final_July_2011\<strong>PVD</strong>_CH05_Environmental_Cons_JUL_2011.doc
T.F. <strong>Green</strong> <strong>Airport</strong> <strong>Improvement</strong> <strong>Program</strong>Environmental Impact Statement and Final Section 4(f) EvaluationWhile plans are at the conceptual level, in order to accommodate Realigned Main Avenue, portions of thefollowing public streets are likely to have modified access and circulation:• Main Avenue at Route 113 (alignment shift only)• Gertrude Avenue• Bedford Avenue• Taft Avenue• Groveland Avenue• Walnut Glen Drive• Gladys CourtAll roadways that currently have access to Main Avenue would still have access after the roadway is realigned.There are no proposed changes to traffic control (stop signs or traffic signals) at any location along MainAvenue, although some traffic signals may be modified to be more efficient if necessary. When consideringroadways that may be modified, final roadway alignments, road closures, discontinuances, and newconnections would be determined by RIAC and RIDOT, and notification to the public and affected partieswould follow RIDOT protocol.Traffic Impacts – 2020/2025Additional passenger demand would be generated under Alternative B4 in 2020 because of additionalenplanements due to forecasted changes in <strong>Airport</strong> activity (enplanements, deplanements, and employment)and not due to any infrastructure improvements or projects. The number of enplanements in 2020 and 2025 isthe same under Alternatives B2 and B4. Realigned Main Avenue and Partially Relocated <strong>Airport</strong> Road would beconstructed by 2015 (described previously) and would remain in the same location with no additional physicalimprovement in 2020 and 2025.Additional changes that would take place by 2020 include an improved Terminal Area Roadway, which wouldconsist of a new Post Road “Gateway Entrance” to the <strong>Airport</strong>, South Access Road, a South Circulation Road, aService Area Road, and alterations to the Lower and Upper Level Terminal Roadways. The existing <strong>Airport</strong>access to Post Road south of the <strong>Airport</strong> Connector would be closed. These on-<strong>Airport</strong> roadway improvementsare identical to those proposed for Alternative B2.Effects on Daily Traffic – 2020/2025Under Alternative B4 in 2020 and 2025, new traffic in the Study Area would be <strong>Airport</strong>-generated trafficresulting from the extension of Runway 5-23. Alternative B4 would result in increased traffic on all roadwaysegments studied when compared to the No-Action Alternative. The increases range from 8.1 percent to10.8 percent in 2020 and from 7.5 percent to 10.8 percent in 2025.Effects on VMT and VHT – 2020/2025Alternative B4 would result in minor decreases in VMT and VHT in both 2020 and 2025 compared to theNo-Action Alternative. Under Alternative B4, VMT would decrease by 0.5 percent in both 2020 and 2025. VHTwould decrease by 0.4 percent in 2020 and by 0.8 percent in 2025.Chapter 5 - Environmental Consequences 5-137 July 2011\\mawatr\ev\09228.00\reports\<strong>FEIS</strong>_Final_July_2011\<strong>PVD</strong>_CH05_Environmental_Cons_JUL_2011.doc
T.F. <strong>Green</strong> <strong>Airport</strong> <strong>Improvement</strong> <strong>Program</strong>Environmental Impact Statement and Final Section 4(f) EvaluationEffects on Peak Hour Traffic Flow (Level of Service) – 2020/2025This section documents the effects of Alternative B4 on morning and evening peak hour traffic flow.Nine locations would improve under Alternative B4 when compared with the No-Action Alternative:• Post Road (U.S. Route 1) at Lincoln Avenue – During the morning peak hour in 2020 and 2025, overallintersection operations would improve from LOS C under the No-Action Alternative to LOS B underAlternative B4 as a result of minor signal timing and phasing adjustments.• Post Road (U.S. Route 1) at Partially Relocated <strong>Airport</strong> Road and Ann & Hope driveway – In both 2020 and2025, morning peak hour operations would improve from LOS D under the No-Action Alternative to LOS Cunder Alternative B4. The relocated intersection would be designed to accommodate all movements at theintersection, including the relocated Ann & Hope driveway.• <strong>Airport</strong> Road at Commerce Drive – In 2025, morning peak hour operations would improve from LOS Dunder the No-Action Alternative to LOS C under Alternative B4 as a result of minor signal timing andphasing adjustments.• <strong>Airport</strong> Road at Warwick Avenue – During the morning peak hour in 2020, operations at this locationwould improve from LOS E under the No-Action Alternative to LOS D under Alternative B4 as a result ofminor signal timing and phasing adjustment• Post Road (U.S. Route 1) at Coronado Road – In 2020, evening peak hour operations would improve fromLOS D under the No-Action Alternative to LOS C under Alternative B4. The improvements would resultprimarily from a shift in westbound traffic volume exiting the <strong>Airport</strong> to the newly created intersection ofPost Road at the new Post Road Gateway to the south.• Main Avenue at Groveland Avenue – In 2025, morning peak hour operations would improve from LOS Bunder the No-Action Alternative to LOS A under Alternative B4. In 2020, evening peak hour operationswould improve from LOS C under the No-Action Alternative to LOS B. In 2025, evening peak houroperations would improve from LOS D to LOS B. The improvements would result primarily from minortraffic signal timing changes.• Main Avenue at Industrial Drive – In 2020, evening peak hour operations at this relocated intersectionwould improve from LOS D under the No-Action Alternative to LOS B under Alternative B4. In 2025,evening peak hour operations would improve from LOS E to LOS B. The improvements would resultprimarily from minor traffic signal timing changes.• Main Avenue at Jefferson Boulevard – During the evening peak hour in 2020, overall intersection operationswould improve from LOS E under the No-Action Alternative to LOS D under Alternative B4 as a result ofminor signal timing and phasing adjustments.• Jefferson Boulevard at Coronado Road and Kilvert Street – In 2020, evening peak hour operations at thisrelocated intersection would improve from LOS D under the No-Action Alternative to LOS C underAlternative B4. In 2025, evening peak hour operations would improve from LOS E to LOS D. Theimprovements would result primarily from minor traffic signal timing changes.Chapter 5 - Environmental Consequences 5-138 July 2011\\mawatr\ev\09228.00\reports\<strong>FEIS</strong>_Final_July_2011\<strong>PVD</strong>_CH05_Environmental_Cons_JUL_2011.doc
T.F. <strong>Green</strong> <strong>Airport</strong> <strong>Improvement</strong> <strong>Program</strong>Environmental Impact Statement and Final Section 4(f) EvaluationSix locations with LOS E or LOS F capacity constraints under the No-Action Alternative would continue tooperate at LOS E or LOS F levels under Alternative B4:• Post Road (U.S. Route 1) at Lincoln Avenue – During the evening peak hour in both 2020 and 2025, thisintersection would operate at LOS F under the No-Action Alternative and under Alternative B4.• Post Road (U.S. Route 1) at Partially Relocated <strong>Airport</strong> Road and Ann & Hope driveway – During theevening peak hour in 2025, this intersection would operate at LOS E under the No-Action Alternative.Under Alternative B4, the relocated intersection would continue to operate at LOS E.• <strong>Airport</strong> Road at Evergreen Avenue – During the evening peak hour in 2020 and 2025, this intersectionwould operate at LOS F under the No-Action Alternative and under Alternative B4.• <strong>Airport</strong> Road at Commerce Drive – During the evening peak hour in both 2020 and 2025, this intersectionwould operate at LOS F under the No-Action Alternative and under Alternative B4.• <strong>Airport</strong> Road at Warwick Avenue – During the evening peak hour in 2020, this intersection would operateat LOS E under the No-Action Alternative and under Alternative B4. In 2025, this intersection wouldoperate at LOS E during the morning peak hour under the No-Action Alternative and under Alternative B4.In 2025, this intersection would operate at LOS F during the evening peak hour under the No-ActionAlternative and at LOS E under Alternative B4.• Main Avenue at Jefferson Boulevard – In 2025, this intersection is projected to operate at LOS E during themorning and evening peak hours under the No-Action Alternative and under Alternative B4. This isprimarily the result of heavy volumes on all approaches where the signal is operating at or near capacity.Alternative B4 would result in LOS E or LOS F conditions at two locations:• Post Road (U.S. Route 1) at Relocated Delivery Drive – Relocating Delivery Drive would create a newunsignalized driveway along Post Road. The only vehicles using Delivery Drive would be <strong>Airport</strong> deliveryvehicles (approximately 40 vehicles per hour during the morning and evening peak hours in both 2020 and2025). General traffic would be prohibited from entering or exiting the <strong>Airport</strong> at this location. Becausetraffic volumes on Delivery Drive are low, a traffic signal is not warranted or recommended at thisintersection. Without a signal, vehicles exiting Delivery Drive would operate at LOS D in the morning peakhour and at LOS F in the evening peak hour in 2020 and 2025. However, the LOS F only applies to the40 vehicles exiting Delivery Drive, not to the vehicles on Post Road (an average of one vehicle every minuteand a half). General traffic on Post Road would not be affected. 365• Post Road (U.S. Route 1) at Donald Avenue – Under Alternative B4, the ramp at Aviation Avenue (oppositeDonald Avenue) would be closed and the existing traffic signal removed. The signal is needed underexisting conditions in order to facilitate the flow of <strong>Airport</strong>-bound traffic from the <strong>Airport</strong> Connectorturning right on Post Road, then left on Aviation Avenue. Once Aviation Avenue is closed, the traffic signalwould no longer be warranted under Alternative B4. Removing the traffic signal would likely improve365 Of the 40 vehicles, approximately five vehicles are expected to turn left and the remaining 35 vehicles are expected to turn right, based on observed trafficmovements. The 40 vehicles per hour average to one vehicle every minute and a half.Chapter 5 - Environmental Consequences 5-139 July 2011\\mawatr\ev\09228.00\reports\<strong>FEIS</strong>_Final_July_2011\<strong>PVD</strong>_CH05_Environmental_Cons_JUL_2011.doc
T.F. <strong>Green</strong> <strong>Airport</strong> <strong>Improvement</strong> <strong>Program</strong>Environmental Impact Statement and Final Section 4(f) Evaluationtraffic flow along Post Road. However, vehicles exiting Donald Avenue would operate at LOS F during themorning and evening peak hours in 2020 and 2025. Donald Avenue is not a through street, but a drivewayto several commercial properties on Post Road, including a restaurant and a health and fitness center. TheLOS F applies only to vehicles exiting Donald Avenue turning left to Post Road northbound. This drivewayis expected to operate like other unsignalized driveways along Post Road. Before the traffic signal could beremoved, a formal approval process for removing the signal would have to be completed by RIAC andapproved by RIDOT as part of the full design process for this location.Effects on Freeway Segments and Ramps – 2020/2025The results show that there would be no freeway segment or ramp merge and diverge area capacity constraintson the <strong>Airport</strong> Connector or Route 37 and that there would be no locations that would degrade to LOS E or LOSF as a result of Alternative B4.Significant Impacts: Based on the surface transportation impact analysis, under Alternative B4, there would beno substantial reduction in the LOS of roads serving the <strong>Airport</strong> and its surrounding communities. AlternativeB4 would improve traffic circulation surrounding the <strong>Airport</strong>, specifically with the proposed improvements to<strong>Airport</strong> Road and Main Avenue, and the <strong>Airport</strong> gateway improvements on Post Road.Parking Impacts – 2020/2025Alternative B4 would have the same effects on parking as Alternative B2. In addition to the No-Action Alternativeand 2015 Alternative B4 parking impacts, by 2020 Alternative B4 would increase the parking supply on-<strong>Airport</strong> byconstructing a new 2,000-space long-term commercial parking Garage G on part of the existing long-term parking lotadjacent to Strawberry Field Road. The three-story garage would result in a net increase of approximately1,300 long-term commercial parking spaces, as 700 spaces from the existing Long-Term Parking Lot would be lost tothis construction. Employee parking would be consolidated in Long-Term Parking E.Public Transportation Impacts – 2020/2025Alternative B4 would result in minor changes to some of the RIPTA bus routes in the Study Area. The routesthat serve the <strong>Airport</strong> directly (Routes 14, 20, and 66) would see minor changes in circulation patterns on the<strong>Airport</strong>. The routes that currently use Post Road to access the <strong>Airport</strong> (Routes 14 and 20) would use the newPost Road “Gateway Entrance” instead. Routes 1 and 20, which operate on Post Road north of the <strong>Airport</strong>,could see minor changes such as relocated bus stop locations along that section of Post Road. Route 8, whichoperates on Main Avenue, could see similar changes as a result of the realignment of that road in 2015. OtherRIPTA routes that operate in the area (Routes 3 and 29) would be unaffected by Alternative B4.The RIDOT Park-and-Ride lot on the north side of <strong>Airport</strong> Road at Evergreen Avenue would be relocated as part ofAlternative B4. This relocation would take place by 2015 to accommodate upgrades to the Runway 16 End RSA.Pedestrian and Bicycle Transportation Impacts – 2020/2025None of the designated Statewide Bicycle Routes or Neighborhood Bicycle Routes in the Study Area would beaffected by Alternative B4.Chapter 5 - Environmental Consequences 5-140 July 2011\\mawatr\ev\09228.00\reports\<strong>FEIS</strong>_Final_July_2011\<strong>PVD</strong>_CH05_Environmental_Cons_JUL_2011.doc
T.F. <strong>Green</strong> <strong>Airport</strong> <strong>Improvement</strong> <strong>Program</strong>Environmental Impact Statement and Final Section 4(f) EvaluationNeighborhood Circulation Impacts – 2020/2025The roadway infrastructure modifications under Alternative B4 would alter traffic circulation through roadclosures, discontinuances, and new connections. While plans are at the conceptual level, in order toaccommodate Partially Relocated <strong>Airport</strong> Road, portions of several public streets are likely to have modifiedaccess and circulation:• <strong>Airport</strong> Road• Hasbrouck Avenue• Delivery Drive• Dewey Avenue• Hallene Road• Evergreen AvenueWhile plans are at the conceptual level, in order to accommodate Realigned Main Avenue, portions of severalpublic streets are likely to have modified access and circulation:• Main Avenue at Route 113 (alignment shift)• Gertrude Avenue• Bedford Avenue• Taft Avenue• Groveland Avenue• Walnut Glen Drive• Gladys CourtThese roadway infrastructure modifications would take place by 2015 and would remain in the same location withno additional changes to <strong>Airport</strong> Road or Main Avenue in 2020 and 2025. There are no proposed changes to trafficcontrol (stop signs or traffic signals) at any location along Main Avenue, although some traffic signals may bemodified to be more efficient if necessary. When considering roadways that may be modified, final roadwayalignments, road closures, discontinuances, and new connections would be determined by RIAC and RIDOT, andnotification to the public and affected parties would follow RIDOT protocol.5.6.5 Short-Term Impacts from Temporary Construction ActivitiesThis section provides an assessment of temporary construction-related impacts to the off-<strong>Airport</strong> surfacetransportation network associated with Alternatives B2 and B4. A construction management plan would beimplemented, as discussed in Chapter 6, Mitigation, and discussed in detail for off-roadway improvements inAppendix H, Surface Transportation.5.6.5.1 No-Action AlternativeThere are no construction impacts anticipated with the No-Action Alternative.Chapter 5 - Environmental Consequences 5-141 July 2011\\mawatr\ev\09228.00\reports\<strong>FEIS</strong>_Final_July_2011\<strong>PVD</strong>_CH05_Environmental_Cons_JUL_2011.doc
T.F. <strong>Green</strong> <strong>Airport</strong> <strong>Improvement</strong> <strong>Program</strong>Environmental Impact Statement and Final Section 4(f) Evaluation5.6.5.2 Alternative B2Construction of Partially Relocated <strong>Airport</strong> Road by 2015 would take place mostly on property owned (throughmandatory property acquisition for construction) by the <strong>Airport</strong>, could be completed in its entirety withminimal disruption to traffic flow, and would require temporary lane closures along Post Road.Full build (2020) construction impacts include temporary roadway construction impacts that would affectportions of several study area roadways. Alternative B2 would require a complex construction phasing effortalong Route 37 and Fully Relocated <strong>Airport</strong> Road due to the Fully Relocated <strong>Airport</strong> Road segment betweenLincoln Avenue and Post Road, and the new intersection and associated ramp system of Route 37, FullyRelocated <strong>Airport</strong> Road, and Post Road.5.6.5.3 Alternative B4Construction of Partially Relocated <strong>Airport</strong> Road would be complete by the end of 2015 and would take placemostly on property owned (through mandatory property acquisition for construction) by the <strong>Airport</strong>. While thiswork would require temporary lane closures along Post Road, it would result in minimal disruption to traffic flow.Construction of Realigned Main Avenue by 2015 under Alternative B4 would take place mostly on <strong>Airport</strong>property, could be completed in its entirety with minimal disruption to traffic flow, and would requiretemporary lane closures along Main Avenue.5.6.6 Cumulative ImpactsThe transportation analysis is by nature cumulative because it takes into consideration background and currentconditions as well as future actions.5.6.7 Impacts to Surface Transportation: Comparison of the No-Action Alternative andAlternatives B2 and B4This section compares the changes in daily traffic demands on Study Area roadways for Alternatives B2 and B4when compared to the No-Action Alternative.5.6.7.1 Significant ImpactsBased on the surface transportation impact analysis, Alternatives B2 and B4 would not result in significantimpacts to surface transportation because there would be no substantial reduction in the LOS of roads servingthe <strong>Airport</strong> and its surrounding communities.5.6.7.2 Vehicle Traffic ImpactsThe following paragraphs compare the projected vehicle traffic impacts, including effects on daily traffic, VMTand VHT, and peak traffic flow (level of service) of Alternatives B2 and B4.Effects on Daily TrafficTable 5-70 summarizes the AADT for Alternatives B2 and B4 compared to the No-Action Alternative for allanalysis years.Chapter 5 - Environmental Consequences 5-142 July 2011\\mawatr\ev\09228.00\reports\<strong>FEIS</strong>_Final_July_2011\<strong>PVD</strong>_CH05_Environmental_Cons_JUL_2011.doc
T.F. <strong>Green</strong> <strong>Airport</strong> <strong>Improvement</strong> <strong>Program</strong>Environmental Impact Statement and Final Section 4(f) EvaluationUnder Alternative B2 in 2015, the only roadway segment that would experience a change in AADT would be PostRoad between Pell Avenue and Connecticut Avenue. The largest increases in traffic volume in 2020 and 2025would occur on Route 37 and Fully Relocated <strong>Airport</strong> Road under Alternative B2. This is a result of a regional shiftin traffic patterns that is made possible by the improved east-west connection Fully Relocated <strong>Airport</strong> Road wouldprovide. On three roadway segments, traffic is expected to decrease in both 2020 and 2025. One segment (PostRoad between <strong>Airport</strong> Connector and Coronado Road) would result in decreased traffic demand in 2020.Table 5-70Alternatives B2 and B4 Compared to the No-Action Alternative: 2015, 2020, and2025 AADT SummaryAverage Annual Daily Traffic2015 2020 2025B2 B4B2 B4B2No-Action Change Change No-Action Change Change No-Action ChangeLocation(vpd) (vpd) (vpd) (vpd) (vpd) (vpd) (vpd) (vpd)Route 37 between I-95 and Post Road56,7000 +100 57,500 +12,700 +4,900 58,500 +12,600Ai rport Road between Post Road and Commerce Dri ve 135,4000 +100 36,000 +5,000 +2,900 36,600 +4,700Post Road between Pell Avenue and Connecti cut Avenue 40,500 -1,400 +100 41,000 -13,600 +3,500 41,500 -14,100Post Road between Coronado Road and Haverford Road 33,5000 +900 34,100 +300 +3,700 34,400 +400Post Road between Ai rport Connector and Coronado Road 33,8000 +300 35,000 -100 +2,900 35,800 +400Jefferson Boulevard between Ai rport Connector and Coronado Road 13,2000 0 13,4000 +1,100 13,600 +400Ai rport Connector between Jefferson Boulevard and Post Road 38,0000 +1,100 40,300 -1,000 +3,400 42,300 -1,800Ai rport Connector between I-95 and Jefferson Boulevard 50,6000 +1,100 53,200 -1,100 +4,600 55,700 -2,000Main Avenue between Post Road and Industri al Drive29,8000 +100 30,200 +500 +2,600 30,700 +200Source: VHB, Inc. using the Rhode Island Statewide Travel Demand Model.Note: Bold cells denote a decrease in daily traffic.AADT Average Annual Daily Traffic, expressed in vehicles per day.vpd vehicles per day.1 For Alternative B2, <strong>Airport</strong> Road refers to Fully Relocated <strong>Airport</strong> Road, not Existing <strong>Airport</strong> Road. For Alternative B4, <strong>Airport</strong> Road refers to Partially Relocated<strong>Airport</strong> Road.B4Change(vpd)+4,700+2,700+3,300+3,700+2,800+1,100+3,300+4,500+2,500Alternative B4 would result in increased traffic on all roadway segments studied in 2015, 2020, and 2025, as compared tothe No-Action Alternative. The increases would result from additional <strong>Airport</strong>-related trips to and from the Study Area.Effects on VMT and VHTTable 5-71 summarizes how Alternatives B2 and B4 would affect VMT and VHT for the Study Area whencompared to the No-Action Alternative in 2015, 2020, and 2025. Alternative B2 would result in a minor decreasein VMT and no change in VHT in 2015 since none of the proposed safety changes increase traffic to the <strong>Airport</strong>.Under Alternative B4, both VMT and VHT would increase in 2015 because of the increase in vehicular tripsattributable to construction of the runway extension.In 2020 and 2025, both VMT and VHT would decrease for Alternatives B2 and B4 because the off-<strong>Airport</strong> roadwayalignment modifications would offset the increase in vehicular trips from <strong>Airport</strong>-related traffic. The off-<strong>Airport</strong>roadway modifications would result in shorter trip lengths over less congested roadways. The reductions in VMTand VHT are greater under Alternative B2, because this alternative would include more substantive roadwayimprovements than Alternative B4. The number of trips would be the same under Alternatives B2 and B4,although mobility is improved under Alternative B2 due to Fully Relocated <strong>Airport</strong> Road.Chapter 5 - Environmental Consequences 5-143 July 2011\\mawatr\ev\09228.00\reports\<strong>FEIS</strong>_Final_July_2011\<strong>PVD</strong>_CH05_Environmental_Cons_JUL_2011.doc
T.F. <strong>Green</strong> <strong>Airport</strong> <strong>Improvement</strong> <strong>Program</strong>Environmental Impact Statement and Final Section 4(f) EvaluationTable 5-71Alternatives B2 and B4 Compared to the No-Action Alternative: 2015, 2020, and2025 VMT/VHT Summary2015No-Action Alternative Alternative B2 Alternative B4VMT 1,147,700 1,147,200 1,152,300VHT 40,000 40,000 40,2002020No-Action Alternative Alternative B2 Alternative B4VMT 1,178,500 1,164,400 1,172,600VHT 42,400 41,400 42,2002025No-Action Alternative Alternative B2 Alternative B4VMT 1,239,700 1,224,800 1,233,500VHT 46,100 45,000 45,700Source: VHB, Inc. using the Rhode Island Statewide Travel Demand Model.Note: Shaded cells denote decreases when compared to the No-Action Alternative.VMT Vehicle miles traveled.VHT Vehicle hours traveled.Effects on Peak Hour Traffic Flow (Level of Service)Alternatives B2 and B4 would change peak hour traffic operations compared to the No-Action Alternative.Table 5-72 summarizes the effects of Alternatives B2 and B4 on peak hour traffic operations in 2015, 2020, and2025 and provides a comparison only for intersections that would see a change in overall LOS. UnderAlternatives B2 and B4, construction of new or modified intersections would meet all RIDOT requirements.In 2015, Alternative B2 would cause one location, the unsignalized driveway of Post Road at Relocated DeliveryDrive, to degrade to LOS E or LOS F.Traffic operations under Alternative B2 are expected to improve at six intersections in 2020 and six differentintersections in 2025 due in part to shifts in regional traffic from roadways throughout the City of Warwick toFully Relocated <strong>Airport</strong> Road. <strong>Improvement</strong>s are also attributed to the optimization of signal timing at anumber of intersections throughout the Study Area.In 2025, Alternative B2 would result in one intersection (Main Avenue at Jefferson Boulevard) continuing tooperate to LOS E or LOS F, compared to the No-Action Alternative. Also in 2020 and 2025, Alternative B2 wouldcause two unsignalized driveways along Post Road to degrade to LOS E or LOS F. The intersection of Post Roadat Relocated Delivery Drive does not exist under the No-Action Alternative but is projected to operate at LOS Eor LOS F under Alternative B2. The signalized intersection of Post Road at Donald Avenue is currentlyoperating at LOS D and is projected to degrade under the No-Action Alternative to LOS E or LOS F. UnderAlternative B2, the signal would be removed and the intersection would degrade to LOS E or LOS F.Chapter 5 - Environmental Consequences 5-144 July 2011\\mawatr\ev\09228.00\reports\<strong>FEIS</strong>_Final_July_2011\<strong>PVD</strong>_CH05_Environmental_Cons_JUL_2011.doc
T.F. <strong>Green</strong> <strong>Airport</strong> <strong>Improvement</strong> <strong>Program</strong>Environmental Impact Statement and Final Section 4(f) EvaluationTable 5-72 Alternatives B2 and B4 Compared to the No-Action Alternative: 2015, 2020, and 2025Changes to Peak Hour Traffic Operations (Level of Service)2015Intersection operations wouldimprove over No-ActionAlternativeIntersection would continue tooperate at LOS E/F levelsAlternative B2• None• NoneAlternative B4• Post Road at Partially Relocated <strong>Airport</strong> Road andAnn & Hope driveway• Post Road at Lincoln Avenue• <strong>Airport</strong> Road at Evergreen Avenue• <strong>Airport</strong> Road at Commerce Drive• <strong>Airport</strong> Road at Warwick Avenue 1Intersection would experienceLOS E/F conditions that do notoccur under the No-ActionAlternativeIntersection operations wouldimprove over No-ActionAlternativeIntersection would continue tooperate at LOS E/F levelsIntersection would experienceLOS E/F conditions that do notoccur under the No-ActionAlternative• Post Road at Relocated Delivery Drive 2 • Post Road at Relocated Delivery Drive 2Alternative B2• Post Road at Lincoln Avenue• Fully Relocated <strong>Airport</strong> Road at Commerce Drive• Existing <strong>Airport</strong> Road at Warwick Avenue 1• Main Avenue at Groveland Avenue• Main Avenue at Industrial Drive• Main Avenue at Jefferson Boulevard2020Alternative B4• Post Road at Lincoln Avenue• Post Road at Partially Relocated <strong>Airport</strong> Road andAnn & Hope driveway• <strong>Airport</strong> Road at Warwick Avenue 1• Post Road at Coronado Road• Main Avenue at Groveland Avenue• Main Avenue at Industrial Drive• Main Avenue at Jefferson Boulevard• Jefferson Boulevard at Coronado Road and Kilvert Street• Post Road at Lincoln Avenue• Post Road at Lincoln Avenue• <strong>Airport</strong> Road at Warwick Avenue 1 • <strong>Airport</strong> Road at Warwick Avenue 1• <strong>Airport</strong> Road at Evergreen Avenue• <strong>Airport</strong> Road at Evergreen Avenue• <strong>Airport</strong> Road at Commerce Drive• <strong>Airport</strong> Road at Commerce Drive• Post Road at Relocated Delivery Drive 2 • Post Road at Relocated Delivery Drive 2• Post Road at Donald Avenue 3 • Post Road at Donald Avenue 3Chapter 5 - Environmental Consequences 5-145 July 2011\\mawatr\ev\09228.00\reports\<strong>FEIS</strong>_Final_July_2011\<strong>PVD</strong>_CH05_Environmental_Cons_JUL_2011.doc
T.F. <strong>Green</strong> <strong>Airport</strong> <strong>Improvement</strong> <strong>Program</strong>Environmental Impact Statement and Final Section 4(f) EvaluationTable 5-72 Alternatives B2 and B4 Compared to the No-Action Alternative: 2015, 2020, and 2025 Changes to Peak Hour Traffic Operations (Level of Service) (continued) Intersection operations wouldimprove over No-ActionAlternativeIntersection would continue tooperate at LOS E/F levelsIntersection would experienceLOS E/F conditions that donot occur under the No-ActionAlternativeAlternative B2• Post Road at Lincoln Avenue• Fully Relocated Ai rport Road at Commerce Dri ve• Existing <strong>Airport</strong> Road at Warwi ck Avenue 1• Main Avenue at Groveland Avenue• Main Avenue at Industrial Drive• Jefferson Boulevard at Coronado Road and KilvertStreet• Main Avenue at Jefferson Boulevard• Post Road at Relocated Deli very Drive 2• Post Road at Donald Avenue 32025Alternative B4• Post Road at Lincoln Avenue• Post Road at Relocated Ai rport Road and Ann & Hopedriveway• Ai rport Road at Commerce Drive• Main Avenue at Groveland Avenue• Main Avenue at Industrial Drive• Jefferson Boulevard at Coronado Road andKilvert Street• Post Road at Lincoln Avenue• Ai rport Road at Evergreen Avenue• Post Road at Partially Relocated Ai rport Road andAnn & Hope dri veway• Ai rport Road at Commerce Drive• Ai rport Road at Warwi ck Avenue 1• Main Avenue at Jefferson Boulevard• Post Road at Relocated Delivery Dri ve 2• Post Road at Donald Avenue 3Source: VHB, Inc.1 Of the Study Area intersections, the second highest crash frequency occurred at this intersection (89 crashes from 2002 to 2004). 2 The analysis assumes that this relocated intersection would continue to operate as an unsignalized (stop control) intersection. 3 The analysis assumes that the existing traffic signal at this location would be removed. However, a formal approval process for removing the traffic signal at the intersection of Post Road and Donald Avenue would be completed by RIAC and approved by RIDOT as part of the full design process for this location.Traffic operations under Alternative B4 in 2015 are expected to improve at the intersection of Post Road atPartially Relocated <strong>Airport</strong> Road and Ann & Hope driveway. However, four intersections that are projected tooperate at LOS E or LOS F conditions under the No-Action Alternative would remain at capacity. Oneunsignalized driveway along Post Road, Relocated Delivery Drive, would degrade to LOS E or LOS F in 2015.Under Alternative B4, traffic operations are expected to improve at eight intersections in 2020 andsix intersections in 2025. <strong>Improvement</strong>s are attributed to the optimization of signal timing at a number ofintersections throughout the Study Area.Under Alternative B4, four intersections in 2020 and six intersections in 2025 that are projected to operate atLOS E or LOS F conditions under the No-Action Alternative would remain at capacity. Alternative B4 does notdegrade the LOS at these intersections, but it also does not realize the benefit of regional traffic shifts away fromthe local roadway system that Alternative B2 offers. These shifts cannot occur without a Fully Relocated <strong>Airport</strong>Road. Alternative B4 would cause two unsignalized driveways along Post Road to degrade to LOS E or LOS FChapter 5 - Environmental Consequences 5-146 July 2011\\mawatr\ev\09228.00\reports\<strong>FEIS</strong>_Final_July_2011\<strong>PVD</strong>_CH05_Environmental_Cons_JUL_2011.doc
T.F. <strong>Green</strong> <strong>Airport</strong> <strong>Improvement</strong> <strong>Program</strong>Environmental Impact Statement and Final Section 4(f) Evaluationin both 2020 and 2025. The intersection of Post Road at Relocated Delivery Drive did not exist under the No-Action Alternative but is projected to operate at LOS E or LOS F under Alternative B4. The signalizedintersection of Post Road at Donald Avenue is projected to degrade from LOS D or better under the No-ActionAlternative. Under Alternative B4, the signal would be removed and the intersection would degrade to LOS Eor LOS F.5.6.7.3 Parking ImpactsAlternatives B2 and B4 would equally increase the parking supply on the <strong>Airport</strong>. Both Alternatives B2 and B4would require acquiring property owned by <strong>Airport</strong> Valet (at 717 <strong>Airport</strong> Road) that is currently used for valetparking and holds approximately 180 vehicles. This property would have to be acquired by 2015 to constructthe Runway 16 End RSA. Both Alternatives B2 and B4 also include constructing a new 2,000-space long-termcommercial parking Garage G on part of the existing long-term parking lot, adjacent to Strawberry Field Roadby 2020. The three-story garage would result in a net increase of approximately 1,300 long-term commercialparking spaces, as 700 spaces from the existing Long-Term Parking Lot would be lost to this construction.Employee parking would be consolidated in long-term Parking E.5.6.7.4 Public Transportation ImpactsBoth Alternatives B2 and B4 would result in minor changes to some of the RIPTA bus routes in the Study Area.The routes that serve the <strong>Airport</strong> directly (Routes 14, 20, and 66) would see minor changes in circulationpatterns on the <strong>Airport</strong>. The routes that currently use Post Road to access the <strong>Airport</strong> (Routes 14 and 20) woulduse the new Post Road “Gateway Entrance.” Routes 1 and 20, which operate on Post Road north of the <strong>Airport</strong>,could also see minor changes, such as relocated bus stop locations along that section of Post Road. Route 3,which operates on Warwick Avenue, would only be affected by Alternative B2, while Route 8, which operateson Main Avenue, would only be affected by Alternative B4. In both cases, only the location of bus stops (not theroute of travel itself) would be affected. The RIDOT Park-and-Ride lot on the north side of <strong>Airport</strong> Road atEvergreen Avenue would also be relocated under Alternatives B2 and B4.5.6.7.5 Pedestrian and Bicycle Transportation ImpactsNone of the designated Statewide Bicycle Routes or Neighborhood Bicycle Routes in the Study Area would bedirectly impacted by Alternatives B2 and B4. Roadway widening along Warwick Avenue under Alternative B2,and the increased traffic demand could impact the designation of the roadway segment as a “Suitable Road” forbicycle travel by RIDOT. Squantum Drive is classified as a “Most Suitable Road” by RIDOT. This designationcould be altered due to the proposed alignment of Squantum Drive with Fully Relocated <strong>Airport</strong> Road underAlternative B2. Alternative B4 would not affect the designated Statewide Bicycle Routes or NeighborhoodBicycle Routes in the Study Area. Appropriate pedestrian and bicycle accommodations would be included inthe final design of Fully and Partially Relocated <strong>Airport</strong> Road, and Realigned Main Avenue.5.6.8 Avoidance and MinimizationOff-airport roadway improvements to the <strong>Airport</strong> Connector, Post Road, <strong>Airport</strong> Road, Warwick Avenue(under Alternative B2), and Main Avenue (under Alternative B4) have been proposed to ensure that the impactsof additional traffic demands are avoided or minimized. These roadway improvements would incorporatesidewalks, shoulders, and bus stops where practicable so that pedestrians, bicyclists, and RIPTA buses would bebetter accommodated. Specifically, the Main Avenue Realignment under Alternative B4 was modified toChapter 5 - Environmental Consequences 5-147 July 2011\\mawatr\ev\09228.00\reports\<strong>FEIS</strong>_Final_July_2011\<strong>PVD</strong>_CH05_Environmental_Cons_JUL_2011.doc
T.F. <strong>Green</strong> <strong>Airport</strong> <strong>Improvement</strong> <strong>Program</strong>Environmental Impact Statement and Final Section 4(f) Evaluationinclude a design of the Runway 5 End in order to reduce the curve in Main Avenue for better, more efficientroadway design, avoidance of cemetery impacts, and reduced land acquisition. Mitigation for surfacetransportation impacts is described in Chapter 6, Mitigation.5.7 Air QualityThis section provides an overview of the direct and cumulative impact analysis, including the methodology andresults, conducted for determining impacts for Air Quality that can be expected from the <strong>Improvement</strong> <strong>Program</strong>. Inaccordance with FAA guidelines, these analyses comprise air emissions inventories, atmospheric dispersion modeling,and “hot-spot” modeling. Hazardous air pollutants (HAPs) and greenhouse gases (GHGs) are also addressed.5.7.1 Regulatory ContextAir quality is governed by state and federal requirements. The federal Clean Air Act (CAA) of 1970, as amendedin 1990, 366 requires EPA to set National Ambient Air Quality Standards (NAAQS), under 40 CFR part 50, forpollutants considered harmful to public health and the environment. 367 EPA established the NAAQS, or airpollution limits, for six principal pollutants: carbon monoxide, lead, nitrogen dioxide, particulate matter, ozone,and sulfur dioxide. The CAA established two types of national air quality standards. Primary standards setlimits to protect public health, including the health, of “sensitive” populations such as asthmatics, children, andthe elderly. Secondary standards set limits to protect public welfare, including protection against decreasedvisibility, damage to animals, crops, vegetation, and buildings.The NAAQSs define outdoor levels of air pollutants that are considered safe for public health, welfare and theenvironment. The EPA also establishes emission standards for “mobile” sources of air pollution (i.e., aircraft,motor vehicles and off-road vehicles such as airport GSE and construction vehicles).RIDEM is the primary authority for ensuring that the federal and state air quality regulations and standards aremet in Rhode Island. 368 RIDEM is also responsible for air quality monitoring throughout the state as well asdeveloping and implementing a State Implementation Plan (SIP) to address non-attainment of the ozone (O 3)NAAQS. The review and permitting of stationary sources of air emissions and the regulation of some aspects ofmobile source emissions (i.e., motor vehicle inspection and maintenance, fuel oxygen content, etc.) are also underthe jurisdiction of RIDEM.5.7.2 Significance Thresholds and Additional AnalysesThe air quality analysis considers the impacts of the No-Action Alternative and Alternatives B2 and B4 inaccordance with FAA guidance. Additional air quality analyses were also performed to gain a fullerunderstanding of the air quality environment.5.7.2.1 Finding: No Significant Air Quality ImpactsAs presented previously in Table 5-6, the significance threshold for changes in air quality, in accordance withFAA Order 1050.1E, is when a project or action exceeds one or more of the NAAQS. Neither Alternative B2 nor366 The Clean Air Act of 1970, U. S. Congress, Public Law 91-604; Clean Air Act Amendments of 1990, U.S. Congress, Public Law 101-549.367 CFR Title 40, Part 50.368 The Rhode Island Department of Health (RIDOH) is also involved in the evaluation of air quality conditions in the State as these conditions pertain toprotecting public health.Chapter 5 - Environmental Consequences 5-148 July 2011\\mawatr\ev\09228.00\reports\<strong>FEIS</strong>_Final_July_2011\<strong>PVD</strong>_CH05_Environmental_Cons_JUL_2011.doc
T.F. <strong>Green</strong> <strong>Airport</strong> <strong>Improvement</strong> <strong>Program</strong>Environmental Impact Statement and Final Section 4(f) EvaluationAlternative B4 would result in significant air quality impacts, since neither would exceed one or more of theNAAQS. Based on the NAAQS assessment there would be no new violation of the NAAQS, and the amount ofozone precursors emitted by Alternatives B2 and B4 are less than the General Conformity de minimis thresholds.In addition, the proposed T.F. <strong>Green</strong> <strong>Airport</strong> <strong>Improvement</strong> <strong>Program</strong> would not be regionally significant.The results of the air quality assessment are compared to various criteria and standards established by the federaland state regulations and listed in Table 5-73. For example, emissions of nitrogen oxides (NO X) and volatile organiccompounds (VOCs) are compared to the General Conformity Rule de minimis thresholds. The atmospheric dispersionmodeling results for carbon monoxide (CO), oxides of nitrogen (NO X), and particulate matter particles of 10micrometers or less or less than 2.5 micrometers in aerodynamic diameter (PM 10/2.5) are compared to the NAAQS. 369,370For the CO “Hot-Spot” dispersion modeling analysis, the results are compared to the NAAQS for CO. 371Table 5-73Summary of Air Quality Significance ThresholdsAnalysisCriteria and StandardsEmissions Inventory Criteria only exist for non-attainment poll utants. See General Conformity Rule Applicabili ty Analysis, below.Atmospheric Dispersion NAAQS for the following poll utants:Analysis• CO: 1-hour = 40,000 µg/m 3 , 8-hour = 10,000 µg/m 3• NO2: 1-hour = 188 µg/m 3 , Annual = 100 µg/m 3• SO2: 1-hour = 196 µg/m 3 , 3-hour = 1,300 µg/m 3 , 24-hour = 365 µg/m 3 , Annual = 80 µg/m 3• PM10: 24-hour = 150 µg/m 3• PM2.5 : 24-hour = 35 µg/m 3 , Annual = 15 µg/m 3• Lead: 3-month rolli ng average = 0.15 µg/m 3CO “Hot-Spot” Analysis NAAQS for CO:• 1-hour = 40,000 µg/m3, 8-hour = 10,000 µg/ m 3HAPs Emissions Inventory No formal criteria or standards; data provided to disclose the types and amounts of HAPs associated withthe proposed acti on.General Conformity Rule De minimis Thresholds for O3 Non-attainment Areas:Applicability Analysis • NOX < 100 tpy (and not regionally significant)• VOCs < 50 tpy (and not regionally significant)Transportation Conformi ty Included in State Transportation <strong>Improvement</strong> Pl anSource: KB Environmental Sciences, Inc., 2011. PM10/2.5 Particulate matter (10 and 2.5 microns in aerodynamic diameters). CO Carbon monoxide. tpy Tons per year.NOX Nitrogen oxides. VOC Volatile Organic Compounds.NO 2 Nitrogen dioxide. µg/m 3 Micrograms/cubic meter.SO2 Sulfur dioxides. GSE Ground Support Equipment.HAPS Hazardous Air Pollutants.Note: Under the CAA, aircraft, GSE, and airport-related motor vehicles are not classifiable under the regulatory definitions of HAPs emission sources. 372,373 Therefore,the emissions from these sources are not compared to any regulatory thresholds or standards in this assessment. Rather, the results of the HAPs emissionsinventories are provided here for disclosure purposes and to aid in the comparison of the alternatives.369 The NAAQS are ambient levels and timeframes that are established by the EPA to protect human health and the environment.370 In a conservative approach, the highest predicted concentrations (including background concentrations) are used in the analysis. It is also assumed that allNO Xfrom airport-related sources is converted to nitrogen dioxide (NO 2); the species of NO Xagainst which the NAAQS for this pollutant is compared.371 Ambient concentrations of the EPA criteria pollutants O 3, SO 2and PB are not predicted as part of the atmospheric dispersion analysis. O 3are not included in the atmosphericdispersion analysis as it is a “secondary” pollutant formed from the reaction of other precursors – mainly NO xand VOC. Lead is not included as it is not commonlyassociated with airport sources of air emissions in large quantities. Sulfur dioxide (SO 2) is also not included as the quantity of this pollutant from airport sources is small.372 HAPs are pollutants that do not have established NAAQS, but present potential adverse human health risks from short-term (acute) or long-term (chronic)exposures. Because the analysis of airport-related HAPs is not an FAA requirement for NEPA documents, the approach described herein is designed toaddress RIDEM concerns as well as those of the general public raised during the EIS scoping process. (For the purposes of this discussion, the terms“HAPs”, “toxic air pollutants” and “air toxics” are considered to be synonymous.Chapter 5 - Environmental Consequences 5-149 July 2011\\mawatr\ev\09228.00\reports\<strong>FEIS</strong>_Final_July_2011\<strong>PVD</strong>_CH05_Environmental_Cons_JUL_2011.doc
T.F. <strong>Green</strong> <strong>Airport</strong> <strong>Improvement</strong> <strong>Program</strong>Environmental Impact Statement and Final Section 4(f) EvaluationAmbient concentrations of O 3, sulfur dioxide (SO 2), and lead are not analyzed as part of the atmosphericdispersion analysis because O 3is a “secondary” pollutant formed from the reaction of other precursors – mainlyNO xand VOC; SO 2emissions from airport sources are small, and Jet A fuel does not contain lead. 374A NAAQS assessment was required because of the number of enplanements at the <strong>Airport</strong>. A generalconformity determination was performed because the <strong>Airport</strong> is in a nonattainment area for ozone.5.7.2.2 Additional AnalysesIn addition to the emission inventory, atmospheric dispersion analysis, and CO “Hot Spot” analysis conductedto assess the potential for significant air quality impacts, this <strong>FEIS</strong> also conducts a HAPs emission inventory.Of growing concern is the impact of all proposed projects on climate change. GHGs are those that trap heat in the earth’satmosphere. Both naturally occurring and anthropogenic (man-made) GHGs include water vapor (H 2O), carbon dioxide(CO 2), 375 methane (CH 4), nitrous oxide (N 2O), and O 3. 376 At this time, there are no NAAQS for GHGs. The scientificcommunity is developing areas of further study to enable them to more precisely estimate aviation’s effects on theglobal atmosphere. The FAA is also currently leading or participating in several efforts intended to clarify the role thatcommercial aviation plays in GHG emissions and climate change, described in greater detail in Chapter 4, AffectedEnvironment. RIAC reports the GHGs generated at T.F. <strong>Green</strong> <strong>Airport</strong> annually to RIDEM in conformance with theRhode Island Permanent Air Quality Monitoring Act. It is unlikely that the planned improvements to T.F. <strong>Green</strong> <strong>Airport</strong>will result in an increase of GHG emissions in excess of 25,000 metric tons, which is the principal factor whenconsidering whether to include an analysis under current NEPA guidelines for GHG reporting. 377This section also includes a review of available air monitoring data which forms the basis for many of the airquality management plans within the state.5.7.3 MethodologyThis section describes the methods used to evaluate the potential future-year air quality impacts of the No-Action Alternative and Alternatives B2 and B4.This assessment was conducted following the guidelines contained in FAA Order 1050.1E, FAA Order 5050.4B, and theFAA’s Air Quality Procedures for Civilian <strong>Airport</strong>s and Air Force Bases. 378 The methodology for conducting the air qualityassessment varies with the type of technical analyses conducted (i.e., emissions inventory, atmospheric dispersion analysis,CO “Hot-Spot” analysis, etc.) The individual analyses involve different sources and levels of data and information.The emissions inventory and dispersion modeling results contained within the Draft EIS were adjusted basedon the revised forecasts for future-year enplanements and aircraft operations at T.F. <strong>Green</strong>. These revised373 The categories of HAPs sources are stationary major, minor, and area.374 Lead emissions would be minimal at approximately 700 pound (0.35 tons) per year based on a lead content of 2.12 grams per gallon. EPA is recommending leadambient monitoring at airports that emit at least 0.5 tons per year. Thus, T.F. <strong>Green</strong> <strong>Airport</strong> would be below this threshold and further assessment is not warranted.375 All greenhouse gas inventories measure CO 2emissions, but beyond CO 2different inventories include different greenhouse gases (GHGs).376 Several classes of halogenated substances that contain fluorine, chlorine, or bromine are also greenhouse gases, but they are, for the most part, solely aproduct of industrial activities. For example, chlorofluorocarbons (CFCs) and hydro chlorofluorocarbons (HCFCs) are halocarbons that contain chlorine,while halocarbons that contain bromine are referred to as bromofluorocarbons (i.e., halons) or sulfur (sulfur hexafluoride: SF6).377 Draft NEPA Guidance on Consideration of the Effects of Climate Change and <strong>Green</strong>house Gas Emissions, February 18, 2010.378 Air Quality Procedures for Civilian <strong>Airport</strong>s & Air Force Bases, AEE-120. U.S. Department of Transportation, FAA, Office of Environment and Energy. ReportNumber FAA-AEE-97-03. Washington, DC. April 1997.Chapter 5 - Environmental Consequences 5-150 July 2011\\mawatr\ev\09228.00\reports\<strong>FEIS</strong>_Final_July_2011\<strong>PVD</strong>_CH05_Environmental_Cons_JUL_2011.doc
T.F. <strong>Green</strong> <strong>Airport</strong> <strong>Improvement</strong> <strong>Program</strong>Environmental Impact Statement and Final Section 4(f) Evaluationforecasts (discussed in Section 5.1.3, Operations Forecast Update) result in lower airport-related emissions andestimated ambient pollutant concentrations from those reported in the DEIS.5.7.3.1 Impacts MethodologyThe following methodologies were used in the air quality analysis:• FAA’s Emissions and Dispersion Modeling System (EDMS) was used to calculate emissions from aircraft, GSE,and APU. 379 EDMS is the FAA-required and EPA-preferred model for assessing airport-related sources of airemissions. 380• For motor vehicles air quality analysis the EPA MOBILE6.2 model was used. 381 Input data for the RhodeIsland Motor Vehicle Inspection and Maintenance (I/M) <strong>Program</strong>, the vehicular fleet mix and age, as well aslocal meteorological conditions (i.e., temperature) were obtained from RIDEM. 382• For the CO “Hot-Spot” analyses and construction emissions inventory, the EPA CAL3QHC and NONROADmodels were used, respectively.The models used for the assessment are listed in Table 5-74.Table 5-74Air Quality Assessment ModelsModel Application CommentsEDMS Emissions model used to compute aircraft main engine and EDMS is the FAA-required and EPA-preferred model for assessingAPU, GSE and motor vehicle engine and fueling emissions of airport-related air emissions. For this analysis, the most recentCO, NOX, SOX, PM10/2.5, VOC, and HAPs.version (EDMS version 5.1.2) available was used for the analysis.Dispersion model used to compute ambient concentrations ofCO, NO2, and PM10/2.5 on the <strong>Airport</strong> and in neighboring communities.MOBILE6.2 Source of emission factors for motor vehicle and road- MOBILE6.2 is the EPA database of on-road emission factors and isregistered GSE engines.the most recent version of this model. For this analysis, motor vehiclefleet population characteristics, emission control measures and otherparameters were provided by RIDEM.NONROAD Source of construction vehicle and equipment emission NONROAD is the EPA database of emission factors for vehicles andfactors.equipment that are not road-registered or otherwise not contained inMOBILE6.2. For this analysis, the NONROAD (Version 2005.1.0) wasused.CAL3QHC Dispersion model used for Intersection CO “Hot-Spot” CAL3QHC is the EPA-preferred model for assessing COAnalysis.concentrations near roadways and intersections.Source: KB Environmental Sciences, Inc., 2008.CO Carbon monoxide. APU Auxiliary power unit.EPA Environmental Protection Agency. EDMS Emissions & Dispersion Modeling System.NOX Nitrogen oxides. FAA Federal Aviation Administration.RIDEM Rhode Island Department of Environmental Management. NO2 Nitrogen dioxide.PM10/2.5 Particulate matter (10 and 2.5 microns in aerodynamic diameter). SOX Sulfur oxides.HAPs Hazardous Air Pollutants. VOC Volatile Organic Compounds.379 Emissions and Dispersion Modeling System User’s Manual with Supplements, EDMS Version 5.1.2, FAA, September 2009.380 Environmental Desk Reference for <strong>Airport</strong> Actions, FAA, October 5, 2007.381 User’s Guide to MOBILE6.1 and MOBILE6.2, Mobile Source Emission Factor Model, U.S. Environmental Protection Agency, August 2003.382 Email from Ron Marcaccio to KB Environmental Sciences Inc., Rhode Island Department of Environmental Management, October 26, 2006.Chapter 5 - Environmental Consequences 5-151 July 2011\\mawatr\ev\09228.00\reports\<strong>FEIS</strong>_Final_July_2011\<strong>PVD</strong>_CH05_Environmental_Cons_JUL_2011.doc
T.F. <strong>Green</strong> <strong>Airport</strong> <strong>Improvement</strong> <strong>Program</strong>Environmental Impact Statement and Final Section 4(f) EvaluationRhode Island and the area surrounding T.F. <strong>Green</strong> <strong>Airport</strong> are in attainment with the NAAQS for NO 2and SO 2.Thus, although the air emissions inventory included NO xand SO xemissions, the dispersion modeling analysisdid not include any SO 2impacts or the NO 2and SO 2impacts for newly promulgated standards. SO 2impactswere not addressed, in the Air Quality Protocol submitted to RIDEM on August 12, 2005. The standards wereeffective after the DEIS was issued. Additionally, the areas’ attainment status designates achievement of theNO 2and SO 2standards within the region and the emissions as a result of Alternatives B2 and B4 were found tobe below de minimis thresholds for these pollutants. Thus, dispersion modeling of NO 2and SO 2is not warranted.Jet A aircraft fuel does not contain significant quantities of lead. Given the expected annual usage of aviationgasoline, which does contain some lead emissions, the lead emissions would be approximately 700 pounds(0.35 tons) per year; based on a lead content of 2.12 grams per gallon. EPA is recommending lead ambientmonitoring at airports that emit at least 0.5 tons per year. Thus, T.F. <strong>Green</strong> <strong>Airport</strong> would be below thisthreshold and further assessment of lead emissions is not warranted.5.7.3.2 Construction Impacts MethodologyConstruction activities of Alternatives B2 and B4 would involve a variety of air emissions sources including onandoff-road construction vehicles, machinery, and equipment. 383 For this analysis, the construction schedules andrequirements (i.e., work crews, equipment types, etc.) for Alternatives B2 and B4 were estimated. These data andinformation were then combined with appropriate emission factors obtained from EPA NONROAD andMOBILE6.2 models to obtain estimates of annual total emissions of CO, NO X, VOC, SO X,and PM 10/2.5. To betterunderstand the air quality impacts associated with each <strong>Improvement</strong> <strong>Program</strong> component and phase, separateanalyses were performed for the 2015 analysis year (i.e., completion of safety enhancements for Alternatives B2and B4 by the end of 2015, and the Runway 5-23 extension for Alternative B4) and the 2020 analysis year.5.7.3.3 General and Transportation Conformity MethodologyThe General Conformity requirements of the CAA are based on the outcomes of the operational- andconstruction-related emissions inventories and the Transportation Conformity requirements. A GeneralConformity assessment is required because the Study Area is in non-attainment for ozone.5.7.3.4 Cumulative Impacts MethodologyPotential cumulative impacts associated with Alternatives B2 and B4 were assessed along with air emissionsfrom other, non-airport sources of emissions. Planned future projects as listed in Table 5-5 were taken intoaccount. In addition, the cumulative impacts analysis included:• The operational emissions inventory, which includes emissions from all airport sources (i.e., aircraft, GSE,on-site motor vehicles, etc.), in combination with emissions associated with Alternatives B2 and B4enhancements. Emissions from both <strong>Airport</strong> and non-<strong>Airport</strong> traffic operating on the adjoining roadwaynetwork also are included.383 On-road vehicles will include transport trucks for the delivery of raw materials, supplies and equipment, as well as the personnel vehicles used by theconstruction workers. Typical on-road vehicles used in construction include automobiles, vans and trucks of various sizes and functions. Off-road equipmentis used to move and grade fill materials, install utilities, pave runway/taxiway/apron surfaces, construct buildings and install other miscellaneous airfieldsupport features. These include a wide array of scrapers, loaders, bulldozers, cranes and off-road haul trucks.Chapter 5 - Environmental Consequences 5-152 July 2011\\mawatr\ev\09228.00\reports\<strong>FEIS</strong>_Final_July_2011\<strong>PVD</strong>_CH05_Environmental_Cons_JUL_2011.doc
T.F. <strong>Green</strong> <strong>Airport</strong> <strong>Improvement</strong> <strong>Program</strong>Environmental Impact Statement and Final Section 4(f) Evaluation• The atmospheric dispersion analysis, which estimates ambient pollutant concentrations from <strong>Airport</strong>relatedemissions and includes “background” concentrations to account for non-airport sources locatedoutside the study area.• The CO “Hot-Spot” analysis, which estimates concentrations of this pollutant from <strong>Airport</strong> and non-<strong>Airport</strong>motor vehicle traffic and also includes background concentrations to account for CO emissions outside thestudy areas.• The General Conformity Rule applicability analysis, which evaluates the potential air quality impacts ofindividual projects in combination with all the other emissions contained in the SIP.• The Transportation Conformity Rule also evaluates individual roadway projects in combination with all theother surface transportation and transit projects in the region.5.7.4 Impact AssessmentThis section provides the results of the assessment of air quality impacts for the No-Action Alternative andAlternatives B2 and B4, for the years 2015, 2020, and 2025.5.7.4.1 No-Action AlternativeThe No-Action Alternative analyses findings are presented in the following order: Emissions Inventory,Atmospheric Dispersion Analyses, CO “Hot-Spot” Analyses, HAPs Emissions Inventory, and ConstructionEmissions Inventory.Emissions InventoryThe results of the No-Action Alternative emissions inventory for 2015, 2020, and 2025 are presented inTable 5-75.As shown in Table 5-75, future-year, airport-related CO and NO xemissions are expected to be produced in thegreatest quantities followed by VOC, SO X, and PM 10/2.5. Aircraft are expected to remain the dominant source ofVOC and NO Xemissions with off-<strong>Airport</strong> motor vehicles and GSE/APUs being secondary. This is consistentwith the 2004 Baseline Condition at T.F. <strong>Green</strong> <strong>Airport</strong>. There is also a forecasted increase in emissions for allpollutants and sources (except GSE) attributable to the increase in <strong>Airport</strong> operational levels within thistimeframe (2015 to 2025). Emissions from GSE are anticipated to decrease from 2015 to 2025 due to morestringent emissions reduction requirements. Emissions from motor vehicles are anticipated to increase inconjunction with the corresponding forecasted increases in <strong>Airport</strong>-related traffic levels.Chapter 5 - Environmental Consequences 5-153 July 2011\\mawatr\ev\09228.00\reports\<strong>FEIS</strong>_Final_July_2011\<strong>PVD</strong>_CH05_Environmental_Cons_JUL_2011.doc
T.F. <strong>Green</strong> <strong>Airport</strong> <strong>Improvement</strong> <strong>Program</strong>Environmental Impact Statement and Final Section 4(f) EvaluationTable 5-75No-Action Alternative: Operational Emissions Inventory (tpy)PollutantCO VOC NOX SOX PM10 PM2.5Source 2015 2020 2025 2015 2020 2025 2015 2020 2025 2015 2020 2025 2015 2020 2025 2015 2020 2025Aircraft 1 294 323 352 63 69 73 283 318 353 29 32 35 3 4 4 3 4 4GSE/APUs 101 59 51 4 2 2 14 11 11 1 1 1 1 1 1 1 1 1Stationary 2 /Fueling 3 3 3 3 3 3 3 14 14 14 1 1 1 1 1 1 1 1 1Motor VehiclesOn-<strong>Airport</strong> 4 137 135 159 6 5 5 10 6 5
T.F. <strong>Green</strong> <strong>Airport</strong> <strong>Improvement</strong> <strong>Program</strong>Environmental Impact Statement and Final Section 4(f) EvaluationTable 5-76 No-Action Alternative: Atmospheric Dispersion Analysis Results (µg/m 3 )PollutantAveragingPeriodNAAQSMaximum Concentration 12015 2020 2025ExceedNAAQSReceptor of MaximumConcentration 22015 2020 2025CO 1 hour 40,000 19,179 17,561 18,275 No 25G 25G 25G8-hour 10,000 5,455 5,357 5,460 No 23G 23G 23GNO2 Annual 100 42 40 40 No 21G 21G 21GPM10 24-hour 150 40 40 40 No 21G 21G 21GPM2.5 24-hour 35 34 34 34 No 21G 21G 21GAnnual 15 12 12 12 No 21G 21G 21GSource: KB Environmental Sciences, Inc., 2011.CO Carbon monoxide.NAAQS National Ambient Air Quality Standards.NO2 Nitrogen dioxide.PM10/2.5 Particulate matter (10 and 2.5 microns in aerodynamic diameter).µg/m 3 micrograms per cubic meter.21G Adjacent to the T.F. <strong>Green</strong> <strong>Airport</strong> Main Terminal Building.23G Located along Post Road north of T.F. <strong>Green</strong> <strong>Airport</strong> Main Terminal Building.25G Located along <strong>Airport</strong> Road north of Runway 16.1 Maximum Concentration means second highest predicted concentration (except 24-hour PM10 which is the fourth-highest and 24-hour PM2.5 which is the eighth-highest) using EDMS at all of the receptors analyzed with conservatively high background concentrations added.2 See Figure 4-16 for map of receptor locations.CO “Hot-Spot” AnalysisThe results of the CO “Hot-Spot” modeling are summarized in Table 5-77 and represent the highest CO levels atany of the receptors analyzed. The NAAQS for CO are also shown for comparison. Based on these findings, COlevels in the vicinities of the intersections analyzed (identified in Figure 4-17) are not expected to exceed theNAAQS for CO for any of the years analyzed.Table 5-77 No-Action Alternative: CO “Hot-Spot” Analysis Maximum Concentration Results (µg/m 3 )2015 2,3ID 1 Intersection Location 1 1-Hour 8-Hour2020 2,31-Hour 8-Hour2025 2,31-Hour 8-HourExceedsNAAQS1 Post Road and Lincoln Avenue 10,000 4,400 9,200 4,100 10,300 4,500 No3 Warwick Avenue and <strong>Airport</strong> Road 10,400 4,700 9,600 4,400 10,700 4,800 No4 Post Road and <strong>Airport</strong> Road 10,300 4,600 9,400 4,200 10,700 4,800 No5 Post Road and <strong>Airport</strong> Connector 9,400 4,000 8,500 3,600 9,700 4,200 No6 Post Road and Main Avenue 9,700 4,200 9,100 4,000 10,200 4,500 NoNAAQS for CO 40,000 10,000 40,000 10,000 40,000 10,000Source: KB Environmental Sciences, Inc., 2011.Notes: All six intersections do not apply to all alternatives, as some intersections are related only to elements (i.e., new intersection) of a specific alternative.CO Carbon monoxide.NAAQS National Ambient Air Quality Standard.µg/m 3 micrograms per cubic meter.1 See Figure 4-17 for intersection locations.2 Receptors are about 3 m (10 ft.) from roadway edge-of-pavement and the reported results are the highest CO concentrations at all receptors analyzed.3 Includes 1-Hour background CO concentrations of 6,800, 6,300, and 7,100 µg/m 3 for 2015, 2020, and 2025, respectively, and 8-Hour background concentration of 2,200, 2,000, and 2,300 µg/m 3 for 2015, 2020, and 2025, respectively.Chapter 5 - Environmental Consequences 5-155 July 2011\\mawatr\ev\09228.00\reports\<strong>FEIS</strong>_Final_July_2011\<strong>PVD</strong>_CH05_Environmental_Cons_JUL_2011.doc
T.F. <strong>Green</strong> <strong>Airport</strong> <strong>Improvement</strong> <strong>Program</strong>Environmental Impact Statement and Final Section 4(f) EvaluationHAPs Emissions InventoryThe HAPs emissions inventory is presented in Table 5-78. For simplification, total <strong>Airport</strong>-related amounts areshown for each species of HAPs and include emissions from aircraft, GSE/APU, stationary/fueling sources,and motor vehicles.Formaldehyde is expected to occur in the greatest amounts followed by acetaldehyde, acrolein, 1,3-butadiene,and methyl alcohol. This trend is consistent with other findings by the EPA on a nationwide basis. 384 Thesecompounds are emitted in the exhaust of aircraft, GSE/APUs, and motor vehicle engines and, to a lesser extent,from boilers, fuel facilities, and other stationary sources on the <strong>Airport</strong>.The differences in emission totals between 2015, 2020, and 2025 are attributable to the forecasted increases in<strong>Airport</strong> operations, changes in ground-based aircraft taxi times, and changes in on- and off-site surface trafficvolumes. However, some increases are offset by the expected reductions in HAPs emissions factors in motorvehicle engine exhaust.Table 5-78No-Action Alternative: Operational Emissions of HAPs (tpy)Compound 2015 2020 2025 Compound 2015 2020 2025Formaldehyde 7.02 7.63 7.99 Toluene 0.68 0.68 0.70Methyl alcohol 0.93 1.02 1.08 Phenol 0.37 0.41 0.44Benzene 2.85 2.73 2.70 N-hexane 0.13 0.11 0.111,1,1-trichloroethane
T.F. <strong>Green</strong> <strong>Airport</strong> <strong>Improvement</strong> <strong>Program</strong>Environmental Impact Statement and Final Section 4(f) EvaluationConstruction-Related EmissionsThere are no construction activities associated with the No-Action Alternative in the 2015 to 2025 periodtherefore construction-related emissions were not computed.5.7.4.2 Alternative B2The changes in air quality under Alternative B2 are due to the forecasted increase in aircraft operations, thechange in aircraft taxi times and off-site traffic volumes, and vehicular operations associated with FullyRelocated <strong>Airport</strong> Road.Emissions InventoryThe results of the Alternative B2 emissions inventory for 2015, 2020, and 2025 are presented in Table 5-79.Table 5-79Alternative B2: Operational Emissions Inventory (tpy)PollutantCO VOC NOX SOX PM10 PM2.5Source 2015 2020 2025 2015 2020 2025 2015 2020 2025 2015 2020 2025 2015 2020 2025 2015 2020 2025Aircraft 294 363 394 63 76 80 283 361 396 29 36 40 3 4 5 3 4 5GSE/APUs 101 63 55 4 2 2 14 12 12 1 2 2 1 1 1 1 1 1Stationary/Fueling 3 3 3 3 3 3 14 16 16 1 1 1 1 1 1 1 1 1Motor VehiclesOn-<strong>Airport</strong> 137 151 174 6 5 6 10 7 5
T.F. <strong>Green</strong> <strong>Airport</strong> <strong>Improvement</strong> <strong>Program</strong>Environmental Impact Statement and Final Section 4(f) EvaluationAll of the maximum predicted concentrations are well within the NAAQS for each pollutant analyzed. The highestpredicted concentrations are expected to occur at Receptor 21G adjacent to the T.F. <strong>Green</strong> <strong>Airport</strong>Main Terminal Building, at Receptor 23G located along Post Road to the north of the T.F. <strong>Green</strong> <strong>Airport</strong>Main Terminal Building, and at Receptor 25G located along <strong>Airport</strong> Road north of Runway 16 (Figure 4-16).This is a result of the combined effects of emissions from motor vehicles traveling on the off-site roadway network,motor vehicles operating in the terminal area, and aircraft operating near the runway ends and aprons. All otherreceptors are predicted to have lower levels compared to these locations.Table 5-80 Alternative B2: Atmospheric Dispersion Analysis Results (µg/m 3 )Maximum Concentration 1ExceedsReceptor ofMaximum Concentration 2Pollutant Avg. Time NAAQS 2015 2020 2025 NAAQS 2015 2020 2025CO 1 hour 40,000 19,551 17,968 19,102 No 25G 23G 23G8-hour 10,000 5,437 5,416 5,512 No 25G 23G 23GNO2 Annual 100 42 41 40 No 21G 21G 21GPM10 24-hour 150 40 39 39 No 21G 21G 21GPM2.5 24-hour 35 34 34 34 No 21G 21G 21GAnnual 15 12 12 12 No 21G 21G 21GSource: KB Environmental Sciences, Inc., 2011.Note: See Table 5-76 for explanatory abbreviations and footnotes.21G Adjacent to the T.F. <strong>Green</strong> <strong>Airport</strong> Main Terminal Building.23G Located along Post Road; north of T.F. <strong>Green</strong> <strong>Airport</strong> Main Terminal Building.25G Located along <strong>Airport</strong> Road north of Runway 16.1 Maximum Concentration means second highest predicted concentration (except 24-hour PM10 which is the fourth-highest and 24-hour PM2.5 which is the eighth highest) using EDMS at all of the receptors analyzed with conservatively high background concentrations added.2 See Figure 4-16 for map of receptor locations.CO “Hot-Spot” AnalysisThe results of the CO “Hot-Spot” modeling for Alternative B2 are summarized in Table 5-81 and represent the highest COlevels at any of the receptors analyzed. The NAAQS for CO are also shown for comparison. Based on these findings, COlevels in the vicinities of the intersections analyzed are not expected to exceed the NAAQS for CO under Alternative B2.Table 5-81 Alternative B2: CO “Hot-Spot” Analysis Maximum Concentration Results (µg/m 3 )Maximum Concentration201520202025ExceedsID Intersection Location1-Hour 8-Hour 1-Hour 8-Hour 1-Hour 8-Hour NAAQS1 Post Road/Lincoln Avenue 10,000 4,400 8,700 3,700 9,700 4,200 No2 Warwick Avenue/<strong>Airport</strong> Road (New) NA NA 9,600 4,400 10,700 4,800 No3 Warwick Avenue/<strong>Airport</strong> Road (Old) 10,400 4,700 9,400 4,100 10,200 4,500 No5 Post Road/<strong>Airport</strong> Connector 9,400 4,000 8,500 3,600 9,700 4,200 No6 Post Road/Main Avenue 9,700 4,200 8,900 3,900 10,200 4,500 NoNAAQS for CO 40,000 10,000 40,000 10,000 40,000 10,000Source: KB Environmental Sciences, Inc., 2011.Note: See Table 5-77 for explanatory abbreviations and footnotes.Chapter 5 - Environmental Consequences 5-158 July 2011\\mawatr\ev\09228.00\reports\<strong>FEIS</strong>_Final_July_2011\<strong>PVD</strong>_CH05_Environmental_Cons_JUL_2011.doc
T.F. <strong>Green</strong> <strong>Airport</strong> <strong>Improvement</strong> <strong>Program</strong>Environmental Impact Statement and Final Section 4(f) EvaluationSignificant Impacts: Based on the NAAQS assessment there would be no violation of the NAAQS, thereforethere are no significant air quality impacts associated with Alternative B2.HAPs Emissions InventoryThe results of the 2015, 2020, and 2025 HAPs emissions inventory for Alternative B2 are presented in Table 5-82and briefly discussed below.Table 5-82Alternative B2: Operational Emissions of HAPs (tpy)Compound 2015 2020 2025 Compound 2015 2020 2025Formaldehyde 7.02 8.32 8.70 Toluene 0.68 0.73 0.75Methyl alcohol 0.93 1.12 1.18 Phenol 0.37 0.45 0.48Benzene 2.86 2.89 2.85 N-hexane 0.13 0.11 0.111,1,1-trichloroethane
T.F. <strong>Green</strong> <strong>Airport</strong> <strong>Improvement</strong> <strong>Program</strong>Environmental Impact Statement and Final Section 4(f) Evaluation5.7.4.3 Alternative B4The changes in air quality under Alternative B4 are due to the forecasted increase in aircraft operations, the changein off-site traffic volumes, and Partially Relocated <strong>Airport</strong> Road.Emissions InventoryThe results of the Alternative B4 emissions inventory for 2015, 2020, and 2025 are presented in Table 5-83.Table 5-83Alternative B4: Operational Emissions Inventory (tpy)PollutantCO VOC NOX SOX PM10 PM2.5Source 2015 2020 2025 2015 2020 2025 2015 2020 2025 2015 2020 2025 2015 2020 2025 2015 2020 2025Aircraft 337 365 396 70 76 80 329 362 397 33 36 40 4 4 5 4 4 5GSE/APUs 110 63 55 4 2 2 16 12 12 1 2 2 1 1 1 1 1 1Stationary/Fueling 3 3 3 3 3 3 14 16 16 1 1 1 1 1 1 1 1 1Motor VehiclesOn-<strong>Airport</strong> 150 152 176 6 5 6 11 7 5
T.F. <strong>Green</strong> <strong>Airport</strong> <strong>Improvement</strong> <strong>Program</strong>Environmental Impact Statement and Final Section 4(f) EvaluationAll of the maximum predicted concentrations under Alternative B4 are within the NAAQS for each pollutantanalyzed. The highest predicted concentrations are expected to occur at Receptor 21G adjacent to theT.F. <strong>Green</strong> <strong>Airport</strong> Main Terminal Building, at Receptor 23G located along Post Road to the north of theT.F. <strong>Green</strong> <strong>Airport</strong> Main Terminal Building, and at Receptor 25G located along <strong>Airport</strong> Road north ofRunway 16. This is a result of the combined effects of emissions from motor vehicles traveling on the off-siteroadway network and aircraft operating near the runway ends and within the aprons. All other receptors arepredicted to have lower levels compared to these locations.Table 5-84 Alternative B4: Atmospheric Dispersion Analysis Results (µg/m 3 )Maximum Concentration 1ExceedsReceptor ofMaximum Concentration 2Pollutant Avg. Time NAAQS 2015 2020 2025 NAAQS 2015 2020 2025CONO21 hour8-hourAnnual40,00010,00010019,7685,5234318,9045,4874119,4995,60940NoNoNo25G25G21G25G23G21G25G23G21GPM10PM2.524-hour24-hourAnnual1503515403412393412Source: KB Environmental Sciences, Inc., 2011.Note: See Table 5-76 for explanatory abbreviations and footnotes.21G Adjacent to the T.F. <strong>Green</strong> <strong>Airport</strong> Main Terminal Building.23G Located along Post Road, north of T.F. <strong>Green</strong> <strong>Airport</strong> Main Terminal Building.25G Located along <strong>Airport</strong> Road north of Runway 16.1 Maximum Concentration means second highest predicted concentration (except 24-hour PM10 which is the fourth-highest and 24-hour PM2.5 which is the eighth highest) using EDMS at all of the receptors analyzed with conservatively high background concentrations added.2 See Figure 4-16 for map of receptor locations.393412NoNoNo21G21G21G21G21G21G21G21G21GCO “Hot-Spot” AnalysisThe results of the CO “Hot-Spot” modeling for Alternative B4 are summarized in Table 5-85 and represent the highestCO levels at any of the receptors analyzed. The NAAQS for CO are also shown for comparison. Based on these findings,CO levels in the vicinities of the intersections analyzed are not expected to exceed the NAAQS for CO.Table 5-85 Alternative B4: CO “Hot-Spot” Analysis Maximum Concentration Results (µg/m 3 )Maximum Concentration2015 2020 2025 ExceedsID Intersection Location 1-Hour 8-Hour 1-Hour 8-Hour 1-Hour 8-Hour NAAQS1 Post Road/Lincoln Avenue 10,000 4,400 9,200 4,100 10,300 4,500 No3 Warwick Avenue/<strong>Airport</strong> Road 10,400 4,700 9,500 4,300 10,700 4,800 No4 Post Road/<strong>Airport</strong> Road 10,500 4,800 9,500 4,300 10,800 4,900 No5 Post Road/<strong>Airport</strong> Connector 9,500 4,100 8,600 3,700 9,800 4,200 No6 Post Road/Main Avenue 9,800 4,300 9,100 4,000 10,200 4,500 NoNAAQS for CO 40,000 10,000 40,000, 10,000 40,000 10,000Source: KB Environmental Sciences, Inc., 2011.Note: See Table 5-77 for explanatory abbreviations and footnotes.Chapter 5 - Environmental Consequences 5-161 July 2011\\mawatr\ev\09228.00\reports\<strong>FEIS</strong>_Final_July_2011\<strong>PVD</strong>_CH05_Environmental_Cons_JUL_2011.doc
T.F. <strong>Green</strong> <strong>Airport</strong> <strong>Improvement</strong> <strong>Program</strong>Environmental Impact Statement and Final Section 4(f) EvaluationSignificant Impacts: Based on the NAAQS assessment there would be no violations of the NAAQS; therefore,there would be no significant air quality impacts associated with Alternative B4.HAPs Emissions InventoryThe results of the 2015, 2020, and 2025 HAPs emissions inventory for Alternative B4 are presented in Table 5-86.Table 5-86Alternative B4: Operational Emissions of HAPs 1 (tpy)Compound 2015 2020 2025 Compound 2015 2020 2025Formaldehyde 7.78 8.34 8.73 Toluene 0.74 0.73 0.75Methyl alcohol 1.03 1.13 1.19 Phenol 0.42 0.45 0.48Benzene 3.03 2.86 2.83 N-hexane 0.14 0.11 0.111,1,1-trichloroethane
T.F. <strong>Green</strong> <strong>Airport</strong> <strong>Improvement</strong> <strong>Program</strong>Environmental Impact Statement and Final Section 4(f) Evaluation5.7.5 Temporary Impacts from Short-Term Construction ActivitiesAir emissions would increase temporarily during the short-term construction activities associated withAlternatives B2 and B4. The air quality impact during construction would be a function of the number, types ofequipment, and operating hours.5.7.5.1 Alternative B2Annual construction phase and maximum construction-related emissions from Alternative B2 for the phases ofconstruction from 2015 and 2020 are provided in Table 5-87. During the 2015 phase of construction, 2013 isforecasted to have the highest total construction-related emissions for all pollutants analyzed due to the amountof construction equipment utilized for this time period. During the 2020 phase of construction, 2020 is expectedto have the highest total construction-related emissions for all pollutants (except for CO which would be 2018);due to the amount of construction equipment utilized for this timeframe. These values are well within theGeneral Conformity applicability thresholds for VOC and NO Xof 50 and 100 tons per year, respectively (seeSection 5.7.6, General and Transportation Conformity).Table 5-87Alternative B2: Construction Year and MaximumConstruction Emissions Inventory (tpy)Maximum AmountsPollutant 2015 Phase 1 2020 Phase 2CO 20.9 18.7VOC 3 4.4 3.8NOX 4 49.5 19.4SOX 0.2 0.1PM10 7.3 5.7PM2.5 2.7 1.3Construction YearPollutant 2012 2013 2014 2015 2016 2017 2018 2019 2020CO 3.1 20.9 13.2 9.7 3.6 15.6 18.7 7.7 13.8VOC 3 0.5 4.4 2.7 1.5 0.4 1.4 2.7 1.9 3.8NOX 4 6.1 49.5 27.6 14.8 3.0 10.0 17.1 10.5 19.4SOX
T.F. <strong>Green</strong> <strong>Airport</strong> <strong>Improvement</strong> <strong>Program</strong>Environmental Impact Statement and Final Section 4(f) Evaluation5.7.5.2 Alternative B4Annual construction phase and maximum construction-related emissions associated with Alternative B4for the 2010 and 2020 construction phases are provided in Table 5-88. During the 2015 phase ofconstruction, 2014 is forecasted to have the highest total construction-related emissions for all pollutantsanalyzed due to the amount of construction equipment utilized in this time period. During the 2020phase of construction, 2016 is expected to have the highest total construction related emissions for allpollutants; due to the amount of construction equipment deployed in this timeframe. These values arewell within the General Conformity applicability thresholds for VOC and NO Xof 50 and 100 tons peryear, respectively (see Section 5.7.6, General and Transportation Conformity).Table 5-88Alternative B4: Maximum Construction Emissions Inventory (tpy)Maximum AmountsPollutant 2015 Phase 1 2020 Phase 2CO 18.9 17.8VOC 4 3.8 3.9NOX 5 38.3 31.6SOX 0.1 0.1PM10 6.8 6.4PM2.5 2.3 1.9Construction YearPollutant 2013 2014 2015 2016 2017 2018 2019 2020CO 4.0 18.9 18.6 17.8 15.5 16.8 9.3 10.0VOC 3 0.6 3.8 3.3 3.9 2.5 2.6 1.3 2.3NOX 4 6.6 38.3 32.5 31.6 18.0 16.6 7.4 12.1SOX 0.0 0.1 0.1 0.1 0.1 0.1 0.0 0.1PM10 5.1 6.8 6.5 6.4 5.7 5.6 5.1 5.3PM2.5 0.8 2.3 2.1 1.9 1.3 1.2 0.8 1.0Source: KB Environmental Services, Inc., 2011.Note: See Table 5-75 for explanatory abbreviations.tpy tons per year.1 The results shown are for the year 2012; the year of greatest emissions in the 2015 timeframe.2 The results shown are for the year 2016; the year of greatest emissions in the 2020 timeframe.3 General Conformity de minimis threshold for VOC is 50 tons/year.4 General Conformity de minimis threshold for NOx is 100 tons/year.Chapter 5 - Environmental Consequences 5-164 July 2011\\mawatr\ev\09228.00\reports\<strong>FEIS</strong>_Final_July_2011\<strong>PVD</strong>_CH05_Environmental_Cons_JUL_2011.doc
T.F. <strong>Green</strong> <strong>Airport</strong> <strong>Improvement</strong> <strong>Program</strong>Environmental Impact Statement and Final Section 4(f) Evaluation5.7.6 General and Transportation ConformityThe General and Transportation Conformity provisions of the CAA require federal agencies to demonstrate thatprojects and actions approved, funded, and/or permitted under their authorization to conform to the applicableSIP. Presently, the City of Warwick and the entire State of Rhode Island are located in an area designated as“non-attainment” for the pollutant O 3. The criteria for compliance with the General and TransportationConformity provisions of the CAA are different from each other and therefore addressed separately.5.7.6.1 General ConformityUnder General Conformity, an applicability test is first applied to determine if a formal determination isnecessary. If the program-related emissions (those expected to result from the <strong>Improvement</strong> <strong>Program</strong>) arewithin prescribed de minimis levels, they automatically conform to the SIP. <strong>Program</strong>-related emissions arederived from the future-year emissions inventory results and are based on the differences (+/-) in totalemissions between Alternatives B2 and B4 and the No-Action Alternative.As the Warwick area is presently designated as a moderate O 3non-attainment area, the applicable de minimislevels are 100 tpy for NO Xand 50 tpy for VOC. Therefore, if program-related emissions (of NO Xand VOC) areless than 100 tpy and 50 tpy, respectively, the General Conformity Rule does not apply. This applicability testalso requires that the program-related emissions do not represent more than 10 percent of the area-wide totals.Both operational and construction-related emissions are subject to the General Conformity Rule.Operational EmissionsTotal <strong>Improvement</strong> <strong>Program</strong>-related operational emissions of NO Xand VOC are summarized in Table 5-89.These values were derived based upon the differences in total airport-related operational emissions between theAlternatives B2 and B4 and the No-Action Alternative. Again, for comparative purposes, the applicable GeneralConformity Rule de minimis levels and “yes/no” statements as to whether the program-related emissionsautomatically conform to the SIP are also provided.Table 5-89Operational Emissions General Conformity Summaries 1 (tpy)De minimisAlternative B2Alternative B4Pollutant Levels 2 2015 2020 2025 2015 2020 2025VOC 50
T.F. <strong>Green</strong> <strong>Airport</strong> <strong>Improvement</strong> <strong>Program</strong>Environmental Impact Statement and Final Section 4(f) EvaluationAccording to the current SIP for the Rhode Island Ozone Non-Attainment Area, the area-wide totals of VOCand NO Xare 10,540 and 1,553 tons, respectively. Operational emissions resulting from Alternatives B2 and B4are approximately one and three percent, respectively, of the area-wide totals for these pollutants. Theseemissions are less than 10 percent of state-wide totals and are not considered to be regionally significant.Construction EmissionsFrom the inventory of construction emissions presented previously for Alternatives B2 and B4, the maximumannual emissions of NO Xand VOC are summarized in Table 5-90 and, for comparative purposes, the applicableGeneral Conformity Rule de minimis levels are also provided. From this comparison, “yes/no” statements as towhether the emissions meet the Presumed-to-Conform criteria are given.Table 5-90Construction Emissions General Conformity Summaries 1 (tpy)De minimis 2015 Phase 2020 PhasePollutant Levels 2 Alternative B2 Alternative B4 Alternative B2 Alternative B4VOC 50 4.4 4 3.8 4 3.8 5 3.9 5NOX 100 49.5 4 38.3 4 19.4 5 31.6 5Conforms to the SIP? 3 Yes Yes Yes YesSource: KB Environmental Sciences, Inc., 2011.NOX Nitrogen oxides.VOC Volatile organic compounds.1 Values shown are based on year of greatest construction-related emissions, by phase.2 De minimis levels are thresholds below which the program-related emissions are “presumed to conform” to the SIP. 3 Conforms to the SIP determinations (i.e., Yes/No) are based on whether or not construction-related emissions (tpy) are less than de minimis levels (tpy). 4 The results shown are for the year 2013 (Alternative B2) and year 2014 (Alternative B4); the year of greatest emissions in the 2015 timeframe.5 The results shown are for the year 2020 (Alternative B2), and year 2016 (Alternative B4); the year of greatest emissions in the 2020 timeframe.Table 5-90 demonstrates that construction-related emissions associated with Alternatives B2 and B4 are withinthe de minimis levels. Therefore, these emissions automatically conform to the SIP and no formal GeneralConformity Determination is required.Operational and Construction Emissions CombinedDuring the second development phase (the “2020 Phase”) of the T.F. <strong>Green</strong> <strong>Airport</strong> <strong>Improvement</strong> <strong>Program</strong>, project-related construction emissions of NO Xand VOC would occur concurrently with program-related operational emissions in the years 2015 to 2020. During this period, these construction- and operational-related emissions are “additive” under the General Conformity Rule and must be considered together. Table 5-91presents a compilation of these emissions broken out by category and year; the combined sums; and then compares these values to the applicable de minimis levels. Again, “yes/no” statements as to whether theemissions conform to the SIP criteria are given.As shown, the combined totals of construction- and operational-related emissions associated withAlternatives B2 and B4 are below de minimis levels, and the <strong>Improvement</strong> <strong>Program</strong> is not regionally significant.Therefore, these emissions conform to the SIP and no formal General Conformity Determination is required. Chapter 5 - Environmental Consequences 5-166 July 2011\\mawatr\ev\09228.00\reports\<strong>FEIS</strong>_Final_July_2011\<strong>PVD</strong>_CH05_Environmental_Cons_JUL_2011.doc
T.F. <strong>Green</strong> <strong>Airport</strong> <strong>Improvement</strong> <strong>Program</strong>Environmental Impact Statement and Final Section 4(f) EvaluationTable 5-91Operational and Construction Emissions General Conformity Summaries (tpy)PollutantAlternativeDe minimisLevels 1 Category 2015 2016Year2017 2018 2019 2020Alternative B2 Construction 1.5 0.4 1.4 2.7 1.9 3.8Operational 2 0.2 0.2 0.2 0.2 0.2 8.0VOC50 Totals1.6 0.6 1.6 2.8 2.0 11.9Alternative B4Construction3.3 3.9 2.5 2.6 1.3 2.3Operational 2 9.2 9.2 9.2 9.2 9.2 7.750 Totals 12.6 13.1 11.7 11.9 10.5 10.0Alternative B2 Construction 14.8 3.0 10.0 17.1 10.5 19.4Operational 2 0.2 0.2 0.2 0.2 0.2 47.6NOX100 Totals15.0 3.2 10.3 17.3 10.7 67.0Alternative B4Construction32.5 31.6 18.0 16.6 7.4 12.1Operational 2 50.0 50.0 50.0 50.0 50.0 47.4100 Totals 82.5 81.6 68.0 66.6 57.4 59.5Conforms to the SIP? 3 Yes Yes Yes Yes Yes YesSource: KB Environmental Sciences, Inc. 2011.NOX Nitrogen oxides.VOCs Volatile organic compounds.1 De minimis levels are thresholds below which the program-related emissions are “presumed to conform” to the SIP.2 Operational emissions are the differences among the Build and No-Action Alternative in that year.3 Conforms to the SIP determinations (i.e., Yes/No) are based on whether or not program-related emissions (tpy) are less than de minimis levels (tpy).5.7.6.2 Transportation ConformityUnder Transportation Conformity, there are no project-specific quantitative criteria for determining if surfacetransportation or transit-related emissions comply with the SIP. Instead, the individual project(s) are listed asplanned improvements to the area-wide roadway or transit systems in a conforming Transportation<strong>Improvement</strong> Plan (TIP). For the proposed off-site roadway improvements associated with Alternatives B2 andB4, these criteria will be met by their inclusion into the Rhode Island TIP or shown not to be regionallysignificant.5.7.7 Cumulative ImpactsPotential impacts associated with Alternatives B2 and B4 along with air emissions from other, non-airportsources of emissions have also been assessed cumulatively, as a standard part of the analysis. The specificanalyses include the following:• The operational emissions inventory, which includes emissions from all <strong>Airport</strong> sources (i.e., aircraft, GSE,on-site motor vehicles, etc.), in combination with emissions associated with Alternatives B2 and B4improvements. Emissions from both <strong>Airport</strong> and non-<strong>Airport</strong> traffic operating on the adjoining roadwaynetwork also are included.Chapter 5 - Environmental Consequences 5-167 July 2011\\mawatr\ev\09228.00\reports\<strong>FEIS</strong>_Final_July_2011\<strong>PVD</strong>_CH05_Environmental_Cons_JUL_2011.doc
T.F. <strong>Green</strong> <strong>Airport</strong> <strong>Improvement</strong> <strong>Program</strong>Environmental Impact Statement and Final Section 4(f) Evaluation• The atmospheric dispersion analysis, which estimates ambient pollutant concentrations from airport-relatedemissions and includes “background” concentrations to account for non-airport sources located outside thestudy area.• The CO “Hot-Spot” analysis, which estimates concentrations of this pollutant from <strong>Airport</strong> and non-<strong>Airport</strong>motor vehicle traffic and also includes background concentrations to account for CO emissions outside thestudy areas.• The General Conformity Rule applicability analysis, which evaluates the potential air quality impacts ofindividual projects in combination with all the other emissions contained in the SIP.• The Transportation Conformity Rule also evaluates individual roadway projects in combination with all theother surface transportation and transit projects in the region.5.7.8 Comparison of Alternatives B2 and B4This section provides a comparative summary of the effects of Alternative B2 and B4 on air quality in both theshort- and long-terms in comparison to the No-Action Alternative. The findings show that based on the NAAQSassessment there was no violation of the NAAQS, and the amount of ozone emitted by Alternatives B2 and B4 is below de minimis thresholds. In addition, the <strong>Improvement</strong> <strong>Program</strong> is not regionally significant.Table 5-92 shows that Alternatives B2 and B4 would not have a significant effect on air quality conditions locally,state-wide, or regionally when compared to the applicable thresholds. 5.7.8.1 Operational Emissions InventoryAs shown in Table 5-92, among Alternatives B2 and B4 and the No Action Alternative, total emissions of CO arepredominant, followed by emissions of NO X, VOCs, SO X, PM 10, and PM 2.5, respectively. For the No-ActionAlternative and Alternatives B2 and B4, total <strong>Airport</strong>-related emissions are expected to increase between the years2015 to 2025 by approximately seven to 15 percent (depending on the pollutant) - with or without the<strong>Improvement</strong> <strong>Program</strong> implementation. This is largely due to the corresponding increase in airport operationsover this same time period. When comparing Alternatives B2 and B4 and the No-Action Alternative, these totalsare expected to differ by about six percent by 2025. Again, this difference is due to the forecasted increase inairport operations combined with the expected changes in aircraft fleet mix, ground-based aircraft taxi distances tothe runway ends, the forecasted increase in motor vehicle traffic, and changes in roadway alignment while alsoaccounting for the expected reductions in emissions associated with GSE and motor vehicles. In 2015, totalemissions for Alternative B4 are slightly higher than for Alternative B2 due to the earlier construction ofRunway 5-23 extension and associated aircraft operations that would occur in 2015 instead of 2020.Chapter 5 - Environmental Consequences 5-168 July 2011\\mawatr\ev\09228.00\reports\<strong>FEIS</strong>_Final_July_2011\<strong>PVD</strong>_CH05_Environmental_Cons_JUL_2011.doc
T.F. <strong>Green</strong> <strong>Airport</strong> <strong>Improvement</strong> <strong>Program</strong>Environmental Impact Statement and Final Section 4(f) EvaluationTable 5-92Air Emissions Inventory Summary – Operational (tpy)2015 2020 2025AlternativesPollutant No-Action B2 B4 No-Action B2 B4 No-Action B2 B4CO 1,493 1,497 1,586 1,430 1,510 1,492 1,582 1,662 1,644VOC 107 107 116 105 113 113 113 122 121NOX 367 367 417 379 427 427 410 458 458SOX 32 32 37 35 39 39 38 43 43PM10 8 8 9 9 9 9 9 10 10PM2.5 7 7 8 7 8 8 8 8 8Source: KB Environmental Sciences, Inc., 2011.5.7.8.2 Atmospheric Dispersion AnalysisAs shown in Table 5-93, the highest predicted concentrations of CO, NO 2PM 10and PM 2.5are well within theNAAQS for these pollutants for Alternatives B2 and B4 in 2015, 2020, and 2025. Similarly, there are less thaneight percent differences in the predicted concentrations among Alternatives B2 and B4 and the No-ActionAlternative. Concentrations are approximately two percent higher in 2015 with Alternative B4 compared toAlternative B2 and the No Action Alternative due to the earlier implementation of the runway extension andadditional aircraft operations. Concentrations of CO are approximately two percent higher in 2025 withAlternative B4 due to Partially Relocated <strong>Airport</strong> Road and its proximity to one of the modeled receptors (25G).Table 5-93 Atmospheric Dispersion Analysis Summary (µg/m 3 )2015 2020 2025AlternativesPollutant NAAQS No-Action B2 B4 No-Action B2 B4 No-Action B2 B4CO 1 hour 40,000 19,179 19,551 19,768 17,561 17,968 18,904 18,275 19,102 19,4998-hour 10,000 5,455 5,437 5,523 5,357 5,416 5,487 5,460 5,512 5,609NO2 Annual 100 42 42 43 40 41 41 40 40 40PM10 24-hour 150 40 40 40 40 39 39 40 39 39PM2.5 24-hour 35 34 34 34 34 34 34 34 34 34Annual 15 12 12 12 12 12 12 12 12 12Source: KB Environmental Sciences, Inc., 2011.5.7.8.3 CO “Hot-Spot” AnalysisThe highest predicted CO levels at all of the intersections analyzed in the CO “Hot-Spot” analysis aresummarized in Table 5-94. These values are all well within the NAAQS in 2015, 2020, and 2025 forAlternatives B2 and B4 as well as the No-Action Alternative. In 2025, the highest predicted CO levels areapproximately two percent higher for Alternative B4 than for Alternative B2 because Alternative B4 isforecasted to result in slightly higher levels of vehicle delay and idling at roadway intersections.Chapter 5 - Environmental Consequences 5-169 July 2011\\mawatr\ev\09228.00\reports\<strong>FEIS</strong>_Final_July_2011\<strong>PVD</strong>_CH05_Environmental_Cons_JUL_2011.doc
T.F. <strong>Green</strong> <strong>Airport</strong> <strong>Improvement</strong> <strong>Program</strong>Environmental Impact Statement and Final Section 4(f) EvaluationTable 5-94 CO “Hot-Spot” Analysis Summary (µg/m 3 )Year NAAQS No-Action Alternative Alternative B2 Alternative B42015 1 hour 40,000 10,400 10,400 10,5008-hour 10,000 4,700 4,700 4,8002020 1 hour 40,000 9,600 9,600 9,5008-hour 10,000 4,400 4,400 4,3002025 1 hour 40,000 10,700 10,700 10,8008-hour 10,000 4,800 4,800 4,900Source: KB Environmental Sciences, Inc., 2011.5.7.8.4 Hazardous Air PollutantsCompared to the No-Action Alternative, there are minor predicted increases in total HAPs emissions in 2015 to2020 and 2025 for Alternatives B2 and B4 due to the forecasted increased operations over this time period.Differences in total HAPs emissions between Alternatives B2 and B4 are negligible.5.7.8.5 Construction EmissionsUnder Alternative B4, construction emissions during the initial phase (2015), shown in Table 5-95, are predictedto be less when compared to Alternative B2. However, during the second phase (2020), Alternative B4 isestimated to result in greater construction emissions. For Alternative B2, both the North Apron construction andthe Runway 16-34 reconstruction would be completed prior to 2016. Neither of these projects would begin priorto 2016 for Alternative B4.Table 5-95Air Emissions Inventory Summary – Maximum Construction Emissions (tpy)2015 Phase 1,2 2020 Phase 1,3Pollutant Alternative B2 Alternative B4 Alternative B2 Alternative B4CO 20.9 18.9 18.7 17.8VOC 4.4 3.8 3.8 3.9*NOX 49.5 38.3 19.4 31.6SOX 0.2 0.1 0.1 0.1PM10 7.3 6.8 5.7 6.4PM2.5 2.7 2.3 1.3 1.9Source: KB Environmental Sciences, Inc., 2011.1 2015 Phase includes 2012 through 2015 (Alternative B2) and 2010 through 2015 (Alternative B4); 2020 Phase includes 2016 through 2020.2 The results shown are for the year 2013 (Alternatives B2) and year 2014 (Alternative B4); the year of greatest emissions in the 2015 phase.3 The results shown are for the years 2018 and 2020 (Alternative B2), and year 2016 (Alternative B4); the year of greatest emissions in the 2020 phase.Chapter 5 - Environmental Consequences 5-170 July 2011\\mawatr\ev\09228.00\reports\<strong>FEIS</strong>_Final_July_2011\<strong>PVD</strong>_CH05_Environmental_Cons_JUL_2011.doc
T.F. <strong>Green</strong> <strong>Airport</strong> <strong>Improvement</strong> <strong>Program</strong>Environmental Impact Statement and Final Section 4(f) Evaluation5.7.9 Avoidance and MinimizationAlternatives B2 and B4 both include program elements that will contribute to reducing air quality impacts including:• The new access and egress roadway configurations and expanded curbsides in the main terminal areawould help to improve surface traffic circulation, lessen stop-and-go driving, and reduce excess emissionsassociated with motor vehicle engine idling.• The new multi-level parking structure would enhance surface traffic circulation, lessen stop-and-go driving,and reduce excess motor vehicle idling.• Use of electric power and pre-conditioned air at many of the terminal gates reduces the use of aircraft APUsand their associated emissions.• The direct connection to InterLink, west of the <strong>Airport</strong>, with rail service will enable future airport patronsand employees to use this transit facility and reduce the use of motor vehicles.• The InterLink’s consolidated rental car facility reduces the emissions from the former rental car shuttlebuses taking passengers to and from off-site facilities as well as reduces emissions of rental cars beingshuttled for quick-turn-around by having facilities in one location.While specific air quality avoidance, minimization or mitigation measures are not required under NEPA or theGeneral Conformity Rule, Chapter 6, Mitigation, outlines the possible measures could be included to help reduceconstruction-related emissions associated with construction vehicles and equipment during the construction periods.5.8 Historic, Architectural, Archaeological, and Cultural ResourcesThis section provides an overview of the impact analysis for the historic, architectural, archaeological andcultural resources, including the methodology for determining potential impacts to these resources.5.8.1 Regulatory ContextSection 106 of the National Historic Preservation Act of 1966 (NHPA), as amended, requires federal agencies toconsider the effects of their undertakings on historical properties identified within the area of potential effect(APE). A historical property is defined as “any prehistoric or historic district, site, building, structure, or objectincluded in, or eligible for inclusion in, the National Register of Historic Places (NRHP) maintained by theSecretary of the Interior.” At the state and local level, significant cultural resources are protected under theRhode Island Historic Preservation Act (Rhode Island General Laws 42-45-1 et seq. and 23-18-1 et seq.), whichaffords protection to Rhode Island Historical Cemeteries. The cemeteries within this project’s APE are notindividually eligible for listing in the NRHP nor are they part of a larger potentially eligible or listed historicdistrict and, therefore, are not considered Historic Properties under the NHPA. However, Rhode Island GeneralLaw 23-18-1 et seq. conditionally prohibits any town or city to permit “construction, excavation or other grounddisturbing activity within 25 feet of a recorded historic cemetery.” Any such work must be permitted by thelocal municipality. In the City of Warwick, Chapter 12 of the Code of Ordinances of the City of Warwick(Chapter 12) is the guiding regulation.Chapter 5 - Environmental Consequences 5-171 July 2011\\mawatr\ev\09228.00\reports\<strong>FEIS</strong>_Final_July_2011\<strong>PVD</strong>_CH05_Environmental_Cons_JUL_2011.doc
T.F. <strong>Green</strong> <strong>Airport</strong> <strong>Improvement</strong> <strong>Program</strong>Environmental Impact Statement and Final Section 4(f) EvaluationUnder NEPA, historical properties that are not eligible for listing in the NRHP, but are considered important tolocal history are protected, and the context and intensity of impacts must be evaluated. If the proposed actionresults in a direct impact on non-listed historical properties, it is considered significant under NEPA.5.8.2 Significance Threshold and Additional AnalysesThe analysis considers impacts of the No-Action Alternative and Alternatives B2 and B4 pursuant to FAAguidance, and also describes other analyses conducted to gain a full understanding of impacts to the historicalresources, architectural, archaeological resources, and cemeteries in the Project Area and Study Area.5.8.2.1 Finding: Significant Historic Resources ImpactSection 106 of the NHPA requires that the federal agency (in this case FAA) apply the Criteria of Adverse Effect(as defined at 36 CFR Part 800.5) to historical properties as a result of its undertaking. An undertaking wouldaffect a historical property if the action has the potential to alter its character-defining features, location, setting,design, workmanship, feeling, or association, that qualify the property for inclusion in the NRHP. Diminishingthe integrity of the historical property can occur through physical destruction of a property; alteration of aproperty; isolating the property from its surrounding settings or altering the characteristics of those settings;removal of a property from its location; transfer through a sale or lease that diminishes the long-termpreservation of the property; and introduction of incompatible elements that would diminish the integrity of theproperty (for example, atmosphere, visual, or audible elements). According to FAA Order 1050.1E, fornoise-related impacts to occur, a quiet setting (i.e., DNL below 60 dB) must be one of the recognizedcharacteristics making the property eligible for or listed on the NRHP.As required by 36 CFR Part 800, which governs the Section 106 consultation process, and as described inFAA Order 1050.1E, the FAA has consulted with the Rhode Island State Historic Preservation Office (RISHPO)and the Narragansett Indian Tribal Historic Preservation Office (NITHPO), as well as other appropriate entitiesduring the preparation of this <strong>FEIS</strong>, and has invited appropriate entities to be consulting parties. Consultingparties for the <strong>Improvement</strong> <strong>Program</strong> include the RISHPO and NITHPO. Refer to Chapter 8, Consultation andCoordination, for an overview of the consultation associated with the Section 106 process. The Advisory Councilon Historic Preservation (ACHP) determined that its participation in the Section 106 consultation process wasnot necessary (see Appendix C, Federal, State, City, and Tribal Coordination).Both Alternatives B2 and B4 would result in significant impacts to historical properties. Historical cemeteries areimportant elements of the historical past of local communities in Rhode Island and are protected under RhodeIsland General Law 23-18-11 et seq.; therefore, the direct (physical) impacts to Warwick Historical Cemetery 26(WHC 26) as a result of Alternatives B2 and B4 would be considered significant under NEPA. The limits ofWHC 26 (as shown in Figure 5-32) were confirmed between April 7 and 12, 2011 under Permit No. 2011-02issued by the RIHPHC on January 7, 2011. FAA has consulted with the above-identified parties to considermeasures to avoid, minimize, or mitigate the adverse effect to historical properties as well as the significantimpacts to historical cemeteries resulting in a Memorandum of Agreement (MOA), as required underSection 106, that describes the undertaking and stipulates appropriate measures to be taken to avoid, minimize,or mitigate the adverse effects to historical properties. The executed MOA has been submitted by the FAA to theChapter 5 - Environmental Consequences 5-172 July 2011\\mawatr\ev\09228.00\reports\<strong>FEIS</strong>_Final_July_2011\<strong>PVD</strong>_CH05_Environmental_Cons_JUL_2011.doc
T.F. <strong>Green</strong> <strong>Airport</strong> <strong>Improvement</strong> <strong>Program</strong>Environmental Impact Statement and Final Section 4(f) EvaluationACHP (for filing) along with supporting documentation as specified in 36 CFR Part 800.11(f). Refer to AppendixI, Historic, Architectural, Archaeological, and Cultural Resources, for a signed copy of the MOA.5.8.2.2 Additional AnalysesThree historical cemeteries (WHC 76, WHC 77, and WHC 78) located in the APE, in addition to WHC 26(discussed previously), may be impacted by proposed enhancements associated with Alternative B4. WHC 76lies within an area of Future Build VLAP for noise mitigation, and WHC 77 and 78 may be impacted due toRealigned Main Avenue. FAA conducted additional archaeological surveys in April 2011, including surveys todefine the limits of these three historical cemeteries (as well as WHC 26) and a Phase I(c) archaeologicalinvestigation along Realigned Main Avenue (in response to a request from NITHPO) under Permit Numbers2011-02 and 2011-03, respectively both issued by the RIHPHC on January 7, 2011. Archaeological investigationswere undertaken between April 7 and 12, 2011. Further details of these archaeological studies are documentedin Chapter 4, Affected Environment, Section 4.7.2, Affected Environment.5.8.3 MethodologyUnder Section 106, the APE is defined as “the geographic area or areas within which the undertaking maydirectly or indirectly cause alterations in the character or use of historical properties, if any such propertiesexist” [36 CFR 800.16 (d)]. This section discusses the methods used to evaluate the potential impacts tohistorical, architectural, archaeological and cultural resources caused by either direct impacts (physical taking)or by indirect impacts (the introduction of environmental impacts).5.8.3.1 Direct Impact MethodologyThe APE for direct impacts is the geographic area in which properties would be directly impacted by either aphysical taking or modification (such as land acquisition for the RPZs or building demolition to enhance safety)or by a construction-related taking or modification (such as the construction of Runway 5-23 safety areas). Thisarea includes the <strong>Airport</strong> property and any properties that would be acquired for Alternatives B2 and B4. Threehistorical architectural properties, one eligible historic district, three archaeological sites, and five historicalcemeteries have been identified within the APE for direct impacts, as shown in Figure 4-20.5.8.3.2 Indirect Impact Methodology“Indirect impacts” are incompatible environmental intrusions such as increased noise or visual changes that couldaffect the qualities for which the resource is eligible for listing or listed in the NRHP. Changes in noise level andvisual setting are anticipated to be the only indirect impacts that could adversely affect historical properties. Notall historical resources are considered noise-sensitive; for example, the on-<strong>Airport</strong> structure listed on the NRHP isnot noise-sensitive because its original use is airport-related. The “indirect impacts” APE includes the area thatcould be adversely affected by noise, as defined by 14 CFR Part 150, Aviation Safety and Noise Abatement Act of1979, and FAA Orders 1050.1E and 5050.4B. Eight historical resources and one historical cemetery were identifiedwithin the limits of the APE for potential indirect impacts, as defined by noise analysis. “Indirect impacts” alsoinclude potential alteration or obstruction of the setting of those historical properties for which setting is one of thecharacteristics that qualify them for listing in the NRHP. The FAA evaluates impacts to historical resources wherean undisturbed setting without modern transportation elements (equipment, structures, and associated buildings)is important to the reasons why the property is listed, or eligible for listing, in the NRHP.Chapter 5 - Environmental Consequences 5-173 July 2011\\mawatr\ev\09228.00\reports\<strong>FEIS</strong>_Final_July_2011\<strong>PVD</strong>_CH05_Environmental_Cons_JUL_2011.doc
T.F. <strong>Green</strong> <strong>Airport</strong> <strong>Improvement</strong> <strong>Program</strong>Environmental Impact Statement and Final Section 4(f) Evaluation5.8.4 Impact AssessmentAccording to Section 106 of the NHPA and Protection of Historic Properties regulations (36 CFR Part 800), anaction may be considered to have a significant impact if it would adversely affect 387 an historical orarchaeological property listed in or determined eligible for inclusion in the NRHP. Per FAA Order 1050.1E, theFAA makes the final determination on the level of effect to historical, architectural, archaeological and culturalresources.5.8.4.1 No-Action AlternativeThis section provides an assessment of impacts to historical, architectural, archaeological and cultural resourcesas a result of the No-Action Alternative.Direct ImpactsThe No-Action Alternative would have no direct impact on any historical, architectural, archaeological andcultural resources. Buildings would continue to be maintained and used as they are currently.Indirect ImpactsThe Rhode Island State <strong>Airport</strong> Terminal (Operations Building) would experience noise levels of DNL 65 dBand above in 2020 and 2025. Hangar No. 1, Hangar No. 2, and the eligible airport historic district wouldexperience noise levels above DNL 65 dB in 2015, 2020, and 2025. In addition, all Warwick historical cemeteries(WHC) in the APE (except WHC 76) would experience noise levels above DNL 65 dB in 2015, 2020 and 2025.WHC 76 would experience noise levels above DNL 65 dB in 2020 and 2025. However, these increases do notconstitute an indirect impact as noise is not a defining characteristic of these properties. Table 5-96 presents thepredicted noise levels for the No-Action Alternative and Alternatives B2 and B4.5.8.4.2 Alternative B2The following direct and indirect impacts may occur during the implementation of Alternative B2.Direct ImpactsHangar No. 1, individually eligible for listing in the NRHP and a contributing element to the eligible airporthistoric district (also eligible for listing in the NRHP), would be removed to enhance safety, resulting in anadverse effect to this historical property and to the eligible airport historic district. Hangar No. 1 is currently anencroachment within the Runway Object Free Area (ROFA) and an obstruction within the navigable airspacesurrounding T.F. <strong>Green</strong> <strong>Airport</strong>. 388 Because additional enhancements are proposed as part of the <strong>Improvement</strong><strong>Program</strong>, the FAA requires that the Hangar No. 1 encroachment be addressed to enhance safety at T.F. <strong>Green</strong><strong>Airport</strong>. Refer to Figures 5-31 and 5-32 for direct impacts to historical properties located north and south of the<strong>Airport</strong>, respectively.Modifications and enhancements to runways and taxiways at the northern end of the airfield would furtheralter the historical configuration of the airfield, resulting in an adverse effect to the eligible airport historic387 An adverse effect occurs if an undertaking would affect a historic property and has the potential to alter its character-defining features, location, setting,design, workmanship, feeling, or association, that qualify the property for inclusion in the NRHP.388 As defined by 14 CFR Part 77, Objects Affecting Navigable Airspace.Chapter 5 - Environmental Consequences 5-174 July 2011\\mawatr\ev\09228.00\reports\<strong>FEIS</strong>_Final_July_2011\<strong>PVD</strong>_CH05_Environmental_Cons_JUL_2011.doc
T.F. <strong>Green</strong> <strong>Airport</strong> <strong>Improvement</strong> <strong>Program</strong>Environmental Impact Statement and Final Section 4(f) Evaluationdistrict under Section 106 because of the physical destruction to the property. Under Alternative B2, therewould be interior modifications to Hangar No. 2 to accommodate the uses of the integrated cargo facility. Thesemodifications would not alter the exterior appearance of Hangar No. 2 and, upon further consultation with theRISHPO in January 2011, the FAA has determined that the proposed interior modifications would not result inan adverse effect to Hangar No. 2.Alternative B2 would directly impact the Double L archaeological site due to the extension of the runway at theRunway 23 End and associated projects (identified in Figure 4-21). Based on the Phase II site examinations conductedon October 25, 2007, the FAA determined that the Double L site did not meet the criteria for listing in the NRHP. TheRISHPO did not concur with this determination for the Double L site and requested additional Phase II siteexamination fieldwork, using machine trenches, to determine the presence or absence of features. 389 The FAA hascommitted to the additional Phase II field investigations, with appropriate consultation with the NITHPO, shouldAlternative B2 be selected as the Preferred Alternative. 390 If the Double L site is determined to be eligible for listing inthe NRHP, then the impact under Alternative B2 would result in an adverse effect to this NRHP-eligible site.Much of the proposed Fully Relocated <strong>Airport</strong> Road would cross a substantially developed landscape.However, Fully Relocated <strong>Airport</strong> Road would cross the Confreda Farm, an area of moderate to higharchaeological sensitivity that was not surveyed due to denied access by property owners. Fully Relocated<strong>Airport</strong> Road would widen Warwick Avenue between Fully Relocated <strong>Airport</strong> Road and existing <strong>Airport</strong> Road.This area is in the vicinity of Spring <strong>Green</strong> Pond and associated wetlands and may require archaeologicalsurvey. Therefore, it is unknown at this time whether Fully Relocated <strong>Airport</strong> Road would impactarchaeological sites. In addition, wetland mitigation sites under consideration to offset wetland impacts areadjacent to known archaeological sites. If determined necessary, an archaeological survey would be conducted ona site by site basis as part of the wetland mitigation program, per stipulations contained in the MOA (seeAppendix I, Historic, Architectural, Archaeological, and Cultural Resources). As with the field work conducted for this<strong>FEIS</strong>, the NITHPO would be provided with the opportunity to observe the archaeological survey activities.On-<strong>Airport</strong> propertyUnder Alternative B2, the relocated Perimeter Road may fall within the boundary of WHC 26 (Figure 5-32). Anarchaeological survey to determine the boundaries of WHC 26 has been completed (see Section 5.8.2.2,Additional Analyses). Modifications would also place WHC 26 within the ROFA and the headstones wouldpenetrate the primary and transitional surfaces established by 14 CFR Part 77, Objects Affecting NavigableAirspace. The headstones would have to be laid flat with protection or relocated as determined by the WarwickHistorical Cemetery Commission as a required safety measure resulting in a significant impact. As stipulated inthe MOA, FAA and RIAC will consult with the WHCC as required under Rhode Island General Law 23-18-1 etseq. and Chapter 12 to develop measures to mitigate significant impacts (see Appendix I, Historic, Architectural,Archaeological, and Cultural Resources).389 Letter from RIHPHC to FAA dated March 6, 2009.390 Letter from FAA to RISHPO dated March 18, 2009.Chapter 5 - Environmental Consequences 5-175 July 2011\\mawatr\ev\09228.00\reports\<strong>FEIS</strong>_Final_July_2011\<strong>PVD</strong>_CH05_Environmental_Cons_JUL_2011.doc
T.F. <strong>Green</strong> <strong>Airport</strong> <strong>Improvement</strong> <strong>Program</strong>Environmental Impact Statement and Final Section 4(f) EvaluationIndirect ImpactsThe Fully Relocated <strong>Airport</strong> Road would have a visual impact on the Rhode Island State <strong>Airport</strong> Terminal(Operations Building), Hangar No. 2, and the eligible airport historic district. The relocation would eliminate thepublic’s view of the historical setting, resulting in an adverse effect because of the alteration of the historicalsetting. All other historical architectural properties are located at least one mile from the <strong>Airport</strong> and arebuffered from any potential visual impacts.Alternative B2 would have no effect on historical properties resulting from noise-related indirect impacts (Table 5-96, Figure 5-33). A quiet setting is not one of the recognized characteristics that make these historicalproperties eligible or listed in the NRHP. 391 Furthermore, a quiet setting is not a defining characteristic of the historical cemeteries identified within the APE. Indirect impacts would not be significant.Table 5-96 Projected Future Noise Impacts to Historical Properties 12015 2020 2025No-Action Alternative No-Action Alternative Alternative No-Action Alternative AlternativeHistorical Property 2, 3 Alternative B4 Alternative B2 B4 Alternative B2 B4Pawtuxet Village HD 58.7 58.7 59.2 60.4 60.0 59.8 61.0 60.5Rhodes (Christopher) HS 59.4 59.4 59.9 61.1 60.7 60.5 61.7 61.2John Waterman Arnold HS 59.9 59.9 60.4 61.5 61.1 61.0 62.0 61.6Hangar No. 1 4 66.1 N.A. 66.5 66.9 N.A. 67.1 67.5 N.A.Rhode Island State <strong>Airport</strong> Terminal 4 64.5 64.4 65.0 65.4 65.0 65.7 66.2 65.8Hangar No. 2 4 69.0 69.0 69.4 69.8 69.4 70.1 70.5 70.1Eligible <strong>Airport</strong> HD 4 66.5 66.4 67.0 68.3 67.0 67.6 69.1 67.7Warwick Civic Center HD 59.7 59.7 59.5 59.9 59.5 60.2 60.6 60.1Apponaug HD 58.8 58.8 58.6 59.0 58.6 59.2 59.6 59.2Caleb <strong>Green</strong>e House 59.1 59.1 58.9 59.3 58.9 59.6 60.0 59.5Cowesett Pound 60.5 60.5 61.0 62.2 61.8 61.5 62.7 62.3Amasa Sprague Estate Stone Walls 54.0 54.0 54.4 55.2 54.8 54.9 55.7 55.3WHC 26 Peter Freeman Lot 4 70.1 70.1 70.4 71.9 71.5 71.0 72.5 72.0WHC 63 Utter-Arnold-Rhodes Lot 67.7 67.7 68.1 69.3 68.9 68.7 69.9 69.5WHC 76 William J. Cole Lot 66.5 66.5 66.8 68.6 68.2 67.5 69.4 68.9WHC 77 Northup Lot 64.9 64.9 65.3 67.4 65.9 66.1 68.1 66.6WHC 78 Howard-Remington Lot 65.2 65.2 65.6 66.8 66.4 66.3 67.6 67.1WHC 81 Kinnecom Lot 4 74.3 74.3 74.6 74.6 74.2 75.2 75.2 74.8Source: HMMH, 2011.HD Historic DistrictHS Historical SiteWHC Warwick Historical Cemetery (from the Rhode Island Cemetery Database).1 All readings are DNL ## dB. Bold indicates significant increase in noise levels (an increase of at least DNL 1.5 dB at or above DNL 65 dB). There are none in this table.According to CFR Part 150, noise levels above 65 dB are not incompatible with these uses; however, none of the historical properties that would be exposed to noise levels ator above DNL 65 dB are noise-sensitive. The historical cemeteries are not eligible for listing in the NRHP and, therefore, not subject to Section 106 impact criteria, includingchanges in noise levels.2 From the National Register Database and RIGIS.3 See Figures 5-33 through 5-35 for property locations.4 On-<strong>Airport</strong> property.391 Environmental Desk Reference for <strong>Airport</strong> Actions, FAA, October 5, 2007, Chapter 14.Chapter 5 - Environmental Consequences 5-176 July 2011\\mawatr\ev\09228.00\reports\<strong>FEIS</strong>_Final_July_2011\<strong>PVD</strong>_CH05_Environmental_Cons_JUL_2011.doc
T.F. <strong>Green</strong> <strong>Airport</strong> <strong>Improvement</strong> <strong>Program</strong>Environmental Impact Statement and Final Section 4(f) EvaluationSignificant Impacts: Alternative B2 includes the removal of Hangar No. 1, a contributing element of the eligibleairport historic district, as well as a property that has been determined individually eligible for listing in theNRHP. Alternative B2 also requires airside enhancements that will further alter the overall historical configurationof the runways and taxiways that are included as contributing elements to the eligible airport historic district.Fully Relocated <strong>Airport</strong> Road would alter the setting of the Rhode Island State <strong>Airport</strong> Terminal, Hangar No. 2,and the eligible airport historic district. These elements of Alternative B2 result in adverse effects under Section 106and significant impacts under NEPA. In addition, physical impacts to WHC 26 would also be significant.5.8.4.3 Alternative B4The following direct and indirect impacts may occur during the implementation of Alternative B4.Direct ImpactsSimilar to Alternative B2, Hangar No. 1 would be removed, resulting in an adverse effect under Section 106 to thisindividually eligible historical property and to the eligible airport historic district. Modifications andenhancements to runways and taxiways at the northern end of the airfield would further alter the historicalconfiguration of the airfield, resulting in an adverse effect under Section 106 to the eligible airport historic district.Refer to Figures 5-31 and 5-32 for direct impacts to historical properties north and south of the <strong>Airport</strong>,respectively.Under Alternative B4, there would be interior modifications to Hangar No. 2 to accommodate the uses of theintegrated cargo facility. These modifications would not alter the exterior appearance of Hangar No. 2 and uponfurther consultation with the RISHPO, the FAA as determined that the proposed interior modifications wouldnot result in an adverse effect to Hangar No. 2.Construction of the split Integrated Cargo Facility would directly impact landscaping along <strong>Airport</strong> Road that isassociated with the Rhode Island State <strong>Airport</strong> Terminal. This direct impact would result in an adverse effectunder Section 106 to this individually listed property and contributing element to the eligible airport historicdistrict because of the physical impact to part of the property (Figure 5-31).Alternative B4 would have no impact on known archaeological sites listed in or determined eligible for theNRHP. In response to a request from NITHPO, a Phase I(c) archaeological investigation was conducted in April2011 along Realigned Main Avenue but no pre-contact Native American cultural features or deposits werelocated. The results of the survey have been forwarded to the RIHPHC and NITHPO for review. The wetlandmitigation areas within the APE for Alternative B4 have not been subject to archaeological survey.Archaeological survey will be conducted on a site by site basis as part of the wetland mitigation program, perstipulations contained in the MOA (see Appendix I, Historic, Architectural, Archaeological, and Cultural Resources).As with the field work conducted for this <strong>FEIS</strong>, the NITHPO would be provided with the opportunity toobserve the archaeological survey activities.WHC 26 would be directly impacted under Alternative B4 based on preliminary limits of construction.Extending Runway 5 to the south would require placing of fill on or within 25 feet of WHC 26 (Figure 5-32).<strong>Improvement</strong>s would also place WHC 26 within the ROFA and the headstones would penetrate the primaryChapter 5 - Environmental Consequences 5-177 July 2011\\mawatr\ev\09228.00\reports\<strong>FEIS</strong>_Final_July_2011\<strong>PVD</strong>_CH05_Environmental_Cons_JUL_2011.doc
T.F. <strong>Green</strong> <strong>Airport</strong> <strong>Improvement</strong> <strong>Program</strong>Environmental Impact Statement and Final Section 4(f) Evaluationand transitional surfaces established by 14 CFR Part 77, Objects Affecting Navigable Airspace. The headstoneswould have to be laid flat with protection or relocated as determined by the Warwick Historical CemeteryCommission as a required safety measure (refer to Chapter 6, Mitigation, Section 6.7, Historic, Architectural,Archaeological, and Cultural Resources, for a discussion of options to address this safety measure). As stipulated inthe MOA, FAA and RIAC will consult with the WHCC as required under Rhode Island General Law 23-18-1 etseq. and Chapter 12 of the City of Warwick ordinances to develop measures to mitigate significant impacts (seeAppendix I, Historic, Architectural, Archaeological, and Cultural Resources).Realigned Main Avenue may result in construction occurring in or within 25 feet of WHC 77 and WHC 78(Figure 5-32). While the exact boundaries of WHC 77 and 78 are not confirmed because permission has not beengranted to strip top soils around the perimeter of visible headstones at these cemeteries, archaeological investigationWHC 77 indicates that no unmarked graves exist outside of the currently established boundary and Main Avenue.At this time the unconfirmed boundary for WHC 78 is the limits of the designated cemetery lot and the surveyindicated a potential for unmarked graves between the cemetery and Main Avenue. Through the impactminimization process, the redesign of Realigned Main Avenue using a slower design speed (which requires adesign exception from RIDOT) may eliminate any impacts to WHC 77 and WHC 78 (refer to Section 5.8.8.1,Avoidance, for further details). Throughout additional investigations and final design of Realigned Main Avenue,the FAA and RIAC will continue to consult with the WHCC per stipulations contained in the MOA (seeAppendix I, Historic, Architectural, Archaeological, and Cultural Resources) and as required by Rhode Island GeneralLaw 23-18-1 et seq. and Chapter 12 of the City of Warwick ordinances.WHC 76 lies within an area of Future Build VLAP for noise mitigation. If abutting landowners elect to have theirproperty acquired and the acquisition includes ground disturbance, potential impacts to WHC 76 will be evaluatedprior to any acquisition. FAA and RIAC will continue to consult with the WHCC per stipulations contained in theMOA (see Appendix I, Historic, Architectural, Archaeological, and Cultural Resources) and as required by Rhode IslandGeneral Law 23-18-1 et seq. and Chapter 12 of the City of Warwick Ordinances.Indirect ImpactsAlternative B4 would result in a visual impact on the Rhode Island State <strong>Airport</strong> Terminal and the eligibleairport historic district resulting in an adverse effect under Section 106 by changing its historical setting. Theterminal building is currently visible from <strong>Airport</strong> Road, which contributes to its setting (i.e., the public on<strong>Airport</strong> Road has a sense of the landside approaches and operations when the terminal was in operation). Dueto its location, the split Integrated Cargo facility would obstruct the public’s views of the terminal building fromPartially Relocated <strong>Airport</strong> Road, isolate the property from its surroundings, and alter its setting (Figure 5-31).Alternative B4 does not result in visual impacts to Hangar No. 2 because the view of the hangar from <strong>Airport</strong>Road would not be changed from the existing view. All other historical architectural properties are located atleast one mile from the <strong>Airport</strong> and are buffered from any potential visual impacts.Alternative B4 would have no effect on historical properties resulting from noise-related indirect impacts(Table 5-96, Figures 5-34 and 5-35). A quiet setting is not one of the recognized characteristics that make thesehistorical properties eligible or listed in the NRHP. Furthermore, a quiet setting is not a defining characteristicof the historical cemeteries identified within the APE.Chapter 5 - Environmental Consequences 5-178 July 2011\\mawatr\ev\09228.00\reports\<strong>FEIS</strong>_Final_July_2011\<strong>PVD</strong>_CH05_Environmental_Cons_JUL_2011.doc
T.F. <strong>Green</strong> <strong>Airport</strong> <strong>Improvement</strong> <strong>Program</strong>Environmental Impact Statement and Final Section 4(f) EvaluationSignificant Impacts: Alternative B4 includes the removal of Hangar No. 1, a contributing element of the eligibleairport historic district, as well as a property that has been determined individually eligible for listing in the NRHP.The construction of the Integrated Cargo Facility will also result in a direct and indirect impact to the eligible airporthistoric district and the Rhode Island State <strong>Airport</strong> Terminal, a contributing element as well as a propertyindividually listed in the NRHP. Alternative B4 also calls for airside enhancements that will further alter the overallhistorical configuration of the runways and taxiways that are included as contributing elements to the eligible airporthistoric district. These elements of Alternative B4 result in a significant impact under NEPA because of the physicaldestruction of a historical property and changes in a historical property’s character defining setting. Alternative B4also requires construction activities in or within 25 feet of several historical cemeteries that are considered importantto the history of the City of Warwick and Rhode Island. These physical impacts to WHC 26 would also be significant.5.8.5 Short-term Impacts from Temporary Construction ActivitiesUnder Alternatives B2 and B4, there are no anticipated temporary construction impacts to the historical andarchaeological resources or historical cemeteries. Any vibration associated with construction activities would beminor and would have no impact.5.8.6 Cumulative ImpactsSince the 1970s, there have been improvements and new development on the north ramps at T.F. <strong>Green</strong> in closeproximity to the now identified historical buildings within the APE. Beginning in the late 1970s, the spacesbetween the terminal building and the hangars have been in-filled with corrugated metal buildings that serve ashangars for private aircraft. Airside modifications have incrementally altered the original runway, taxiway, andapron configuration that contribute to the eligible airport historic district. Alternatives B2 and B4 will further alterthe composition and setting of this part of the <strong>Airport</strong> with the removal of Hangar No. 1, the construction of anintegrated cargo facility under Alternative B4, relocation of <strong>Airport</strong> Road under Alternative B2, and furtherrealignment of the runways, taxiways, and aprons within the eligible airport historic district. There are no futureanticipated projects that would result in cumulative impacts to historical properties as a result of Alternatives B2and B4. It is anticipated that the Rhode Island State <strong>Airport</strong> Terminal will continue to house airport-related uses;Hangar No. 2, which currently serves as a cargo facility, will remain and continue to be used for cargo operationsas part of the Integrated Cargo Facility; and aviation activities would continue to occur within the eligible airporthistoric district.5.8.7 Comparison of Alternatives B2 and B4 – Significant ImpactsThis section compares the impacts to historical resources that would result from Alternative B2 andB4.Each Alternative would result in direct and indirect impacts to historical properties, resulting in a finding ofadverse effect under Section 106 of the NHPA and a significant impact under NEPA. 392 Table 5-97 presents acomparison of impacts for Alternatives B2 and B4.392 Impacts to the historic cemeteries would not be adverse effects under Section 106 because cemeteries are not eligible for the NRHP.Chapter 5 - Environmental Consequences 5-179 July 2011\\mawatr\ev\09228.00\reports\<strong>FEIS</strong>_Final_July_2011\<strong>PVD</strong>_CH05_Environmental_Cons_JUL_2011.doc
T.F. <strong>Green</strong> <strong>Airport</strong> <strong>Improvement</strong> <strong>Program</strong>Environmental Impact Statement and Final Section 4(f) EvaluationTable 5-97Summary of Direct and Indirect Impacts to Historical and Archaeological ResourcesAlternative Property Impact Reason for Impact Type of ImpactB2 Eligible <strong>Airport</strong> Historic District Demolish Hangar No. 1, publicview and access impact, alterhistorical runway/taxiwayconfigurationRemove airspace obstruction,airside modifications andenhancements; roadway relocationSignificant Direct and IndirectImpactsHangar No. 1 Demolish Hangar No. 1 Remove airspace obstruction Significant Direct ImpactHangar No. 2Interior modifications, public viewand access impactUse interior space for IntegratedCargo; roadway relocationIndirect ImpactsRhode Island State Terminal Public view and access impact Relocation of <strong>Airport</strong> Road Significant Indirect ImpactsArchaeological ResourcesPotential presence ofarchaeological resourcesRelocation of <strong>Airport</strong> Road andRunway 23 extensionPotential Direct ImpactsWHC 26 Headstones impact Clear Object Free Area Significant Direct ImpactB4 Eligible <strong>Airport</strong> Historic District Demolish Hangar No. 1,diminished public view, alterhistorical runway/taxiwayconfigurationRemove airspace obstruction andairside modifications andenhancementsSignificant Direct and IndirectImpactsHangar No. 1 Demolish Hangar No. 1 Remove airspace obstruction Significant Direct ImpactHangar No. 2 Interior modifications Use interior space for IntegratedCargoNo Impacts.Rhode Island State TerminalLandside landscaping removal anddiminished public viewConstruction of split IntegratedCargo FacilitySignificant Direct and IndirectImpactWHC 26 Headstones impact Clear Object Free Area Significant Direct ImpactWHC 76Ground disturbance within25 feet of WHC 76Voluntary Land Acquisition forProject-Related Noise ImpactsPotential Significant Direct Impact 1WHC 77 & 78Construction potentially occurring Realigning Main Avenue Potential Significant Direct Impact 2within 25 feet of WHC 77 & 78Sources: The Public Archaeology Laboratory, Inc.; VHB, Inc.; National Register Database; Rhode Island Cemetery Database; and RIGIS.WHC Warwick Historical Cemetery .1 Alternative B4 may result in a significant direct impact to WHC 76 because it lies within an area of Future Build VLAP for noise mitigation. If abutting landownerselect to have their property acquired and the building is demolished, potential impacts to WHC 76 will be evaluated by FAA and RIAC in consultation with theWHCC prior to any acquisition, per stipulations contained in the MOA.2 Alternative B4 may result in a significant direct impact to WHC 77 and 78 due to Realigned Main Avenue; however, the boundaries of WHC 77 and 78 are basedon the City’s plat maps and have not been field verified. Once permission is granted to strip top soils around the perimeter of visible headstones at thesecemeteries and the boundaries of WHC 77 and 78 are fully confirmed, the significant, or direct (physical), impact can be identified. For the purposes of this EIS itis assumed that the redesign of Realigned Main Avenue to avoid the cemeteries would be implemented in final design.Alternatives B2 and B4 would require the removal of Hangar No. 1, which would result in an adverse effect toHangar No. 1 and the eligible airport historic district. Alternatives B2 and B4 include modifications to theinterior of Hangar No. 2 to accommodate the uses of the Integrated Cargo Facility. These modifications wouldnot alter the exterior of Hangar No. 2 and, therefore, would not diminish those characteristics that make thisresource eligible for the NRHP. It is anticipated that the interior modifications to Hangar No. 2 will result in aChapter 5 - Environmental Consequences 5-180 July 2011\\mawatr\ev\09228.00\reports\<strong>FEIS</strong>_Final_July_2011\<strong>PVD</strong>_CH05_Environmental_Cons_JUL_2011.doc
T.F. <strong>Green</strong> <strong>Airport</strong> <strong>Improvement</strong> <strong>Program</strong>Environmental Impact Statement and Final Section 4(f) Evaluationfinding of no adverse effect. Under Alternative B2, the full relocation of <strong>Airport</strong> Road would diminish the viewof Rhode Island State <strong>Airport</strong> Terminal, Hangar No. 2, and the eligible airport historic district resulting in anadverse effect. Alternative B4 would also result in an adverse effect to the setting of the Rhode Island State<strong>Airport</strong> Terminal and the eligible airport historic district through visual impacts and direct impacts to theterminal’s setting and a significant impact due to the landscape removal and change in setting. The adverseeffect to Hangar No.1 and the eligible airport historic district is a significant impact under NEPA due to thedemolition, physical alteration, and change in setting. Alternatives B2 and B4 would encroach on WHC 26 andAlternative B4 would likely encroach on the 25-foot buffer surrounding WHC 77 and WHC 78. WHC 76 may beimpacted under the VLAP for <strong>Improvement</strong> <strong>Program</strong>-related noise mitigation. Impacts to these historicalcemeteries, which are important elements of the historical past of local communities in Rhode Island and areprotected under Rhode Island General Law, constitute a significant impact under NEPA.5.8.8 Avoidance and MinimizationAs presented in the previous sections, Alternatives B2 and B4 would have direct and indirect impacts on one ormore resources listed in or determined eligible for listing in the NRHP. These impacts would result in a findingof adverse effect. When an undertaking results in a finding of adverse effect, Section 106 requires federalagencies to consult with the appropriate SHPO and THPO and other consulting parties to develop and evaluatealternatives or modifications that could avoid, minimize, or mitigate adverse effects on historical properties.Chapter 6, Mitigation, presents the mitigation measures proposed for significant impacts and other impacts tohistorical and cultural resources.5.8.8.1 AvoidanceThe following section outlines avoidance efforts undertaken in the alternatives development process.Historical PropertiesAlternatives that would avoid impacts to Hangar No. 1 under Alternatives B2 and B4 would require shiftingRunway 16-34 substantially to the south along its axis to achieve the minimum required height to removeHangar No. 1 from airspace penetration, or realignment of Runway 16-34 to avoid Hangar No. 1. ShiftingRunway 16-34 to the south would result in increased impacts to Buckeye Brook and its associated wetlands, andimpacts to the Top Flight archaeological site. Realignment of Runway 16-34 is constrained by existingobstructions such as the existing Passenger Terminal and the Rhode Island State <strong>Airport</strong> Terminal, aNRHP-listed property. For these reasons, design alternatives to avoid impacts to Hangar No. 1 are not practical.Under Alternative B4, the landscaped entry and the view of the Rhode Island State <strong>Airport</strong> Terminal from<strong>Airport</strong> Road would be impacted, resulting in an adverse effect. Several alternative locations and configurationsfor the Integrated Cargo Facility were evaluated and rejected for safety issues and because of increasedcommunity and environmental impacts. 393 Avoidance of the adverse effect is possible through selecting theNo-Action Alternative, Alternative B2, or consolidating the Integrated Cargo Facility at Hangar No. 2 andeliminating the separate cargo building proposed under Alternative B4.393 See Chapter 7, Section 4(f)/Section 6(f) Evaluation for additional detail on avoidance alternatives.Chapter 5 - Environmental Consequences 5-181 July 2011\\mawatr\ev\09228.00\reports\<strong>FEIS</strong>_Final_July_2011\<strong>PVD</strong>_CH05_Environmental_Cons_JUL_2011.doc
T.F. <strong>Green</strong> <strong>Airport</strong> <strong>Improvement</strong> <strong>Program</strong>Environmental Impact Statement and Final Section 4(f) EvaluationAlternatives that would avoid impacts to historical resources are also discussed and evaluated inChapter 7, Final Section 4(f)/Section 6(f) Evaluation.Archaeological SitesIf Alternative B2 is selected as the Preferred Alternative, the alignment of Fully Relocated <strong>Airport</strong> Road andareas impacted by projects at the Runway 23 End would impact the Double L Site and may impact additionalarchaeological sites. Prior to construction, these areas would be surveyed and any identified archaeological siteswould be evaluated for significance and treated accordingly under Section 106. If a site is determined eligiblefor listing in the NRHP, FAA would further coordinate with RISHPO and NITHPO to review avoidanceoptions. Selecting the No-Action Alternative or Alternative B4 would eliminate the need for a Fully Relocated<strong>Airport</strong> Road.Historical CemeteriesExtending Runway 5 under Alternatives B2 and B4 would place WHC 26 within the ROFA and the headstoneswould have to be laid flat with protection, relocated, or relocated based on other measures determined by theWarwick Historical Cemetery Commission through permitting as a required safety measure. Selecting the No-Action Alternative would eliminate impacts to WHC 26. Realigning Main Avenue under Alternative B4 wouldrequire construction within 25 feet of WHC 77 and WHC 78. Selecting the No-Action Alternative orAlternative B2 would eliminate any impacts to WHC 77 and WHC 78. Redesign of Realigned Main Avenueusing a slower design speed may also eliminate any impacts to WHC 77 and WHC 78. Use of a slower designspeed would require a design exception from RIDOT. For the purposes of this EIS it is assumed that theredesign of Realigned Main Avenue to avoid the cemeteries would be implemented in final design.WHC 76 lies within an area of voluntary land acquisition for <strong>Improvement</strong> <strong>Program</strong>-related noise impacts. Anypotential impact to WHC 76 could be avoided by selecting the No-Action Alternative or by prohibiting anyground disturbances in the 25-foot buffer around the cemetery as established by Rhode Island GeneralLaw 23-18-1 et seq. and Chapter 12.5.8.8.2 MinimizationNo opportunities to minimize the adverse effect of Alternatives B2 and B4 on historical properties have beenidentified. The impacts to Hangar No. 1 resulting in an adverse effect to this historical property and to theeligible airport historic district cannot be avoided. Impacts to the Rhode Island State <strong>Airport</strong> Terminal underAlternative B4 cannot be minimized. There may be additional opportunities to minimize impacts to WHC 26and 77 as design advances. The FAA will continue to consult with the RISHPO on possible mitigation andminimization measures. For details on proposed mitigation, refer to Chapter 6, Mitigation.Chapter 5 - Environmental Consequences 5-182 July 2011\\mawatr\ev\09228.00\reports\<strong>FEIS</strong>_Final_July_2011\<strong>PVD</strong>_CH05_Environmental_Cons_JUL_2011.doc
T.F. <strong>Green</strong> <strong>Airport</strong> <strong>Improvement</strong> <strong>Program</strong>Environmental Impact Statement and Final Section 4(f) Evaluation5.9 Department of Transportation Act: Section 4(f) and Section 6(f) ResourcesThis section summarizes the Section 4(f) resources within the Study Area that could be impacted by the<strong>Improvement</strong> <strong>Program</strong>. Refer to Chapter 7, Final Section 4(f)/Section 6(f) Evaluation, for the complete impactanalysis for Section 4(f) and Section 6(f) resources, including the methodology for determining potential impactsto these resources and an alternatives analysis.5.9.1 Regulatory ContextRefer to Chapter 7, Final Section 4(f)/Section 6(f) Evaluation, Section 7.2, Regulatory Context, for a discussion onregulatory context for Section 4(f) and Section 6(f) resources.5.9.2 Significance ThresholdThe analysis considers impacts of the No-Action Alternative and Alternatives B2 and B4 pursuant to FAAguidance, to gain a full understanding of the Section 4(f) resources in the Project Area and Study Area.5.9.2.1 Finding: Significant Section 4(f) Resources ImpactsAccording to FAA Order 1050.1E, a significant impact would occur pursuant to NEPA when a proposed actioneither involves more than a minimal physical use of a Section 4(f) property or is deemed a “constructive use”substantially impairing the 4(f) property, and mitigation measures do not eliminate or reduce the effects of the usebelow the threshold of significance (Table 5-6). Alternatives B2 and B4 both result in significant impacts toSection 4(f) resources, since the <strong>Improvement</strong> <strong>Program</strong>’s direct impact (physical use) of Section 4(f) resourceswould be more than minimal and its indirect impact (constructive use) substantially impairs Section 4(f) property.5.9.3 MethodologyThe FAA considers the specific criteria to determine whether an action would result in a physical orconstructive use. 394 Refer to Chapter 7, Final Section 4(f)/Section 6(f) Evaluation, Section 7.3, Methodology for adetailed description of these criteria.5.9.4 Impact AssessmentThis section provides a summary of the Section 4(f) resources impact assessment for the No-Action Alternativeand Alternatives B2 and B4 in 2015, 2020, and 2025. Refer to Chapter 7, Final Section 4(f)/Section 6(f) Evaluation,for the complete impact analysis for Section 4(f) and Section 6(f) resources.5.9.4.1 No-Action AlternativeThis section describes impacts to Section 4(f) resources as a result of the No-Action Alternative.Direct ImpactsUnder the No-Action Alternative, Winslow Park, a Section 4(f) recreational resource, would be directly impacted.Winslow Park is a 31.7-acre public recreational park comprised of softball and soccer playing fields, twoplaygrounds, a walking trail/passive recreation area, a concession building with a restroom, and parking, located on394 Environmental Desk Reference for <strong>Airport</strong> Actions, FAA, October 5, 2007.Chapter 5 - Environmental Consequences 5-183 July 2011\\mawatr\ev\09228.00\reports\<strong>FEIS</strong>_Final_July_2011\<strong>PVD</strong>_CH05_Environmental_Cons_JUL_2011.doc
T.F. <strong>Green</strong> <strong>Airport</strong> <strong>Improvement</strong> <strong>Program</strong>Environmental Impact Statement and Final Section 4(f) EvaluationRIAC- and City-owned property primarily within the RPZ of the Runway 5 End. Twenty-six acres of the parklandare in active recreational use. The function of the RPZ is to enhance the protection of people and property on theground. This is achieved through airport owner control over RPZs and includes clearing RPZ areas (and maintainingthem clear) of incompatible objects and activities. At a minimum, RPZs should be clear of facilities and activitieswhich lead to an assembly of people. 395 Under the No-Action Alternative, the active recreational facilities within theRPZ will be removed to enhance safety. The clubhouse, walking path/passive recreational area, three full-sizedsoftball fields, one small softball field, as well as the parking lot adjacent to the smaller softball fields could remainunder the No-Action Alternative because they are outside of the RPZ. Impacts to Winslow Park are described ingreater detail in Chapter 7, Final Section 4(f)/Section 6(f) Evaluation.Indirect ImpactsTables 5-98 and 5-99 summarize predicted day-night sound levels at historical properties and parks andrecreational areas within the Study Area to assess the potential for constructive use of Section 4(f) resources. TheRhode Island State <strong>Airport</strong> Terminal, Hangar No. 1, Hangar No. 2, and the eligible airport historic districtwould experience noise levels above DNL 65 dB (Table 5-98). However, a quiet setting is not a characteristic thatqualifies these resources for inclusion in the NRHP. These historical properties are all on-<strong>Airport</strong> and inaviation-related uses. 14 CFR 150, <strong>Airport</strong> Noise Compatibility Planning, establishes that recreational resources arecompatible with noise levels at DNL 75 db and below. 396 Under the No-Action Alternative, Section 4(f)recreational resources would not experience noise levels above DNL 75 db (Table 5-99). Under the No-ActionAlternative there would be no changes in access or visual setting for any of these properties and therefore therewould be no constructive use of any Section 4(f) properties.Table 5-98Section 4(f) Historical Properties Day-Night Average Sound Levels2015 2020 2025No-Action Alternative No-Action Alternative Alternative No-Action Alternative AlternativeHistorical Property 1 Alternative B4 Alternative B2 B4 Alternative B2 B4Pawtuxet Village HD 58.7 59.3 59.2 60.0 59.8 59.8 60.5 60.3Rhodes (Christopher) HS 59.4 60.0 59.9 60.7 60.5 60.5 61.2 61.0John Waterman Arnold HS 59.9 60.5 60.4 61.1 60.9 61.0 61.6 61.4Hangar No. 1 2 66.1 66.2 66.5 66.5 66.7 67.1 67.1 67.2Rhode Island State <strong>Airport</strong> Terminal 2 64.5 64.7 65.0 65.0 65.2 65.7 65.8 65.9Hangar No. 2 2 69.0 69.0 69.4 69.4 69.4 70.1 70.1 70.0Proposed <strong>Airport</strong> HD 2 67.1 67.2 67.6 67.9 67.5 68.3 68.6 68.2Warwick Civic Center HD 59.7 60.0 59.5 59.5 59.8 60.2 60.1 60.4Apponaug HD 58.8 59.0 58.6 58.6 58.8 59.2 59.2 59.4Caleb <strong>Green</strong>e House 59.1 59.4 58.9 58.9 59.2 59.6 59.5 59.8Cowesett Pound 60.5 61.6 61.0 61.8 62.1 61.5 62.3 62.5Amasa Sprague Estate Stone Walls 54.0 54.4 54.4 54.8 54.8 54.9 55.3 55.2Source: HMMH, 2010.Notes: These Historical Properties are shown on Figure 5-36, 5-37, and 5-38.All readings are DNL ## dB.HD Historic DistrictHS Historic Site1 From the National Register Database and RIGIS.2 Located on <strong>Airport</strong> Property.395 FAA Advisory Circular 150/5300-13 - <strong>Airport</strong> Design, Change 14.396 14 CFR 150, <strong>Airport</strong> Noise Compatibility Planning , Appendix A, Table 1.Chapter 5 - Environmental Consequences 5-184 July 2011\\mawatr\ev\09228.00\reports\<strong>FEIS</strong>_Final_July_2011\<strong>PVD</strong>_CH05_Environmental_Cons_JUL_2011.doc
T.F. <strong>Green</strong> <strong>Airport</strong> <strong>Improvement</strong> <strong>Program</strong>Environmental Impact Statement and Final Section 4(f) EvaluationTable 5-99Section 4(f) Public Parks and Recreation Areas Day-Night Noise Levels (DNL)Land UseCompatibilityGuideline2015 2020 2025Name 1 Property Type (DNL dB) 2 No-Action Alt. B4 No-Action Alt. B2 Alt. B4 No-Action Alt. B2 Alt. B4Adams Playground Playground 75 61.3 61.9 61.8 62.6 62.3 62.4 63.2 62.8Apponaug Park Park 75 59.9 60.2 59.8 59.8 60.0 60.4 60.4 60.6Arnold’s Neck Waterfront Park Park 75 60.2 60.9 60.6 61.2 61.3 61.1 61.6 61.8Arnold’s Pond Beach Beach 75 63.8 64.4 64.4 65.2 64.8 64.9 65.8 65.4George Boyd Field Playfield 3 75 50.3 50.7 50.7 51.0 51.1 51.1 51.4 51.4Gorton Pond Beach 4 Beach 75 60.9 61.3 61.0 61.0 61.4 61.6 61.5 61.9<strong>Green</strong>wood School Playfield Playfield 75 57.6 58.1 58.0 58.2 58.5 58.7 58.8 59.1Groveland Park Park 75 61.5 61.9 62.0 62.0 62.4 62.6 62.6 62.9Holliman School Playfields Playfield 75 61.0 60.7 61.0 60.8 60.6 61.6 61.3 61.2and Tot LotJohn Wickes School Playfield Playfield 75 61.7 63.2 62.2 63.0 63.6 62.9 63.7 64.2Kenney Field Playfield 75 57.5 57.6 58.0 58.3 58.1 58.8 59.1 58.8Lippitt School Playground Playground 75 54.8 55.0 55.2 55.7 55.4 55.9 56.3 56.0Little Pond Beach Beach 75 55.4 55.9 55.8 56.2 56.2 56.2 56.5 56.5Mickey Stevens Sports Complex 4 Recreation Complex 75 53.8 54.0 54.2 54.5 54.3 54.6 54.9 54.7Nausauket School Playfield Playfield 75 58.9 59.5 59.3 59.5 59.8 59.8 59.9 60.3O’Brien Field Playfield Playfield 75 59.9 60.2 59.8 59.7 60.0 60.4 60.3 60.6Pilgrim High School Playfield Playfield 75 63.3 63.5 63.6 63.9 63.8 64.2 64.4 64.3Randall Holden School Playfield Playfield 75 59.3 59.0 59.7 60.2 59.6 60.5 60.9 60.2Sand Pond Beach Beach 75 59.2 58.8 59.5 59.4 59.0 59.4 59.8 59.5Warwick Pond Beach Beach/ Park 75 55.3 55.9 55.7 56.2 56.4 56.5 57.0 57.2Warwick Veterans Memorial Playfield 75 53.4 53.8 53.8 54.2 54.1 54.1 54.5 54.4High School FieldWhittaker Field Playfield 75 58.5 58.9 59.3 59.4 59.3 59.5 59.9 59.8Winslow Park 4 Playfield/Park 75 68.1 72.0 68.4 68.4 72.3 69.0 69.0 72.9Source: HMMH, 2010.Note: Bold indicated significant noise level changes (an increase of at least DNL 1.5 dB at or above DNL 65 dB).1 All resources are located in the City of Warwick.2 14 CFR 150, Noise Compatibility Planning, Appendix A, Table 1.3 Per the City of Warwick 1993 Comprehensive Plan, a playfield is defined as a recreational area dominated by athletic fields for organized team sports.4 Portions of property also a Section 6(f) property.5.9.4.2 Alternative B2The following direct and indirect impacts may occur during the implementation of Alternative B2.Direct ImpactsHangar No. 1, a historical property eligible for listing in the NRHP, would be demolished to enhance safetyresulting in a Section 4(f) physical use of this resource and a use of the eligible airport historic district (becauseHangar No. 1 is a contributing element to the district). In addition, modifications and enhancements torunways and taxiways at the northern end of the airfield would further alter the historical configuration of theairfield.Chapter 5 - Environmental Consequences 5-185 July 2011\\mawatr\ev\09228.00\reports\<strong>FEIS</strong>_Final_July_2011\<strong>PVD</strong>_CH05_Environmental_Cons_JUL_2011.doc
T.F. <strong>Green</strong> <strong>Airport</strong> <strong>Improvement</strong> <strong>Program</strong>Environmental Impact Statement and Final Section 4(f) EvaluationUnder Alternative B2, there would be interior modifications to Hangar No. 2 to accommodate the uses of theintegrated cargo facility. These modifications would not alter the exterior appearance of Hangar No. 2 and,upon further consultation with the RISHPO, the FAA has determined that the proposed interior modificationswould not result in an adverse effect to Hangar No. 2.Alternative B2 would result in the physical use of 21 acres of the park that lie within the RPZ, including 3.6acres of the City-owned portion and 17.4 acres of the RIAC-owned portion. The actively used parkland thatwould be directly impacted includes 10.3 acres of the RIAC-owned portion and 3.6 acres of the City-ownedportion resulting in total direct impacts of 13.9 acres. The recreational facilities that would be removed includeall four full-sized softball fields, the clubhouse, most of the soccer field area, and one playground. The twosmaller softball fields, the parking lot adjacent to the two softball fields, the passive recreational area, and oneplayground could remain. Because Alternative B2 would remove most of the recreational facilities at WinslowPark, including the main playing field areas, this alternative would substantially limit the public’s use andenjoyment of Winslow Park. The impacted recreational areas would be replaced under Alternative B2, whichmay reduce the impact below the threshold of significance.Physical uses of Hangar No. 1, Hangar No. 2, the eligible airport historic district, and Winslow Park aredescribed in greater detail in Chapter 7, Final Section 4(f)/Section 6(f) Evaluation.Indirect ImpactsAlternative B2 would result in constructive use of contributing elements of the eligible airport historic district.The relocation of <strong>Airport</strong> Road would alter the historical context of the eligible airport historic district, and limitthe public’s ability to view and access the district and its contributing elements, including Hangar No. 2 and theRhode Island State <strong>Airport</strong> Terminal. Constructive uses of Hangar No. 2 and the Rhode Island State <strong>Airport</strong>Terminal are described and evaluated in greater detail in Chapter 7, Final Section 4(f)/Section 6(f) Evaluation. Allother historical architectural properties are located at least one mile from the <strong>Airport</strong> and are buffered from anypotential visual impacts.Figures 5-36 shows the location of Section 4(f)-protected historical properties and parks in relation to predictednoise contours for 2015, 2020, and 2025 under Alternative B2. Tables 5-98 and 5-99 summarize predicted daynightsound levels at historical properties and parks and recreational areas within the Study Area to assess thepotential for constructive use of Section 4(f) resources. The Rhode Island State <strong>Airport</strong> Terminal, Hangar No. 1,Hangar No. 2, and the eligible airport historic district would experience noise levels above DNL 65 dB.However, a quiet setting is not a characteristic that qualifies these resources for inclusion in the NRHP. Thesehistorical properties are all on-<strong>Airport</strong> and in aviation-related uses. Therefore, Alternative B2 would not resultin a constructive use of historical properties due to noise.As shown on Table 5-99, no recreational areas protected under Section 4(f) would experience a change in noiselevels in 2020 or 2025 that would be incompatible with outdoor recreation use (above DNL 75 dB). Therefore,there would be no constructive use of Section 4(f) recreational areas under Alternative B2 due to noise. UnderAlternative B2, there would be no changes in access to parks and recreational areas that would result inconstructive use.Chapter 5 - Environmental Consequences 5-186 July 2011\\mawatr\ev\09228.00\reports\<strong>FEIS</strong>_Final_July_2011\<strong>PVD</strong>_CH05_Environmental_Cons_JUL_2011.doc
T.F. <strong>Green</strong> <strong>Airport</strong> <strong>Improvement</strong> <strong>Program</strong>Environmental Impact Statement and Final Section 4(f) EvaluationSignificant Impacts: Alternative B2 would result in a physical use (removal) of Hangar No. 1, a contributingelement of the eligible airport historic district. In addition to the removal of Hangar No. 1, Alternative B2 alsocalls for airside modifications that will further alter the overall historical configuration of the runways andtaxiways that are included as contributing elements to the eligible airport historic district resulting in a physicaluse of the district. The relocation of <strong>Airport</strong> Road would impact the setting and public view and access toHangar No. 2 and the Rhode Island State <strong>Airport</strong> Terminal resulting in a constructive use. City owned propertywith recreational areas within Winslow Park would be converted to aviation-related use resulting in a physicaluse of a public recreational resource.5.9.4.3 Alternative B4The following direct and indirect impacts may occur during the implementation of Alternative B4.Direct ImpactsHangar No. 1, a historical property eligible for listing in the NRHP, would be demolished to enhance safety,resulting in a Section 4(f) physical use of this resource and a use of the eligible airport historic district (becauseHangar No. 1 is a contributing element to the district). In addition, modifications and enhancements torunways and taxiways at the northern end of the airfield would further alter the historical configuration of theairfield.Alternative B4 would also impact the Rhode Island State <strong>Airport</strong> Terminal, a historical property listed in theNRHP. Alternative B4 would avoid the terminal building but would eliminate part of the front (landside) lawnof the historical property. This impact would result in a physical use due to the loss of landscaping and thehistorical entry to the terminal building and would change the terminal building’s setting. In addition, the newIntegrated Cargo building would be positioned between the terminal building and Partially Relocated <strong>Airport</strong>Road, which would eliminate landside views of the terminal building from a public way (<strong>Airport</strong> Road).Under Alternative B4, there would be interior modifications to Hangar No. 2 to accommodate the uses of theintegrated cargo facility. These modifications would not alter the exterior appearance of Hangar No. 2 and,upon further consultation with the RISHPO, the FAA has determined that the proposed interior modificationswould not result in an adverse effect to Hangar No. 2.Alternative B4 would result in the physical use of 20.8 acres of Winslow Park that lie within the RPZ, including2.8 acres of the City-owned portion and 18 acres of the RIAC-owned portion, as identified on Figure 7-6. Theactively used parkland that would be directly impacted includes 10.6 acres of the RIAC-owned portion and 2.7acres of the City-owned portion resulting in total direct impacts of 13.3 acres (Figure 7-6). Under Alternative B4,improvements related to Realigned Main Avenue would directly impact the parking lot near the smalleducational softball fields on Bedford Avenue and the northwest section of the soccer fields. Under AlternativeB4, the recreational facilities that would be removed include all four full-sized softball fields, the clubhouse,most of the soccer field area, and one playground. The impacted recreational areas would be replaced underAlternative B4.Chapter 5 - Environmental Consequences 5-187 July 2011\\mawatr\ev\09228.00\reports\<strong>FEIS</strong>_Final_July_2011\<strong>PVD</strong>_CH05_Environmental_Cons_JUL_2011.doc
T.F. <strong>Green</strong> <strong>Airport</strong> <strong>Improvement</strong> <strong>Program</strong>Environmental Impact Statement and Final Section 4(f) EvaluationImpacts to the eligible airport historic district, Hangar No. 1, Hangar No. 2, and Winslow Park are alsodescribed in Chapter 7, Final Section 4(f)/Section 6(f) Evaluation.Indirect ImpactsFigures 5-37 and 5-38 show the location of Section 4(f)-protected historical properties and parks in relation topredicted noise contours for Alternative B4 in 2015, and 2020 and 2025, respectively. Alternative B4 would notresult in constructive uses of historical properties due to noise impacts. The Rhode Island State <strong>Airport</strong>Terminal, Hangar No. 1, Hangar No. 2, and the eligible airport historic district would experience noise levelsabove DNL 65 dB (Table 5-98). However, a quiet setting is not a characteristic that qualifies these resources forinclusion in the NRHP. These historical properties are all on-<strong>Airport</strong> and in aviation-related uses.Alternative B4 would not result in a change of setting for Hangar No. 2. As <strong>Airport</strong> Road would not be fullyrelocated under Alternative B4, the public's view of Hangar No. 2 would not be obstructed under thisAlternative. All other historical architectural properties are located at least one mile from the <strong>Airport</strong> and arebuffered from any potential visual impacts.Results from the GIS mapping and noise analysis indicate that Winslow Park would experience a significantchange in noise levels (an increase of at least DNL 1.5 dB at or above DNL 65 dB) in 2015, 2020 and 2025 underAlternative B4 (Table 5-99). However, the increased noise levels at what is left of Winslow Park would not beconsidered a constructive use because the noise levels would still be below DNL 75 dB, which is a noise levelconsidered compatible with outdoor recreational use. 397 Therefore, there are no constructive uses of Section 4(f)parks or recreation areas under Alternative B4 due to noise. Under Alternative B4, there would be no changes inaccess to parks and recreational areas that would result in constructive use.Significant Impacts: Alternative B4 would result in a physical use (removal) of Hangar No. 1, a contributingelement of the eligible airport historic district. In addition to the removal of Hangar No. 1, Alternative B4 alsocalls for airside enhancements that will further alter the overall historical configuration of the runways andtaxiways that are included as contributing elements to the eligible airport historic district resulting in a physicaluse of the district. Construction of the new Integrated Cargo Facility under Alternative B4 would directlyimpact the landscaping of the Rhode Island State <strong>Airport</strong> Terminal resulting in a physical use. City ownedrecreational areas within Winslow Park would be converted to aviation-related use resulting in a physical use ofa public recreational resource.5.9.4.4 Summary of Non-Impacted Section 4(f) ResourcesThe following Section 4(f)-protected historical resources within the Study Area would not be used as a result ofthe No-Action Alternative or Alternatives B2 and B4:• Pawtuxet Village Historic District• Rhodes (Christopher) Historic Site• John Waterman Arnold Historic Site397 Table 1-Land Use Compatibility with Yearly Day-Night Average Sound. FAA Order 1050.1E, March 20, 2006, page A-15.Chapter 5 - Environmental Consequences 5-188 July 2011\\mawatr\ev\09228.00\reports\<strong>FEIS</strong>_Final_July_2011\<strong>PVD</strong>_CH05_Environmental_Cons_JUL_2011.doc
T.F. <strong>Green</strong> <strong>Airport</strong> <strong>Improvement</strong> <strong>Program</strong>Environmental Impact Statement and Final Section 4(f) Evaluation• Warwick Civic Center Historic District• Apponaug Historic District• Caleb <strong>Green</strong>e House• Cowesett Pond• Amasa Sprague Estate Stone WallsThese historical properties would not be impacted by any of the alternatives. There would be no constructiveuses of these resources because the noise impacts would not be significant. These historical properties arelocated at least one mile from the <strong>Airport</strong> and are buffered from any potential visual impacts.The following Section 4(f)-protected recreational resources within the Study Area would not be used under theNo-Action Alternative or Alternatives B2 and B4:• Adams Playground• Apponaug Park• Arnold’s Neck Waterfront Park• Arnold’s Pond Beach• George Boyd Field• Gorton Pond Beach• <strong>Green</strong>wood School Playfield• Groveland Park• Holliman School Playfields and Tot Lot• John Wickes School Playfield• Kenney Field• Lippitt School Playground• Little Pond Beach• Mickey Stevens Sports Complex• Nausauket School Playfield• O’Brien Field Playfield• Pilgrim High School Playfield• Randall Holden School Playfield• Sand Pond Beach• Warwick Pond Beach• Warwick Veterans Memorial High School Field• Whittaker FieldThese recreational resources would not be impacted by the <strong>Improvement</strong> <strong>Program</strong>. Under the No-ActionAlternative and Alternatives B2 and B4, there would be no constructive uses of these parks because the noiselevels would be compatible with outdoor recreational uses and there would be no visual impacts or changes toaccess. While the John Wickes playfield and Mickey Stevens Sports Complex are both located within the ProjectArea, there would be no direct impacts (incorporation of land from these properties into the project) or indirectimpacts due to noise or access restrictions.5.9.5 Conversion of 6(f) ResourcesAs described in Chapter 4, Affected Environment, L&WCFA funds were used to upgrade recreational facilitiesCity-owned property at Winslow Park, which would be impacted by Alternatives B2 and B4. The FAA, RIACand the City of Warwick have coordinated with the NPS to determine the boundary of the Section 6(f) portionof the park. As described further in Chapter 7, Final Section 4(f)/Section 6(f) Evaluation, the City of Warwick inconsultation with the NPS will resolve the conversion of the Section 6(f) property should the T.F. <strong>Green</strong> <strong>Airport</strong><strong>Improvement</strong> <strong>Program</strong> move forward. There are no other Section 6(f) resources that would be impacted by theT.F. <strong>Green</strong> <strong>Airport</strong> <strong>Improvement</strong> <strong>Program</strong>.Chapter 5 - Environmental Consequences 5-189 July 2011\\mawatr\ev\09228.00\reports\<strong>FEIS</strong>_Final_July_2011\<strong>PVD</strong>_CH05_Environmental_Cons_JUL_2011.doc
T.F. <strong>Green</strong> <strong>Airport</strong> <strong>Improvement</strong> <strong>Program</strong>Environmental Impact Statement and Final Section 4(f) Evaluation5.9.6 Comparison of Alternatives B2 and B4 – Significant ImpactsThis section compares the impacts to Section 4(f) resources that would result from Alternative B2 and B4.Each Alternative would result in direct and indirect impacts to historical and recreational resources, resulting in ause of a property protected under Section 4(f) and a significant impact under NEPA. Table 7-2 of Chapter 7, FinalSection 4(f)/Section 6(f) Evaluation, presents a comparison of the impacts and proposed mitigation Section 4(f)properties for each alternative. Alternatives B2 and B4 would result in physical use of a Section 4(f) recreation area(Winslow Park). The impacted park facilities would be replaced through mitigation. Alternatives B2 and B4 bothwould result in the physical use of one property (Hangar No. 1) and one historic district eligible for listing in theNRHP. Alternative B4 would result in a physical use of one property listed in the NRHP (Rhode Island State<strong>Airport</strong> Terminal). Alternative B2 would result in the constructive use of one property listed in the NRHP (RhodeIsland State <strong>Airport</strong> Terminal) and one property eligible for listing in the NRHP (Hangar No. 2).5.9.7 Avoidance, Minimization, and MitigationChapter 7, Final Section 4(f)/Section 6(f) Evaluation, contains a detailed analysis of alternatives evaluated to avoiduse of Section 4(f) resources and proposed mitigation for impacts that would be unavoidable underAlternatives B2 and B4.5.10 Wetlands and WaterwaysThis section provides an overview of the analysis of the impacts to existing wetlands and waterways andincludes the methodology for determining the potential impacts to these resources. It also describes measurestaken to avoid and minimize wetland impacts incorporated into the design of Alternatives B2 and B4.5.10.1 Regulatory ContextExecutive Order 11990, Protection of Wetlands, 398 requires federal agencies to “avoid to the extent possible the longtermand short-term adverse impacts associated with the destruction or modification of wetlands and to avoid director indirect support of new construction in wetlands wherever there is a practicable alternative.” The Clean Water Act(CWA; formally, the Federal Water Pollution Control Act, as amended, 33 USC section 1251, et seq.) maintains andrestores the physical, biological, and chemical integrity of the nation’s waters. The Fish and Wildlife Coordination Act(as amended, 16 USC section 661, et seq.) requires federal agencies to consider U.S. Fish and Wildlife Service (USFWS)and state wildlife agency comments on action impacts on wildlife. The United States Army Corps of Engineers(USACE) has jurisdiction over Waters of the United States, which includes waterways and adjacent wetlands,through Section 404 of the Clean Water Act. Waters of the United States include “all waters which are used, or wereused in the past, or may be susceptible to use in interstate or foreign commerce, including all waters which are subjectto the ebb and flow of the tide; all interstate waters, including interstate wetlands; and all other waters such asintrastate lakes, rivers, streams (including intermittent streams), mudflats, sand flats, wetlands, sloughs, prairiepotholes, wet meadows, playa lakes, natural ponds, or drainage ditches leading to regulated Waters of the U.S., thedegradation or destruction of which could affect interstate or foreign commerce.” 399Wetlands and waterways are also addressed in accordance with the provisions of the Rhode Island Fresh WaterWetlands Act and Rules and Regulations Governing the Administration and Enforcement of the Fresh Water Wetlands398 Executive Order 11990, Protection of Wetlands, 42 Federal Register 26961, May 24, 1977.399 33 CFR Part 328, Definition of Waters of the United States.Chapter 5 - Environmental Consequences 5-190 July 2011\\mawatr\ev\09228.00\reports\<strong>FEIS</strong>_Final_July_2011\<strong>PVD</strong>_CH05_Environmental_Cons_JUL_2011.doc
T.F. <strong>Green</strong> <strong>Airport</strong> <strong>Improvement</strong> <strong>Program</strong>Environmental Impact Statement and Final Section 4(f) EvaluationAct (also known as the RIDEM Rules). 400 In addition to several specific review criteria, the RIDEM Rules wouldnot allow an action that results in an alteration of wetlands that is either unnecessary or undesirable. According tothe RIDEM Rules, an alteration is unnecessary unless it is essential, vital, or indispensable to the project andcannot be avoided by exhausting all other non-wetland alternatives. An undesirable alteration “is any alterationto freshwater wetlands that individually or cumulatively may reduce or degrade any freshwater wetlandfunctions and values as set forth herein, which does not avoid and minimize to the maximum extent possibleany damaging effects on wetland functions and values, or does not satisfy the review criteria in Rule 10.05.”According to the Rhode Island Fresh Water Wetlands Act and the RIDEM Rules, perimeter and riverbankwetlands, which are dimensional offsets from the edges of certain wetland types and stream and river channels,along with floodplains are also regulated as Freshwater Wetlands.5.10.2 Significance ThresholdThe analysis considers impacts of the No-Action and Alternatives B2 and B4 to wetlands resources in the ProjectArea and Study Area, pursuant to FAA’s guidance.5.10.2.1 Finding: Significant Wetlands and Waterways Resources ImpactsBoth Alternatives B2 and B4 would result in significant impacts to wetlands, as 5.8 acres or 5.0 acres would befilled, respectively. The filled wetland areas would be substantially modified and would not sustain the existingwetland functions and values. These losses would be offset through a compensatory wetland mitigationprogram consisting of restoration of filled wetlands, creation of new wetland in existing uplands, wetlandenhancement, and wetland and upland buffer preservation as described in Chapter 6, Mitigation.In accordance with the FAA Order 1050.1E, an action would result in a significant impact to wetlands if it:• Adversely affects a wetland’s functions to protect the quality or quantity of a municipal water supply,including sole source and potable water aquifers.• Substantially alters hydrology needed to sustain affected wetland values and functions or those of awetland to which it is connected.• Substantially reduces the affected wetland’s ability to retain floodwater or storm runoff, thereby threateningpublic health, safety, or welfare.• Adversely affects the maintenance of natural systems supporting wildlife and fish habitat or economicallyimportant timber, food, or fiber resources in the affected or surrounding wetlands.• Promotes development of secondary activities or services that causes any of the above impacts.• Is inconsistent with applicable state wetland strategies.According to these criteria, the wetland impacts for both Alternatives B2 safety and efficiency enhancementsand Alternative B4 safety enhancements would be considered significant.400 Rules and Regulations Governing the Administration and Enforcement of the Freshwater Wetlands Act, RIDEM, December 2010.Chapter 5 - Environmental Consequences 5-191 July 2011\\mawatr\ev\09228.00\reports\<strong>FEIS</strong>_Final_July_2011\<strong>PVD</strong>_CH05_Environmental_Cons_JUL_2011.doc
T.F. <strong>Green</strong> <strong>Airport</strong> <strong>Improvement</strong> <strong>Program</strong>Environmental Impact Statement and Final Section 4(f) Evaluation5.10.3 MethodologyThis section defines how significant direct, indirect, temporary, and cumulative impacts to wetlands within theStudy Area are identified.5.10.3.1 Direct Impacts MethodologyDirect permanent and temporary wetland impacts include wetland fill, vegetation removal, dredging, andwatercourse relocation or alteration, that result in a loss of existing wetlands area, function and/or value.Temporary impacts involve short-term disturbance to wetlands and waterways during construction.The potential direct impacts to wetlands and waterways were evaluated by overlaying the grading limits ofAlternatives B2 and B4 on base mapping depicting the wetlands and waterways. Impacts associated withvegetation removal in areas where no fill would be placed have not been determined at this time, butalternatives with greater wetland fill generally would have greater impacts associated with vegetation removal.Wetland impacts reported in this <strong>FEIS</strong> refer to areas where fill would be placed in federal jurisdictionalwetlands, which are referred to as “vegetated wetlands” under the RIDEM Rules.Fill and grading impacts to perimeter and riverbank wetlands, dimensional setbacks from vegetated wetlands,rivers and streams which are only subject to state regulation, have also been calculated for Alternatives B2and B4. These impacts were calculated by first preparing an existing conditions plan depicting perimeter andriverbank wetlands using wetland classifications provided in 2004 in RIDEM correspondence to RIAC. 401 Thelimits of work for Alternatives B2 and B4 were then overlaid on this plan to determine the additional area ofstate-regulated perimeter and riverbank wetland where construction would occur.The limits of state-regulated floodplains have been identified using a model presented in Section 5.14,Floodplains. Floodplain limits that extended beyond the limits of vegetated, perimeter, and riverbank wetlandswere identified by overlaying floodplain limits onto the plan prepared to identify work limits in perimeter andriverbank wetlands described in the previous paragraph.The state-regulated wetland impacts areas reported in this document only include areas impacted by airportenhancement activities under Alternatives B2 and B4. It does not include the impacts associated with thewetland mitigation developed to offset project-related losses to wetland functions and values. The RIDEMFreshwater Wetlands application for airport safety enhancements involving work within wetlands would alsoinclude calculations for wetland areas altered to conduct the required wetland mitigation activities. Thesestate-impact calculations are not included in the direct impact methodology as these activities are consideredmitigation by federal regulators.5.10.3.2 Indirect Impacts MethodologyIndirect impacts to wetlands may occur when wetland hydrology is altered as a result of new impervioussurfaces in a watershed, new or modified drainage patterns, or as a result of a direct wetland impact such asplacement of wetland fill. Other indirect effects could include impacts to the wetland wildlife habitat functionthrough fragmentation, alterations at the edges of resources, such as changes in species composition, and401 Letter from RIDEM to RIAC re: T.F. <strong>Green</strong> <strong>Airport</strong> dated September 24, 2004.Chapter 5 - Environmental Consequences 5-192 July 2011\\mawatr\ev\09228.00\reports\<strong>FEIS</strong>_Final_July_2011\<strong>PVD</strong>_CH05_Environmental_Cons_JUL_2011.doc
T.F. <strong>Green</strong> <strong>Airport</strong> <strong>Improvement</strong> <strong>Program</strong>Environmental Impact Statement and Final Section 4(f) Evaluationincreased levels of disturbance. Modifications to wetland hydrology can alter the extent of wetlands and/orperformance of functions and values provided by wetlands.Without mitigation, stormwater runoff may also affect water quality in wetlands or may result in the depositionof sediments from roads, such as sand. The stormwater management strategy for the airport enhancements isdescribed in Section 5.11, Water Quality. Indirect impacts also include reasonably foreseeable changes that couldaffect wetland functions and values associated with the implementation of the <strong>Improvement</strong> <strong>Program</strong>,including secondary development that may occur within the Study Area. Indirect impacts were assessed byreviewing plans prepared to assess direct impacts along with existing documents including the <strong>Airport</strong>Vegetation Management <strong>Program</strong> 402 (VMP) and Wildlife Hazard Management Plan 403 (WHMP), and datacollected for this <strong>FEIS</strong> in Chapter 4, Affected Environment, Section 4.9, Wetlands and Waterways.5.10.3.3 Short-Term Impacts from Temporary Construction Activities MethodologyShort-term impacts from temporary construction activities could potentially include effects such as thedisruption of wetland-dependent wildlife utilization of wetland habitats adjacent to construction activity, directimpact to wetland vegetation to install buried communication conduit, and increased soil erosion andsedimentation rates when soils are disturbed during the work activities proposed within or adjacent to wetlandswere evaluated to identify potential impacts and mitigation measures.5.10.3.4 Cumulative Impacts MethodologyCumulative impacts were determined for the Study and Project Areas for the time frame between 1939 and 2006and the 2025 planning horizon. Cumulative impacts were assessed using aerial photographs taken in 1939,which were chosen as the earliest set of available photographs with adequate quality (resolution) for evaluation.Cumulative impacts include previous wetland impacts, additional impacts that would result from AlternativesB2 and B4, and any other anticipated reasonably foreseeable changes in the Study Area, including any impactsthat would occur as a result of the No-Action Alternative.5.10.4 Impact AssessmentThis section summarizes the direct, indirect, and short-term construction-related wetland impacts for eachAlternative which are compared to the No-Action Alternative. For direct impacts, impact areas are reported forfederal-regulated wetlands and state/local-regulated wetlands. As described in Section 4.9, Wetlands andWaterways, of Chapter 4, Affected Environment, much of the state-regulated perimeter and riverbank wetlandswithin the Project Area are previously developed and include existing runway areas, the Perimeter Road, andgrassed infield areas (Figures 5-39 and 5-40).5.10.4.1 No-Action AlternativeThis section describes the direct and indirect wetland impacts for the No-Action Alternative. There are noshort-term construction-related impacts to wetlands or waterways due to the No-Action Alternative.Direct ImpactsDirect impacts associated with the No-Action Alternative without stormwater management include activitiesassociated with implementing the routine VMP, WHMP, and the construction projects previously noted in402 Vegetation Management <strong>Program</strong> Rhode Island <strong>Airport</strong> Corporation, Revised April 2009.403 Wildlife Hazard Management Plan, Rhode Island <strong>Airport</strong> Corporation, Revised February 3, 2006.Chapter 5 - Environmental Consequences 5-193 July 2011\\mawatr\ev\09228.00\reports\<strong>FEIS</strong>_Final_July_2011\<strong>PVD</strong>_CH05_Environmental_Cons_JUL_2011.doc
T.F. <strong>Green</strong> <strong>Airport</strong> <strong>Improvement</strong> <strong>Program</strong>Environmental Impact Statement and Final Section 4(f) EvaluationSection 5.1.1.1, No-Action Alternative. Refer to Chapter 3, Alternatives Analysis, for a description of the plannedactions that are taken into account with the No-Action Alternative. All construction projects would be located inupland areas and would not directly alter wetlands.The VMP includes the periodic cutting and removal of woody vegetation within wetlands and uplands thatmay interfere with FAR Part 77 navigable airspace and frequent airfield mowing to prevent the development ofvegetation that could provide wildlife cover. The WHMP includes other actions taken to deter wildlife fromutilizing areas, on- and off-<strong>Airport</strong> property, where a risk of collision with aircraft could be created.Indirect ImpactsOngoing, as well as new discharges of stormwater runoff on the <strong>Airport</strong> could contribute to erosion if notmitigated in stream channels (Tributary A11 and Tributary A) and within Wetlands A11 and A13 south ofRunway 34. Erosion would result in the movement of soil and debris, which could deposit sediment indownstream Wetlands A10 and A13 (Figure 5-40).5.10.4.2 Alternative B2This section summarizes the direct, indirect, and short-term construction-related wetland impacts forAlternative B2. Table 5-100 provides information on the impacts to wetland functions and values. Table 5-101provides an overview of waterway impacts by program element. Table 5-102 provides detailed information onimpacts to federal jurisdictional vegetated wetlands while Table 5-103 provides information on impacts to stateregulatedwetlands.Direct ImpactsAlternative B2 would directly impact a total of 5.8 acres of federal jurisdictional vegetated wetlands, 773 linearfeet of waterways, and approximately 12.5 acres of state-regulated perimeter and riverbank wetland. Impacts tofederal jurisdictional wetlands have been reduced by 1.7 acres from the total 7.5 acres reported in the DEISthrough avoidance and minimization measures. Refer to Section 5.10.8, Avoidance and Minimization, presentedbelow. Much of the state-regulated perimeter or riverbank wetland area has been previously developed. Theimpacted wetlands are shown in Figures 5-39 and 5-40. There would be no wetland impacts associated with theRunway 5 End nor for the Runway 16 End and Partially Relocated <strong>Airport</strong> Road.Runway 34 EndSafety enhancements to Runway 34, including Taxiway C, would impact five wetlands at the Runway 34 End andrequire that part of a low quality intermittent stream (Tributary A11) be placed in a culvert at two locations andone stream segment be relocated. Direct impacts to Buckeye Brook below Warwick Pond would be completelyavoided. Minor impact to Wetland A10 (0.1 acres), which provides wildlife habitat, fish and shellfish habitat,nutrient removal/retention/transformation and floodflow alteration at the principal level, would be limited to theinstallation of new navigational aids. Most of the impacts under Alternative B2 would occur in Wetland A6(1.6 acres) and Wetland A11 (0.6 acres), which both provide groundwater recharge/discharge (Table 5-100).Approximately 0.1 acres of Wetland A8 closest to existing Runway 34 would be altered. This wetland providesnutrient removal/retention/transformation and floodflow alteration functions. Additional avoidance andminimization measures incorporated into glide slope area design and Perimeter Road layout reduced impacts toWetland A8 by 1.4 acres from that reported in the DEIS. Impacts to Wetland A13, which is mostly dominated byPhragmites (common reed), would be mostly avoided (0.1 acres). Approximately 2.5 acres of federal-regulatedChapter 5 - Environmental Consequences 5-194 July 2011\\mawatr\ev\09228.00\reports\<strong>FEIS</strong>_Final_July_2011\<strong>PVD</strong>_CH05_Environmental_Cons_JUL_2011.doc
T.F. <strong>Green</strong> <strong>Airport</strong> <strong>Improvement</strong> <strong>Program</strong>Environmental Impact Statement and Final Section 4(f) Evaluation(vegetated) wetland would be filled and an additional 4.9 acres of state-regulated perimeter and riverbankwetland would be altered by the Runway 34 End safety enhancements.Table 5-100Alternative B2: Summary of Impacted Wetland Functions and ValuesWetland Wetland Wetland Functions and Values (USACE, RIDEM)<strong>Program</strong> Wetland Impact Area GWR/D S/T/P R NR/R/TWLH T&E U/H VQ/AElement ID (ac) (ac) SWGW FFA WQ WQ PE S&S S F&SH WWH AES REC ED/SV AES AESRunway 23 A2 0.0 1 7.6 P X X X PA3 0.0 12.9 P P X P X X XA4 0.0 1 4.4 P X X X XA5 1.5 14.5 X X X P P XRunway 34 A6 1.6 3.1 XA8 0.1 16.3 X P P X XA10 0.1 25.6 X P P X X P P X XA11 0.6 2.7 XA13 0.1 19.4 P P P XFully A2 1.1 7.6 X X X X PRelocated A3 0.1 12.9 P P X P X X X<strong>Airport</strong> I 0.5 15.3 X P P XRoad P 0.1 17.1 P P P XSources: Functions and Values from USACE and RIDEM. F&S H Fish and Shellfish Habitat.P Principal Wetland Function or Value. WLH Wildlife Habitat.X Additional Wetland Function or Value likely provided by wetland. WWH Wildlife and Wildlife Habitat.GWR/D Groundwater Recharge/Discharge. T&E SH Threatened and Endangered Species Habitat.SWGW Surface Water and Groundwater. REC Recreation.FFA Floodflow Alteration. ED/SV Educational/Scientific Value.S/T/P R Sediment/Toxicant/Pathogen Retention. U/H Uniqueness/Heritage.NR/R/T Nutrient Removal/Retention/Transformation. AES Aesthetic.WQ Water Quality. VQ/A Visual Quality/Aesthetics.PE Production Export. 1 Temporary impacts totaling less than 0.1 acres to install conduit belowS&S S Sediment and Shoreline Stabilization. streambed for navigational aids. These areas would be restored in place.Runway 23 EndUnder Alternative B2, a portion of Wetland A5 would be filled to create the glide slope critical area and ROFAassociated with the Runway 23 End, south of existing <strong>Airport</strong> Road. The new Perimeter Road would be locatedaround the ROFA on the top of this proposed new fill. The existing access route to the AMF would have to beabandoned under Alternative B2 as it would be located within the new ROFA. Under Alternative B2, theexisting 70-foot long Buckeye Brook culvert shared by Lake Shore Drive and an <strong>Airport</strong> security road would beextended by 30 feet to allow a new AMF Access Road to be constructed over the existing security road. Whilegenerally following the alignment of the existing unimproved road, AMF access road construction would fillwetlands and relocate approximately 112 linear feet of Buckeye Brook. In total, approximately 1.5 acres ofWetland A5 would be filled for efficiency enhancements at the Runway 23 End and 142 linear feet of BuckeyeBrook would be altered by relocation or placement in a culvert extension. This wetland provides wildlife habitatand fish and shellfish habitat as principal functions (Table 5-100).Depending on the installation method chosen, small temporary impacts to Upper Buckeye Brook (Wetland A4)and the Spring <strong>Green</strong> Pond Inlet stream (Wetland A2) may also occur to install an electrical conduit tonavigational aids north of <strong>Airport</strong> Road. The conduit would be installed underneath the streambeds and anyareas disturbed would be immediately restored in place.Chapter 5 - Environmental Consequences 5-195 July 2011\\mawatr\ev\09228.00\reports\<strong>FEIS</strong>_Final_July_2011\<strong>PVD</strong>_CH05_Environmental_Cons_JUL_2011.doc
T.F. <strong>Green</strong> <strong>Airport</strong> <strong>Improvement</strong> <strong>Program</strong>Environmental Impact Statement and Final Section 4(f) EvaluationFully Relocated <strong>Airport</strong> RoadUnder Alternative B2, <strong>Airport</strong> Road would be fully relocated north of its present location impacting approximately1.8 acres of federal-regulated vegetated wetland and 2.4 acres of state-regulated perimeter and riverbank wetland(Figure 5-39). Most of the impact to federal-regulated vegetated wetland (1.1 acres) would occur in Wetland A2,which provides wetland wildlife habitat as a principal function and Wetland I (0.5 acres), which receivesstormwater runoff from two state highways and provides sediment/toxicant/pathogen retention and nutrientremoval/retention/transformation as principal functions. The remaining impact occurs along the margins ofWetland A3 (0.1 acre) where a drainage outfall would be constructed at Spring <strong>Green</strong> Pond and the margins ofWetland P (0.1 acre) where a retaining wall would be constructed to accommodate a new turning lane at theintersection of Warwick Avenue and Fully Relocated <strong>Airport</strong> Road (Tables 5-101 and 5-102). Most of the perimeterwetland impact at this new intersection would consist of paved sections of Warwick Avenue. Table 5-103 listsstate-regulated freshwater wetlands impacted by Alternative B2.Significant Impacts: Under Alternative B2, approximately 5.8 acres of federal jurisdictional vegetated wetlandand approximately 773 linear feet of waterways would be altered by fill placement, affecting wetlands thatprovide six principal wetland functions. Principal wetlands functions that would be impacted include fish andshellfish habitat, wildlife habitat, nutrient removal/retention/transformation, floodflow alteration,sediment/toxicant/pathogen retention, and groundwater recharge/discharge. These impacts would meet theFAA standard of significance as the filled wetland areas would be substantially modified and would not sustainthe existing wetland functions and values.Table 5-101Alternative B2: Wetland Impacts by <strong>Program</strong> Element (acres)Wetland ID A1 A2 A3 A4 A5 A6 A7 A8 A9 A10 A11 A12 A13 I P TotalWetland Size 3.1 7.6 12.9 4.4 14.5 3.1 85.6 16.3 0.5 25.6 2.7 3.5 19.4 15.3 17.1 231.6<strong>Program</strong> ElementRunway 16 0 0 0 0 0 0 0 0 0 0 0 0 0 0 0 0Runway 34 0 0 0 0 0 1.6 0 0.1 0 0.1 0.6 0 0.1 0 0 2.5Runway 5 0 0 0 0 0 0 0 0 0 0 0 0 0 0 0 0Runway 23 0 0 1 0 0 1 1.5 0 0 0 0 0 0 0 0 0 0 1.5Partially 0 0 0 0 0 0 0 0 0 0 0 0 0 0 0 0Relocated<strong>Airport</strong> RoadFully Relocated 0 1.1 0.1 0 0 0 0 0 0 0 0 0 0 0.5 0.1 1.8<strong>Airport</strong> RoadTotal 0 1.1 0.1 0 1.5 1.6 0 0.1 0 0.1 0.6 0 0.1 0.5 0.1 5.81 Temporary impact of less than 0.1 acres to install conduit for navigational aids. The impacted areas within these wetlands would be restored in place.Chapter 5 - Environmental Consequences 5-196 July 2011\\mawatr\ev\09228.00\reports\<strong>FEIS</strong>_Final_July_2011\<strong>PVD</strong>_CH05_Environmental_Cons_JUL_2011.doc
T.F. <strong>Green</strong> <strong>Airport</strong> <strong>Improvement</strong> <strong>Program</strong>Environmental Impact Statement and Final Section 4(f) EvaluationTable 5-102Alternative B2: Federal Wetland Areas ImpactedWetland IDEmergent(acres)Emergent(Phragmites)(acres)Scrub-shrub(acres)Forested(acres)Total(acres)Waterway (linearfeet)A2A3A4A5A6A8A10A11A13IP00000.90.100.400000000.30000.10000.10 200.400.100001.1001.50000.200.50.11.10.101.51.60.10.10.60.10.50.1121 100142 3000510 4000Total 1.4 0.4 0.6 3.4 5.8 7731 The 121 linear feet of intermittent would be in culvert under Fully Relocated <strong>Airport</strong> Road. A small temporary impact to Spring <strong>Green</strong> Pond Inlet stream may alsooccur to install conduit for navigational aids beneath the streambed.2 Temporary impact of less than 0.1 acres to install conduit for navigational aids beneath this wetland and streambed. This area would be restored in place.3 Buckeye Brook, approximately 30-linear feet would be placed in culvert and 112-linear feet of existing channel relocated.4 Approximately 340-linear feet of intermittent stream would be placed within new culvert, and 170-linear feet would be relocated to a new channel.NB: Cover types with impact areas less than 0.05 acres are included in the area of the principal cover type impacted.Table 5-103 Alternative B2: State-Regulated Freshwater Wetland Types Impacted 1Swamp Pond/Wetland Complex River/StreamWetland ID (acres) (acres) (linear feet)A2 1.1 2 0 121A3 0 0.1 0A4 0 2 0 0A5 1.5 0 142 3A6 1.6 0 0A8 0.1 0 0A10 0.1 0 0A11 0.6 0 510 4A13 0.1 0 0I 0.5 0 0P 0.1 0 0Total 5.7 0.1 7731 There would be approximately 12.5 acres of additional impact to riverbank and/or perimeter wetland not reported in this table. These resource areas aredimensional setbacks from vegetated wetlands, streams and/or rivers. Overlap among these “buffers” from proximate wetlands preclude an accounting to eachwetland or watercourse. An additional 0.2 acres of floodplain outside of other state-regulated freshwater wetlands would also be impacted based on the HEC RASmodel prepared to identify state-regulated floodplain. Impacts to this state-regulated floodplain are considered in Section 5.14, Floodplains.2 There would also be temporary impact of less than 0.1 acres to install conduit for navigational aids below wetland and streambeds in these two wetlands. Thetemporary impact areas would be restored in place.3 Buckeye Brook, approximately 30-linear feet would be placed in culvert and 112-linear feet of existing channel relocated.4 Approximately 340-linear feet would be placed within new culvert, and 170-linear feet would be relocated to a new channel.Chapter 5 - Environmental Consequences 5-197 July 2011\\mawatr\ev\09228.00\reports\<strong>FEIS</strong>_Final_July_2011\<strong>PVD</strong>_CH05_Environmental_Cons_JUL_2011.doc
T.F. <strong>Green</strong> <strong>Airport</strong> <strong>Improvement</strong> <strong>Program</strong>Environmental Impact Statement and Final Section 4(f) EvaluationIndirect ImpactsIndirect impacts to existing wetlands are not anticipated. The potential for new commercial development islimited to areas such as the agricultural land and former industrial parcels north of existing <strong>Airport</strong> Road. Thepotential redevelopment of these properties is not anticipated to result in further significant impacts toremaining wetlands. Indirect impacts can also include impacts that would occur at a later time or in a differentplace, or that would cause changes in wildlife habitat or populations as an indirect consequence of wetland loss.The construction of Fully Relocated <strong>Airport</strong> Road through Wetland A2 would divide this wetland into half,fragmenting the remaining wetland wildlife habitat not directly impacted by road construction. This action couldindirectly impact the wetland through the discharge of stormwater runoff, potentially affecting water quality. Thefilling of Wetland A5 to accommodate the glide slope area and Perimeter Road would reduce flood storagefunction, potentially increasing flood heights and durations in the wetland above Lakeshore Drive. Theintroduction of traffic along the AMF access road in Wetland A5 could further degrade the wetland wildlifehabitat function of the remaining portion of Wetland A5. Clearing vegetation along portions of the AMF accessroad proximate to Buckeye Brook could lead to undesirable thermal impacts to the stream habitat.The introduction of invasive species at areas disturbed during construction would also be a potential indirectimpact to adjacent wetlands for Alternatives B2 and B4. The presence of an invasive species seed bank and theextent of the wetland disturbance would affect the level of this risk. Monitoring would be required to assess thisindirect impact and determine if mitigation countermeasures would be required.5.10.4.3 Alternative B4This section summarizes the direct, indirect, and short-term construction-related wetland impacts forAlternative B4. Table 5-104 provides information on the impacts to wetland functions and values. Table 5-105provides an overview of waterway impacts by program element. Table 5-106 provides detailed information onimpacts to federal jurisdictional vegetated wetlands while Table 5-107 provides information on impacts tostate-regulated wetlands. All wetland direct wetland impacts associated with Alternative B4 are FAA-requiredsafety enhancements to the Runway 34 RSA, including the relocation of Taxiway C.Direct ImpactsAlternative B4 would impact 5.0 acres of federal jurisdictional vegetated wetlands and approximately 843 linearfeet of waterways. This represents a 2.3 acre decrease from the 7.3 acres of impact to federal jurisdictionalwetlands reported in the DEIS. The additional avoidance and minimization measures incorporated into theRunway 34 design are described in Section 5.10.8, Avoidance and Minimization. Two new culverts are proposedthat would place a total of approximately 340 linear feet of Tributary A11 in structures. The remaining total of503 linear feet of Tributary A11 and Tributary A that would be impacted would be diverted into new channel oropen water wetland areas. The total state-regulated perimeter and riverbank wetland area that would beimpacted under Alternative B4 is estimated to be 6.5 acres, much of which is within the developed <strong>Airport</strong> area.An additional 0.2 acres of floodplain outside of other freshwater wetland would also be impacted based on theoutput of the HEC-RAS model for Tributary A11. Impacts to state-regulated floodplain are considered in moredetail in Section 5.14, Floodplains. The impacted vegetated wetlands are shown in Figures 5-39 and 5-40.Chapter 5 - Environmental Consequences 5-198 July 2011\\mawatr\ev\09228.00\reports\<strong>FEIS</strong>_Final_July_2011\<strong>PVD</strong>_CH05_Environmental_Cons_JUL_2011.doc
T.F. <strong>Green</strong> <strong>Airport</strong> <strong>Improvement</strong> <strong>Program</strong>Environmental Impact Statement and Final Section 4(f) EvaluationTable 5-104Alternative B4: Summary of Impacts to Wetland Functions and Values<strong>Program</strong> Wetland Wetland Wetland GWR/D- S/T/P R- NR/R/T- WLH- VQ/A-Element ID Impact (ac) Area (ac) SWGW FFA WQ WQ PE S&S S F&SH WWH T&E SH REC U/H-AES AESRunway 34 A6 1.5 3.1 XA8 0.1 16.3 X P P X XA10 0 25.6 X P P X X P P X XA11 0.6 2.7 XA13 2.8 19.4 P P P XP Principal Wetland Function or Value. F&S H Fish and Shellfish Habitat.X Additional Wetland Function or Value likely provided by wetland. WLH Wildlife Habitat.GWR/D Groundwater Recharge/Discharge. WWH Wildlife and Wildlife Habitat.SWGW Surface Water and Groundwater.FFA Floodflow Alteration. REC Recreation.S/T/P R Sediment/Toxicant/Pathogen Retention. ED/SV Educational/Scientific Value.NR/R/T Nutrient Removal/Retention/Transformation. U/H Uniqueness/Heritage.WQ Water Quality. AES Aesthetic.T&E SH Threatened and Endangered Species Habitat.PE Production Export. VQ/A Visual Quality/Aesthetics.S&S S Sediment and Shoreline Stabilization.Table 5-105Alternative B4: Wetland Impacts by <strong>Program</strong> Element (acres)Wetland ID A1 A2 A3 A4 A5 A6 A7 A8 A9 A10 A11 A12 A13 I P TotalWetland Size 3.1 7.6 12.9 4.4 14.5 3.1 85.6 16.3 0.5 25.6 2.7 3.5 19.4 15.3 17.1 231.6<strong>Program</strong> ElementRunway 16 0 0 0 0 0 0 0 0 0 0 0 0 0 0 0 0Runway 34 0 0 0 0 0 1.5 0 0.1 0 0 0.6 0 2.8 0 0 5.0Runway 5 0 0 0 0 0 0 0 0 0 0 0 0 0 0 0 0Runway 23 0 0 0 0 0 0 0 0 0 0 0 0 0 0 0 0Partially Relocated 0 0 0 0 0 0 0 0 0 0 0 0 0 0 0 0<strong>Airport</strong> RoadTotal 0 0 0 0 0 1.5 0 0.1 0 0 0.6 0 2.8 0 0 5.0See Figures 5-39 and 5-40.Unlike Alternative B2, this alternative would only impact wetlands for safety enhancements at theRunway 34 End. There would be no wetland impacts at the Runway 5 (including Realigned Main Avenue), 16,or 23 Ends. The Runway 34 End would be shifted nearly 100 feet north and a portion of the RSA would beconstructed by placing fill south of the existing Runway 34 End. Alternative B4 includes a partial relocation of<strong>Airport</strong> Road in a developed area. This would not impact wetland resources, as there are no wetlands in thisarea. Alternative B4 does not require <strong>Airport</strong> Road to be fully relocated. Importantly, Alternative B4 would notdirectly impact Buckeye Brook and would avoid any impact to Wetland A5 and Wetland A10 through whichthe brook flows.Runway 34 EndSafety and taxiway enhancements associated with Runway 16-34 would impact four wetlands at theRunway 34 End and require two segments of an intermittent stream, Tributary A11, to be placed in culverts andrelocate one segment of this stream. A portion of a diffuse intermittent stream channel in Wetland A13(Tributary A) would also be filled. Direct impacts to Buckeye Brook below Warwick Pond and Wetland A10Chapter 5 - Environmental Consequences 5-199 July 2011\\mawatr\ev\09228.00\reports\<strong>FEIS</strong>_Final_July_2011\<strong>PVD</strong>_CH05_Environmental_Cons_JUL_2011.doc
T.F. <strong>Green</strong> <strong>Airport</strong> <strong>Improvement</strong> <strong>Program</strong>Environmental Impact Statement and Final Section 4(f) Evaluationwould be completely avoided. The greatest single impact area (2.8 acres) would occur in Wetland A13 directlysouth of the runway end to construct the enhanced RSA. This represents a 0.2 acres reduction in impactreported in the DEIS and nearly two thirds of this impact (1.8 acres) would be to emergent wetland dominatedby the invasive common reed (Phragmites australis). The remaining 1.0 acres consists of shrub wetlandperiodically maintained by cutting to remove obstructions from Part 77 airspace.Impacts to Wetland A8 have been reduced to 0.1 acres along the fringe of the existing Runway 34 fill sectionfrom the 1.8 acres reported in the DEIS. The revised design largely avoids impact to this scrub-shrub andforested wetland which provides flood storage and water quality functions at the principal level in the formerimpact area. Impacts to Wetland A6 have been reduced from 1.8 acres to 1.5 acres. This wetland was largelycreated as the result of past sand and gravel removal and has low plant community diversity and provides fewfunctions aside from groundwater discharge. Finally, impacts to Wetland A11 have been reduced from 0.7 acresreported in the DEIS to 0.6 acres. Wetland A11 has a linear form as much of this wetland’s southern part wascreated by excavation through uplands to divert flows around Taxiway C and the Runway 34 End into WetlandA13. Prior to the extension of Runway 16-34 in 1967 much of this flow entered Wetland A8.Approximately 5.0 acres of federal-regulated vegetated wetland, an additional 6.5 acres of state-regulatedperimeter and riverbank wetland, and 0.2 acres of state-regulated floodplain outside of the limits of otherfreshwater wetlands would be altered by the Runway 34 safety enhancements (Tables 5-106 and 5-107).Significant Impacts: Under Alternative B4, approximately 5.0 acres of federal jurisdictional vegetated wetlandand 843 linear feet of intermittent stream would be altered by fill placement, affecting wetlands that providethree principal functions. Principal wetlands functions that would be impacted include nutrientremoval/retention/transformation, floodflow alteration, and sediment/toxicant/pathogen retention. Thisimpact would meet the FAA standard of significance as the filled wetland areas would be substantiallymodified and would not sustain the existing wetland functions and values. These losses would be mitigatedthrough a compensatory wetland mitigation program involving wetland restoration, creation, and preservationas described in Chapter 6, Mitigation.Indirect ImpactsIndirect impacts associated with Alternative B4 could include increased flood heights in Buckeye Brookassociated with the loss of flood storage in Wetland A13 associated with the fill placement for the enhancedRSA. This indirect impact would be mitigated by the construction of wetland Mitigation Site 1, described inChapter 6, Mitigation. The mitigation area would be constructed prior to fill placement for the RSA to minimizethe opportunity for short-term impacts.Fill placement in Wetland A13 could reduce the water quality function provided by the wetland by shorteningthe residence time of water passing through the wetland. Mitigation Site 1 would be designed to replace thiswetland function.Chapter 5 - Environmental Consequences 5-200 July 2011\\mawatr\ev\09228.00\reports\<strong>FEIS</strong>_Final_July_2011\<strong>PVD</strong>_CH05_Environmental_Cons_JUL_2011.doc
T.F. <strong>Green</strong> <strong>Airport</strong> <strong>Improvement</strong> <strong>Program</strong>Environmental Impact Statement and Final Section 4(f) EvaluationTable 5-106Alternative B4: Federal Wetland ImpactEmergentEmergent (Phragmites) Scrub-shrub Forested Total WaterwayWetland ID (acres) (acres) (acres) (acres) (acres) (linear feet)A2 0 0 0 0 0 0A3 0 0 0 0 0 0A4 0 0 0 0 0 0A5 0 0 0 0 0 0A6 0.9 0.3 0.3 0 1.5 0A8 0.1 0 0 0 0.1 0A10 0 0 0 0 0 0A11 0.4 0 0 0.2 0.6 602 1A13 0 1.8 1.0 0 2.8 241Total 1.4 2.1 1.3 0.2 5.0 8431 Approximately 340 linear feet would be placed within new culvert, and 262 li near feet would be relocated to a new channel.Table 5-107 Alternative B4: State Regulated Freshwater Wetland Impact 1SwampRiver/streamWetland ID (acres) (acres)A2 0 0A3 0 0A4 0 0A5 0 0A6 1.5 0A8 0.1 0A10 0 0A11 0.6 602 2A13 2.8 241Total 5.0 8431 There would be approximately 6.5 acres of impact to state-regulated perimeter and riverbank wetland. These resourceareas are dimensional setbacks from certain vegetated wetlands and watercourses. Overlap among these “buffers”from proximate wetlands precludes an accounting to each wetland or watercourse. An additional 0.2 acres of floodplainoutside of other state-regulated freshwater wetlands would also be impacted based on the HEC-RAS model preparedto identify state-regulated floodplain.2 Approximately 340 linear feet would be placed within new culvert, and 262 linear feet would be relocated to a newchannel.Chapter 5 - Environmental Consequences 5-201 July 2011\\mawatr\ev\09228.00\reports\<strong>FEIS</strong>_Final_July_2011\<strong>PVD</strong>_CH05_Environmental_Cons_JUL_2011.doc
T.F. <strong>Green</strong> <strong>Airport</strong> <strong>Improvement</strong> <strong>Program</strong>Environmental Impact Statement and Final Section 4(f) Evaluation5.10.5 Short-Term Impacts from Temporary Construction ActivitiesConstruction activities associated with Alternatives B2 and B4 could potentially affect wetlands that are notdirectly impacted. Construction of new navigational aids at the Runway 34 End in Wetland A10 and A13 underAlternative B2 may require equipment to enter wetlands and temporarily disturb existing vegetation.Alternative B2 would also include temporary impacts to install utility conduits to provide electrical andcommunication service to navigational aids north of <strong>Airport</strong> Road for Runway 23. This would involve work inWetland A4 and Upper Buckeye Brook and Wetland A2 and the Spring <strong>Green</strong> Pond Inlet stream. Methods ofavoiding and minimizing this impact, such as directional drilling or jacking will be evaluated. Any disturbedarea would have wetland substrates restored in place after work is completed with vegetation largely returningto a pre-disturbance condition within one growing season. Alternative B4 would not require the installation ofnew navigational aids at the Runway 34 or Runway 23 Ends. There are no wetlands at the Runway 5 End wherenew navigational aids would be installed under Alternative B4.Construction activities within or close to wetlands are likely to affect habitat utilization patterns of wildlife,temporarily impacting the wetland wildlife habitat function. Wildlife species currently utilizing these habitatshave habituated to typical <strong>Airport</strong> operations but may abandon these areas when disturbed by nearby heavyequipment operations. Predisturbance habitat utilization patterns are anticipated to reestablish some periodafter construction has been completed.Without appropriate erosion and sedimentation controls, areas of exposed soils created during constructionactivities could contribute to temporary increases watercourse sediment loads. Construction best managementpractices, such as installing hay bales and silt fences, would be implemented to avoid and minimize thesetemporary construction impacts. The erosion and sedimentation control practices will be consistent with themost recent edition of the Rhode Island Soil Erosion and Sediment Control Handbook and Minimum Standard 10 ofthe Rhode Island Stormwater Design and Installation Standards Manual. 4045.10.6 Cumulative ImpactsFigure 5-41 shows the cumulative impacts to wetlands for Alternatives B2 and B4. Based on a review ofhistorical aerial photographs, there has been a substantial loss of wetland area (approximately 70 percent) since1939 within the Project Area. 405 Under Alternative B2 and B4 there would be an additional one percent loss(approximately) of this historical wetland area.Under Alternative B2, there would be an additional loss of 1.5 acres of Wetland A5, the relocation ofapproximately 112 feet of Buckeye Brook and extension of the existing 80-foot long culvert at Lakeshore Drive by30 feet to 110 feet. Under current conditions the culvert is a restriction to river herring spawning runs into Spring<strong>Green</strong> Pond. Impact to this important fish run would represent a further cumulative loss of wetland functions andvalues provided by the Buckeye Brook/Spring <strong>Green</strong> Pond wetland system north of Warwick Pond. Wetland A2has suffered the loss of hydrology through artificial drainage, encroachment by residential development, andwater quality degradation through the discharge of untreated stormwater. Alternative B2 requires the constructionof Fully Relocated <strong>Airport</strong> Road, which would fill an additional 1.1 acre of this 7.6 acre forested wetland. Further,404 RIDEM and CRMC, December 2010.405 Estimated 397 acres of wetland in the Project Area in 1939 versus 118 acres in the baseline.Chapter 5 - Environmental Consequences 5-202 July 2011\\mawatr\ev\09228.00\reports\<strong>FEIS</strong>_Final_July_2011\<strong>PVD</strong>_CH05_Environmental_Cons_JUL_2011.doc
T.F. <strong>Green</strong> <strong>Airport</strong> <strong>Improvement</strong> <strong>Program</strong>Environmental Impact Statement and Final Section 4(f) Evaluationthis fill would occur near the mid-portion of this wetland fragmenting it into two small units. There would be nofurther cumulative impacts to wetlands north of the existing <strong>Airport</strong> Road under Alternative B4. In addition,Alternative B4 does not further impact Buckeye Brook or its adjacent riparian wetlands.Impacts to wetlands at the Runway 34 End common to Alternatives B2 and B4 would occur along edges of theexisting <strong>Airport</strong> development and would not result in further cumulative wetland habitat fragmentation.Alternative B2 largely avoids impacts to wetlands south of the Runway 34 End. Under Alternative B4,approximately 2.8 acres of Wetland A13 would be filled to construct the Runway 34 RSA. Cumulative impactsto functions such as flood storage and water quality would be minimized through the creation of a wetlandcompensation area adjacent to Wetland A13 within the <strong>Airport</strong> (see Chapter 6, Mitigation, Section 6.9, Wetlandsand Waterways).Alternative B4 would not result in significant further cumulative degradation of the wetland wildlife habitatfunction at the Runway 34 End. Wetland A13 lies under the flight path of Runway 16-34 and is a wildlifehazard. The WHMP includes monitoring and active deterrence measures to prevent wildlife, especiallywaterfowl, wading birds and raptors from utilizing this area. Wetlands that provide a higher level of wetlandwildlife habitat (e.g., Wetland A10, Wetland A5 and Wetland A14) would not be impacted by Alternative B4.The wetland mitigation program described in Chapter 6, Mitigation, demonstrates that there are adequateopportunities for compensating losses to wetland functions and values.5.10.7 Comparison of Alternatives B2 and B4This section provides a comparison of the impacts Alternatives B2 and B4. Both Alternatives B2 and B4 wouldresult in significant impacts to wetlands. Alternative B2 would impact a total of 5.8 acres of wetland in threelocations: north of the <strong>Airport</strong> to construct Fully Relocated <strong>Airport</strong> Road, at the Runway 23 End, and theRunway 34 End. In addition, Alternative B2 would directly impact Buckeye Brook north of Warwick Pond.Alternative B4 would impact 5.0 acres at the Runway 34 End only and would have no direct impact to BuckeyeBrook.5.10.7.1 Significant ImpactsAlternative B2 would result in filling 5.8 acres of federal jurisdictional vegetated wetland and filling or altering773 linear feet of waterway. The impacted wetlands provide six identified principal functions: fish and shellfishhabitat, wildlife habitat, nutrient removal/retention/transformation, flood flow alteration, sediment/toxicant/pathogen retention, and groundwater recharge/discharge. Alternative B4 would result in filling 5.0 acres offederal jurisdictional wetland and filling or altering 843 linear feet of waterway. The impacted wetlands providethree identified principal functions: nutrient removal/retention/transformation, floodflow alteration, andsediment/toxicant/pathogen retention, and groundwater recharge/discharge. Wetland losses associated withAlternative B2 are slightly greater than for Alternative B4 and involve more wetland functions and values.Tables 5-108 and 5-109 summarize wetland and waterways impacts for Alternatives B2 and B4. While the wetlandareas impacted by Alternative B2 and B4 are similar, only Alternative B2 impacts the existing wildlife andfishery habitat functions associated with Wetland A5 and Buckeye Brook at the Runway 23 End. The significantimpacts on these wetland ecological services would be greater under Alternative B2.Chapter 5 - Environmental Consequences 5-203 July 2011\\mawatr\ev\09228.00\reports\<strong>FEIS</strong>_Final_July_2011\<strong>PVD</strong>_CH05_Environmental_Cons_JUL_2011.doc
T.F. <strong>Green</strong> <strong>Airport</strong> <strong>Improvement</strong> <strong>Program</strong>Environmental Impact Statement and Final Section 4(f) EvaluationTable 5-108Alternatives B2 and B4: Areas of Federal Wetland and Waterway ImpactsAlternative B2 Alternative B4 2<strong>Program</strong> Element and Associated ActionWetlands(acres)Waterways(linear feet)Wetlands(acres)Waterways(linear feet)Runway 5 End 0 0 0 0Runway 23 End 1.5 142 1 0 0Runway 16 End 0 0 0 0Runway 34 End 2.5 510 5.0 843Partially Relocated Ai rport Road 0 0 0 0Fully Relocated Ai rport Road 1.8 121 0 0Total Federal Impacts 5.8 773 5.0 8431 Buckeye Brook, approxi mately 30 li near feet would be placed in culvert and 112 linear feet of existi ng channel relocated.2 Alternati ve B4 has no impact on the streambed of Buckeye Brook.Table 5-109Alternatives B2 and B4: Additional State-Regulated Perimeter and Riverbank Wetland Impacts(acres)<strong>Program</strong> Element and Associated Action Alternative B2 Alternative B4Runway 5 End 0 0Runway 23 End 5.2 0Runway 16 End 0 0Runway 34 End 4.9 6.5Partially Relocated <strong>Airport</strong> Road 0 0Fully Relocated <strong>Airport</strong> Road 2.4 0State Only Riverbank/Perimeter Wetland Impacts 12.5 6.5State Only Floodplain outside of other Freshwater Wetlands 0.2 0.2Vegetated Wetland (Federal and State Regulated) Impacts 5.8 5.0Total State Impacts 1 18.5 11.71 Includes vegetated wetlands under the jurisdiction of the state and federal programs plus perimeter wetland, riverbank wetland, and state-regulated floodplainimpacts associated with <strong>Airport</strong> enhancements. Areas of overlapping impact to floodplain, perimeter wetland, and/or riverbank wetland are only counted once.5.10.8 Avoidance and MinimizationMitigation of wetland impacts consists of three sequential steps: avoidance through the examination of potentialproject alternatives; minimization through the incorporation of special design measures that reduce unavoidableimpacts; and mitigation to offset unavoidable impacts that cannot be reduced through sound design measures. 406Mitigation features incorporated into Alternatives B2 and B4 considered in this section include opportunities forcompensatory mitigation for unavoidable impacts to wetlands and waterways. Proposed compensatingmitigation measures to address wetland impacts are described in Chapter 6, Mitigation.406 In accordance with the 1990 Memorandum of Agreement Between the Environmental Protection Agency and the Department of the Army Concerning theDetermination of Mitigation Under the Clean Water Act Section 404(b)(1) Guidelines.Chapter 5 - Environmental Consequences 5-204 July 2011\\mawatr\ev\09228.00\reports\<strong>FEIS</strong>_Final_July_2011\<strong>PVD</strong>_CH05_Environmental_Cons_JUL_2011.doc
T.F. <strong>Green</strong> <strong>Airport</strong> <strong>Improvement</strong> <strong>Program</strong>Environmental Impact Statement and Final Section 4(f) Evaluation5.10.8.1 AvoidanceThroughout the project design, the RIAC and FAA worked to identify project designs that would achieve theproject purpose while avoiding impact to wetlands. During this process several alternatives were designed andassessed to determine if they were practicable.Runway 34There are seven wetlands (A6, A8, A10, A11, A13, A14, and A16) present at the Runway 34 End, includingBuckeye Brook below Warwick Pond and a series of tributaries to Buckeye Brook which flow from west to easttoward the brook. Wetlands next to Runway 34, Taxiway C, and the Perimeter Road are generally bounded byfill slopes used to construct the <strong>Airport</strong>. Impacts to Wetland A13 south of Runway 34 could be avoided if theentire runway was shifted north so the Runway 34 RSA would not be constructed in a wetland. This scenariowas evaluated in the Level 4 Alternatives Analysis and was found not practicable since this would require PostRoad to be relocated or closed.Alternatives B2 and B4 would impact Wetlands A6, A8, and A11 at the Runway 34 End to relocate Taxiway C aminimum safe distance from the runway, and construct a new Perimeter Road. Impacts associated withTaxiway C and the Perimeter Road are necessary to meet FAA minimum safety distances.Earlier designs for the Runway 34 End in the DEIS included a hold apron west of the Runway 34 End foraircraft awaiting clearance to approach the runway end in preparation for takeoff. These designs also included aPerimeter Road constructed outside of the Runway Object Free Area (ROFA). The hold apron was latereliminated to avoid impacts to Wetland A11 and Tributary A11. Impacts to Wetlands A10 and A13 were furtheravoided in the DEIS by constructing the Perimeter Road through the RSA and ROFA between the Runway 34End and the EMAS bed. Impacts to Wetlands A11 and A6 were also further avoided by routing the PerimeterRoad away from the west side of relocated Taxiway C to the south of these wetlands, mostly through uplandsthat are already cleared along the perimeter security fence.Alternative B2 would shift Runway 16-34 north by 400 feet and would mostly avoid impacts to Wetland A13south of the existing Runway 34 End. This would avoid the requirement to construct the RSA safetyenhancements to the south of the existing runway end into Wetland A13. The use of EMAS at both runwayends, described in Section 5.10.8.2, Minimization, avoids the need to relocate U.S. Route 1 (Post Road) which hadalready been determined to be impracticable. However, it was determined that avoidance of Wetland A13 wasimpracticable due to undesirable socioeconomic impacts created by the relocated Runway 16 RSA. Theseimpacts are further described in Chapter 3, Alternatives Analysis.Alternative B4 was designed to shift Runway 16-34 approximately 100 feet north of its present location. This wasdetermined to be the maximum distance that Runway 16-34 can be shifted away from wetlands at theRunway 34 End and comply with FAA standards at the Runway 16 End while avoiding the requirement todemolish the <strong>Airport</strong> Plaza building and other undesirable socioeconomic impacts associated with theAlternative B2 design. Similar to Alternative B2, Alternative B4 would avoid further impact to Wetland A11 andTributary A11 by eliminating the hold apron west of the Runway 34 End. Impacts to Wetlands A10 and A13would also be avoided by constructing the Perimeter Road through the RSA and ROFA between the Runway 34Chapter 5 - Environmental Consequences 5-205 July 2011\\mawatr\ev\09228.00\reports\<strong>FEIS</strong>_Final_July_2011\<strong>PVD</strong>_CH05_Environmental_Cons_JUL_2011.doc
T.F. <strong>Green</strong> <strong>Airport</strong> <strong>Improvement</strong> <strong>Program</strong>Environmental Impact Statement and Final Section 4(f) EvaluationEnd and the EMAS bed. Impacts to Wetlands A11 and A6 would be avoided by routing the Perimeter Road awayfrom the west side of relocated Taxiway C to the south of these wetlands along an existing trail in cleared uplands.During the preparation of this <strong>FEIS</strong>, impacts to Wetland A8 were further avoided by re-examining the locationof the Perimeter Road on the east side of Runway 34 along with the design requirements for the glide slopecritical area; a critical part of the system that allows aircraft to make instrument landings on the runway. Theimaging type glide slope, which is used at the other three runways at the <strong>Airport</strong>, has specific site requirementsreflected in the previous glide slope area grading design for Runway 34. The Runway 34 End has an end-firesystem, which is a non-image system, and is designed for use in areas where conformance to the imaging typeglide slope criteria is impractical. The use of an end-fire system at the Runway 34 End results in the completeavoidance of impact to Wetland A8 from the glide slope area.Alternative B2 would include the installation of new navigational aids at the Runway 34 End that would haveminor fill impacts within Wetland A10 and A13. Because Alternative B4 only shifts Runway 16-34 north by lessthan 100 feet, the existing navigational aids may continue to be used avoiding new impact to Wetland A10 alongBuckeye Brook below Warwick Pond.Runway 23There are five wetlands at the Runway 23 End (Wetlands A1, A2, A3, A4, and A5) including Upper and LowerBuckeye Brook, Spring <strong>Green</strong> Brook, Spring <strong>Green</strong> Inlet stream, and Spring <strong>Green</strong> Pond north of Runway 23.Impacts to wetlands at the Runway 23 End could be avoided if Runway 5-23 was shifted to the south(Alternative B4). The Alternative B2 Runway 5-23 extension avoids impacts to wetlands north of <strong>Airport</strong> Roadby shifting some of the Runway 5-23 extension south. Impacts to Wetland A5 cannot be avoided with theAlternative B2 configuration of Runway 5-23 because a glide slope critical area is required at the Runway 23End and the Perimeter Road and AMF access road must be kept outside of the ROFA.Relocating the AMF Access Road under Alternative B2 would impact Wetland A5. This road connects the AMFto the portion of existing <strong>Airport</strong> Road that would remain after the Runway 23 extension has been constructed.This impact would be avoided in Alternative B4.Under Alternative B2, there would be minor temporary impacts to Wetland A4, Upper Buckeye Brook, WetlandA2, and the Spring <strong>Green</strong> Inlet stream to install a navigational aid conduit. This temporary impact could beavoided if the conduit were installed using directional drilling or if it were jacked in beneath the wetland.Unlike Alternative B2, Alternative B4 would avoid all impacts to Buckeye Brook Wetlands (A1, A2, A3, A4, andA5) at the Runway 23 End. This would be achieved by realigning Main Avenue and maintaining the currentconfiguration of the Runway 23 End.Fully Relocated <strong>Airport</strong> RoadThe Fully Relocated <strong>Airport</strong> Road between Post Road and Warwick Avenue is necessary to allow Runway 5-23to be extended northward across existing <strong>Airport</strong> Road for Alternative B2. The alignment was developed toenhance east-west access in the City, meet highway safety standards, and align with Route 37 on the West andChapter 5 - Environmental Consequences 5-206 July 2011\\mawatr\ev\09228.00\reports\<strong>FEIS</strong>_Final_July_2011\<strong>PVD</strong>_CH05_Environmental_Cons_JUL_2011.doc
T.F. <strong>Green</strong> <strong>Airport</strong> <strong>Improvement</strong> <strong>Program</strong>Environmental Impact Statement and Final Section 4(f) EvaluationWarwick Avenue at Squantum Drive on the east. Fully Relocated <strong>Airport</strong> Road would impact Wetland A2(1.1 acres) and Wetland I (0.5 acres).The use of a flyover structure was investigated to avoid impact at Wetland I in the vicinity of Post Road.Preliminary cost estimates were approximately $4 million to avoid 0.5 acres of wetland impact. The flyover isnot practicable based on cost. An alternative roadway alignment to avoid impacts to Wetland A2 was alsoinvestigated. This alignment (north of Wetland A2) would have significant adverse impacts to residentialneighborhoods and would intersect Warwick Avenue well north of Squantum Drive. This avoidance alternativeis not practicable because of the magnitude of the residential impacts and because it would create undesirabletraffic conditions on Warwick Avenue.Other unavoidable impacts occur at Warwick Avenue which crosses Spring <strong>Green</strong> Pond on fill (Wetland P). Anadditional travel lane would be added to Warwick Avenue in this location. There are wetlands at the base ofslope on either side of Warwick Avenue such that impact to wetland cannot be avoided. The small impact atWetland A3 is required to build a stormwater outfall from Fully Relocated <strong>Airport</strong> Road and cannot be avoidedas other discharge points are not available.Under Alternative B4, the Fully Relocated <strong>Airport</strong> Road is not proposed, thereby avoiding any associatedwetlands impacts.5.10.8.2 MinimizationImpacts to wetlands have been minimized through modifications to the design of Alternatives B2 and B4, asdescribed below. Additional minimization measures may be feasible and will be evaluated once the PreferredAlternative moves into the final design phase.Runway 34As presented in the DEIS, Alternatives B2 and B4 both would minimize wetland filling by installing EMAS atthe Runway 34 End to reduce the FAA-required minimum length of the RSAs from 1,000 feet to 600 feet.Prior to incorporating further avoidance and minimization measures described for Alternative B2, the impact towetlands at the Runway 34 End was estimated at 4.2 acres. This has been reduced to 2.5 acres underAlternative B2 mostly through avoidance measures that have already been described. Similarly forAlternative B4, impacts to these wetlands have been reduced through the alternatives analysis process from7.3 acres presented in the DEIS to 5.0 acres currently proposed.Due to the use of an end-fire navigational system at Runway 34 as described under avoidance, the side slopesalong the runway can be steepened beginning at the edge of the RSA. This in turn allowed the Perimeter Roadto be shifted closer to the side of Runway 34. This shift brought the Perimeter Road within the glide slopeantenna signal zone so the road was lowered to prevent vehicles from interfering with the signal. Impacts toWetland A8 from the glide slope area were reduced from 1.8 acres to 0.1 acres from the combination ofavoidance and minimization measures.Chapter 5 - Environmental Consequences 5-207 July 2011\\mawatr\ev\09228.00\reports\<strong>FEIS</strong>_Final_July_2011\<strong>PVD</strong>_CH05_Environmental_Cons_JUL_2011.doc
T.F. <strong>Green</strong> <strong>Airport</strong> <strong>Improvement</strong> <strong>Program</strong>Environmental Impact Statement and Final Section 4(f) EvaluationOne final minimization measure incorporated in the Runway 34 design presented in the <strong>FEIS</strong> involvedsteepening the side slopes adjacent to wetlands from the previous 4:1 gradient to the presently proposed 3:1slopes. This resulted in a further reduction of approximately 0.9 acres of wetland impact. These minimizationmeasures have been incorporated into the design of Alternatives B2 and B4.Runway 23Extending Runway 23 in Alternative B2 would result in direct impact to Wetland A5, the relocation ofapproximately 112 linear feet of Lower Buckeye Brook and placement of 30 linear feet of Lower Buckeye Brookin an extended culvert at Lakeshore Drive. Impacts to this wetland resource cannot be further minimizedbecause of the required configuration of the runway glide slope area, and the requirement to keep the PerimeterRoad and AMF access road out of the ROFA.Alternative B2 would minimize disturbance to Wetland A5 by routing the AMF Access Road over the fill section ofan existing <strong>Airport</strong> security road. Alternative alignments were considered for access to the AMF, including filling thenorth end of Wetland A5 and crossing Buckeye Brook on a structure midway between Lakeshore Drive and existing<strong>Airport</strong> Road. The selected option minimizes impact to wetlands by following the alignment of an existing gravelroad constructed in fill along the northeastern perimeter of the <strong>Airport</strong>. This existing gravel road is used by <strong>Airport</strong>Operations to inspect <strong>Airport</strong> property including the perimeter security fence. Alternative B4 avoids all wetlandimpacts at the Runway 23 End; therefore, minimization measures would not be necessary for this alternative.Fully Relocated <strong>Airport</strong> RoadThe Fully Relocated <strong>Airport</strong> Road cross section designed for Alternative B2 has been reduced to 64 feet(four 12-foot travel lanes, two 2-foot shoulders, and two 6-foot sidewalks) to minimize impacts to wetlands. Theuse of a bridge structure was considered to further minimize impacts, but relief between adjacent uplands andthe forested swamp is typically less than six feet. The depth of a bridge structure would not provide adequateclearance over the wetland to avoid impact to the wetland area spanned to justify the additional cost.Alternative B4 does not include Fully Relocated <strong>Airport</strong> Road. The roadway fill section could be confined byretaining walls with guard rails to minimize impact to the wetland.5.11 Water QualityThis section considers potential impacts to water quality from Alternatives B2 and B4 as compared to theNo-Action Alternative. It includes a discussion of the direct impacts, indirect impacts, the potential temporaryconstruction impacts, and the cumulative impacts that would occur to local water resources in the foreseeablefuture, and the potential mitigation measures that may be considered to reduce the magnitude of any significantimpacts to water quality.5.11.1 Regulatory ContextSeveral federal, state, and local statutes and ordinances protect water quality, including the CWA. The EPArequires a National Pollutant Discharge Elimination System (NPDES) permit for discharges of stormwater tosurface waters of the U.S. (40 CFR Parts 122,123 and 124). In Rhode Island, the NPDES authorized underChapter 5 - Environmental Consequences 5-208 July 2011\\mawatr\ev\09228.00\reports\<strong>FEIS</strong>_Final_July_2011\<strong>PVD</strong>_CH05_Environmental_Cons_JUL_2011.doc
T.F. <strong>Green</strong> <strong>Airport</strong> <strong>Improvement</strong> <strong>Program</strong>Environmental Impact Statement and Final Section 4(f) EvaluationSection 401 of the CWA is delegated to the RIDEM, which under the Rhode Island Pollutant DischargeElimination System (RIPDES) issues permits for industrial (including the <strong>Airport</strong>), municipal and stormwaterdischarges to the State’s waters. RIAC holds a RIPDES Industrial Discharge Permit for stormwater dischargesfrom the <strong>Airport</strong>.The Coastal Zone Management Act 407 (CZMA), Coastal Zone Act Reauthorization Amendments 408 (CZARA), andRhode Island Coastal Resources Management Council (RICRMC) <strong>Green</strong>wich Bay Special Area Management Plan(SAMP) 409 also protect water quality in <strong>Green</strong>wich Bay and other tidal waters.Water quality is also protected under the RIDEM Water Quality Regulations, RIDEM Groundwater QualityRegulations, the RIDEM Stormwater Design and Installation Standards Manual, and RIPDES Regulations. TheAntidegradation of Water Quality Standards of the Rhode Island Water Quality Regulations apply to any newor modified RIPDES permit including the proposed T.F. <strong>Green</strong> <strong>Improvement</strong> <strong>Program</strong>.Chapter 22, Article VII of the City of Warwick Code of Ordinances - Buckeye Brook Protection protects Buckeye Brookfrom illegal disposal, including liquid discharges and solid waste dumping.As a component of state environmental permitting, the T.F. <strong>Green</strong> <strong>Airport</strong> <strong>Improvement</strong> <strong>Program</strong> will requirethe development of a stormwater management system and supporting stormwater management report thatcomply with the RIDEM Rhode Island Stormwater Design and Installation Standards Manual 410 (SWDM) adopted inDecember 2010. The 2010 edition of the SWDM contains several significant changes in design standards fromthe 1993 SWDM, including eleven standards to protect water quality, maintain drinking water supplies, andprevent flooding and erosion. Major aspects of the modified standards include:• Maintaining groundwater recharge at existing levels to the maximum extent practicable;• Incorporating low-impact development (LID) techniques into project design;• Removing pollutants, including 90 percent of total suspended solids (TSS), 90 percent of bacteria, and40 percent of total phosphorous for discharges to freshwater wetland systems;• Providing 24-hour detention time for the one-year storm event to prevent natural channel erosion;• Providing greater treatment and control measures for any Land Uses with Higher Potential Pollutant Loads(LUHPPLs); and• Incorporating larger water quantity management systems based on significantly higher estimated designrainfall amounts.The <strong>Airport</strong> is currently authorized to discharge stormwater under a RIPDES permit and Memorandum ofAgreement (MOA) executed on February 19, 2009. A RIPDES “General Permits for Stormwater Discharge407 Coastal Zone Management Act, United States Department of Commerce, 2005. 408 Coastal Zone Act Reauthorization Amendments, United States Environmental Protection Agency, 1990.409 <strong>Green</strong>wich Bay Special Area Management Plan, Coastal Resource Management Council, September 2008. 410 Rhode Island Stormwater Design & Installation Standards Manual, Rhode Island Department of Environmental Management, December 2010. Chapter 5 - Environmental Consequences 5-209 July 2011\\mawatr\ev\09228.00\reports\<strong>FEIS</strong>_Final_July_2011\<strong>PVD</strong>_CH05_Environmental_Cons_JUL_2011.doc
T.F. <strong>Green</strong> <strong>Airport</strong> <strong>Improvement</strong> <strong>Program</strong>Environmental Impact Statement and Final Section 4(f) EvaluationAssociated with Construction Activities” is required for all projects with one or more acres of disturbance.Construction activities between one and five acres that also require a RIDEM Freshwater Wetlands Permit areautomatically granted authorization from RIPDES upon departmental receipt of the Freshwater Wetlands Permit.For all construction activities that disturb five or more acres, authorization also requires RIDEM review of theNotice of Intent (NOI) and Stormwater Pollution Prevention Plan (SWPPP) for the project. In the case of T.F. <strong>Green</strong><strong>Airport</strong> <strong>Improvement</strong> <strong>Program</strong>, where each individual project may not exceed this threshold, RIDEM hasindicated that the projects are viewed on a cumulative basis and therefore the filing of a RIPDES NOI and SWPPPwould be required for all projects that do not require a Freshwater Wetlands Permit regardless of the area ofdisturbance from construction activities.The SWPPP would identify all potential sources of pollution that may reasonably be expected to affectstormwater quality discharges, describe practices to be used to reduce pollutants in these discharges, and helpensure compliance with the terms and conditions of the RIPDES permit. The SWPPP would also include amaintenance commitment letter from RIAC regarding long-term maintenance of any structural BMPs that aredesigned as part of the stormwater management system.5.11.2 Significance ThresholdFAA Order 1050.1E defines a significant impact for water quality as one when an action would not meet waterquality standards. Potential difficulty in obtaining a permit or authorization may indicate a significant impact.5.11.2.1 Finding: No Significant Water Quality ImpactsThere would be no significant impacts to water quality, although there would be increases in impervioussurfaces within some drainage areas for Alternatives B2 and B4. Proposed stormwater mitigation measuresdeveloped in compliance with all applicable regulatory standards, including the RIDEM 2010 Stormwater Designand Installation Standards Manual, would address the water quality impacts and ensure the receiving waterswould not be impacted from new discharges. There would be no significant impacts due to Alternatives B2 orB4 because the <strong>Improvement</strong> <strong>Program</strong> would be designed to meet stormwater standards. Specifically:• The Project will be designed to meet water quality standards. Stormwater management systems will be designed(during the final design stage) to meet stormwater standards, mitigating the impacts resulting fromincreases to impervious surfaces from either Alternative B2 or B4. Alternative B2 and B4 would eachdecrease roadway and parking areas in the Tuscatucket Brook, and Brush Neck Cove watersheds, therebydecreasing potential pollutants entering downstream waterbodies.• The Project must avoid or mitigate any water quality problems. Alternatives B2 and B4 would avoid water qualityimpacts by reducing roadway and parking areas within the Tuscatucket and Brush Neck Cove Watersheds,thereby reducing pollutant loading. Mitigation measures to ensure that Alternatives B2 and B4 would meetstate stormwater standards would include the proper design of stormwater management systems.5.11.3 MethodologyThis section summarizes the methodology used to determine the Study Area water quality and to assess the<strong>Improvement</strong> <strong>Program</strong>’s potential impacts on surface water and groundwater resources.Chapter 5 - Environmental Consequences 5-210 July 2011\\mawatr\ev\09228.00\reports\<strong>FEIS</strong>_Final_July_2011\<strong>PVD</strong>_CH05_Environmental_Cons_JUL_2011.doc
T.F. <strong>Green</strong> <strong>Airport</strong> <strong>Improvement</strong> <strong>Program</strong>Environmental Impact Statement and Final Section 4(f) Evaluation5.11.3.1 Direct Impacts MethodologyImpacts to water resources were determined based on proposed changes in grading, surface cover, and landuse. Direct impacts are effects caused by the action and occur at the same time and place and would potentiallyoccur in the local receiving waters (Buckeye Brook, Tuscatucket Brook, etc.). The analysis evaluates potentialdirect impacts to water resources in two categories: hydrologic effects and water quality impacts. Hydrologiceffects relate to the effect of grading and ground surface types on the flow of water overland and into a streamor lake. Water quality impacts are based on the types of contamination that may enter the receiving waters,which can range from pollutants on the ground such as oils, metals, and salts to changes in temperature due torunoff flowing across warm pavement. Water quality impacts were evaluated for each stormwater drainagearea affected, including <strong>Airport</strong> property, areas of proposed land acquisition, and the existing and proposedoff-<strong>Airport</strong> roadways. Impacts from pollutant loading were determined in the water quality analysis withineach drainage area using the Simple Method (Schueler, 1987) which is based on annual rainfall, site percentimpervious cover, land use type, and pollutant loading coefficients based on land use. The impact of deicingactivities was considered in the water quality analysis as an increase in the number of departing flights willincrease the amount of glycol used at the <strong>Airport</strong>.The amount of impervious surface within a given drainage area was used to estimate relative increases in runoffvolume and peak flow for each of the receiving waters. The impervious surfaces in the Study Area werecalculated using aerial photography, mapping, and GIS to calculate the area extent of roads, structures andother impervious surfaces. This analysis has been revised since the DEIS and now assumes that the existingroadways will not be removed within the acquisition areas with the exception of roadways that are to be relocated,such as <strong>Airport</strong> Road, or are physically impacted by the <strong>Airport</strong> <strong>Improvement</strong> <strong>Program</strong>.5.11.3.2 Indirect Impacts MethodologyIndirect impacts are effects that occur later in time or farther away geographically. Indirect impacts could occurin larger water bodies downstream (Mill Cove, Brush Neck Cove) where the flows from multiple tributaries mixtogether. Indirect impacts would encompass effects that occur later than the direct impacts. Indirect impacts onhydrology and water quality would be determined by the same methods described above for direct impacts.5.11.3.3 Construction Impacts MethodologyTemporary construction impacts were determined based on the type, extent, and location of disturbanceassociated with demolition, grading, construction, and utility work. The relative potential for encounteringcontaminated materials (such as near the former Truk-Away Landfill site off the <strong>Airport</strong> property nearRunway 34) during excavation would affect the overall risk of construction-related water quality effects.5.11.3.4 Cumulative Impacts MethodologyThe cumulative impact analysis considers the total effect on the downstream receiving waters (Brush Neck Coveand Mill Cove) on a watershed basis extending back to 1939 (the earliest date for which aerial photographs ofthe <strong>Airport</strong> were available) and forward to the anticipated operations in 2020 and 2025, after construction iscomplete. The cumulative impact analysis also considers the ongoing effects of <strong>Airport</strong> activities and thesurrounding land uses on water quality and peak flows to determine whether an incremental impact thatappears minor may have a significant effect on an impaired resource.Chapter 5 - Environmental Consequences 5-211 July 2011\\mawatr\ev\09228.00\reports\<strong>FEIS</strong>_Final_July_2011\<strong>PVD</strong>_CH05_Environmental_Cons_JUL_2011.doc
T.F. <strong>Green</strong> <strong>Airport</strong> <strong>Improvement</strong> <strong>Program</strong>Environmental Impact Statement and Final Section 4(f) Evaluation5.11.4 Impact AssessmentThis section provides a summary of the evaluation of water quality and hydrologic impacts for Alternatives B2and B4, and compares them to the No-Action Alternative. Table 5-110 presents a summary of these impacts andFigures 5-42 and 5-43 show the future drainage areas and outfalls.As shown in Table 5-110, various elements of Alternatives B2 and B4 could, in the absence of stormwater BMPs,increase pollutant loading to receiving waters (Buckeye Brook, Spring <strong>Green</strong> Pond, Warwick Pond, TuscatucketBrook, or Callahan Brook). New public roads and parking lots, including the Fully and Partially Relocated <strong>Airport</strong>Road and the Integrated Cargo Facility Site, could increase pollutant loading of TSS, oil, and metals to receivingwaters. The relocated fuel farm and expanded terminal would include spill prevention control measures toprevent the contamination of groundwater or surface water with fuel products. The new fueling location wouldnot pose a new threat to water quality, particularly because fuel farms and terminals already exist at the <strong>Airport</strong>,and spill control measures will be implemented with the new facility. Other elements such as the passengerterminal and parking garage would have a negligible effect on water quality. Runoff from the terminal roof doesnot contain sediment and contaminants that are found on roads. The parking garage would be built on an existingsurface lot, increasing the number of parking spaces without increasing the parking footprint. The new runwayand taxiway areas would have a minor impact on water quality as these uses of pavement do not typicallycontribute significant amounts of contaminants or bacteria to runoff when compared to roadway runoff.Table 5-110No-Action and Alternatives B2 and B4: <strong>Program</strong> Elements by Drainage AreaDrainageArea No-Action Alternative Alternative B2 Alternative B4BuckeyeBrook NorthRemove existing off-airport houses EMAS for Runway 23, Turf RSAs ,through the VLAP. New glycol blending taxiways, new approach lighting,and treatment facilities would improve Integrated Cargo Facility, Partiallywater quality. 1 Relocated <strong>Airport</strong> Road, Fully Relocated<strong>Airport</strong> RoadRemoved: existing <strong>Airport</strong> Road, housesWarwick Pond New taxiways New taxiwaysBuckeye New taxiwaysBrook SouthTuscatucketBrookCallahan BrookRemove existing off-airport housesthrough the Voluntary Land Acquisition<strong>Program</strong>Remove existing off-airport housesthrough the Voluntary Land Acquisition<strong>Program</strong>Source: VHB, Inc.EMAS Engineered Material Arresting SystemRSA Runway Safety Area1 New deicer management system to come on–line before 2015.EMAS for Runway 34, taxiways, terminalgates, relocated Perimeter Road, parking,fuel farmRemoved: runway, taxiwaysEMAS for Runway 5, runways, taxiways,parking, relocated Perimeter RoadRemoved: housesNew approach lightingRemoved: housesEMAS for Runway 16, runways, taxiways,new approach lighting, Integrated CargoFacility, Partially Relocated <strong>Airport</strong> RoadRemoved: part of existing <strong>Airport</strong> Road,housesEMAS for Runway 34, taxiways, terminalgates, relocated Perimeter Road, parking,fuel farmRemoved: taxiwaysEMAS for Runway 5, runways, taxiways,parking, relocated Perimeter RoadRemoved: part of existing Main Avenue,housesNew approach lighting,Realigned Main AvenueRemoved: housesChapter 5 - Environmental Consequences 5-212 July 2011\\mawatr\ev\09228.00\reports\<strong>FEIS</strong>_Final_July_2011\<strong>PVD</strong>_CH05_Environmental_Cons_JUL_2011.doc
T.F. <strong>Green</strong> <strong>Airport</strong> <strong>Improvement</strong> <strong>Program</strong>Environmental Impact Statement and Final Section 4(f) Evaluation5.11.4.1 No-Action AlternativeThe No-Action Alternative would include improvements to water quality in the Buckeye Brook North,Tuscatucket Brook, and Callahan Brook watersheds by decreasing impervious surfaces through the removal ofhouses associated with the Current Part 150 VLAP. This would also reduce peak runoff rates in thosewatersheds. The No-Action Alternative would include mitigation measures for the full length taxiway M withinthe Buckeye Brook South drainage area. The No-Action improvements would be designed to meet statestormwater requirements and would not adversely affect water quality in Buckeye Brook.Table 5-111 shows the annual pollutant loading within the affected drainage areas for the No-Action Alternative.Infiltrating stormwater BMPs and pervious surfaces located between impervious surfaces, such as taxiways andrunways, and the stormwater collection system would be implemented to effectively reduce pollutant loadingimpacts and would not adversely affect water quality in receiving waters.Table 5-111Annual Pollutant Loading by Drainage Area 1 (No-Action Alternative)Pollutant 2Drainage Area TSS P N Cu Pb Zn BOD COD BacteriaBuckeye Brook North 46,061 77 706 0 11 16 2,457 30,708 522,029Warwick Pond 1,870 3 29 0 0 1 100 1,247 21,194Buckeye Brook South 35,077 58 538 0 8 12 1,871 23,385 397,537Mill Cove (cumulative) 3 83,008 138 1,273 0 19 29 4,428 55,340 940,760Tuscatucket Brook 10,973 18 168 0 3 4 585 7,316 124,366Callahan Brook 9,871 16 151 0 2 3 526 6,581 111,876Brush Neck Cove (cumulative) 4 20,844 172 1,592 0 24 36 5,539 69,237 1,177,002Total 103,852 206 1,911 0 29 43 6,650 83,134 1,413,244Source: VHB, Inc.1 A Highway Land Use Category was assumed the most appropriate Land Use Category for T.F. <strong>Green</strong> to determine the Event Mean Concentrations (EMCs)values. Other categories include Residential, Commercial, Industrial, and Undeveloped/Rural.2 The pollutants loading listed in this table represent the potential annual loading rate for the five drainage areas, totaling 1,360 acres, without the installation ofstormwater BMPs, where TSS is Total Suspended Solids, P is Phosphorus, N is Nitrogen, Cu is Copper, Pb is Lead, Zn is Zinc, BOD is Biological OxygenDemand, and COD is Chemical Oxygen Demand. Pollutants were calculated using the Simple Method (Schuster, 1987) which requires estimates of annualrainfall, site impervious cover, land use type, and pollutant loading coefficients based on land use. Totals are rounded.3 The Mill Cove drainage area consists of the combined Buckeye Brook North, Warwick Pond, and Buckeye Brook South drainage areas evaluated in this analysis.4 The Brush Neck Cove drainage area consists of the combined Tuscatucket Brook and Callahan Brook drainage areas evaluated in this analysis.The <strong>Airport</strong> completed construction of a consolidated glycol dispensing and blending facility in 2009. Theblending facility is expected to reduce the use of glycol at the <strong>Airport</strong> by up to 30 percent. Glycol-impactedstormwater will be controlled in accordance with the RIPDES permit and MOA executed on February 19, 2009,and Annual Deicing Management <strong>Program</strong> Plan, collectively referred to as the “RIPDES permit.” Under theRIPDES permit, RIAC will design and install a new deicer management system that will further reduce theamount of glycol-impacted stormwater that may be discharged to the receiving waters. The deicer managementsystem will be constructed independent of the proposed <strong>Improvement</strong> <strong>Program</strong> and is included in theNo-Action Alternative.Chapter 5 - Environmental Consequences 5-213 July 2011\\mawatr\ev\09228.00\reports\<strong>FEIS</strong>_Final_July_2011\<strong>PVD</strong>_CH05_Environmental_Cons_JUL_2011.doc
T.F. <strong>Green</strong> <strong>Airport</strong> <strong>Improvement</strong> <strong>Program</strong>Environmental Impact Statement and Final Section 4(f) Evaluation5.11.4.2 Alternative B2This section describes the direct and indirect impacts that would occur under Alternative B2. Table 5-112 showsthe changes in impervious area within the affected drainage areas. This analysis has been revised since the DEISand now assumes that the existing roadways will not be removed within the acquisition areas with the exceptionof roadways that are to be relocated, such as <strong>Airport</strong> Road, or are physically impacted by the <strong>Improvement</strong><strong>Program</strong>. Compared to the No-Action Alternative, Alternative B2 would increase the total impervious area by79.9 acres, of which the majority is split among the Buckeye Brook North drainage area (32.0 acres caused by thefully relocated <strong>Airport</strong> Road, the new taxiways, and Integrated Cargo areas), Buckeye Brook South drainage area(35.0 acres caused by the Runway 16-34 RSA enhancements, the reconfigured taxiways, and the south service area)and the Tuscatucket Brook watershed (13.4 acres caused by the Runway 5-23 extension). The increases would bepartially offset by decreases due to removing commercial and residential parking lots required for construction forPartially Relocated <strong>Airport</strong> Road. The Alternative B2 would include stormwater controls that will managedischarges to Warwick Pond, Buckeye Brook North, Buckeye Brook South, and Tuscatucket Brook and will limitpeak flows and erosion at the outfalls and in the downstream reaches of these brooks. In addition, CallahanBrook will have reduced overall peak flow due to the decreased impervious area in the watershed.Table 5-112 Impervious Surfaces by Drainage Area (Alternative B2)Impervious Area (acres) 1 Alternative B2 Change in Impervious Area 2Drainage Area No-Action Alternative B2Required forConstruction 3Voluntary LandAcquisition Areas 4 TotalBuckeye Brook North 236.9 268.9 +33.5 (1.5) +32.0Warwick Pond 11.7 12.6 +0.9 0 +0.9Buckeye Brook South 161.6 196.6 +35.0 0 +35.0Mill Cove (cumulative) 5 410.3 478.1 +65.3 (1.5) +67.8Tuscatucket Brook 35.0 48.4 +13.4 0 +13.4Callahan Brook 24.3 22.9 0 (1.4) (1.4)Brush Neck Cove (cumulative) 6 59.3 71.3 +13.4 (1.4) +12.0Total 469.6 549.4 +78.7 (2.9) +79.9Source: VHB, Inc.1 Portions of the watersheds that fall within the maximum combined footprint of the Alternatives (including both on- and off-<strong>Airport</strong> areas). 2 Includes existing pavement, proposed pavement, and impervious surfaces from land acquisitions. Existing roadways were assumed to remain impervious.3 Construction elements include EMAS, parking, roadways, taxiways, and RSA and RPZ clearing, depending on drainage area.4 Associated with the Completed and Current Part 150 VLAP.5 The Mill Cove drainage area consists of the combined Buckeye Brook North, Warwick Pond, and Buckeye Brook South drainage areas evaluated in this analysis.6 The Brush Neck Cove drainage area consists of the combined Tuscatucket Brook and Callahan Brook drainage areas evaluated in this analysis.Table 5-113 shows that Alternative B2 would result in a 17.8-acre increase to the total area of roadways andparking, however, all new roadway and parking areas would include mitigation measures designed to meetstate stormwater requirements and would not adversely affect water quality.Chapter 5 - Environmental Consequences 5-214 July 2011\\mawatr\ev\09228.00\reports\<strong>FEIS</strong>_Final_July_2011\<strong>PVD</strong>_CH05_Environmental_Cons_JUL_2011.doc
T.F. <strong>Green</strong> <strong>Airport</strong> <strong>Improvement</strong> <strong>Program</strong>Environmental Impact Statement and Final Section 4(f) EvaluationTable 5-113 Alternative B2: Impervious Roadway and Parking Areas by Drainage Area 1Drainage AreaNo-ActionAlternativeAlternative B2Change in Roadway and Parking Area (acres) 2Required for Voluntary LandConstruction 3 Acquisition Areas 4 TotalBuckeye Brook North 106.8 124.3 +15.9 +1.6 +17.5Warwick Pond 0.8 0.9 +0.1 0.0 +0.1Buckeye Brook South 50.5 53.5 +3.0 0.0 +3.0Mill Cove (cumulative) 5 158.1 178.7 +19.0 +1.6 +20.6Tuscatucket Brook 21.0 18.2 (2.8) 0.0 (2.8)Callahan Brook 19.1 19.1 0.0 0.0 0.0Brush Neck Cove40.1 37.3 (2.8) 0.0 (2.8)(cumulative) 6Total 198.2 216.0 +16.2 +1.6 +17.8Source: VHB, Inc.1 The areas in this table represent the portions of the watersheds that fall within the maximum combined footprint of the Alternatives (including both on- andoff-<strong>Airport</strong> areas). Totals are rounded. Existing roadways were assumed to remain impervious.2 The roadway and parking areas are a subset of the impervious areas referred to in Table 5-112 (e.g., 216.0 acres of the 549.4 acres total impervious acres areattributed to parking and roadway surfaces).3 Construction elements include EMAS, parking, roadways, taxiways, and RSA and RPZ clearing, depending on drainage area.4 Associated with the Completed and Current Part 150 VLAP.5 The Mill Cove drainage area consists of the combined Buckeye Brook North, Warwick Pond, and Buckeye Brook South drainage areas evaluated in this analysis.6 The Brush Neck Cove drainage area consists of the combined Tuscatucket Brook and Callahan Brook drainage areas evaluated in this analysis.Alternative B2 would decrease the amount of road and parking lot impervious surfaces by 2.8 acres in the BrushNeck Cove watershed, improving water quality by removing potential pollutant sources. The 20.6-acre increasein roadway, including Fully Relocated <strong>Airport</strong> Road and parking lot impervious surfaces in the Mill Covewatershed, would include mitigation measures designed to meet state stormwater requirements and would notadversely affect water quality in the receiving waters of Spring <strong>Green</strong> Pond, Buckeye Brook, or Warwick Pond.Table 5-114 shows that Alternative B2 would result in a 1.0 percent increase to the total pollutant load whencompared to the No Action Alternative. Infiltrating stormwater BMPs and pervious surfaces located betweenimpervious surfaces, such as taxiways and runways, and the stormwater collection system would beimplemented to effectively mitigate pollutant loading impacts in receiving waters of Spring <strong>Green</strong> Pond,Buckeye Brook, and Warwick Pond.Alternative B2 would decrease the amount of pollutant loading by 0.3 percent in the Brush Neck Covewatershed, improving water quality by removing potential pollutant sources. The 1.3 percent increase topollutant loads in the Mill Cove watershed would include mitigation measures designed to meet statestormwater requirements and therefore would not adversely affect water quality.Alternative B2 would increase the use of glycol for aircraft deicing proportionate to the increase in departingflights, as shown in Table 5-115. The average use of glycol (depending on weather) would increase by8.8 percent in 2020 and 8.3 percent in 2025 relative to the No-Action Alternative. Without the proposed deicermanagement system which will be in place by 2015, increased glycol usage could impact water quality.However, the use of the glycol blending facility and deicer management system (both constructed as part of theNo-Action Alternative) would not substantially increase glycol use or discharge.Chapter 5 - Environmental Consequences 5-215 July 2011\\mawatr\ev\09228.00\reports\<strong>FEIS</strong>_Final_July_2011\<strong>PVD</strong>_CH05_Environmental_Cons_JUL_2011.doc
T.F. <strong>Green</strong> <strong>Airport</strong> <strong>Improvement</strong> <strong>Program</strong>Environmental Impact Statement and Final Section 4(f) EvaluationTable 5-114 Annual Pollutant Loading by Drainage Area 1 (Alternative B2)Pollutant 2PercentageChange fromDrainage Area TSS P N Cu Pb Zn BOD COD Bacteria No ActionBuckeye Brook North 46,396 77 711 0 11 16 2,474 30,931 525,827 0.7%Warwick Pond 1,968 3 30 0 0 1 105 1,312 22,304 5.2%Buckeye Brook South 35,731 60 548 0 8 12 1,906 23,821 404,954 1.9%Mill Cove (cumulative) 3 84,095 140 1,289 0 19 29 4,485 56,064 953,085 1.3%Tuscatucket Brook 10,931 18 168 0 3 4 583 7,287 123,887 -0.4%Callahan Brook 9,853 16 151 0 2 3 526 6,569 111,670 -0.2%Brush Neck Cove (cumulative) 4 19,138 32 294 0 5 7 1,021 12,758 216,894 -0.3%Total 103,233 172 1,583 0 24 36 5,506 68,822 1,169,979 1.0%Source: VHB, Inc. TSS = Total Suspended Solids, P = Phosphorus, N = Nitrogen, Cu = Copper, Pb = Lead, Zn = Zinc, BOD = Biological Oxygen Demand, and COD =Chemical Oxygen Demand.1 A Highway Land Use Category was assumed the most appropriate Land Use Category for T.F. <strong>Green</strong> to determine the Event Mean Concentrations (EMCs)values. Other categories include Residential, Commercial, Industrial, and Undeveloped/Rural.2 The pollutants loading listed in this table represent the potential annual loading rate for the five drainage areas, totaling 1,360 acres, without the installation ofstormwater BMPs. Pollutants were calculated using the Simple Method (Schuster, 1987) which requires estimates of annual rainfall, site impervious cover, landuse type, and pollutant loading coefficients based on land use. Totals are rounded.3 The Mill Cove drainage area consists of the combined Buckeye Brook North, Warwick Pond, and Buckeye Brook South drainage areas evaluated in this analysis.4 The Brush Neck Cove drainage area consists of the combined Tuscatucket Brook and Callahan Brook drainage areas evaluated in this analysis.Table 5-115Alternative B2 and Alternative B4 Anticipated Annual Deicing Fluid UsageTotal GlycolAircraft Usage Change ChangeYear and Scenario Departures (gallons) (gallons) (percent)2004-2006 average annual 60,714 133,7752015 No-Action Alternative 46,750 71,9952015 No-Action plus Alternative B4 50,553 77,851 +5,856 +8.1%2020 No-Action Alternative 49,665 76,4842020 No-Action plus Alternative B2 or B4 54,058 83,249 +6,765 +8.8%2025 No-Action Alternative 52,776 81,2752025 No-Action plus Alternative B2 or B4 57,156 88,020 +6,745 +8.3%Source: VHB, Inc.Notes: Baseline glycol use is average of 2004-2005 and 2005-2006 years Alternatives B2 and B4 have the same predicted increase in the number of aircraft operations(12 departing flights per day) with operations beginning in 2015 for Alternative B4 and 2020 for Alternative B2. Based on revised 2010 <strong>FEIS</strong> No-Action operationsforecast.Chapter 5 - Environmental Consequences 5-216 July 2011\\mawatr\ev\09228.00\reports\<strong>FEIS</strong>_Final_July_2011\<strong>PVD</strong>_CH05_Environmental_Cons_JUL_2011.doc
T.F. <strong>Green</strong> <strong>Airport</strong> <strong>Improvement</strong> <strong>Program</strong>Environmental Impact Statement and Final Section 4(f) EvaluationIndirect ImpactsAlternative B2 would increase the amount of parking areas and roadways within the <strong>Green</strong>wich Bay watershedby 17.8 acres. All new roadway and parking areas would include mitigation measures designed to meet statestormwater requirements and would not adversely affect water quality. Alternative B2 would therefore notresult in adverse indirect impacts to the coastal watershed.Significant Impacts: Alternative B2 would not result in significant impacts to water quality. Increases inimpervious surfaces are mitigated for Alternative B2 through the design of a stormwater management systemdeveloped in compliance with regulatory standards.5.11.4.3 Alternative B4This section describes the direct and indirect impacts that would occur under Alternative B4. Table 5-116 shows thechanges in impervious area within the affected drainage areas. This analysis has been revised since the DEIS andnow assumes that the existing roadways will not be removed within the acquisition areas with the exception ofroadways that are to be relocated, such as <strong>Airport</strong> Road, or are physically impacted by the <strong>Improvement</strong> <strong>Program</strong>.Compared to the No-Action Alternative, Alternative B4 would increase the total impervious area by 70.2 acres, ofwhich the majority is split among the Buckeye Brook North drainage area (21.9 acres caused by the new taxiways,and Integrated Cargo areas), the Buckeye Brook South drainage area (34.9 acres caused by the new Runway 16-34RSA enhancements, the new taxiways, and the south service area) and the Tuscatucket Brook watershed (14.6 acrescaused by the Runway 5-23 extension). These would be partially offset by decreases due to removing commercial andresidential parking lots required for construction. Alternative B4 would include stormwater controls that willmanage discharges to Warwick Pond, Buckeye Brook North, Buckeye Brook South, and Tuscatucket Brook andwould limit peak flows and erosion at the outfalls and in the downstream reaches of these brooks. In addition,Callahan Brook would have reduced overall peak flow due to the decreased impervious area in the watershed.Table 5-116 Impervious Surfaces by Drainage Area (Alternative B4)Impervious Area (acres) 1 Alternative B4 Change in Impervious Area (acres) 2Drainage Area No-Action Alt. B4Required forConstruction 3Voluntary LandAcquisition Areas 4 TotalBuckeye Brook North 237.0 258.9 +21.9 0 +21.9Warwick Pond 11.7 12.9 +1.2 0 +1.2Buckeye Brook South 161.6 196.5 +34.9 0 +34.9Mill Cove (cumulative) 5 410.3 468.3 +58.0 0 +58.0Tuscatucket Brook 35.0 49.6 +15.0 (0.4) +14.6Callahan Brook 24.3 21.9 +1.1 (3.5) (2.4)Brush Neck Cove (cumulative) 6 59.3 71.5 +16.1 (3.9) +12.2Total 469.6 539.8 +74.1 (3.9) +70.2Source: VHB, Inc.1 Portions of the watersheds that fall within the maximum combined footprint of the Alternatives (including both on and off <strong>Airport</strong> areas). 2 Includes existing pavement, proposed pavement, and impervious surfaces from land acquisitions. Existing roadways were assumed to remain impervious.3 Construction elements include EMAS, parking, roadways, taxiways, and RSA and RPZ clearing, depending on drainage area.4 Associated with the Completed and Current Part 150 VLAP.5 The Mill Cove drainage area consists of the combined Buckeye Brook North, Warwick Pond, and Buckeye Brook South drainage areas evaluated in this analysis.6 The Brush Neck Cove drainage area consists of the combined Tuscatucket Brook and Callahan Brook drainage areas evaluated in this analysis.Chapter 5 - Environmental Consequences 5-217 July 2011\\mawatr\ev\09228.00\reports\<strong>FEIS</strong>_Final_July_2011\<strong>PVD</strong>_CH05_Environmental_Cons_JUL_2011.doc
T.F. <strong>Green</strong> <strong>Airport</strong> <strong>Improvement</strong> <strong>Program</strong>Environmental Impact Statement and Final Section 4(f) EvaluationTable 5-117 shows that Alternative B4 would not result in any change to the total area of roadways and parking.The majority of the increases in impervious surfaces for Alternative B4 is not from new roadways or parkingareas, but is the result of new runway, taxiway, and building areas. The construction of any new imperviousareas would be designed to meet the 2010 Rhode Island Stormwater Design and Installation Standards Manual andtherefore would not adversely affect water quality. The partial relocation of <strong>Airport</strong> Road and the relocation ofportions of the <strong>Airport</strong> service roads in the Mill Cove drainage area, and the 4.5 acres of new roadways andparking areas in the Brush Neck Cove drainage area would not adversely affect downstream water quality andwould reduce potential pollutant loading to receiving Callahan Brook streams.Alternative B4 would decrease the amount of road and parking lot impervious surfaces by 1.0 acres in the BrushNeck Cove watershed, thus improving water quality by removing potential pollutant sources. The 1.0 acreincrease in roadway and parking lot impervious surfaces in the Mill Cove watershed would include mitigationmeasures designed to meet state stormwater requirements and would not adversely affect water quality in thereceiving waters of Buckeye Brook and Warwick Pond.Table 5-117 Alternative B4: Impervious Roadway and Parking Areas by Drainage Area 1Change in Roadway and Parking Area (acres) 2Voluntary LandNo-Action Required for AcquisitionDrainage Area Alternative Alternative B4 Construction 3 Areas 4 TotalBuckeye Brook North 106.8 106.8 0.0 0.0 0.0Warwick Pond 0.8 0.8 0.0 0.0 0.0Buckeye Brook South 50.5 51.5 +1.0 0.0 +1.0Mill Cove (cumulative) 5 158.1 159.1 +1.0 0.0 +1.0Tuscatucket Brook 21.0 18.5 (4.0) +1.5 (2.5)Callahan Brook 19.1 20.6 (0.5) +2.0 +1.5Brush Neck Cove (cumulative) 6 40.1 39.1 (4.5) +3.5 (1.0)Total 198.2 198.2 (3.5) +3.5 0.0Source: VHB, Inc.1 The areas in this table represent the portions of the watersheds that fall within the maximum combined footprint of the Alternatives (including both on- andoff-<strong>Airport</strong> areas). Totals are rounded. Existing roadways were assumed to remain impervious.2 The roadway and parking areas are a subset of the impervious areas referred to in Table 5-116 (e.g., 198.2 acres of the 539.8 acres total impervious acres areattributed to parking and roadway surfaces).3 Construction elements include EMAS, parking, roadways, taxiways, and RSA and RPZ clearing, depending on drainage area.4 Associated with the Completed and Current Part 150 VLAP.5 The Mill Cove drainage area consists of the combined Buckeye Brook North, Warwick Pond, and Buckeye Brook South drainage areas evaluated in this analysis.6 The Brush Neck Cove drainage area consists of the combined Tuscatucket Brook and Callahan Brook drainage areas evaluated in this analysis.Table 5-118 shows that Alternative B4 would result in a 0.9 percent increase to the total pollutant load whencompared to the No-Action Alternative. Infiltrating stormwater BMPs and pervious surfaces located betweenimpervious surfaces (taxiways and runways) and the stormwater collection system would effectively mitigatepollutant loading impacts in receiving waters of Spring <strong>Green</strong> Pond, Buckeye Brook, and Warwick Pond.Chapter 5 - Environmental Consequences 5-218 July 2011\\mawatr\ev\09228.00\reports\<strong>FEIS</strong>_Final_July_2011\<strong>PVD</strong>_CH05_Environmental_Cons_JUL_2011.doc
T.F. <strong>Green</strong> <strong>Airport</strong> <strong>Improvement</strong> <strong>Program</strong>Environmental Impact Statement and Final Section 4(f) EvaluationTable 5-118 Annual Pollutant Loading by Drainage Area 1 (Alternative B4)Pollutant 2 (mg/l)Drainage Area TSS P N Cu Pb Zn BOD COD BacteriaPercentageChange fromNo-ActionBuckeye Brook North 46,346 77 711 0 11 16 2,472 30,897 525,256 0.6%Warwick Pond 2,123 4 33 0 0 1 113 1,415 24,060 13.5%Buckeye Brook South 35,507 59 544 0 8 12 1,894 23,671 402,413 1.2%Mill Cove (cumulative) 3 83,976 140 1,288 1 20 29 4,479 55,984 951,729 1.2%Tuscatucket Brook 12,184 20 187 0 3 4 650 8,122 138,080 11.0%Callahan Brook 8,596 14 132 0 2 3 458 5,731 97,424 -12.9%Brush Neck Cove (cumulative) 4 20,780 35 319 0 5 7 1,108 13,853 235,505 -0.3%Total 104,756 175 1,606 1 24 36 5,587 69,837 1,187,234 0.9%Source: VHB, Inc. TSS = Total Suspended Solids, P = Phosphorus, N = Nitrogen, Cu = Copper, Pb = Lead, Zn = Zinc, BOD = Biological Oxygen Demand, andCOD = Chemical Oxygen Demand.1 A Highway Land Use Category was assumed the most appropriate Land Use Category for T.F. <strong>Green</strong> to determine the Event Mean Concentrations (EMCs)values. Other categories include Residential, Commercial, Industrial, and Undeveloped/Rural.2 The pollutants loading listed in this table represent the potential annual loading rate for the five drainage areas, totaling 1,360 acres, without the installation ofstormwater BMPs. Pollutants were calculated using the Simple Method (Schuster, 1987) which requires estimates of annual rainfall, site impervious cover, landuse type, and pollutant loading coefficients based on land use. Totals are rounded.3 The Mill Cove drainage area consists of the combined Buckeye Brook North, Warwick Pond, and Buckeye Brook South drainage areas evaluated in this analysis.4 The Brush Neck Cove drainage area consists of the combined Tuscatucket Brook and Callahan Brook drainage areas evaluated in this analysis.Alternative B4 would decrease the amount of pollutant loading by 0.3 percent in the Brush Neck Covewatershed, improving water quality by removing potential pollutant sources. The 1.2 percent increase topollutant loads in the Mill Cove watershed would include mitigation measures designed to meet statestormwater requirements and therefore would not adversely affect water quality.The use of glycol for aircraft deicing would be the same as for Alternative B2 and is discussed in the impactassessment for Alternative B2. As a result of increased operations, Alternative B4 would increase the amount ofglycol used for deicing departing aircraft. However, with the glycol blending facility and proposed new deicermanagement system (both constructed as part of the No-Action Alternative), the use and discharge of glycolwould not substantially increase.Indirect ImpactsAlternative B4 would not result in any net change to the total area of roadways and parking within the <strong>Green</strong>wichBay watershed. The majority of the increases in impervious surfaces for Alternative B4 are not from new roadways orparking areas, but are the result of new runway, taxiway, and building areas. All new roadways and parking areaswould include mitigation measures that would improve downstream water quality proportional to the new 4.5 acresof roadway and parking areas and would reduce potential pollutant loading to receiving streams (Table 5-117).Alternative B4 would therefore not result in adverse indirect impacts to the coastal watershed.Significant Impacts: Alternative B4 would not result in significant impacts to water quality. Increases inimpervious surfaces would be mitigated for Alternative B4 through the design of a stormwater managementsystem developed in compliance with regulatory standards.Chapter 5 - Environmental Consequences 5-219 July 2011\\mawatr\ev\09228.00\reports\<strong>FEIS</strong>_Final_July_2011\<strong>PVD</strong>_CH05_Environmental_Cons_JUL_2011.doc
T.F. <strong>Green</strong> <strong>Airport</strong> <strong>Improvement</strong> <strong>Program</strong>Environmental Impact Statement and Final Section 4(f) Evaluation5.11.5 Short-term Impacts from Temporary Construction ActivitiesIn the absence of mitigation, the construction phases for Alternatives B2 and B4 could result in short-term,temporary impacts that would end when construction is complete. As the construction would take severalyears, these impacts would vary as different phases of the <strong>Improvement</strong> <strong>Program</strong> were completed. A RIPDESpermit for construction activities would specify measures that the <strong>Airport</strong> would be required to implement toprevent construction-related stormwater impacts.Although Alternative B2 and B4 are different, their construction-related impacts would be similar, if notidentical. Therefore, the construction impacts are grouped by type rather than by Alternative B2 or B4. Waterquality impacts due to construction could be caused by four primary types of activities: erosion and dischargeof sediment from earthwork; spills of hazardous materials; channel relocation; and dewatering.5.11.5.1 Erosion and Discharge of Sediment from EarthworkThe construction of RSAs, taxiways, runways, roads, and buildings would expose unvegetated soil that coulderode and be deposited in the <strong>Airport</strong>’s waterways and receiving waters, if appropriate mitigation measureswere not taken.5.11.5.2 Fuel SpillsConstruction using heavy equipment involves hydraulic fluids and would require storing and transporting fuelon site. An accidental release of hydraulic fluid, or fuel during refueling could have the potential to contaminatesoil, groundwater, and surface water. Spill containment procedures, including limiting the areas in whichfueling could be performed, would be implemented to minimize this risk.5.11.5.3 Channel RelocationAlternatives B2 and B4 would require relocating waterway channels. Newly constructed channels could contributesediment into the stream during an initial establishment period, which could lead to a temporary increase inturbidity downstream. Erosion control would be necessary during construction to contain sediment andcontaminants to prevent turbidity downstream and short term impacts.5.11.5.4 DewateringAlternatives B2 and B4 may require dewatering of excavations during construction activities to keep excavated areasfree of groundwater (fill and construction near the Runway 34 End, the relocation of existing <strong>Airport</strong> Road, and therelocation of stream channels). Under Alternative B4, the realignment of Main Avenue could also require dewatering.Untreated dewatering fluids typically contain silt and suspended sediments, which could be harmful to surfacewaters if discharged directly. Dewatering could also expose pollutants from contaminated groundwater, particularlynear contaminated sites such as the former Truk-Away Landfill near the Runway 34 End; all dewatering will be inaccordance with RIDEM requirements. Although the groundwater at the former Truk-Away Landfill has beenshown to meet Rhode Island groundwater quality objectives, the remaining light non-aqueous phase liquid (LNAPL)and contaminated soil at the site may contribute pollutants to dewatering discharges nearby. Both alternatives wouldbe designed to avoid disturbing Truk-Away Landfill soils. No dewatering will occur unless a RIPDES permit isobtained. These effects would be minimized using appropriate mitigation measures, as described in Chapter 6,Mitigation.Chapter 5 - Environmental Consequences 5-220 July 2011\\mawatr\ev\09228.00\reports\<strong>FEIS</strong>_Final_July_2011\<strong>PVD</strong>_CH05_Environmental_Cons_JUL_2011.doc
T.F. <strong>Green</strong> <strong>Airport</strong> <strong>Improvement</strong> <strong>Program</strong>Environmental Impact Statement and Final Section 4(f) Evaluation5.11.6 Cumulative ImpactsOver the last several decades, the City of Warwick has become more urbanized and the <strong>Airport</strong> has expanded insize. The lack of long-term historical water quality data makes it difficult to quantify the exact impact ofurbanization, but the qualitative changes to surface water bodies are clearly visible on the historical photographs.Since 1939, large areas of farmland in the City of Warwick have been replaced by residential development,including many new roads and buildings. This urbanization included a municipal stormwater system, whichconveys runoff from the streets into the local surface waters with little or no treatment. Replacing vegetatedareas with streets and urban structures has reduced groundwater recharge, increased peak flows during storms,and increased the potential for surface water contamination and stream erosion.Buckeye Brook receives the stormwater from hundreds of acres of residential development and approximately80 percent of the <strong>Airport</strong> (refer to Figure 5-43). It is highly likely that the impaired water quality in Buckeye Brook,Warwick Pond, and Mill Cove (part of the Upper Narragansett Bay watershed) is due in part to this urbanization.In addition to general impairment due to urbanized runoff, Buckeye Brook receives discharges from the <strong>Airport</strong>(combined flow from Outfalls 005A through 008A). The <strong>Airport</strong> has continuously improved the collection ofglycol-impacted stormwater, thereby reducing the <strong>Airport</strong>’s impacts on local water bodies. Additionalimprovements set forth in the No-Action Alternative will continue to reduce the amount of glycol-impactedstormwater during the deicing season. Under the No-Action Alternative, some benefits to water quality areanticipated regardless of whether or not the <strong>Improvement</strong> <strong>Program</strong> is implemented. Development unrelated to the<strong>Airport</strong> is expected in the Study Area, which is assumed to be constructed in accordance with RIPDESrequirements and would not affect water quality.Tuscatucket Brook and Callahan Brook, which discharge to Brush Neck Cove (part of the <strong>Green</strong>wich Baywatershed), are surrounded by urban development and major roads such as Main Avenue andWest Shore Road. These water bodies are impaired due to elevated bacteria levels due to past changes andpresent uses within the watershed. Brush Neck Cove is considered a valuable and sensitive water body and iscurrently impaired due to pathogens, excess nutrients, and low dissolved oxygen. It receives runoff from only20 percent of the <strong>Airport</strong> (via Tuscatucket Brook) and receives the rest of its flow from the urbanized residentialareas surrounding the <strong>Airport</strong>. The secondary deicing area near the Runway 5 End discharges to Brush NeckCove via Tuscatucket Brook, which may impact Tuscatucket Brook. However, the deicing area is rarely usedand involves far less glycol than the primary deicing locations.In the No-Action Alternative, development unrelated to the <strong>Airport</strong> occurs in the Study Area, such as InterLink,constructed west of Post Road (completed in December 2010). The former Fain Farm property north of existing<strong>Airport</strong> Road is the intended site of a new retail development. In addition to these projects, minor improvementsare proposed for existing <strong>Airport</strong> Road. These are assumed to be constructed in accordance with RIPDESrequirements and would not affect water quality.The <strong>Airport</strong> has a variety of recovery measures in place to reduce the amount of deicing fluid that enters thestormwater system. RIAC has constructed a blending facility to reduce the amount of glycol used at the <strong>Airport</strong>,and made improvements to glycol collection, control, and recovery systems. These measures include the captureof glycol using catch basin inserts, vacuum trucks, and glycol-recovery vehicles with scrubbers. These measureshave reduced the magnitude of the <strong>Airport</strong>’s impacts on local water bodies in recent years, and implementingChapter 5 - Environmental Consequences 5-221 July 2011\\mawatr\ev\09228.00\reports\<strong>FEIS</strong>_Final_July_2011\<strong>PVD</strong>_CH05_Environmental_Cons_JUL_2011.doc
T.F. <strong>Green</strong> <strong>Airport</strong> <strong>Improvement</strong> <strong>Program</strong>Environmental Impact Statement and Final Section 4(f) Evaluationnew measures would further reduce the amount of unrecovered deicing fluid entering the stormwater system.The improved glycol collection and diversion system and new glycol treatment facility that RIAC intends toimplement under a revised SWPPP to meet the terms of the RIPDES permit will further reduce the discharge ofglycol-impacted stormwater during the deicing season.In the foreseeable future, operations would decline at the <strong>Airport</strong> before increasing again beginning at a modestrate in 2012 due to the recent national economic recession. By 2025, aircraft operations at T.F. <strong>Green</strong> <strong>Airport</strong> areforecast to be similar to the 2004 activity level.Operations would increase over the No-Action Alternative for Alternatives B2 and B4 by 8.0 percent in 2020 and8.3 percent in 2025. The deicing and fueling operations associated with the flights would take place within theMill Cove drainage area, affecting the same urbanized water bodies that already receive runoff from the City ofWarwick and from the <strong>Airport</strong>. If BMPs were not implemented, the increases in operations could impact waterquality in tributaries to Mill Cove. Impacts will be avoided by the glycol blending system and implementationof the new deicing management system and by implementing stormwater BMPs such as detention- andinfiltration-based systems to prevent hydrologic impacts.With the implementation of BMPs, Alternatives B2 and B4 are not expected to have an adverse effect on thehydrology or water quality of the Brush Neck Cove and Mill Cove watersheds or the larger watersheds(Upper Narragansett Bay and <strong>Green</strong>wich Bay). The changes in the amount of impervious surface would be lessthan 17 percent, and increases in peak discharge would be mitigated by compliance with stormwaterregulations. Any potential effects on water quality would be negligible.5.11.7 Comparison of Alternatives B2 and B4This section presents a comparison of impacts associated with Alternatives B2 and B4.5.11.7.1 Significant ImpactsAlternatives B2 and B4 would not result in significant water quality impacts since they would be designed incompliance with all applicable state and federal regulatory standards, including the 2010 RIDEM StormwaterDesign and Installation Standards Manual, to mitigate the significant impacts to water quality and ensure thereceiving waters are not impacted from new discharges. While Alternatives B2 and B4 both would increaseimpervious surfaces and the amount of glycol used for deicing departing aircraft, the proper design of a newstormwater management system and construction of the new deicer management system would ensure that bothAlternatives would meet state stormwater standards.5.11.7.2 Other ImpactsAlternative B2 would result in a net increase in roadway and parking area (impervious surfaces), with a17.8-acre net increase (Table 5-119), and Alternative B4 would result in no net change in roadway and parkingarea (impervious surfaces). The majority of the increases in impervious surfaces for both Alternatives are theresult of new runway, taxiway, and building impervious areas. Alternative B2 and B4 would also result in a1.0 and 0.9 percent net increase in pollutant loading respectively (Table 5-120), corresponding to the changes inimpervious surfaces. Alternatives B2 and B4 require mitigation measures designed to meet state stormwaterrequirements and would not adversely affect water quality. Additional measures to separate imperviousChapter 5 - Environmental Consequences 5-222 July 2011\\mawatr\ev\09228.00\reports\<strong>FEIS</strong>_Final_July_2011\<strong>PVD</strong>_CH05_Environmental_Cons_JUL_2011.doc
T.F. <strong>Green</strong> <strong>Airport</strong> <strong>Improvement</strong> <strong>Program</strong>Environmental Impact Statement and Final Section 4(f) Evaluationsurfaces, such as taxiways and runways, from the closed drainage system would further decrease pollutantloading.Alternative B4 includes small local increases in impervious surfaces within specific drainage areas that wouldrequire additional treatment. For example, Alternative B4 includes a small increase (1.0 acres in the BuckeyeBrook South drainage area, 1.5 acres in the Callahan Brook drainage area) in roadway area discharging toBuckeye Brook south of Warwick Pond and Callahan Brook, although there is no net increase within anydrainage area. Additionally, Alternatives B2 and B4 include small local increases in pollutant loading,corresponding to the increases in impervious surfaces within the drainage area that would require additionaltreatment. For example, Alternative B2 and B4 include an increase (5.2 and 13.5 percent in the Warwick Ponddrainage area respectively) in the pollutant loading from the area draining to Warwick Pond. Overall, thepollutant loading would be greater for Alternative B2.In the absence of mitigation, any local increases in roadway area could increase pollutant loads entering thereceiving waters from a specific outfall. Alternatives B2 and B4 would include BMPs for any new roadways andparking areas to meet Rhode Island water quality regulations and TSS removal requirements. As a result ofthese BMPs and the net decrease in roadway area, neither Alternative B2 nor B4 would cause downstreamwater quality impacts from roadway runoff.Alternatives B2 and B4 would have similar construction period impacts, including potential contact withgroundwater near the former Truk-Away Landfill site. Rhode Island requirements for handling contaminatedmaterials and preventing environmental impacts from erosion would be followed.Overall, Alternative B2 would have greater water quality impacts than Alternative B4 due to a substantial increase inroadway and parking areas. Alternative B2 requires greater overall new impervious area and would have a newstormwater discharge to Spring <strong>Green</strong> Pond from the Fully Relocated <strong>Airport</strong> Road. Alternatives B2 and B4 wouldreduce roadway and parking areas within the Tuscatucket Brook watershed and the Brush Neck Cove watershed asa whole, thereby reducing pollutant loading. This analysis shows that, with mitigation, Alternatives B2 and B4 wouldmeet state stormwater standards and other stormwater BMPs would avoid or mitigate any water quality problems.Table 5-119Measure of ImpactComparison of Impervious Surface ChangesTotal Impervious Surface Area (acres)No-ActionAlternativeAlternativeB2AlternativeB4Change in Area (acres) 1AlternativeB2AlternativeB4Impervious Area in Mill Cove Drainage Area410.3478.1468.3+67.8+58.0Impervious Area in Brush Neck Cove Drainage Area59.371.371.5+12.0+12.2Total Impervious Area469.6549.4539.8+79.8+70.2Roadway and Parking Area in Mill Cove Drainage Area 2Roadway and Parking Area in Brush Neck Cove Drainage Area 2Total Roadway and Parking Area 2 158.140.1198.2178.737.3216.0159.139.1198.2Source: VHB, Inc.1 All changes in this table are relative to the No-Action Alternative. Totals rounded.2 Roadway and parking area is a subset of the impervious area and is included in the overall impervious area measurements.+20.6(2.8)+17.8+1.0(1.0)0.0Chapter 5 - Environmental Consequences 5-223 July 2011\\mawatr\ev\09228.00\reports\<strong>FEIS</strong>_Final_July_2011\<strong>PVD</strong>_CH05_Environmental_Cons_JUL_2011.doc
T.F. <strong>Green</strong> <strong>Airport</strong> <strong>Improvement</strong> <strong>Program</strong>Environmental Impact Statement and Final Section 4(f) EvaluationTable 5-120Comparison of Pollutant Loading ChangesPercentage Change from No–Action AlternativeDrainage Area Alternative B2 Alternative B4Buckeye Brook North 0.7% 0.6%Warwick Pond 5.2% 13.5%Buckeye Brook South 1.9% 1.2%Mill Cove (cumulative) 1.3% 1.2%Tuscatucket Brook -0.4% 11.0%Callahan Brook -0.2% -12.9%Brush Neck Cove (cumulative) -0.3% -0.3%Total 1.0% 0.9%Source: VHB, Inc.Notes: All changes in this table are relative to the No-Action Alternative. Totals rounded.5.11.8 Avoidance and MinimizationFor the T.F. <strong>Green</strong> <strong>Airport</strong> <strong>Improvement</strong> <strong>Program</strong>, total avoidance of the potential to impact water qualitywould not be possible, as Alternatives B2 and B4 would involve new impervious surfaces, new parking, andincreased aircraft operations. However, the design of Alternatives B2 and B4 includes avoidance andminimization efforts to prevent any risks to water quality.Alternatives B2 and B4 would minimize water quality impacts by reducing roadway and parking areas within theTuscatucket Brook and Brush Neck Cove Watersheds, thereby reducing pollutant loading. In addition,Alternatives B2 and B4 would include improved water quality treatment for the relocation of existing roadways(<strong>Airport</strong> Road and Main Avenue).The design of Alternatives B2 and B4 includes avoidance and minimization efforts to prevent any risks to waterquality by:• Minimizing the limits of work by keeping access roads as close to the airfield as practicable;• Reusing existing pipes, channels, and outfall structures wherever possible;• Avoiding encroachment onto the former Truk-Away Landfill site, which may contain subsurfacecontamination;• Using a closed stormwater system in the airfield to avoid introduction of any additional contaminants tostormwater runoff; and• Keeping potential pollutant sources such as fuel storage and deicing areas within the same watersheds asunder the baseline condition to avoid affecting any additional receiving waters.Specific water quality mitigation measures for Alternatives B2 and B4 are described in Chapter 6, Mitigation.Chapter 5 - Environmental Consequences 5-224 July 2011\\mawatr\ev\09228.00\reports\<strong>FEIS</strong>_Final_July_2011\<strong>PVD</strong>_CH05_Environmental_Cons_JUL_2011.doc
T.F. <strong>Green</strong> <strong>Airport</strong> <strong>Improvement</strong> <strong>Program</strong>Environmental Impact Statement and Final Section 4(f) Evaluation5.12 Fish, Wildlife, and PlantsThis section provides an overview of the impact analysis for fish, wildlife, and plants (collectively, the bioticcommunity), including state-listed endangered or threatened species and their habitat, and provides the methodologyfor determining potential impacts to species. Potential project-related impacts to federally-listed threatened andendangered species are considered separately in Section 5.13, Federal Threatened and Endangered Species.5.12.1 Regulatory ContextFish, wildlife, and plants are regulated by several federal government entities including the USFWS, EPA, DOI,USDA, and DOT. In compliance with the Fish and Wildlife Coordination Act, when a federally approved orfinanced action would affect a stream or water body, the responsible federal agency must consult with theUSFWS. The FAA is required to review an application for an airport development action involving a majorrunway extension and to determine if the action would have significant impacts on fish, wildlife, and plants.All biotic community analyses were conducted in accordance with the requirements of the FAA Order 1050.1E,section 8.1i, FAA Advisory Circular (AC) 150/5200-33a, 411 and the Fish and Wildlife Coordination Act. 412 FAAAC 150/5200-33a provides guidance on locating certain land uses having the potential to attract wildlife that ishazardous to aircraft operations or in the vicinity of public-use airports. The AC also provides guidanceconcerning the placement of new airport development projects (including airport construction, expansion, andrenovation) pertaining to aircraft movement in the vicinity of hazardous wildlife attractants. 413 ExecutiveOrder 13112, Invasive Species, provides guidance on the definition, prevention, response, and monitoring ofinvasive species and the restoration of native species and habitat conditions in ecosystems that have been invaded.The Rhode Island Natural Heritage <strong>Program</strong> (RINHP) publishes lists of native species of plants and animalsthat are rare within the state. 414 The RINHP defines “endangered” as a native species in imminent danger ofextirpation from Rhode Island. Populations of these species have already been reduced to a critically lownumber or have experienced drastic habitat loss or degradation. Immediate management action is required toprevent extinction in the state. A “threatened” species is a native species that is likely to become endangered inthe future if current trends in habitat loss or other detrimental factors remain unchanged. A species of concern isa native species (or subspecies) not considered to be state-endangered or threatened at the present time, but islisted due to various factors of rarity and/or vulnerability. The RINHP maintains and publishes lists of speciesconsidered to be endangered, threatened, or of concern in the state.Plants and animals are also subject to the Rhode Island Endangered Species of Animals and Plants Act (Rhode IslandGeneral Law Title 20, Chapter 37). 415 The RIDEM Division of Fish and Wildlife (DFW) has prepared Rhode411 FAA Advisory Circular 150/5200-33a, Hazardous Wildlife Attractants on or Near <strong>Airport</strong>s, United States Department of Transportation, July 27, 2004.412 16 U.S. Code sections 661-666e413 Ibid.414 Natural Heritage <strong>Program</strong>, Rhode Island Department of Environmental Management, www.dem.ri.gov/programs/bpoladm/plandev/heritage/. 415 Ibid.Chapter 5 - Environmental Consequences 5-225 July 2011\\mawatr\ev\09228.00\reports\<strong>FEIS</strong>_Final_July_2011\<strong>PVD</strong>_CH05_Environmental_Cons_JUL_2011.doc
T.F. <strong>Green</strong> <strong>Airport</strong> <strong>Improvement</strong> <strong>Program</strong>Environmental Impact Statement and Final Section 4(f) EvaluationIsland’s Comprehensive Wildlife Conservation Strategy 416 (CWCS), funded by the USFWS. The CWCS prioritizes thespecies of fish and wildlife within the state that are of Greatest Conservation Need.5.12.2 Significance ThresholdWhile there is no specific significance threshold established for non-listed species under the federal EndangeredSpecies Act of 1973 (the ESA), FAA Order 1050.1E requires that the FAA to consider the project’s effects onnon-listed species population dynamics, sustainability, reproduction rates, natural and artificial mortality(aircraft strikes), and the minimum population size needed to maintain the affected population.5.12.2.1 Finding: No Significant Fish, Wildlife and Plants ImpactsThe analysis shows that Alternatives B2 and B4 would not significantly impact biodiversity because thealternatives would not reduce the habitat size below the level sufficient to sustain species commonly found inthe affected area or adversely impact sensitive habitat supporting plant or animal species not commonlyoccurring in the affected area.5.12.3 MethodologyThis analysis includes an assessment of project-related effects on existing habitats utilized by fish, wildlife, andplant species that are uncommon within the Project Area along with species that are commonly found in theaffected areas. The evaluation of impacts to plant and animal species include direct impacts and indirect impacts.5.12.3.1 Direct Impacts MethodologyDirect impacts to biotic communities include both long-term and short-term impacts. Long-term direct effectscan occur either as the loss of an area through development or conversion of a habitat type to a different type.Cutting a forest to construct a paved runway extension or filling a stream channel to construct a service road areexamples of direct impacts involving habitat loss.Direct impacts were evaluated by overlaying the limits of work for Alternatives B2 and B4, and theNo-Action Alternative, on base mapping depicting 2004 Baseline Condition water features and vegetation.Direct impacts were quantified by area and percent of a particular vegetation cover type altered. The knownelement occurrences of state-listed wildlife and plant species were also depicted on base plans to determine ifexisting populations would be directly impacted.5.12.3.2 Indirect Impacts MethodologyIndirect impacts are defined as the consequences of an action’s direct impacts. Indirect impacts are generally notquantifiable and may occur over a longer time or larger area. From the example above, cutting part of a forest(direct impact) could reduce the remaining forested area below the minimum habitat size required to supportsurvival and reproduction of a particular species (indirect impact). Indirect impacts also include reasonablyforeseeable indirect consequences to biotic communities caused by a proposed action that would occur either inthe future or in the vicinity of the direct impacts associated with an action. Generally, indirect impacts areregarded as the results of secondary growth or development induced by the action.416 Rhode Island’s Comprehensive Wildlife Conservation Strategy, Rhode Island Department of Environmental Management, Division of Fish and Wildlife.September 2005.Chapter 5 - Environmental Consequences 5-226 July 2011\\mawatr\ev\09228.00\reports\<strong>FEIS</strong>_Final_July_2011\<strong>PVD</strong>_CH05_Environmental_Cons_JUL_2011.doc
T.F. <strong>Green</strong> <strong>Airport</strong> <strong>Improvement</strong> <strong>Program</strong>Environmental Impact Statement and Final Section 4(f) EvaluationIndirect impacts were evaluated by examining remaining habitats beyond the limits of direct impact to evaluatethe potential effects such as the loss of wildlife corridors, habitat fragmentation, introduction of invasive plantor animal species, or the loss of a critical wildlife habitat element. For example, an action which obstructs theriver herring run between Warwick Pond and Spring <strong>Green</strong> Pond would indirectly curtail spawning in Spring<strong>Green</strong> Pond potentially affecting not only river herring recruitment, but also the populations of predator specieswhich feed on young of the year river herring migrating downstream to the coast. Mussel populations in Spring<strong>Green</strong> Pond that use river herring as larva host species would also be indirectly impacted.Effects on water quality could also impact aquatic fish, wildlife and plant populations. These impacts areconsisted in the previous Section 5.11, Water Quality.5.12.3.3 Cumulative Impacts MethodologyCumulative impacts were determined for the Study and Project Areas for the time frame between 1939 and 2006and the 2025 horizon. Published literature was reviewed for state-wide or regional trends for the fish andwildlife populations and the plant associations present in the Study Area to document historical changes thathave occurred in the Study Area or more generally in the region. Rhode Island’s Comprehensive WildlifeConservation Strategy 417 is an important source of data for historic trends for fish and wildlife species populationsand changes in the plant associations in Rhode Island and this document further identifies fish and wildlifespecies of Greatest Conservation Need based on an analysis of trends. Information on the location of state-listedplant and animal species was also obtained through correspondence with state wildlife specialists.5.12.4 Impact AssessmentThis section evaluates impacts of Alternatives B2 and B4 on aquatic habitats (streams and ponds that supportfish and shellfish populations), terrestrial plant associations, and associated wildlife assemblages. Aquatichabitats are present at the Runway 23 and Runway 34 Ends. Refer to Section 5.10, Wetlands and Waterways, foradditional information on these resources.5.12.4.1 No-Action AlternativeThe No-Action Alternative would not result in any new or changed direct impacts to aquatic habitatssupporting fish and shellfish. The anadromous (migratory) fish run from Narragansett Bay to Warwick Pondand from Warwick Pond to Spring <strong>Green</strong> Pond would not be altered, and existing restrictions to fish passagesuch as the culvert under Lakeshore Drive would remain. The No-Action Alternative would not significantlyimpact aquatic or terrestrial biodiversity. It would maintain desirable terrestrial diversity by maintaining thesmall pine barren, Atlantic White Cedar stand, and grassland community present at the Runway 34 End. TheNo-Action Alternative does not involve the direct loss of habitats as shown in Figures 5-44 and 5-45. However,the No-Action Alternative includes ongoing activities that directly impact biotic communities, including theVMP and WHMP to maintain airfield visibility and control wildlife that may interfere with safe airportoperations. 418, 419 The No-Action Alternative would include beneficial VMP activities south of Runway 34 that417 RIDEM Division of Fish and Wildlife, 2005. 418 Vegetation Management <strong>Program</strong>, Rhode Island <strong>Airport</strong> Corporation, Revised August 2004.419 Wildlife Hazard Management Plan, Rhode Island <strong>Airport</strong> Corporation, Revised February 3, 2006.Chapter 5 - Environmental Consequences 5-227 July 2011\\mawatr\ev\09228.00\reports\<strong>FEIS</strong>_Final_July_2011\<strong>PVD</strong>_CH05_Environmental_Cons_JUL_2011.doc
T.F. <strong>Green</strong> <strong>Airport</strong> <strong>Improvement</strong> <strong>Program</strong>Environmental Impact Statement and Final Section 4(f) Evaluationwould maintain a small, locally uncommon, pine barren community that supports sickle-leaved golden aster, astate-listed plant species of special concern and a state threatened insect, the pine barrens tiger beetle.5.12.4.2 Alternative B2The following section outlines the direct and indirect impacts to fish, wildlife, and plants associated withAlternative B2.Direct ImpactsRunway 16-34Safety enhancements associated with Alternative B2 would not affect aquatic habitats supporting fish orshellfish as impacts to Buckeye Brook are avoided. On the Runway 34 End, 510 linear feet of a high gradientintermittent stream (Tributary A11) that does not provide fish or shellfish habitat would be impacted. Thisstream was created as a diversion channel to direct flows around the end of Runway 34 when Runway 16-34was lengthened to 6,081 feet in 1967. A recent study of biodiversity in the Buckeye Brook watershedcommissioned by the RIDEM reported that the lowest macroinvertebrate species diversity observed withinsampled portions of the watershed was within Tributary A. 420 Approximately 340 linear feet of this streamwould be placed in one of two culverts, a 90-linear foot culvert would be installed under the relocated PerimeterRoad near the ATC and a 250-linear foot long culvert would be installed near the southern limit of Taxiway C.The remaining 170-linear feet of channel would be relocated. There are no aquatic habitats at theRunway 16 End.Alternative B2 would avoid impact to habitat of two state-listed species, the pine barrens tiger beetle andsickle-leaved golden aster. Potential habitat for Greatest Conservation Need grassland bird species south ofRunway 34 is avoided. A small (1.4 acres) remnant of a locally uncommon plant community, Atlantic white cedarforested wetland, south of Runway 34 and east of Buckeye Brook would not be impacted by Alternative B2.Runway 5-23Efficiency enhancements under Alternative B2 would relocate approximately 112 linear feet of Buckeye Brook,along a perennial stream segment, which supports a river herring spawning run into Spring <strong>Green</strong> Pond.Alternative B2 would also add an additional 30-foot extension onto the existing 70-foot long Lakeshore Driveculvert for Buckeye Brook. The existing culvert restricts fish passage and extending this culvert could furtherimpair the river herring run into Spring <strong>Green</strong> Pond.Most of the forested wetland impact (1.5 acres) that would be caused by extending Runway 5-23 would occursouth of existing <strong>Airport</strong> Road in Wetland A5, a 14.5-acre wetland, along with a smaller area of upland forestadjacent to Wetland A5. This impact would occur close to the culvert under <strong>Airport</strong> Road where black-crownednight-heron, a state species of special concern, has been observed feeding during river herring runs. This actioncould potentially affect foraging opportunities for this state-listed species.420 Buckeye Brook Biodiversity Impairment Data Report, 2008, ESS Group, 2009.Chapter 5 - Environmental Consequences 5-228 July 2011\\mawatr\ev\09228.00\reports\<strong>FEIS</strong>_Final_July_2011\<strong>PVD</strong>_CH05_Environmental_Cons_JUL_2011.doc
T.F. <strong>Green</strong> <strong>Airport</strong> <strong>Improvement</strong> <strong>Program</strong>Environmental Impact Statement and Final Section 4(f) EvaluationThe grassland and minor areas of shrub and forested habitats that will be impacted north of <strong>Airport</strong> Road(Figure 5-44) were created and are maintained by the VMP. In these areas, only regionally common songbirdsand mammals are present. Tables 5-121 and 5-122 summarize the impacts to common habitat types that wouldoccur under Alternative B2. This analysis demonstrates that sufficient areas to sustain species commonly foundin the Study Area would remain if Alternative B2 were implemented.Fully Relocated <strong>Airport</strong> RoadA total of 2.1 acres of upland forest, 2.7 acres of shrubland, 1.7 acres of forested wetland, 0.1 acres of scrub-shrubwetland, and 7.7 acres of agricultural land would be lost as a result of the full relocation of <strong>Airport</strong> Road. Thesehabitat impacts would occur at the Post Road/Route 37 interchange, the farmland crossed by Fully Relocated<strong>Airport</strong> Road, the forested areas north of Runway 5-23, and at the Warwick Avenue/Fully Relocated <strong>Airport</strong>Road intersection.The reconstruction of the Post Road/Route 37 interchange would have minimal impact on wildlife as much ofthis habitat is currently part of the Route 37 interchange and associated highway right-of-way, and does notsupport natural communities.Fully Relocated <strong>Airport</strong> Road would convert 7.7 acres of a 42.6-acre operating farm to roadway. Although theloss of this farmland habitat would reduce foraging opportunities available to wildlife that may occasionally usethis resource, such as white-tailed deer (Odocoileus virginianus), eastern cottontail (Sylvilagus floridanus), and redfox (Vulpes vulpes), this displacement would not substantially affect the populations of these common suburbanspecies present in the Study Area.The section of Fully Relocated <strong>Airport</strong> Road north of the Runway 23 End would convert forested wetland andupland forest to roadway, minimally reducing available foraging and breeding habitat for common species suchas gray squirrel (Sciurus carolinensis), raccoon, and eastern chipmunk (Tamias striatus). Forest-dwelling birdspecies such as black-capped chickadee (Poecile atricapilla), downy woodpecker (Picoides pubescens), andwhite-breasted nuthatch (Sitta carolinensis) also utilize this habitat. These species are locally common and theloss of habitat is unlikely to significantly reduce local populations.Construction of the intersection of Warwick Avenue and Fully Relocated <strong>Airport</strong> Road would require fillingapproximately 0.1 acres of scrub-shrub wetland in Wetland A3 to create a storm water discharge point for thenew roadway. The widening of Warwick Avenue would impact 0.1 acres of forested wetland in Wetland P outof the total 1.7 acres of forested wetland impacted by Fully Relocated <strong>Airport</strong> Road. These minor impacts wouldoccur at the interface with urban development and it is not anticipated that the much larger remaining habitatwould be significantly affected.Indirect ImpactsWithout mitigation, adding 30 linear feet onto the end of the existing 70-foot long Lakeshore Drive culvert mayobstruct fish passage to spawning habitat in Spring <strong>Green</strong> Pond, thereby reducing productivity of the pond. Asignificant reduction or elimination of the return migration of young-of-the-year (fish that are less than one yearChapter 5 - Environmental Consequences 5-229 July 2011\\mawatr\ev\09228.00\reports\<strong>FEIS</strong>_Final_July_2011\<strong>PVD</strong>_CH05_Environmental_Cons_JUL_2011.doc
T.F. <strong>Green</strong> <strong>Airport</strong> <strong>Improvement</strong> <strong>Program</strong>Environmental Impact Statement and Final Section 4(f) Evaluationold and hatched during spawning season) alewife could in turn impact the productivity of downstream aquatichabitats. This impact could be mitigated with an appropriate culvert replacement (see Chapter 6, Mitigation).The construction of Fully Relocated <strong>Airport</strong> Road would bisect a 7.6-acre block of forested wetland habitat in themiddle of dense residential development. <strong>Airport</strong> property north of Spring <strong>Green</strong> Pond provides a wildlife corridorto this area. The habitat fragmentation associated with the road construction would further diminish the wildlifehabitat that remains after construction.Other indirect impacts to terrestrial habitats would be concentrated at the northern end of the <strong>Airport</strong> at theRunway 23 extension in an area that is managed as part of the VMP. The movement of small mammals, reptiles, andamphibians through wetland corridors associated with Upper Buckeye Brook, Spring <strong>Green</strong> Pond, or the Spring<strong>Green</strong> Brook Inlet would not be affected. The new AMF Access Road through Wetland A5 would further fragmentthis wetland by introducing additional vehicle traffic to the existing security road and could affect populations ofsmall vertebrates. This area is within the <strong>Airport</strong> security fence and larger mammals are already excluded. Theseindirect impacts are not anticipated to substantially diminish local biodiversity.Table 5-121Alternative B2: Impacts to Aquatic HabitatsAquatic ResourceStream LengthAltered(linear feet)Habitat inStudy Area(linear feet)PercentUnaltered Effects of Alteration Species ImpactedSpring <strong>Green</strong> Brook 0 1,088 100% No alteration NoneUpper Buckeye Brook 0 2,206 100% No alteration NoneLower Buckeye Brook 142 2,598 95% Minor relocation of fish runstream, minor loss ofstream habitatBuckeye Brook below Warwick Pond 0 6,746 100% No alteration NoneSpring <strong>Green</strong> Pond Inlet Stream 121 2,020 94% Loss of poor qualityintermittent stream bedhabitatTributary A11 510 2,240 77% Loss of poor qualityintermittent stream bedhabitatTotal Stream Altered 773Altered Fish Run Stream 142Source: VHB, Inc.Alewife, warm-water fish,and macroinvertebratesMacroinvertebratesMacroinvertebratesChapter 5 - Environmental Consequences 5-230 July 2011\\mawatr\ev\09228.00\reports\<strong>FEIS</strong>_Final_July_2011\<strong>PVD</strong>_CH05_Environmental_Cons_JUL_2011.doc
T.F. <strong>Green</strong> <strong>Airport</strong> <strong>Improvement</strong> <strong>Program</strong>Environmental Impact Statement and Final Section 4(f) EvaluationTable 5-122Alternative B2: Impacts to Terrestrial HabitatsCover TypeHabitat inStudy Area(acres)Area Altered(acres)PercentRemaining Effects of Alteration Species ImpactedAnnual mown grassland 63 9.5 85% Loss of foraging area (birdssmall mammals)Common songbirds and smallmammalsAgricultural Land 65 7.7 88% Raccoon, deer, and commonsongbirdsUpland Forest 222 8.6 96% Loss of nesting, foraging, andbreeding areasShrubland 194 4.1 98% Loss of cover, foraging, nesting,and breeding areasForested Wetland 174 3.6 98% Loss of cover, nesting,breeding, and foraging areasCommon songbirds andmammalsSongbirds and small mammalsSongbirds and mammalsScrub-shrub Wetland 48 0.5 99% Loss of foraging area Common songbirds andwaterfowlEmergent Wetland 18 1.4 92% Loss of foraging area Songbirds, wading birds, andwaterfowlEmergent Wetland –common reed25 0.4 98% Low quality habitat, limitednesting habitatTotal Habitat Impact 809 35.8 96%Source: VHB, Inc.Songbirds (e.g., red-wingedblackbird) and muskratSignificant Impacts: While there is no specific significance threshold established for non-listed species,Alternative B2 would not adversely affect non-listed species population dynamics, sustainability, reproductionrates, natural and artificial mortality, and would not impact the minimum population size needed to maintainthe affected population. Alternative B2 would relocate approximately 112 linear feet of Buckeye Brook whichsupports a river herring spawning run. This Alternative would also add an additional 30-foot extension onto theexisting 70-foot long Lakeshore Drive culvert on this stream. A culvert extension could potentially impair fishpassage. Alternative B2 would avoid impact to habitat of two state-listed species, the pine barrens tiger beetle,and sickle-leaved golden aster. Existing VMP practices, which maintain this habitat, would continue. Potentialhabitat for Greatest Conservation Need grassland bird species south of Runway 34 would not be substantiallyaffected. A small (1.4 acres) remnant of a locally uncommon plant community, Atlantic white cedar forestedwetland, south of Runway 34 and east of Buckeye Brook would not be impacted by Alternative B2.5.12.4.3 Alternative B4The following section outlines the direct and indirect impacts associated with constructing Alternative B4.Direct ImpactsRunway 16-34Alternative B4 would not require any activities to be conducted within Buckeye Brook or Spring <strong>Green</strong> Pond, andwould not directly impact aquatic habitat supporting fish or shellfish populations. As a result of Runway 16-34Chapter 5 - Environmental Consequences 5-231 July 2011\\mawatr\ev\09228.00\reports\<strong>FEIS</strong>_Final_July_2011\<strong>PVD</strong>_CH05_Environmental_Cons_JUL_2011.doc
T.F. <strong>Green</strong> <strong>Airport</strong> <strong>Improvement</strong> <strong>Program</strong>Environmental Impact Statement and Final Section 4(f) Evaluationsafety enhancements, Alternative B4 would impact Tributary A11, a poor quality intermittent stream whichoriginates at an outfall to the <strong>Airport</strong> drainage system (Outfall 08). Much of this stream channel was created whenRunway 16-34 was lengthened to 6,081 feet in 1967. The proposed runway enhancements would place a total of340 linear feet of this stream into one of two culverts, a 90 linear feet long culvert under the relocatedPerimeter Road and 250 linear feet long culvert near the southern end of relocated Taxiway C. An additional262 linear feet of culvert would be relocated. Approximately 241 linear feet of Tributary A would be filled withinWetland A13 to construct the enhanced Runway 34 RSA (Table 5-123). The stream channel is poorly defined as itflows through this wetland which includes ponded areas. The biodiversity impairment of these streams wasrecently assessed as “Severely Impaired” by a RIDEM-commissioned study 421 . Impacts to macroinvertebratepopulations in these low-quality environments are unlikely to affect aquatic biodiversity downstream.Alternative B4 would impact approximately 8.6 acres of terrestrial habitats along Runway 34 (Table 5-124,Figures 5-44 and 5-45) mostly as the result of constructing the Runway 34 RSA. This area would be located inscrub-shrub portions of Wetland A8 that are managed under the current VMP, or in degraded parts ofWetland A13 that are dominated by the invasive Phragmites (common reed). Approximately 2.8 acres of WetlandA13 would be filled to construct the Runway 34 RSA with 1.8 acres of this area dominated by common reed.Wetland A13 generally provides poor quality habitat for wildlife and is monitored as part of the WHMP toexclude waterfowl, wading birds and raptors due to the risk of collision with aircraft. Portions of Runway 34 andits new Perimeter Road would be constructed within Wetlands A6, A8, A10, A11, and A13, and would result in aloss of 5.0 acres of wetland habitat. Impacts to Wetlands A6, A8, and A11 are similar under Alternatives B2 and B4and occur in habitats managed as part of the VMP and where wildlife are controlled as part of the WHMP.Impacts to upland habitats associated with safety enhancements to Runway 16-34 include impacts to 1.3 acres ofshrubland and 1.0 acres of upland forest on the Runway 34 End.Runway 5-23Alternative B4 would avoid direct impacts to streams supporting migratory fish runs by maintaining thecurrent configuration of the Runway 23 End. Efficiency enhancements associated with extending Runway 5-23would not affect aquatic habitat or terrestrial habitats as the extension to the south would impact recreationalfields with little wildlife habitat value and there are no aquatic resources.Fully Relocated <strong>Airport</strong> RoadAlternative B4 would not require the construction of Fully Relocated <strong>Airport</strong> Road, thereby avoiding its associatedimpacts under Alternative B2.Partially Relocated <strong>Airport</strong> RoadThe area which would be altered to construct Partially Relocated <strong>Airport</strong> Road is already developed and doesnot include aquatic or terrestrial habitats.421 Buckeye Brook Biodiversity Impairment Data Report, 2008, ESS Group, 2009.Chapter 5 - Environmental Consequences 5-232 July 2011\\mawatr\ev\09228.00\reports\<strong>FEIS</strong>_Final_July_2011\<strong>PVD</strong>_CH05_Environmental_Cons_JUL_2011.doc
T.F. <strong>Green</strong> <strong>Airport</strong> <strong>Improvement</strong> <strong>Program</strong>Environmental Impact Statement and Final Section 4(f) EvaluationTable 5-123Alternative B4: Impacts to Aquatic HabitatsHabitat inStudy Area(linear feet)Altered Streamlength(linear feet)PercentUnaltered Effects of Alteration Species ImpactedSpri ng <strong>Green</strong> Brook 11,0880100%NoneNoneUpper Buckeye Brook2,2060100%NoneNoneLower Buckeye Brook 12,5980100%NoneNoneBuckeye Brook belowWarwi ck Pond 16,7460100%NoneNoneSpri ng <strong>Green</strong> Pond InletStream (intermittent)2,0200100%NoneNoneTributary A11 (intermittent)2,24060273%Loss of low quality i ntermittentstream bed habitatMacroinvertebratesTributary A (intermittent)1,52824184%Loss of low quality i ntermittentstream bed habitatMacroinvertebratesTotal Stream Altered84395%Fish Run Stream Altered1 Denotes stream supporting a migratory fi sh run.0100%Table 5-124Alternative B4: Impacts to Terrestrial HabitatsCover TypeHabitat inStudy Area(acres)Area Altered(acres)PercentRemaining Effects of Alteration Species ImpactedUpland Forest2221.099%Loss of nesting habitatSongbirds and small and largemammalsShrubland (Upland)1941.399%Loss of nesti ng, foraging,nesting breeding areasSongbirds and small mammalsAnnually Mowed Grassland631.298%Loss of foraging habitatSongbirds and small mammalsForested Wetland1740.299%Loss of foraging and nestinghabitatCommon songbirdsScrub-Shrub Wetland481.497%Loss of foraging habitatsCommon songbirds and waterfowlEmergent Wetland181.492%Loss of foraging habitatSongbirds, waterfowl , and wading birdsEmergent Wetl and –common reed 1252.192%Loss of marginal nestingand foraging habitatSongbirds (e.g., red-wingedblackbird)Total Habitat Impact (acres) 7448.699%Source: VHB, Inc.1 Common reed is an invasive species which is thought to degrade wetland wildli fe habitat value.Chapter 5 - Environmental Consequences 5-233 July 2011\\mawatr\ev\09228.00\reports\<strong>FEIS</strong>_Final_July_2011\<strong>PVD</strong>_CH05_Environmental_Cons_JUL_2011.doc
T.F. <strong>Green</strong> <strong>Airport</strong> <strong>Improvement</strong> <strong>Program</strong>Environmental Impact Statement and Final Section 4(f) EvaluationIndirect ImpactsAlternative B4 would impact 602 linear feet of Tributary A11, an intermittent watercourse that provides lowquality macroinvertebrate habitat and does not support fish or shellfish populations. This stream originates atan outfall from the <strong>Airport</strong> drainage system (Outfall 08) and much of the existing channel was constructed as adiversion when Runway 16-34 was extended to 6,081 feet in 1967. Relocating 262 linear feet of Tributary A11and placing two sections of the stream, totaling 340 linear feet, in culverts could reduce a minimal level ofproduction export which may occur from the stream bed of Tributary A11 to Tributary A and Buckeye Brookbelow Warwick Pond. Any reduction is not anticipated to diminish the productivity or vigor of fish populationsin Buckeye Brook below Warwick Pond.Most of the direct impacts to terrestrial habitats would occur at the Runway 34 End along the edge of the existingrunway and in areas managed by the VMP. Expansion along the sides of the runway would clear wetland habitatthat currently has limited wildlife value due to its fragmented setting within an operating airport and theperimeter fencing which excludes larger species. Since this clearing would occur along the edge of the existinghabitat, this direct impact would not result in further habitat fragmentation or loss of wildlife corridors.Significant Impacts: While there is no specific significance threshold established for non-listed species,Alternative B4 would not adversely affect common species population dynamics, sustainability, reproductionrates, natural and artificial mortality, and would not impact the minimum population size needed to maintainthe affected population in the Study Area. Alternative B4 would not impact aquatic biotic communities because itwould avoid direct impact to Buckeye Brook and Spring <strong>Green</strong> Brook which support migratory fish runs alongwith other aquatic biota. While Alternative B4 would impact terrestrial habitats, the impacts are not of sufficientsize to adversely affect species commonly found in the affected area and would not adversely impact sensitivehabitat supporting species not commonly occurring in the vicinity of the <strong>Airport</strong>.Alternative B4 would avoid impact to habitat of two state-listed species, the pine barrens tiger beetle, andsickle-leaved golden aster. Existing VMP practices, which maintain this locally uncommon habitat, wouldcontinue. Potential habitat for Greatest Conservation Need grassland bird species habitat south of Runway 34would not be affected. A small (1.4 acres) remnant of a locally uncommon plant community, Atlantic whitecedar forested wetland, south of Runway 34 and east of Buckeye Brook would not be impacted byAlternative B4.5.12.5 Short-term Impacts from Temporary Construction ActivitiesThis section describes the potential temporary impacts to biotic communities from construction activities. Therewould not be construction impacts due to Alternatives B2 and B4 with the planned construction managementpractices.5.12.5.1 Alternative B2Impacts during construction could include disturbance associated with equipment operating in and adjacent towildlife habitats. Wildlife utilization patterns that are disrupted during construction are often restored onceconstruction is complete.Chapter 5 - Environmental Consequences 5-234 July 2011\\mawatr\ev\09228.00\reports\<strong>FEIS</strong>_Final_July_2011\<strong>PVD</strong>_CH05_Environmental_Cons_JUL_2011.doc
T.F. <strong>Green</strong> <strong>Airport</strong> <strong>Improvement</strong> <strong>Program</strong>Environmental Impact Statement and Final Section 4(f) EvaluationIn the absence of appropriate construction management practices, in-stream work has the potential to suspendsediments in the water column that could impact downstream aquatic habitats. The most susceptible aquatichabitats to sedimentation would be the Spring <strong>Green</strong> Pond Inlet stream, Upper Buckeye Brook adjacent at theconfluence with Spring <strong>Green</strong> Brook, and Lower Buckeye Brook between existing <strong>Airport</strong> Road and Lake ShoreDrive. Suspended sediments could be transported downstream to Warwick Pond where they would settle out ofthe water column and act to smother benthic habitat (habitat found at the bottom of a water body). This workcould obstruct river herring passage to Spring <strong>Green</strong> Pond which could affect populations of predator and preyspecies if conducted during migration periods. Construction management practices would prevent sedimentsfrom entering these water bodies.The installation of navigational aids associated with the Runway 23 End would require temporary disturbanceof a small segment of Upper Buckeye Brook and the Spring <strong>Green</strong> Pond Inlet stream to install utility cables.Approximately 20 linear feet of the Spring <strong>Green</strong> Pond Inlet Stream could be temporarily disturbed south ofLydick Avenue, and approximately 37 linear feet of Upper Buckeye Brook could be disturbed near theconfluence with Spring <strong>Green</strong> Brook. Any in-stream work required to install navigational aids would beconducted during low flow periods or completely avoided by directional drilling. Since these impacts would betemporary they are not reported for Alternative B2 in Table 5-121.5.12.5.2 Alternative B4Impacts during construction could include disturbance associated with equipment operating in and adjacent towildlife habitats. Wildlife utilization patterns that are disrupted during construction are often restored onceconstruction is complete. New navigational aids on Runway 16-34 will not be required under Alternative B4eliminating any temporary impacts associated with navigational aids installation at the Runway 34 End.Alternative B4 does not include construction activities within Buckeye Brook or Spring <strong>Green</strong> Brook that couldimpact fish passage through these streams.5.12.6 Cumulative ImpactsImpacts to aquatic and terrestrial biodiversity include direct loss of natural vegetation, the loss of wildlife andaquatic habitat, and indirect effects to wildlife communities from decreases in habitat size, and quality orincreases in fragmentation. In light of reported population declines, actions that potentially impact river herringor American eel habitat or passage are important to local and regional biodiversity. Cumulative, indirectimpacts to aquatic resources and water quality, and therefore to aquatic communities, include urbanization ofthe Buckeye Brook watershed and past land uses such as the Truk-Away Landfill. Land use changes include thedevelopment of large blocks of farmland and the loss of grassland through farmland abandonment andsuccession to forest. Pine barrens, which provide habitat for a number of Rhode Island rare species, were oncewidespread in Kent and Washington Counties in Rhode Island. 422 Under all alternatives, ongoing FAA-requiredvegetation management operations in the southeast corner of the <strong>Airport</strong> will continue to avoid a small pinebarren and a small (1.4 acres) remnant Atlantic white cedar stand south of Runway 34.422 Rhode Island’s Comprehensive Wildlife Conservation Strategy, Rhode Island Department of Environmental Management, Division of Fish and Wildlife, 2005.Chapter 5 - Environmental Consequences 5-235 July 2011\\mawatr\ev\09228.00\reports\<strong>FEIS</strong>_Final_July_2011\<strong>PVD</strong>_CH05_Environmental_Cons_JUL_2011.doc
T.F. <strong>Green</strong> <strong>Airport</strong> <strong>Improvement</strong> <strong>Program</strong>Environmental Impact Statement and Final Section 4(f) EvaluationPast actions that have restricted eel and fish passage through Buckeye Brook include installation of roadculverts at Warwick Avenue, Old Warwick Avenue, and West Shore Road outside of the Project Area. Culvertsat Lakeshore Road, existing <strong>Airport</strong> Road, the service road north of existing <strong>Airport</strong> Road, and at the outletstructure at Spring <strong>Green</strong> Pond restrict fish passage between Warwick Pond and Spring <strong>Green</strong> Pond.Consideration also was given to anticipated planned projects as documented in Table 5-5.Wetlands A10, A13, and A14, once a 110-acre contiguous marsh (together currently 53.7 acres, representing anapproximate 51 percent historical loss of wetlands) are now separated by large areas of filled land. Directwetland acreage lost and indirect fragmentation associated with the landfill operations in the marsh hasreduced the habitat suitability of the remaining wetland for waterfowl and wading birds.Alternatives B2 and B4 would have minimal additional cumulative impact on important remaining habitats atthe Runway 34 End utilized by waterfowl and grassland birds. Alternatives B2 and B4 would completely avoidimpacts to remaining pine barren and Atlantic white cedar habitats.Alternative B2 would be unlikely to cause further cumulative degradation to the migratory fish run in BuckeyeBrook associated with the minor relocation of approximately 112 linear feet of stream, however careful designwould be required to maintain fish passage in Buckeye Brook through the culvert extension proposed atLakeshore Drive.Alternative B2 could have cumulative adverse impacts on terrestrial biodiversity through the alteration ofapproximately 36 acres of wildlife habitat. Impacts associated with the important terrestrial habitats north of <strong>Airport</strong>Road would be avoided, but approximately 1.5 acres of forested wetland along Buckeye Brook would be filled. Thisarea is occasionally visited by the state-listed black-crowned night-heron during herring runs, but other areas alongBuckeye Brook could be utilized, minimizing the potential for further cumulative impact to this species.Construction of Fully Relocated <strong>Airport</strong> Road would result in the direct loss of 1.1 acres and fragmentation ofthe remaining 6.5 acres of forested wetland habitat associated with Wetland A2. The habitat within this wetlandhas been degraded by incremental encroachment by residential development and artificial drainage. Somedisplacement of common species of mammal and songbirds that utilize this patch as part of a mosaic of isolatedforaging areas may be anticipated.Alternative B4 would not require any activities to be conducted within Buckeye Brook or Spring <strong>Green</strong> Pond.Impacts to relocate or culvert segments of Tributary A and A11 are not anticipated to affect fish, wildlife orplant populations within the Study Area. Alternative B4 would avoid all impact to habitats present at theRunway 23 End. Impacts at the Runway 34 End would consist of approximately 8.6 acres of habitat. This habitatconsists of:• 2.1 acres of invasive common reed,• 1.4 acres of emergent vegetation, primarily mown grasses, sedges and rushes along the edges of the airfield,• 1.4 acres of shrub swamp in the VMP where trees are removed to maintain clear airspace,• 0.2 acres of forested wetland in Wetland A11,Chapter 5 - Environmental Consequences 5-236 July 2011\\mawatr\ev\09228.00\reports\<strong>FEIS</strong>_Final_July_2011\<strong>PVD</strong>_CH05_Environmental_Cons_JUL_2011.doc
T.F. <strong>Green</strong> <strong>Airport</strong> <strong>Improvement</strong> <strong>Program</strong>Environmental Impact Statement and Final Section 4(f) Evaluation• 1.2 acres of annually mown grassland at the Runway 34 End,• 1.3 acres of shrubland within the VMP, and• 1.0 acres of upland forest.Impacts are limited to edge habitats along the Runway 34 End and are not anticipated to lead to further adversecumulative impact to biodiversity in the Project Area.5.12.7 Comparison of Alternatives B2 and B4As shown in Table 5-125, Alternatives B2 and B4 would have minimal impacts to aquatic habitats, with theexception of minor alteration to a stream supporting a migratory fish run.5.12.7.1 Significant ImpactsWhile there is no specific significance threshold established for non-listed species, Alternatives B2 and B4 wouldnot adversely affect non-listed species population dynamics, sustainability, reproduction rates, natural andartificial mortality, and would not impact the minimum population size needed to maintain the affectedpopulation. Alternatives B2 and B4 would not significantly impact terrestrial biodiversity. Neither AlternativeB2 nor B4 would reduce the terrestrial or aquatic habitat size below the level sufficient to sustain speciescommonly found in the affected area. Habitat of two state-listed species observed in the Project Area, the pinebarrens tiger beetle and sickle-leaved golden aster, would not be impacted by either Alternative B2 or B4.Potential “greatest conservation need” grassland bird species habitat south of Runway 34 would not besubstantially affected.5.12.7.2 Other ImpactsAlternative B2 includes a minor relocation of a segment of Buckeye Brook to accommodate enhancements of anexisting unpaved road for the AMF Access Road and would require a 30-foot culvert extension. Alternative B2would avoid impact to the wetland and open water habitat at the outlet of Spring <strong>Green</strong> Pond as well asimpacts to streams supporting a fish run and impact to the wetland and open water habitat at the outlet ofSpring <strong>Green</strong> Pond. Alternative B4 would avoid all impacts to streams supporting a fish run. Impacts to thewetland and open water habitat at the outlet of Spring <strong>Green</strong> Pond and to the riparian forested wetland alongBuckeye Brook (Wetland A5) would be avoided under Alternative B4.A small (1.4 acre) remnant of a locally uncommon plant community, an Atlantic white cedar stand, south ofRunway 34 and east of Buckeye Brook would not be impacted by either Alternative B2 or B4 to an extent greaterthan under the No-Action Alternative.Alternatives B2 and B4 would not represent a significant effect on biodiversity as defined in FAA Order 1050.1E,because the action would not reduce the habitat size below the level sufficient to sustain species commonlyfound in the affected area or adversely impact sensitive habitat supporting plant or animal species notcommonly occurring in the affected area. 423 Based on the information provided in Tables 5-121 through 5-124,the affected habitat represents a small percentage of each of the habitat types commonly found in the StudyArea. The habitat that will be affected is close to existing airport operations and supports a limited number of423 FAA Order 1050.1E, paragraph 81.i.Chapter 5 - Environmental Consequences 5-237 July 2011\\mawatr\ev\09228.00\reports\<strong>FEIS</strong>_Final_July_2011\<strong>PVD</strong>_CH05_Environmental_Cons_JUL_2011.doc
T.F. <strong>Green</strong> <strong>Airport</strong> <strong>Improvement</strong> <strong>Program</strong>Environmental Impact Statement and Final Section 4(f) Evaluationfish, wildlife, and plants commonly occurring in the affected area (Table 5-125). Furthermore, the habitatassociated with state-listed species would not be impacted.Table 5-125Alternatives B2 and B4: Summary of Impacts to Important Biotic CommunitiesFish Total Waterfowl orFish Run Spawning/ Terrestrial Grassland Wading Bird Atlantic WhiteStreams Foraging Habitat Bird Habitat Habitat Pine Barren Cedar Stand(linear feet) (acres) (acres) (acres) (acres) (acres) (acres)Alternative B2 142 1 0 36.0 0.5 1.5 0 0Alternative B4 0 0 8.6 1.2 1.4 0 0Source: VHB, Inc.1 Includes a 30-foot culvert extension and minor relocati on of 112 linear feet of the channel from its present locati on.5.12.8 Avoidance and MinimizationAlternatives B2 and B4 were evaluated to identify ways to avoid and minimize impacts to biotic communities andbiodiversity within the Project and Study Areas. The No-Action Alternative would only impact biotic communitiesthrough implementing the on-going VMP and WHMP. Chapter 6, Mitigation, contains mitigation measures.5.12.8.1 AvoidanceDescriptions of the elements included in Alternatives B2 and B4 are provided in Chapter 3, Alternatives Analysis.As stated in that chapter, the runways at T.F. <strong>Green</strong> <strong>Airport</strong> cannot be realigned to avoid all impact to naturaland managed biotic communities. These habitats occur directly adjacent to Runway 23 and Runway 34 Ends.Avoidance strategies are not required at the Runway 5 and Runway 16 Ends, as productive wildlife or plantcommunities are not present in these areas.Runway 34There are biotic communities at the Runway 34 End which provide productive habitat for plants and animalsspecies common in the Study Area and habitat for the less common species of Greater Conservation Need andstate-listed threatened and endangered species. These biotic communities include forested and standingdeadwood cover types in Wetland A8, various plant associations within Wetland A10 along Buckeye Brook, theaquatic habitat in Buckeye Brook below Warwick Pond, grasslands south of the Runway 34 end, and forestedwetland and open water components within Wetland A13 west of the Runway 34 End.Impacts to habitats south of Runway 34 for Alternatives B2 and B4 could be avoided if the runway end is shiftednorth along with new safety enhancements towards the Runway 16 End, which is already developed and doesnot include habitats that support fish, wildlife or plant populations. This scenario was evaluated in theLevel 4 Alternatives Analysis presented in the DEIS and was found not practicable since this would require PostRoad to be relocated.The DEIS Level 5 analysis of impacts to fish, wildlife and plant resources provided a description of measureswhich reduced impacts under Alternatives B2 and B4. These included the elimination of a hold apron foraircraft awaiting departure at the Runway 34 End and the routing of the Perimeter Road through the ROFAChapter 5 - Environmental Consequences 5-238 July 2011\\mawatr\ev\09228.00\reports\<strong>FEIS</strong>_Final_July_2011\<strong>PVD</strong>_CH05_Environmental_Cons_JUL_2011.doc
T.F. <strong>Green</strong> <strong>Airport</strong> <strong>Improvement</strong> <strong>Program</strong>Environmental Impact Statement and Final Section 4(f) Evaluationbetween the runway end and the EMAS bed at the end of the RSA. Impacts to low value wetland habitats inWetlands A11 and A6 and upland forest would be avoided by routing the Perimeter Road away from the sideof relocated Taxiway C to the south side of these wetlands along an existing security fence primarily throughuplands.Alternatives B2 and B4 would impact habitats including grassland, emergent wetland, shrub wetland, andupland forest adjacent to the eastern and western sides of the Runway 34 End to relocated Taxiway C and thePerimeter Road. Impacts associated with Taxiway C and the Perimeter Road cannot be avoided and still meetminimum FAA safety distances.The Partially Relocated <strong>Airport</strong> Road for Alternative B2 would avoid impacts to Phragmites-dominated(common reed) emergent and shrub wetland (Wetland A13) south of the existing Runway 34 End by shiftingRunway 16-34 north by 400 feet. This would avoid the requirement to shift all safety enhancements to the southinto Wetland A13 at the Runway 34 End. As described in Chapter 3, Alternatives Analysis, the configuration forRunway 16-34 proposed under Alternative B2 had significant negative socioeconomic impacts associated withthe need to demolish the <strong>Airport</strong> Plaza at the intersection of <strong>Airport</strong> Road and Post Road. The Runway 16-34alignment was modified for Alternative B4 to preserve the <strong>Airport</strong> Plaza and reduce the socioeconomic impact.Under Alternative B4, the Runway 34 End would be shifted approximately 100 feet north requiring a smallerrelocation of <strong>Airport</strong> Road and a portion of the RSA would be constructed by placing fill south of the existingRunway 34 End into grassland, Phragmites-dominated emergent and shrub wetland managed under the VMP.Alternative B4 would include an alignment for the Perimeter Road similar to that incorporated intoAlternative B2 to avoid further impacts to these habitats. Alternatives B2 and B4 have a redesignedRunway 34 End that would further reduce habitat impacts by eliminating the hold apron previously proposedat the end of Taxiway C.During the preparation of this <strong>FEIS</strong>, further measures to avoid impacts at the Runway 34 End were examinedfor Alternatives B2 and B4. Impacts to wetland and grassland habitats on the eastern side of Runway 34 werefurther avoided by re-examining the design requirements for the end-fire glide slope; a critical part of thesystem that allows aircraft to make instrument landings on the runway. Runway 34 is equipped with an endfireantenna. The imaging type glide slope, which is used at the other three runways at the <strong>Airport</strong>, has specificsite requirements for a level reflective surface as shown in the previous glide slope area grading design forRunway 34. The end-fire system is a non-image system, and is designed for use in areas where conformance tothe imaging type glide slope criteria is impractical. Due to the use of an end-fire system at Runway 34, the needto construct the glide slope area was avoided. This in turn allowed the Perimeter Road to be shifted closer to theside of Runway 34. This shift brought the Perimeter Road within the glide slope antenna signal zone so the roadwas lowered to prevent vehicles from interfering with the signal. Impacts to Wetland A8 were reduced from1.5 acres of scrub-shrub and emergent wetland cover types to 0.1 acres of emergent wetlands using thisavoidance measure. Impacts to 1.6 acres of grassland habitat was also avoided.Chapter 5 - Environmental Consequences 5-239 July 2011\\mawatr\ev\09228.00\reports\<strong>FEIS</strong>_Final_July_2011\<strong>PVD</strong>_CH05_Environmental_Cons_JUL_2011.doc
T.F. <strong>Green</strong> <strong>Airport</strong> <strong>Improvement</strong> <strong>Program</strong>Environmental Impact Statement and Final Section 4(f) EvaluationRunway 23<strong>Airport</strong> design engineers and the FAA reviewed safety and efficiency design requirements closely beforedeveloping Alternative B2 with an 8,700-foot long runway as a practicable alternative that would avoid most ofthe undesirable aquatic and terrestrial habitat impacts associated with extending Runway 5-23. Alternative B2would impact approximately 142 linear feet of stream at Runway 23 End and 12.1 acres of terrestrial habitat.These impacts could be avoided (or minimized) if the glide slope critical area were eliminated, but this levelsurface is required as a navigational aid to airplanes landing at Runway 23. Alternative B4 would avoid allimpacts to aquatic and terrestrial habitats at the Runway 23 End by extending the runway to the south only.Fully Relocated <strong>Airport</strong> RoadFor Alternative B2, the full relocation of <strong>Airport</strong> Road between Post Road and Warwick Avenue is necessary toallow Runway 5-23 to be extended northward across existing <strong>Airport</strong> Road. Fully Relocated <strong>Airport</strong> Roadwould impact approximately 14.4 acres of terrestrial habitat (primarily agricultural land). Other cover typesimpacted would include forested wetland (1.8 acres), shrubland (2.7 acres), and upland forest (2.1 acres).Alternative roadway alignments were investigated but were found to have significant adverse impacts toresidential neighborhoods or because they would create undesirable traffic conditions on Warwick Avenue.The use of a flyover structure was investigated to avoid impact to forested wetland habitat in the vicinity of PostRoad. Preliminary cost estimates were approximately $4 million to avoid 0.5 acres of wetland habitat impact. Itwas determined that the flyover would not be practicable based on cost.Under Alternative B4, Fully Relocated <strong>Airport</strong> Road is not proposed thereby avoiding any impacts to biologicalcommunities associated with this program element.5.12.8.2 MinimizationWhere possible, Alternatives B2 and B4 were designed to minimize impacts to biotic communities, particularlywetlands and aquatic habitats. Additional minimization measures may be feasible and would be evaluated forthe Preferred Alternative as it proceeds into the final design phase.Runway 34The Runway 34 safety enhancements (including relocating Taxiway C) would have unavoidable impacts toterrestrial habitats. These impacts have been minimized by shifting Runway 16-34 north to the maximum extentpracticable and by installing EMAS to reduce the length of the RSAs from 1,000 feet to 600 feet, and by locatingthe Perimeter Road within the ROFA between the runway end and EMAS. Impacts associated with the fillslopes for the runway were reduced from those reported in the DEIS Level 5 analysis by steepening the slopesfrom 4:1 to 3:1.Runway 23Alternative B2 would minimize disturbance to forested wetlands by routing the AMF Access Road over anexisting <strong>Airport</strong> security road. Alternative alignments were considered, including filling the north end ofWetland A5 and crossing Buckeye Brook on a structure midway between Lakeshore Drive and existingChapter 5 - Environmental Consequences 5-240 July 2011\\mawatr\ev\09228.00\reports\<strong>FEIS</strong>_Final_July_2011\<strong>PVD</strong>_CH05_Environmental_Cons_JUL_2011.doc
T.F. <strong>Green</strong> <strong>Airport</strong> <strong>Improvement</strong> <strong>Program</strong>Environmental Impact Statement and Final Section 4(f) Evaluation<strong>Airport</strong> Road. The selected option minimizes impact to natural habitats by following the alignment of anunpaved internal <strong>Airport</strong> road.Alternative B4 avoids all impacts to natural habitats at the Runway 23 End therefore further minimizationmeasures would not be necessary.Fully Relocated <strong>Airport</strong> RoadThe Fully Relocated <strong>Airport</strong> Road cross section designed for Alternative B2 has been minimized to 64 feet(four 12-foot travel lanes, two 2-foot shoulders, and two 6-foot sidewalks) to minimize impacts to forestedwetland and other natural and managed habitats. The use of a bridge structure was considered to furtherminimize impacts to forested Wetland A2, but relief between adjacent uplands and the forested swamp istypically less than six feet. The depth of a bridge structure would not provide adequate clearance over thewetland to avoid impact to the wetland area spanned to justify the additional cost.Even though there are no significant impacts, Chapter 6, Mitigation, describes mitigation measures that wouldbe undertaken as part of Alternatives B2 and B4.5.13 Federal Threatened and Endangered SpeciesThis section provides an overview of the impact analysis for federally listed threatened and endangered species,including the methodology for determining potential impacts to these species.5.13.1 Regulatory ContextThe Endangered Species Act of 1973 (the ESA) authorizes the determination and listing of species as endangeredand threatened, and prohibits unauthorized taking, possession, sale, and transport of endangered species.Section 7 of the ESA requires federal agencies to ensure that any action authorized, funded, or carried out by afederal agency is not likely to jeopardize the continued existence of listed species or to modify their criticalhabitat. The ESA defines an endangered species as one that is in danger of extinction throughout all or asignificant portion of its range. A threatened species is one that is likely to become endangered in theforeseeable future. 424 The USFWS maintains a list of plants and animals that are classified as threatened orendangered and a list of species that are candidates or are proposed for possible addition to the federal list.5.13.2 Significance ThresholdsFAA Order 1050.1E defines a significant impact for endangered species as one when the USFWS or the NationalMarine Fisheries Service determines a proposed action would likely jeopardize a species’ continued existence ordestroy or adversely affect a species’ critical habitat.424 Threatened and Endangered Animals and Plants. U.S. Fish and Wildlife Service, 2010.Chapter 5 - Environmental Consequences 5-241 July 2011\\mawatr\ev\09228.00\reports\<strong>FEIS</strong>_Final_July_2011\<strong>PVD</strong>_CH05_Environmental_Cons_JUL_2011.doc
T.F. <strong>Green</strong> <strong>Airport</strong> <strong>Improvement</strong> <strong>Program</strong>Environmental Impact Statement and Final Section 4(f) Evaluation5.13.2.1 Finding: No Significant Federal Threatened and Endangered Species ImpactsThere are no known federally listed species or federally designated critical habitat in the Project or Study Areas.Therefore, the project would not represent a significant impact under FAA Order 1050.1E or the ESA. Projecteffects on state-regulated species are considered previously in Section 5.12, Fish, Wildlife, and Plants.5.13.3 MethodologyThe evaluation of impacts to threatened and endangered species includes direct impacts, indirect impacts, andcumulative impacts.5.13.3.1 Direct and Indirect Impacts MethodologyThe methods for identifying impacts included using a GIS mapping system to overlay grading plans for theNo-Action Alternative and Alternatives B2 and B4 with any potential federally listed species habitats to identifydirect impacts.5.13.3.2 Cumulative Impacts MethodologyTo assess cumulative impacts, a 1939 aerial photograph was used to evaluate the baseline condition in theProject Area and immediate surrounds, as it predates post-World War II residential development and mostairport expansion phases.5.13.4 Impact AssessmentAs documented in Chapter 4, Affected Environment, there are no federally listed species of concern or threatenedor endangered species within the Project Area; therefore, there are no direct or indirect effects to federally listedspecies. No coordination was required. Potential impacts to the habitat of plant or wildlife species that arespecies of state concern are described in Section 5.12, Fish, Wildlife, and Plants.5.13.5 Cumulative ImpactsBecause there are no federally listed threatened or endangered species found within the Project Area, theT.F. <strong>Green</strong> <strong>Airport</strong> <strong>Improvement</strong> <strong>Program</strong> cannot contribute to additional cumulative impacts that would affectsuch species. Future secondary impacts (private development of natural habitats) are not anticipated.5.13.6 Avoidance and MinimizationBecause there are no federally listed threatened or endangered species found within the Project Area, noavoidance or minimization is required.5.14 FloodplainsThis section provides an overview of the impact analysis for floodplains, including the methodology fordetermining potential impacts to these resources.Chapter 5 - Environmental Consequences 5-242 July 2011\\mawatr\ev\09228.00\reports\<strong>FEIS</strong>_Final_July_2011\<strong>PVD</strong>_CH05_Environmental_Cons_JUL_2011.doc
T.F. <strong>Green</strong> <strong>Airport</strong> <strong>Improvement</strong> <strong>Program</strong>Environmental Impact Statement and Final Section 4(f) Evaluation5.14.1 Regulatory ContextExecutive Order 11988, Floodplain Management, requires each federal agency to provide leadership and takeaction to reduce the risk of flood loss, to minimize the impact of floods on human safety, health, and welfare,and to restore and preserve the natural and beneficial values served by floodplains when managing federalfacilities. 425 Actions that may impact floods include filling floodplains, which may cause displacement of floodstorage and increase flood height or duration. USDOT Order 5650.2, Floodplain Management and Protection,contains USDOT policies and procedures for implementing Executive Order 11988. According to USDOT Order5650.2, floodplains or base floodplains are the lowlands and relatively flat areas adjoining inland and coastalwaters including flood prone areas of offshore islands, at a minimum, that are prone to the 100-year flood.When used in this section, the 100-year flood is understood to mean a flood which inundates an area with a onepercent likelihood of occurrence in any given year and is equivalent to the 1 percent Annual Chance Flood asdefined by the Federal Emergency Management Agency (FEMA) and depicted on the Flood Insurance RateMaps (FIRMs). 426 The 100-year storm event is the storm with precipitation depth that has a one percentlikelihood of occurrence in any given year. The 100-year flood may result from storms that generateprecipitation depths greater or less than the 100-year storm event, depending on various environmental factorsincluding antecedent moisture conditions and tide, as well as wind and whether or not the ground is frozen.USDOT Order 5650.2 section 6(1) states that “A Flood Insurance Rate Map or Flood Insurance Study shall be consultedfirst” to determine base floodplain limits in a Project Area. There are current FIRM and a Flood Insurance RateStudy that cover the Project Area.At the state level, the Rules and Regulations Governing the Administration and Enforcement of the Fresh WaterWetlands Act 427 (RIDEM Rules) regulates the 100-year floodplain and floodway as freshwater wetland.According to section 2-1-20(3) of the Fresh Water Wetlands Act 428 , floodplain is defined as that land area adjacentto a river or stream or other flowing body of water that is, on average, likely to be covered with flood watersresulting from a 100-year frequency storm. A storm of this nature is one that is to be expected to be equaled orexceeded once in 100 years, and hence may be said to have a one percent probability of being equaled orexceeded in any given year. Rainfall intensity data for such a storm are those established for New Englandlocations by the National Weather Service (formerly the U.S. Weather Bureau).The RIDEM Rules require the use of a 100-year storm event for the purposes of flood modeling to evaluatefloodplain extents and impacts caused by any modifications to the floodplain. The flood modeling that wascompleted is intended to supplement FEMA mapping and to provide a relative comparison of conditions beforeand after floodplain filling and mitigation and to ultimately show that the fill has been appropriately mitigatedby new storage provided in created wetland areas, and that no increase in the floodplain results. Real-liferainfall events are of varied duration and intensity and therefore the selection of a design storm, such as the100-year storm event, will approximate the conditions that would occur during a flood event of this recurrenceinterval.425 Federal Executive Order 11988, Floodplain Management, 42 F.R. 26951, May 24, 1977.426 Flood Insurance Rate Map, Kent County Rhode Island, Map Numbers: 44003C0113G, 44003C0131G, 44003C0129G, and 44003C0127G. FEMA.Effective Date December 3, 2010427 RIDEM. December 2010.428 The Fresh Water Wetlands Act refers to sections 2-1-18 through 2-1-25, inclusive, of the Rhode Island General Laws.Chapter 5 - Environmental Consequences 5-243 July 2011\\mawatr\ev\09228.00\reports\<strong>FEIS</strong>_Final_July_2011\<strong>PVD</strong>_CH05_Environmental_Cons_JUL_2011.doc
T.F. <strong>Green</strong> <strong>Airport</strong> <strong>Improvement</strong> <strong>Program</strong>Environmental Impact Statement and Final Section 4(f) Evaluation5.14.2 Significance ThresholdsAccording to FAA Order 1050.1E, a significant impact to floodplains occurs when notable adverse impacts onnatural and beneficial floodplain values occur. In determining significance, the FAA must decide if a“significant floodplain encroachment” would occur.5.14.2.1 Finding: Significant Floodplain ImpactFloodplain impacts associated with Alternatives B2 and B4 would be significant as Alternative B2 would fill0.5 acres of FEMA-delineated floodplain and Alternative B4 2.3 acres of FEMA-delineated floodplain.Unmitigated, both Alternatives B2 and B4 would result in notable adverse impacts on natural and beneficialfloodplain values. USDOT Order 5650.2 section 4.k. defines natural and beneficial floodplain values to includebut not limited to: natural moderation of floods, water quality maintenance, groundwater recharge, fish,wildlife, plants, open space, natural beauty, scientific study, outdoor recreation, agriculture, aquaculture, andforestry. Analysis of the <strong>Improvement</strong> <strong>Program</strong> indicates the action would not have a high probability of loss ofhuman life and would not result in substantial encroachment-associated cost of damage including interruptingaircraft service or loss of a vital transportation facility. Alternatives B2 and B4 would, however, constitute a“significant encroachment” since they would cause adverse impacts on natural and beneficial floodplain values,specifically flood storage, water quality maintenance and groundwater recharge. Importantly, these impacts canbe mitigated, as described in Chapter 6, Mitigation.5.14.3 MethodologyThe evaluation of impacts to floodplains includes direct impacts, indirect impacts, and cumulative impacts, asdescribed below.Since the existing FEMA floodplain mapping for this area is based on an estimate and there was no model inexistence that could be used to evaluate the impacts of the fill in relation to any increase in water surfaceelevations at specific locations within the floodplains it was necessary to develop a detailed floodplain model toevaluate impacts to state-regulated floodplain. Appendix L, Floodplains, describes the floodplain analysis of theBuckeye Brook watershed upstream of Warwick Avenue that was prepared in order to evaluate any direct orindirect impacts at detailed cross sections as a result of the fill proposed in the state-regulated floodplain asdefined in the RIDEM Rules.The foot by foot analysis of fill and mitigation plan as described in this chapter is based on the FEMA-delineatedfloodplain presented in the current and accepted FIRM map.5.14.3.1 Direct Impacts MethodologyDirect impacts are effects caused by the action and occur at the same time and place. Indirect impacts are effectsthat occur later in time or are further removed in distance.Direct impacts to floodplains in the Project Area were evaluated by overlaying each 30-percent designalternative footprint onto floodplain mapping based on the available topographic data and the base floodelevation provided in the FIRM, to determine:Chapter 5 - Environmental Consequences 5-244 July 2011\\mawatr\ev\09228.00\reports\<strong>FEIS</strong>_Final_July_2011\<strong>PVD</strong>_CH05_Environmental_Cons_JUL_2011.doc
T.F. <strong>Green</strong> <strong>Airport</strong> <strong>Improvement</strong> <strong>Program</strong>Environmental Impact Statement and Final Section 4(f) Evaluation• If any fill or necessary equipment would be placed within the floodplain;• To calculate what the loss of flood storage would be;• If a 100-year flood would lead to the loss of any transportation facility; and• If the loss of flood storage or new obstructions within the floodplain or floodway could result in an increasein depth or duration of flooding, or increase the lateral extent of the flooding.Conceptual design and grading plans of Alternatives B2 and B4 were also used to evaluate the extent of alterationof the floodplain, the amount of fill to be used, and any effects on natural and beneficial floodplain values.According to RIDEM Rules and guidance, all rivers, streams, and intermittent streams have a 100-yearfloodplain. 429 Floodplain mapping completed by FEMA has been used for analysis of floodplain impacts. For thepurposes of the <strong>FEIS</strong>, floodplain is as described in FEMA’s Flood Insurance Study for the City of Warwick (RevisedDecember 3, 2010) and FIRM Panels 44003C0113G, 44003C0131G, 44003C0129G, and 44003C0127G (RevisedDecember 3, 2010). The area of wetland filling associated with the Runway 34 enhancements is along a portionof the Buckeye Brook watershed where there is currently no detailed cross sections or survey completed byFEMA and no detailed study is available for this area. The floodplain elevation of 14 feet above the NorthAmerican Vertical Datum of 1988 (NAVD 1988) is based on downstream coastal storm surge conditions. ThisFEMA floodplain elevation was used to evaluate the impact of the proposed fill areas and the associatedmitigation on a volumetric basis, by identifying the existing 14 foot contour on the aerial topographic baseprepared for the <strong>Airport</strong>. Fill volumes placed in FEMA-floodplain were calculated by placing the model surfaceof Alternative B2’s and B4’s 30-percent design grading plan over the existing conditions terrain model andcalculating earthwork volumes below the flood elevation.Additional floodplain mapping described in Appendix L, Floodplains, does not constitute federal floodplain andwas used in the <strong>FEIS</strong> analysis of floodplain impacts to evaluate flood elevation changes due to fill andmitigation at specific cross section locations along the stream. This Study Area specific floodplain mapping isconsistent with RIDEM guidance. 430 FEMA floodplain impacts are shown in Figure 5-46. Impacts to floodplainmapped for the purposes of this study are shown in Figure L.1-2 of Appendix L, Floodplains.5.14.3.2 Indirect Impacts MethodologyFor the purposes of this <strong>FEIS</strong> analysis, indirect impacts are those impacts outside the Project area. These can includeincreased or decreased floodplain elevation both upstream and downstream of the floodplain fill area. These impactsare determined by comparing floodplain outside the Project area under existing conditions to floodplain afterconstruction of the proposed alternative based on elevations determined in the additional floodplain mappingcompleted for this study and described in Appendix L, Floodplains. If flood elevations after construction of theproposed alternative are different than under existing conditions, indirect impacts can be said to exist.429 The definition of floodplain is provided in Rhode Island General Law section 2-1-20 (3).430 Floodplain Impacts: Regulatory Provisions Pertaining to Floodplains and Floodways. Rhode Island Department of Environmental Management, Office ofWater Resources. November 16, 2007.Chapter 5 - Environmental Consequences 5-245 July 2011\\mawatr\ev\09228.00\reports\<strong>FEIS</strong>_Final_July_2011\<strong>PVD</strong>_CH05_Environmental_Cons_JUL_2011.doc
T.F. <strong>Green</strong> <strong>Airport</strong> <strong>Improvement</strong> <strong>Program</strong>Environmental Impact Statement and Final Section 4(f) Evaluation5.14.3.3 Cumulative Impacts MethodologyCumulative impacts to other natural and beneficial floodplain values were assessed based on the history of<strong>Airport</strong> construction and expansion activities as well as a review of historical aerial photographs. A 1939 aerialphotograph that depicts the <strong>Airport</strong> prior to any of the major runway construction activities has been used as abaseline for qualitatively assessing cumulative impacts. For the cumulative impact analysis, this 1939 aerialphotograph was compared to a 2004 aerial photograph. For purposes of assessing the cumulative impacts, it hasbeen assumed that the wetland area interpreted from the 1939 aerial represents the maximum extent of thebaseline 100-year floodplain. A 1951 aerial photograph depicts the beginning of landfill operations (not airportrelated)that eventually displaced the floodplain associated with the reach of Buckeye Brook adjacent to theRunway 34 End. Consideration also was given to anticipated planned projects as documented in Table 5-5.5.14.4 Impact AssessmentThis section provides a summary of the evaluation of impacts to the estimated floodplain for Buckeye Brook forAlternatives B2 and B4 and compares them to the No-Action Alternative.5.14.4.1 No-Action AlternativeThe No-Action Alternative would not require work within the 100-year floodplain and therefore, would notresult in any new impacts to floodplains.5.14.4.2 Alternative B2Activities associated with Alternative B2 that have the potential to impact the floodplain include safety projects(improving Runway 34 RSA and relocating Taxiway C) and efficiency projects (extending Runway 5-23 to thenorth with the associated relocation of the AMF access road). Fully Relocated <strong>Airport</strong> Road is located outside ofthe floodplain depicted on the FIRM and would not impact this floodplain.Direct ImpactsAlternative B2 would both affect the floodplain’s ability to provide some natural and beneficial values(specifically flood storage, water quality maintenance, and groundwater recharge) within the wetland setting ofmost of the floodplain. Impacts to existing wetland functions and values are considered in Section 5.10, Wetlandsand Waterways. Table 5-126 presents a summary of these impacts calculated based on FEMA mapping for thepurposes of federal permitting. Impacts to floodplains are also shown in Figure 5-46. Impacts due tonavigational aids are considered negligible because the volume of each navigational aid between the existingground elevation and elevation 14 feet above NAVD 1988 is anticipated to be less than one cubic yard andwould be negligible compared to other proposed actions.Chapter 5 - Environmental Consequences 5-246 July 2011\\mawatr\ev\09228.00\reports\<strong>FEIS</strong>_Final_July_2011\<strong>PVD</strong>_CH05_Environmental_Cons_JUL_2011.doc
T.F. <strong>Green</strong> <strong>Airport</strong> <strong>Improvement</strong> <strong>Program</strong>Environmental Impact Statement and Final Section 4(f) EvaluationTable 5-126Alternatives B2 and B4: Summary of Impacts to Estimated Floodplains<strong>Program</strong> Element and Associated ActionRunway 23 End and AMF Access Road relocationRunway 34 End and Taxiway C relocationFloodplain AreaArea(acres)Alternative B2StorageVolume(cubic yards)Area(acres)0.02.3Alternative B4StorageVolume(cubic yards)0726A0.4218B0.1 1 0C 0.0 15 0.0 0Total 0.5 233 2.3 7261 Alternative B2 impacts associated with Floodplain Area B are related to navigational aids. Area and volume impacts are considered negligible.Alternative B2 would impact the estimated floodplain in two locations: Floodplain associated with the AMFAccess Road and at the Runway 23 glide slope critical area near the Runway 23 End (Area A) and floodplain onthe east side of the Runway 34 End (Area C).<strong>Airport</strong> efficiency enhancements at the Runway 23 End would require approximately 218 cubic yards of fill tobe placed below the FEMA 100-year flood elevation in approximately 0.4 acres of floodplain in Area A(Figure 5-46).The impacts to Floodplain Area C would result from <strong>Airport</strong> safety enhancements. On the east side of Runway 34the Perimeter Road would be constructed below the elevation of the end-fire antenna to avoid interference withaircraft navigation. In order to relocate the Perimeter Road, fill slopes would be extended below the floodplainelevation. An estimated fill volume of 15 cubic yards would be placed below the FIRM floodplain elevation at thislocation, impacting a negligible acreage of floodplain (Figure 5-46 and Table 5-126).Indirect ImpactsFilling 0.4 acres of floodplain with 218 cubic yards of fill to construct the Runway 23 glide slope critical area andrelocate the AMF Access Road would displace existing flood storage in Wetland A5. This displacement, alongwith the addition of 30 linear feet of pipe could cause the culvert at Lakeshore Drive to overtop more frequently,resulting in temporary closures of Lakeshore Drive.Significant Impacts: Alternative B2 would not create a high probability of loss of human life or likely havesubstantial, encroachment-associated costs or damage, including interrupting aircraft service or loss of a vitaltransportation facility. However, Alternative B2 would have a significant impact since it would impact 0.5 acresof floodplain which, if unmitigated, would affect the natural moderation of floods, fish passage, groundwaterrecharge, and water quality maintenance.5.14.4.3 Alternative B4Alternative B4 would not impact floodplains at the Runway 23 End because the Runway-5-23 extension to atotal 8,700 feet would occur only to the south, outside of existing floodplains. Impacts associated with safetyChapter 5 - Environmental Consequences 5-247 July 2011\\mawatr\ev\09228.00\reports\<strong>FEIS</strong>_Final_July_2011\<strong>PVD</strong>_CH05_Environmental_Cons_JUL_2011.doc
T.F. <strong>Green</strong> <strong>Airport</strong> <strong>Improvement</strong> <strong>Program</strong>Environmental Impact Statement and Final Section 4(f) Evaluationenhancements (Runway 34 RSA enhancements) are described in this section, shown in Figure 5-46, andsummarized in Table 5-126.Direct ImpactsSafety enhancements for Alternative B4 would require approximately 726 cubic yards of fill to be placed belowthe FIRM elevation of 14 feet NAVD 1988. This would alter approximately 2.3 acres of floodplain south ofRunway 34 (Area B).Indirect ImpactsThe 2.3 acres of floodplain fill associated with Alternative B4 that would occur within the FEMA floodplaincould potentially cause impacts indirectly at outside of the project area if not mitigated. However, the analysispresented in Appendix L, Floodplains, shows the impacts are limited to within the Project area. Therefore thereare no indirect impacts associated with this alternative.Significant Impacts: Alternative B4 would not create a high probability of loss of human life or likely havesubstantial, encroachment-associated costs or damage, including interrupting aircraft service or loss of a vitaltransportation facility. However, Alternative B4 would have a significant impact on floodplains since it wouldimpact a total of 2.3 acres of floodplain, which could affect the natural moderation of floods, groundwaterrecharge, and water quality maintenance if unmitigated.5.14.5 Short-term Construction ImpactsThere are no temporary construction impacts to floodplains associated with Alternative B2 or B4.5.14.6 Cumulative ImpactsThe FIRM depicts a portion of the existing Runway 16-34 as being within the 100-year floodplain. 431 Based on theexisting topography at the <strong>Airport</strong>, this segment of runway is at approximate elevation 30 feet above NAVD1988, which is 14 to 15 feet above the 100-year flood elevation of 14 feet NAVD 1988. Because this runway wasconstructed prior to December 31, 1974, RIAC may file a Letter of Map Amendment requesting FEMA to revisethe Special Flood Hazard Zone depicted in the FIRM based on existing ground elevations. The Effective Date ofthe FIRM Community Panel Nos. 44003C 0113G, 4400131G, 4400129G, and 4400127G is December 3, 2010.According to FEMA, structures built on or before December 31, 1974, or before the effective date of the initialFIRM of the community (1973), whichever is later, are considered pre-FIRM. Since Runway 16-34 was extendedto 6,081 feet in 1967, the fill placed in floodplain to construct it would be considered pre-FIRM. After thePreferred Alternative enhancements have been designed, a Letter of Map Revision Based on Fill would be filedto revise the limits of the Special Flood Hazard Zone based on the ground elevations that would exist after the<strong>Airport</strong> enhancements have been constructed.Figure 5-47 depicts extensive areas west of the Runway 34 End where the former Truk-Away landfill and otheroperations may have filled larger areas of floodplain. These and other activities are estimated to have filled up to80 acres of floodplain along Buckeye Brook and Warwick Pond. Other minor encroachments into the Buckeye Brook431 Flood Insurance Rate Map City of Warwick, Rhode Island, Community Panel Number 445409 0006 E Map, Revised June 16, 1992.Chapter 5 - Environmental Consequences 5-248 July 2011\\mawatr\ev\09228.00\reports\<strong>FEIS</strong>_Final_July_2011\<strong>PVD</strong>_CH05_Environmental_Cons_JUL_2011.doc
T.F. <strong>Green</strong> <strong>Airport</strong> <strong>Improvement</strong> <strong>Program</strong>Environmental Impact Statement and Final Section 4(f) Evaluationfloodplain may have occurred downstream of the Project Area to the crossing of Warwick Avenue, but this has notbeen quantified. Historical floodplain filling has likely impacted water quality maintenance and groundwaterrecharge functions.Under Alternative B4 approximately 2.3 acres of floodplain would be altered, and under Alternative B2approximately 0.5 acres. With appropriate mitigation, as described in Chapter 6, Mitigation, the PreferredAlternative (Alternative B4) would not result in increased depth, duration, or lateral extent of flooding beyondthe <strong>Airport</strong> property and therefore would not have adverse cumulative effects on the ability of the floodplain tomoderate floods.5.14.7 Comparison of Alternatives B2 and B4This section provides a comparison of impacts to floodplains under Alternatives B2 and B4.5.14.7.1 Significant ImpactsAlternatives B2 and B4 would encroach on the estimated 100-year FEMA floodplain which may be classified asa “significant encroachment” based on FAA Order 1050.1E section 9.2f(3) since either alternative would causeadverse impacts on natural and beneficial floodplain values. Without mitigation, Alternatives B2 and B4 wouldconstitute a “significant encroachment” since they would cause adverse impacts on natural and beneficialfloodplain values, however, mitigation would be provided to replace lost floodplain values. Floodplain impactsof Alternative B2, though of a smaller total area and volume than impacts of Alternative B4, would primarilyoccur between <strong>Airport</strong> Road and Lakeshore Drive, adjacent to residential areas. Floodplain impacts ofAlternative B4 would primarily occur south of Runway 34 in an area surrounded by an extensive undevelopedwetland and meadow area. Impacts on the east and west of Runway 34 end are similar between Alternatives B2and B4 (Figure 5-46). Due to the proximity to residential areas, the potential for adverse impacts to humansafety, health and welfare, a stated goal of Executive Order 11988, is greater for Alternative B2 than forAlternative B4. The floodplain impacts are not avoidable at the Runway 34 End, as it is situated in floodplain;however, minimization efforts were undertaken.5.14.7.2 Other ImpactsBased on the FIRM floodplain elevation, Alternative B2 would result in a smaller area of estimated floodplainloss than Alternative B4. The floodplain area and volume filled by Alternative B2 would be less thanAlternative B4. The natural and beneficial floodplain values lost by floodplain fill associated withAlternatives B2 and B4 include the natural moderation of floods and water quality maintenance. Alternative B2would directly impact a segment of Buckeye Brook in the federal floodplain potentially impacting fish passage.Alternative B4 would not impact this natural and beneficial floodplain value.5.14.8 Avoidance and MinimizationMitigation of floodplain impacts consists of three sequential steps: avoidance through the examination ofpotential project alternatives, minimization through the incorporation of special design measures that reduceunavoidable impacts; and finally floodplain mitigation (see Chapter 6, Mitigation) to offset unavoidable impacts.Chapter 5 - Environmental Consequences 5-249 July 2011\\mawatr\ev\09228.00\reports\<strong>FEIS</strong>_Final_July_2011\<strong>PVD</strong>_CH05_Environmental_Cons_JUL_2011.doc
T.F. <strong>Green</strong> <strong>Airport</strong> <strong>Improvement</strong> <strong>Program</strong>Environmental Impact Statement and Final Section 4(f) Evaluation5.14.8.1 AvoidanceThroughout the project design, the RIAC and FAA worked to identify alternatives that would avoid impacts tofloodplain. During this process several alternatives were designed and assessed to determine if they werepracticable.Runway 34Impacts to the floodplain south of Runway 34 could be avoided if all the enhancements were shifted northtowards the Runway 16 End where no floodplains are present. The Runway 34 RSA enhancements proposedunder Alternative B2 are not practicable because this action would require the taking of <strong>Airport</strong> Plaza resulting inunacceptable socioeconomic impacts associated with the loss of jobs and taxable infrastructure. Alternative B4shifts Runway 16-34 nearly 100 feet north away from floodplain at the Runway 34 End. This was determined to bethe greatest distance the runway could be shifted north without the need to demolish <strong>Airport</strong> Plaza.Earlier designs for the Runway 34 End included a hold apron for aircraft awaiting clearance or conducting apreflight checklist in preparation for takeoff. This feature was eliminated to avoid floodplain impact. Impactwas further avoided by routing the Perimeter Road between the runway end and the EMAS installed withinthe RSA.Runway 23Under Alternative B2, the floodplain at the Runway 23 End would be impacted in order to relocate the AMFaccess road to an area that would not conflict with the ROFA and to construct the level glide slope critical areaused as a navigational aid for planes landing at Runway 23. Alternative B4 avoids any impacts to the estimatedfloodplain and state-regulated floodplains at the Runway 23 End by shifting Runway 5-23 to the south only.5.14.8.2 MinimizationThroughout the project design, the RIAC and FAA worked to identify alternatives that would achieve theproject while minimizing impacts to floodplain. During this process several alternatives were designed andassessed to determine if they were practicable.Runway 34As previously reported in the DEIS, EMAS has been used at both ends of Runway 16-34 to shorten the length ofRSA that needs to be filled from 1000 linear feet from the runway end to 600 linear feet. Since an alternativewithout EMAS was not designed, it is difficult to assess the benefit, but most of the additional RSA would havebeen within floodplain. After completion of the DEIS, impacts to floodplain east of Runway 34 (Area C) wereminimized by re-examining the location of the Perimeter Road on the east side of Runway 34 along with thedesign requirements for the end-fire glide slope; a critical part of the system that allows aircraft to makeinstrument landings on the runway. Runway 34 is equipped with an end-fire antenna. The imaging type glideslope, which is used at the other three runways at the <strong>Airport</strong>, has specific site requirements reflected in theprevious glide slope area grading design for Runway 34. The end-fire system is a non-image system, and isdesigned for use in areas where conformance to the imaging type glide slope criteria is impractical. Due to theuse of an end-fire system at Runway 34, the side slopes along the runway can be steepened beginning at theedge of the RSA. This in turn allowed the Perimeter Road to be shifted closer to the side of Runway 34. ThisChapter 5 - Environmental Consequences 5-250 July 2011\\mawatr\ev\09228.00\reports\<strong>FEIS</strong>_Final_July_2011\<strong>PVD</strong>_CH05_Environmental_Cons_JUL_2011.doc
T.F. <strong>Green</strong> <strong>Airport</strong> <strong>Improvement</strong> <strong>Program</strong>Environmental Impact Statement and Final Section 4(f) Evaluationshift brought the Perimeter Road within the glide slope antenna signal zone so the road was lowered to preventvehicles from interfering with the signal. In addition, steepening the fill side slopes outside of the RSA from 4:1to 3:1 reduced floodplain impacts for Alternative B4. These measures collectively have reduced the floodplainimpact in Area C for both Alternative B2 and Alternative B4. Smaller reductions in impact also occur at Area Bunder Alternative B4.Runway 23No additional minimization measures were incorporated into the design of Runway 23 for Alternative B2. Thereare no impacts to floodplain in this area.The natural floodplain values lost by floodplain fill associated with Alternatives B2 and B4 include the naturalmoderation of floods, groundwater recharge, and water quality maintenance. These losses will be mitigated asdescribed in Chapter 6, Mitigation.5.15 Coastal ResourcesThis section provides an overview of the impact analysis for coastal resources, including the methodology fordetermining potential impacts to these resources.5.15.1 Regulatory ContextCoastal zone analyses are conducted in accordance with applicable FAA guidance; National Oceanic andAtmospheric Administration (NOAA) regulations; 432 the Coastal Zone Management Act (CZMA) of 1972; 433 and theRhode Island Coastal Resources Management Plan (RICRMP). 434 The CZMA is administered through the Coastal ZoneManagement <strong>Program</strong> (CZMP) under the NOAA Office of Ocean and Coastal Resource Management. TheRhode Island Coastal Resources Management Council (RICRMC) is responsible for the management, protection,and restoration of Rhode Island coastal areas, as authorized in the CZMA and the Coastal Zone Act ReauthorizationAmendments (CZARA) of 1990. 435In some areas, RICRMC coastal zone jurisdiction is expanded to include those areas within the watershedboundaries of certain coastal estuaries. These watershed areas are within the Special Area Management Plans(SAMPs). RICRMC also has authority over freshwater wetlands in the vicinity of the coast (specificallyWetland P, which would be impacted by Fully Relocated <strong>Airport</strong> Road under Alternative B2). 4365.15.2 Significance ThresholdWhile no significance threshold has been established for Coastal Resources, FAA Order 1050.1E generally statesthat FAA receive concurrence from the state on FAA’s determination that a proposed project would beconsistent with the CZM Plan. The southern portion of the Project area is within the watershed of <strong>Green</strong>wich432 15 CFR Part 930, Subparts C, D and F.433 16 USC sections 1451-1464, as amended.434 Established pursuant to Rhode Island General Law 46-23-1 et seq.435 16 USC section 1455b.436 State of Rhode Island Coastal Resources Management Council. Rules and Regulations Governing the Protection and Management of FreshwaterWetlands in the Vicinity of the Coast. (August 18, 1999).Chapter 5 - Environmental Consequences 5-251 July 2011\\mawatr\ev\09228.00\reports\<strong>FEIS</strong>_Final_July_2011\<strong>PVD</strong>_CH05_Environmental_Cons_JUL_2011.doc
T.F. <strong>Green</strong> <strong>Airport</strong> <strong>Improvement</strong> <strong>Program</strong>Environmental Impact Statement and Final Section 4(f) EvaluationBay (Figure 4-32), and is subject to the <strong>Green</strong>wich Bay SAMP goals and objectives. 437 RICRMC also hasauthority over freshwater wetlands in the vicinity of the coast. However, the <strong>Airport</strong> itself is not withinRICRMC freshwater wetland jurisdiction.5.15.2.1 Finding: No Significant Coastal Resources ImpactsIn order for FAA to make a determination of CZM Consistency, the Preferred Alternative must be designed tocomply with applicable performance standards of the CRMP, Rhode Island Soil Erosion and Sediment ControlHandbook, Rhode Island Stormwater Design and Installation Standards Manual, and the SAMP goals and objectives.Following its review of the <strong>FEIS</strong>, RICRMC must provide its concurrence regarding CZM Consistency.Alternatives B2 and B4 would be designed to comply with applicable performance standards of the CRMP,Rhode Island Soil Erosion and Sediment Control Handbook, and Rhode Island Stormwater Design and InstallationStandards Manual, and the SAMP goals and objectives. The FAA finds that Alternatives B2 and B4 will not resultin a significant impact to coastal resources.5.15.3 MethodologyThe analysis methodology consists of comparing proposed T.F. <strong>Green</strong> <strong>Airport</strong> <strong>Improvement</strong> <strong>Program</strong> activitieswith performance criteria identified in applicable RICRMC guidance. The CZM consistency evaluation includesidentification of any coastal resources that could be affected directly by the <strong>Improvement</strong> <strong>Program</strong>, assessmentof construction management to prevent erosion, assessment of stormwater treatment and changes tostormwater flows, mitigation for wetland impacts, and an assessment of overall impacts on <strong>Green</strong>wich Bay.Consideration is given to stormwater runoff characteristics and potential downstream water quality and habitatimpacts that would lead to the Alternatives being subject to the CZM Consistency requirement. RIDEM willreview all stormwater and wetland issues in accordance with its guidance and regulations. Detailed technicalinformation to support consistency with these standards is presented in Section 5.10, Wetlands and Waterways,Section 5.11, Water Quality, Section 5.12, Fish, Wildlife, and Plants, and Section 5.14, Floodplains.5.15.4 Impact AssessmentThe following section considers potential impacts to coastal resources as a result of the No-Action Alternativeand Alternatives B2 and B4.5.15.4.1 No-Action AlternativeThe No-Action Alternative would have no direct impacts to coastal resources since there are no coastalresources within the Project Area.5.15.4.2 Alternative B2Like the No-Action Alternative, Alternatives B2 and B4 would have no direct impacts to any coastal resourcesbecause the Project Area does not contain any coastal resources. The Fully Relocated <strong>Airport</strong> Road included inAlternative B2 may impact freshwater wetlands subject to the jurisdiction of the RICRMC under the Rules andRegulations Governing the Protection and Management of Freshwater Wetlands in the Vicinity of the Coast. 438 Warwick437 <strong>Green</strong>wich Bay SAMP, Rhode Island Coastal Resources Management Council, www.crmc.state.ri.us/regulations/SAMP_<strong>Green</strong>wichBay.pdf.438 State of Rhode Island Coastal Resources Management Council. Rules and Regulations Governing the Protection and Management of FreshwaterWetlands in the Vicinity of the Coast. (August 1999).Chapter 5 - Environmental Consequences 5-252 July 2011\\mawatr\ev\09228.00\reports\<strong>FEIS</strong>_Final_July_2011\<strong>PVD</strong>_CH05_Environmental_Cons_JUL_2011.doc
T.F. <strong>Green</strong> <strong>Airport</strong> <strong>Improvement</strong> <strong>Program</strong>Environmental Impact Statement and Final Section 4(f) EvaluationAvenue north of the intersection with <strong>Airport</strong> Road is identified as the boundary between RIDEM and RICRMCfreshwater wetland jurisdiction. The roadway improvements required at the Warwick Avenue/<strong>Airport</strong> Roadintersection include widening that may extend east of Warwick Avenue into freshwater wetlands. Wetlandsimpacts are addressed in Section 5.10, Wetlands and Waterways.The assessment of CZM consistency applies to both Alternative B2 and B4. This section identifies how each goalor requirement would be met.CRMP Section 300.6 — Stormwater Management for Large ProjectsThe <strong>Improvement</strong> <strong>Program</strong> would follow the requirements of the Rhode Island Stormwater Design and InstallationStandards Manual for the stormwater design. 439 Alternatives B2 and B4 will be designed to comply with statestormwater requirements. The <strong>Airport</strong>’s SWPPP would be updated to ensure the proper maintenance andoperating procedures are followed for the system in keeping with the requirements of the Rhode IslandStormwater Design and Installation Standards Manual.RICRMC will be provided a copy of all documents provided to RIDEM relating to stormwater and any otherinformation requested for consistency review.<strong>Green</strong>wich Bay SAMP Section 120.2 — Improve <strong>Green</strong>wich Bay’s Water QualityThis goal in the <strong>Green</strong>wich Bay SAMP covers a number of actions that would improve overall water quality in<strong>Green</strong>wich Bay. The goal indicates that RIAC should “implement Best Management Practices (BMPs) to reducestorm water discharge volume and nitrogen and bacteria concentrations.” This SAMP goal is implementedthrough SAMP Section 470.5B.17, which identifies recommended actions for meeting the goal of improvedwater quality within <strong>Green</strong>wich Bay.<strong>Green</strong>wich Bay SAMP Section 120.3 — Maintain High Quality Fish and Wildlife HabitatThis goal in the <strong>Green</strong>wich Bay SAMP covers a number of actions to maintain fish and wildlife habitat in the<strong>Green</strong>wich Bay watershed. The goal indicates that RIAC should “preserve remaining freshwater wetlands in the<strong>Green</strong>wich Bay watershed.” The measures needed to accomplish this action are addressed in greater detail inSAMP Section 390.5B.5, which is described below.<strong>Green</strong>wich Bay SAMP Section 390.5B.5 — <strong>Airport</strong> Impacts on WetlandsThis section of the SAMP indicates that RIAC “should examine the impacts from any proposed expansionproposal on <strong>Green</strong>wich Bay’s tidal and freshwater wetlands and mitigate for any impacts within the watershed.”Impacts on wetlands and proposed mitigation for these impacts for Alternatives B2 and B4 are discussed in detailin Section 5.10, Wetlands and Waterways. The proposed mitigation would meet this SAMP objective.5.15.4.3 Alternative B4The only freshwater wetland impacts associated with Alternative B4 are on the <strong>Airport</strong>. Since T.F. <strong>Green</strong> <strong>Airport</strong> isnot within the RICRMC freshwater wetland jurisdiction, no wetlands subject to RICRMC jurisdiction areimpacted. Alternative B4 would be designed to comply with applicable state standards relating to the areas439 Stormwater Design and Installation Standards Manual, State of Rhode Island, www.crmc.ri.gov/regulations/programs/whitebook.pdf, 1993.Chapter 5 - Environmental Consequences 5-253 July 2011\\mawatr\ev\09228.00\reports\<strong>FEIS</strong>_Final_July_2011\<strong>PVD</strong>_CH05_Environmental_Cons_JUL_2011.doc
T.F. <strong>Green</strong> <strong>Airport</strong> <strong>Improvement</strong> <strong>Program</strong>Environmental Impact Statement and Final Section 4(f) Evaluationunder RICRMC jurisdiction. The evaluation of CZM consistency for Alternative B4 is the same as Alternative B2(see Section 5.14.4.2, Alternative B2).Significant Impacts: While there is no established significance threshold for Coastal Resources, the PreferredAlternative will be designed to comply with applicable performance standards of the CRMP, Rhode Island SoilErosion and Sediment Control Handbook, and Rhode Island Stormwater Design and Installation Standards Manual, andthe SAMP goals and objectives.5.15.5 Short-Term Impacts from Temporary Construction ActivitiesProject-related actions such as increased impervious surfaces and potential construction period erosion andcontamination could contribute to water quality impacts if not mitigated. Section 5.11, Water Quality, discussespotential water quality impacts resulting from the No-Action and Alternatives B2 and B4, as well asminimization and mitigation measures to address potential water quality impacts. These stormwater and runoffquality mitigation measures would address the goals and objectives of the <strong>Green</strong>wich Bay SAMP, as well asother applicable RIDEM regulations. Potential direct impacts to freshwater wetlands are discussed inSection 5.10, Wetlands and Waterways.5.15.6 Cumulative Impact AssessmentNeither Alternative B2 nor B4 would have direct impacts on any coastal resources because the Project Area doesnot contain any coastal resources.5.15.7 Comparison of Alternatives B2 and B4The No-Action Alternative and Alternatives B2 and B4 will not impact coastal resources and will comply withRICRMC policies and the regional goals in the <strong>Green</strong>wich Bay SAMP. Alternatives B2 and B4 are addressed as agroup due to their similar potential effects on coastal resources.5.15.8 Avoidance and MinimizationAlternatives B2 and B4 will incorporate BMPs to comply with CRMP goals and are expected to satisfy the CZMConsistency requirement.5.16 FarmlandsThis section provides an overview of the impacts analysis for farmlands and includes the methodology fordetermining these potential impacts.5.16.1 Regulatory ContextThe USDA passed the Farmland Protection Policy Act (FPPA) 440 to regulate actions with the potential to convertexisting important farmlands to nonagricultural uses. 441 The FPPA protects three classes of farmland soils: PrimeFarmland; Unique Farmland; and farmland other than prime or unique farmland that is of statewide or local440 7 U.S.C. 4201-4209441 Environmental Desk Reference for <strong>Airport</strong> Actions, FAA, October 5, 2007.Chapter 5 - Environmental Consequences 5-254 July 2011\\mawatr\ev\09228.00\reports\<strong>FEIS</strong>_Final_July_2011\<strong>PVD</strong>_CH05_Environmental_Cons_JUL_2011.doc
T.F. <strong>Green</strong> <strong>Airport</strong> <strong>Improvement</strong> <strong>Program</strong>Environmental Impact Statement and Final Section 4(f) Evaluationimportance (Farmland of Statewide Importance). Prime Farmland, Unique Farmland, and Additional Farmlandof Statewide Importance are defined in Section 4.15.1, Methodology.The USDA Natural Resource Conservation Service (NRCS) and the Rhode Island Department of Administration(RIDOA), Division of Planning have identified those lands in Rhode Island that have a combination of physicaland chemical features that make them best suited for farming. These lands are subdivided into PrimeFarmlands and Additional Farmlands of Statewide Importance, but all soils in Rhode Island that meet the PrimeFarmland criteria are also included in the Additional Farmland of Statewide Importance category. Accordingly,the term Farmland of Statewide Importance is used hereafter to identify both classes of soils. There are noUnique Farmlands in the Project Area. Areas that are in urban development are excluded from the PrimeFarmland and Farmland of Statewide Importance units.Applicability of the FPPA is determined through consultation with the NRCS. The NRCS reviews farmlandwithin the vicinity of a proposed action and makes a determination on whether the FPPA applies, or if anexemption exists. The NRCS reviews potential impacts to farmland to determine if the land qualifies as Primeand Unique Farmland or Farmland of Statewide Importance. Form AD-1006 Farmland Conversion ImpactRating outlines direct and indirect impacts to farmland and assigns an impact rating, and is required by NRCSto perform its impact review. The ultimate determination of the severity of a farmland impact is determined bythe total score calculated using Form AD-1006. The FAA submitted a draft Form AD-1006 and the NRCScompleted it on June 29, 2010 (see Appendix C, Federal, State, City, and Tribal Coordination). The NRCS requestedthat the FAA complete the Form AD-1006 indicating the alternative selected for the project. The FAA willcomplete this portion of the form when it selects the Preferred Alternative at the time of the ROD.5.16.2 Significance ThresholdsFAA Order 1050.1E identifies significant impacts to farmlands, as impacts to existing, intact farmland units thatreceive a score between 200 and 260 points using Form AD-1006. 442,4435.16.2.1 Finding: No Significant Farmlands ImpactsSignificant impacts to farmland would result in a score above 200 on the Farmland Conversion Impact Ratingform. Alternative B2 would not have a significant impact on Farmland of Statewide Importance since it had ascore of 125. Alternative B4 does not have direct or indirect impacts on Farmland of Statewide Importance, andtherefore, would not have a significant impact on Farmland of Statewide Importance.5.16.3 MethodologyThis section defines how significant direct, indirect, and cumulative impacts to Farmland of StatewideImportance within the Study Area are identified. There would be no impacts to farmland soils fromconstruction activities that would be distinct from the direct impacts.442 FAA Order 1050.1E Environmental Impacts: Policies and Procedures, March 20, 2006.443 Ibid.Chapter 5 - Environmental Consequences 5-255 July 2011\\mawatr\ev\09228.00\reports\<strong>FEIS</strong>_Final_July_2011\<strong>PVD</strong>_CH05_Environmental_Cons_JUL_2011.doc
T.F. <strong>Green</strong> <strong>Airport</strong> <strong>Improvement</strong> <strong>Program</strong>Environmental Impact Statement and Final Section 4(f) Evaluation5.16.3.1 Direct Impacts MethodologyDirect impacts were identified by overlaying Alternatives B2 and B4 on a map showing baseline conditions forFarmland of Statewide Importance. <strong>Improvement</strong> <strong>Program</strong> activities proposed within soil map units designatedas Farmland of Statewide Importance that have been previously converted to residential development or otherirretrievable uses were not considered to be impacted. Direct impacts are losses that involve open or forestedlands, including active farmland, that are designated as Farmland of Statewide Importance. The areasurrounding the <strong>Airport</strong> is intensely developed and only limited areas of farmland remain that could beimpacted. The FAA has prepared a draft Form AD-1006 for Alternatives B2 and B4 and initial scores of 83 and74 respectively were determined. On June 29, 2010, the NRCS completed the Land Evaluation portion of theform and determined an overall impact rating score of 125 for Alternative B2 and 74 for Alternative B4.5.16.3.2 Indirect Impacts MethodologyIndirect impacts are consequences that occur as the result of an action’s direct impact, but would occur at a latertime or distance from the project. Indirect impacts, as defined on Form AD-1006, may include reducing oreliminating access to farmland, reducing farmland to a size or configuration that is no longer viable, effects onlocal farm support services and industries, and proximity to improvements such as water and sewer lines.Indirect impacts were evaluated considering the direct impacts to the farmland and the criteria used in thefarmland rating for Form AD-1006.5.16.3.3 Cumulative Impacts MethodologyCumulative impacts were assessed using aerial photographs taken in 1939 as a baseline condition for the Studyand Project Areas. The 1939 aerial photograph was chosen because it is the earliest set of available photographs.Cumulative impacts include previous impacts to farmland that could be identified on the 1939 aerialphotograph and any additional impacts to Farmland of Statewide Importance that Alternatives B2 and B4would cause. Cumulative impacts also include other reasonably foreseeable future losses of farmland.5.16.4 Impact AssessmentThis section evaluates impacts from Alternatives B2 and B4 compared to the No-Action Alternative onFarmland of Statewide Importance within the Project Area.5.16.4.1 No-Action AlternativeThe No-Action Alternative would have no impact on Farmland of Statewide Importance.5.16.4.2 Alternative B2Alternative B2 would have impacts on Farmland of Statewide Importance from two elements: Fully Relocated<strong>Airport</strong> Road and the new Integrated Cargo Facility. The partial relocation of <strong>Airport</strong> Road to accommodate safetyenhancements at the Runway 16 End would not directly or indirectly impact Farmland of Statewide Importance.Direct ImpactsA total of 10.6 acres of Farmland of Statewide Importance would be converted to <strong>Airport</strong> or roadway usesunder Alternative B2 (Table 5-127). Fully Relocated <strong>Airport</strong> Road would directly impact approximately 6.8 acresChapter 5 - Environmental Consequences 5-256 July 2011\\mawatr\ev\09228.00\reports\<strong>FEIS</strong>_Final_July_2011\<strong>PVD</strong>_CH05_Environmental_Cons_JUL_2011.doc
T.F. <strong>Green</strong> <strong>Airport</strong> <strong>Improvement</strong> <strong>Program</strong>Environmental Impact Statement and Final Section 4(f) Evaluationof Farmland of Statewide Importance on the Confreda Farm (Figure 5-48). The new Integrated Cargo Facilitywould directly impact approximately an additional 3.8 acres of forested Farmland of Statewide Importance.Indirect ImpactsFully Relocated <strong>Airport</strong> Road would be constructed through the northern portion of the Confreda Farm. Indirectlosses of 8.2 acres of Farmland of Statewide Importance on the Confreda Farm would result as smaller strips andplots of active farmland would be separated from the main portion of the remaining farm south of this road andwould no longer be accessible. The alignment of Fully Relocated <strong>Airport</strong> Road was designed to avoid impacts to farmoutbuildings, and farming operations could continue on remaining portions of the Confreda Farm. Approximately23 acres south of Fully Relocated <strong>Airport</strong> Road would remain contiguous to the existing farm buildings.The alignment of Fully Relocated <strong>Airport</strong> Road would increase the road frontage through the Confreda Farm,potentially making the farmland more suitable for conversion to other forms of development. However, FullyRelocated <strong>Airport</strong> Road would have limited or no roadway access along this frontage which may reduce itsvalue for commercial development. Reduction in the size of the Confreda Farm from its current 42.6 acres(of which 39.4 acres are Farmland of Statewide Importance) to 20.6 acres (all of which is Farmland of StatewideImportance) could diminish the economic viability of continued farming operations, potentially leading to itssale for development.Significant Impact: While Alternative B2 would impact Farmland of Statewide Significance, the impacts would notbe significant the site received a score of 125 on the Farmland Conversion Impact Rating form.5.16.4.3 Alternative B4Alternative B4 would not require the full relocation of <strong>Airport</strong> Road. It would include a new Integrated CargoFacility but at a different location than Alternative B2. No project elements would directly or indirectly impactFarmland of Statewide Importance (Figure 5-48). Alternative B4 would not result in direct, indirect, orcumulative impacts to Farmland of Statewide Importance.5.16.5 Short-term Impacts from Temporary Construction ActivitiesAlternatives B2 and B4 would have no temporary construction impacts on Farmland of Statewide Importance.5.16.6 Cumulative ImpactsAccording to the USDA and the RIDOA, the percentage of land area classified as farmland within Rhode Islandhas steadily decreased over the years due to urban encroachment and other development pressures. 444 Censusdata provided by the USDA reveals a 72 percent decrease in the statewide area of farmland between the years1850 445 and 1974. 446 The RIDOA reports a further decline in farmland between 1985 and 2003 of almost 17,000acres, with only approximately 33,000 acres of farmland remaining statewide. 447444 Soil Survey of Rhode Island, 1981.445 U.S. Census of Agriculture: 1959. Vol. 1, Counties, Part 5, Rhode Island, Washington, D.C. 1960.446 Census of Agriculture, Rhode Island State and County Data, U.S. Department of Commerce, Bureau of the Census, Vol. 1, Part 39. Washington, D.C. 1977.447 Rhode Island Agricultural Digest 2003. RIDEM, Division of Agriculture and Resource Marketing, Providence, Rhode Island.Chapter 5 - Environmental Consequences 5-257 July 2011\\mawatr\ev\09228.00\reports\<strong>FEIS</strong>_Final_July_2011\<strong>PVD</strong>_CH05_Environmental_Cons_JUL_2011.doc
T.F. <strong>Green</strong> <strong>Airport</strong> <strong>Improvement</strong> <strong>Program</strong>Environmental Impact Statement and Final Section 4(f) EvaluationThe areas surrounding the <strong>Airport</strong> have followed the same trend as the rest of the state. Farmland in theStudy Area has been lost through the expansion of the <strong>Airport</strong>, and surrounding commercial and residentialdevelopment. In the 1939 photographs the <strong>Airport</strong> is present, but had not expanded into the large formerfarmland south of the runways. Virtually all of the farmland south and west of the <strong>Airport</strong> has since been lostdue to runway expansion and airport improvements and surrounding commercial and residential development.Portions of the farmland north and east of the <strong>Airport</strong> present in 1939 still remain today; however, these areasare now either surrounded by commercial and residential development, or are owned by the <strong>Airport</strong>.The two areas of Farmland of Statewide Importance that could be impacted by the <strong>Improvement</strong> <strong>Program</strong>appear little changed from their condition in the 1939 aerial photograph. The Confreda Farm north of BuckeyeBrook has been marginally reduced in area due to encroaching residential and commercial development, butmost of the farmland present in 1939 still remains. The wooded area containing Farmland of StatewideImportance south of Buckeye Brook is also relatively unchanged since 1939 with two exceptions: the easternportion of this wooded area was farmed in 1939, and the southern portion adjacent to <strong>Airport</strong> Road that waswooded land in 1939 is now in commercial development (including the Air National Guard facility). The formerFain Farm (of which 37.8 acres are Farmland of Statewide Importance), located north of Buckeye Brook, isplanned for anticipated commercial development and, for the purposes of this <strong>FEIS</strong>, is assumed to be lost due toactions not associated with the T.F. <strong>Green</strong> <strong>Airport</strong> <strong>Improvement</strong> <strong>Program</strong>, but is part of the cumulative impact.No Farmland of Statewide Importance would be converted to non-agricultural use as a result of <strong>Airport</strong> actionsunder the No-Action Alternative. Alternative B2 would result in the conversion of farmland within the StudyArea. Fully Relocated <strong>Airport</strong> Road would directly and indirectly convert Farmland of Statewide Importancethat is part of the operating Confreda Farm. The <strong>Improvement</strong> <strong>Program</strong> could induce secondary developmentthat might result in the conversion of remaining farmland to a non-farm use. Other less valuable Farmland ofStatewide Importance that are not part of an operating farm would also be converted in order to construct anew Integrated Cargo Facility and portions of the expanded Runway 23 End under Alternative B2. AlternativeB4 would not impact any Farmland of Statewide Importance. Therefore, cumulative impacts of Alternative B2may result in the conversion of Confreda Farm, an operating farm in the Project Area, to non-agricultural useswhile Alternative B4 would not result in additional cumulative impacts to farmland soils in the Project Area.5.16.7 Comparison of Alternatives B2 and B4There are no significant impacts to farmlands under Alternatives B2 and B4. Alternative B2 would not result insignificant impacts; the NRCS Farmland Conversion Impact Rating, as reported on Form AD-1006, is125.Alternative B4 would not directly, indirectly, or cumulatively impact Farmland of Statewide Importance.Alternative B4 would not result in any impacts; the NRCS Farmland Conversion Impact Rating, as reported onForm AD-1006, is 74. Form AD-1006 has been completed by the NRCS and is included in Appendix C, Federal,State, City, and Tribal Coordination.Alternative B2 would directly and indirectly impact a total of 18.8 acres of Farmland of Statewide Importancenorth of existing <strong>Airport</strong> Road due to Fully Relocated <strong>Airport</strong> Road and the Integrated Cargo Facility. Indirectimpacts due to secondary (induced) development could ultimately result in the loss of the remaining 20.6-acreChapter 5 - Environmental Consequences 5-258 July 2011\\mawatr\ev\09228.00\reports\<strong>FEIS</strong>_Final_July_2011\<strong>PVD</strong>_CH05_Environmental_Cons_JUL_2011.doc
T.F. <strong>Green</strong> <strong>Airport</strong> <strong>Improvement</strong> <strong>Program</strong>Environmental Impact Statement and Final Section 4(f) Evaluationportion of the Confreda Farm under Alternative B2. This could represent the loss of the last operating farm inthe Study Area.Table 5-127 summarizes direct and indirect impacts to Farmland of Statewide Importance from Alternatives B2and B4 and the No-Action Alternative.Table 5-127Direct and Indirect Impacts to Farmland of Statewide ImportanceDirect Impacts (acres)Fully Relocated <strong>Airport</strong> Road 1 Integrated Cargo Facility TotalNo-Action Alternative NA NA 0Alternative B2 6.8 3.8 10.6Alternative B4 0 0 0Indirect Impacts (acres)Fully Relocated <strong>Airport</strong> Road 1 Integrated Cargo Facility TotalNo-Action Alternative NA NA 0Alternative B2 8.2 0 8.2Alternative B4 0 0 01 Portion of the operating Confreda Farm.NA Not Applicable because these program elements are not part of the No-Action Alternative.5.16.8 Avoidance and MinimizationFully Relocated <strong>Airport</strong> Road under Alternative B2 was designed to minimize impacts to Farmlands ofStatewide Importance. In order to minimize impacts to the Confreda Farm, Fully Relocated <strong>Airport</strong> Road wouldbe aligned through the northern portion of the Confreda Farm thus avoiding impacts to farm outbuildings, andfarming operations, which could continue on remaining portions of the Confreda Farm.5.17 Hazardous Materials, Pollution Prevention, and Solid WasteThis section provides an overview of the impact analysis for hazardous materials, solid waste, and pollutionprevention.5.17.1 Regulatory ContextFour primary federal laws govern the handling and disposal of hazardous materials, chemicals, substances andwastes. The two statutes of most importance to the FAA in proposing actions to construct and operate facilitiesand navigational aids are the Resource Conservation and Recovery Act 448 of 1976 (RCRA) and the ComprehensiveEnvironmental Response, Compensation, and Liability Act 449 of 1980 (CERCLA), as amended by the SuperfundAmendments and Reauthorization Act of 1986 (SARA) and the Community Environmental Response Facilitation Act of448 PL 94-580, codified at 42 USC 6901 et seq.449 PL 96-510, codified at 42 USC 9601 et seq.Chapter 5 - Environmental Consequences 5-259 July 2011\\mawatr\ev\09228.00\reports\<strong>FEIS</strong>_Final_July_2011\<strong>PVD</strong>_CH05_Environmental_Cons_JUL_2011.doc
T.F. <strong>Green</strong> <strong>Airport</strong> <strong>Improvement</strong> <strong>Program</strong>Environmental Impact Statement and Final Section 4(f) Evaluation1992. RCRA governs the generation, transportation, treatment, storage, and disposal of hazardous wastes.CERCLA provides for consultation with natural resources trustees and cleanup of any release of hazardoussubstance (excluding petroleum) into the environment. Executive Order 12088, Federal Compliance with PollutionControl Standards, 450 amended by Executive Order 12580, 451 directs federal agencies to “comply with ‘applicablepollution control standards’, in the prevention, control and abatement of environmental pollution, and consultwith the EPA, State, interstate, and local agencies concerning the best techniques and methods available for theprevention, control and abatement of environmental pollution.”At the state level, RIDEM regulates the protection of the natural environment in Rhode Island, including water,soil, and air under the Rhode Island Industrial Property Remediation and Reuse Act. 452 Various RIDEM regulationsapply to construction of the T.F. <strong>Green</strong> <strong>Airport</strong> <strong>Improvement</strong> <strong>Program</strong>, including:• RIDEM Rules and Regulations for the Investigation and Remediation of Hazardous Material Releases (RemediationRegulations), as amended February 2004• Discharge to waters of the state and groundwater would need to comply with RIPDES Regulations• UST closure would be performed in accordance with RIDEM Rules and Regulations for Underground StorageFacilities Used for Petroleum and Hazardous Materials, amended December 2008• Dust control during construction would require compliance with RIDEM Air Pollution Control Regulation No. 5,Fugitive Dust, amended July 17, 2007• Lead-based paint abatement on exterior building surfaces must be carried out in accordance with RIDEM AirPollution Control Regulation No. 24, Removal of Lead Based Paint from Exterior Surfaces, amended July 17, 2007• Removal, disposal and transportation of hazardous and non-hazardous waste must be conducted inaccordance with RIDEM Rules and Regulations for Hazardous Waste Management (Hazardous WasteRegulations), amended February 9, 2007 and Rules and Regulations for Composting Facilities and Solid WasteManagement Facilities (Solid Waste Regulations), amended October 2005, respectively.The Rhode Island Department of Health (RIDOH), Office of Occupational Health, Indoor Air Quality <strong>Program</strong>is also responsible for implementing the Rhode Island Asbestos Control <strong>Program</strong>. The Rules and Regulations forAsbestos Control, as amended 2007 set forth standards for asbestos abatement, work procedures, and workercertifications. The EPA regulations require that regulated asbestos containing materials (ACM) 453 be removed orabated before demolition of structures containing ACM.5.17.2 Significance ThresholdThe analysis considers impacts of Alternatives B2 and B4 as defined by the FAA’s thresholds of significance,and also conducts additional analyses to gain a full understanding of the potential pollution impacts on theenvironment.450 43 FR 47707.451 52 FR 2923.452 Rhode Island General Law section 23-19.14-1 et seq.453 Refer to the National Emission Standards for Hazardous Air Pollutants (NESHAP), 40 CFR Part 61, Subpart M for the definition of “Regulated ACM”.Chapter 5 - Environmental Consequences 5-260 July 2011\\mawatr\ev\09228.00\reports\<strong>FEIS</strong>_Final_July_2011\<strong>PVD</strong>_CH05_Environmental_Cons_JUL_2011.doc
T.F. <strong>Green</strong> <strong>Airport</strong> <strong>Improvement</strong> <strong>Program</strong>Environmental Impact Statement and Final Section 4(f) Evaluation5.17.2.1 Finding: No Significant Hazardous Materials, Pollution Prevention, and Solid Waste ImpactsAs presented in Table 5-6, FAA Order 1050.1E defines a significant impact for hazardous materials, pollutionprevention, and solid waste as one where an action involves a property on or eligible for the National Priority List(NPL). In other cases, an unresolved issue may be considered significant. Uncontaminated priorities within a NPLsite’s boundary do not always trigger this significant threshold. As documented in Chapter 4, Affected Environment,there are no sites in the Project Area, Study Area, or City of Warwick that are listed on the NPL. Additionally,there are no unresolved issues regarding hazardous materials. Therefore there are no significant impacts in thecategory of Hazardous Materials, Pollution Prevention, and Solid Waste, as a result of Alternatives B2 or B4.5.17.2.2 Additional AnalysesIn accordance with federal and state regulations, additional analyses related to hazardous materials, pollutionprevention, and solid waste considered sanitary and solid waste management at T.F. <strong>Green</strong> <strong>Airport</strong>; the storageand handling of petroleum products at T.F. <strong>Green</strong> <strong>Airport</strong>, pollution prevention measures at T.F. <strong>Green</strong> <strong>Airport</strong>,and potential sources of contaminated soil or groundwater within the Project Area.5.17.3 MethodologyImpacts were identified for Alternatives B2 and B4 based on the Baseline Condition described in Chapter 4,Affected Environment.5.17.3.1 Direct Impacts MethodologyA direct impact is an immediate consequence to the environment or construction program as a result of theimplementation of Alternatives B2 and B4. Direct impacts would include encountering existing contamination,acquiring a contaminated property, or generating regulated materials during building demolition, storage tankremovals, or site preparation. The following are considered direct impacts:• Encountering or Creating Contaminated Soils and Groundwater• Property Acquisition• Generating Demolition Debris• Underground Storage Tank (UST) Removal• New ReleasesContaminated soils and/or groundwater may be encountered during excavation work. Contaminatedgroundwater could also be encountered if excavation dewatering is required during construction. Potentialcontaminants that may be encountered during construction include petroleum hydrocarbons, polycyclicaromatic hydrocarbons, volatile organic compounds, polychlorinated biphenyls, pesticides, and metals. Themagnitude and location of this type of impact was identified by determining which areas of existing or potentialcontamination are within the limit of disturbance for Alternatives B2 and B4. A review of federal, state, andproprietary environmental databases was conducted to identify properties in the vicinity of the Project Areathat were known to be contaminated, including the NPL and RIDEM databases. Refer to Table 2-1 of DEISHazardous Materials, Pollution Prevention and Solid Waste Technical Report for a complete list of the databases thatwere reviewed as part of the <strong>FEIS</strong>. It is also possible that a previously undiscovered release could beencountered during construction of Alternatives B2 and B4, which would be identified and addressed.Chapter 5 - Environmental Consequences 5-261 July 2011\\mawatr\ev\09228.00\reports\<strong>FEIS</strong>_Final_July_2011\<strong>PVD</strong>_CH05_Environmental_Cons_JUL_2011.doc
T.F. <strong>Green</strong> <strong>Airport</strong> <strong>Improvement</strong> <strong>Program</strong>Environmental Impact Statement and Final Section 4(f) EvaluationThe Project Area includes land within Alternative B2’s and B4’s limits of disturbance as well as properties thatwould be acquired for Alternatives B2 and B4, and associated building demolition. The acquisition of a propertywith either a known or previously undiscovered release of oil and/or hazardous materials may create apotential liability for RIAC. Commercial and industrial properties are considered more likely than residential orundeveloped properties to have had a release of oil and/or hazardous materials to the environment due togreater fuel storage needs, industrial processes, and various chemical use, storage, and disposal practices. Themagnitude and location of this type of impact was estimated by identifying the total number of propertyacquisitions (residential and commercial; mandatory and voluntary) and the associated structures that would bedemolished with a focus on commercial/industrial parcels. Refer to Section 5.1.4, Land Acquisition Assumptions,for a description of how parcels were identified for mandatory and voluntary acquisition for the No-Action andAlternatives B2 and B4.Other types of demolition include perimeter roads, taxiways, runways, and other facilities. Hangar No. 1 whichwill be demolished under Alternatives B2 and B4 contains asbestos. Buildings constructed prior to 1980 maypotentially contain ACM. Residential buildings constructed prior to 1978 and commercial or industrial buildingsconstructed prior to the mid-1990s may potentially contain lead-based paint building materials. Federal lawprohibits the widespread use of these materials, particularly in residential buildings. Due to less stringentregulation and generally larger building size, commercial and industrial buildings are considered more likely thanresidential buildings to contain these materials.Any oil or hazardous materials storage facilities that would be disturbed by the construction of Alternatives B2and B4 were identified, including aboveground storage tanks (ASTs) and USTs. If disturbed, these facilitieswould require assessment and removal, in accordance with state regulations. Refer to Tables 2-2 through 2-4 ofDEIS Hazardous Materials, Pollution Prevention and Solid Waste Technical Report for a complete list of ASTs, USTs,and miscellaneous oil and hazardous materials storage on-<strong>Airport</strong>. Additionally, off-<strong>Airport</strong>, potential sourcesof contaminated soil or groundwater within the Project Area were identified. Refer to Table 2-5 of DEISHazardous Materials, Pollution Prevention and Solid Waste Technical Report for a complete list of registered LUSTswithin the Project Area. The magnitude and location of this type of impact was identified by counting thenumber of registered ASTs, USTs, and LUSTs located within the limit of disturbance and potential acquiredproperties for Alternatives B2 and B4.Construction activities and associated equipment have the potential to generate new releases or spills as a resultof the storage and use of hazardous materials such as diesel fuel, gasoline, hydraulic oil, and lubricating oilsassociated with construction equipment.5.17.3.2 Indirect Impacts MethodologyAn indirect impact related to subsurface contamination or waste materials management would occur whenAlternative B2 or B4 has the potential to affect the ongoing remediation of existing contamination or wouldproduce additional sources of contamination or waste materials. An indirect impact related to subsurfacecontamination or waste management would exist if Alternative B2 or B4 has the potential to cause an impact atanother time or a location outside of the Project Area. Beneficial impacts and ongoing release monitoring andremediation are considered indirect impacts.Chapter 5 - Environmental Consequences 5-262 July 2011\\mawatr\ev\09228.00\reports\<strong>FEIS</strong>_Final_July_2011\<strong>PVD</strong>_CH05_Environmental_Cons_JUL_2011.doc
T.F. <strong>Green</strong> <strong>Airport</strong> <strong>Improvement</strong> <strong>Program</strong>Environmental Impact Statement and Final Section 4(f) EvaluationContaminated materials and potential sources of contamination encountered would be removed duringconstruction, positively affecting the environment. Beneficial impacts would include addressing contaminationin accordance with RIDEM Rules and Regulations for the Investigation and Remediation of Hazardous MaterialReleases for the investigation and remediation of hazardous material releases.The ongoing monitoring and remediation of known releases could be indirectly impacted. The movement ortemporary shut-down of an active remediation system would impact the remediation rate of the contaminationand could interfere with monitoring. The data collected after monitoring well replacement may not be directlycomparable to previously collected data because it is difficult to identically recreate a groundwater monitoringwell due to different subsurface conditions or contaminant distribution.The potential impact caused by temporary shutdown of an active remediation system was estimated bydetermining whether an existing release currently undergoing active remediation or monitoring lies within thelimit of disturbance or potential property acquisition for Alternatives B2 and B4. A review of federal, state, andproprietary environmental databases was conducted to identify properties in the vicinity of the Project Area thathave had a release of oil and/or hazardous materials (OHM). A review of RIDEM files provided informationregarding the type of release, specific location of soil or groundwater impacts, magnitude of the identified impacts,and the most recent status of any monitoring or remediation activities for each of the releases.5.17.3.3 Cumulative Impacts MethodologyPast, current, and future actions and impacts related to hazardous materials, pollution prevention, and solidwaste management are accounted for as part of the cumulative impacts analysis. The affected environmentanalysis includes a complete assessment of all known hazardous materials within the Study Area (refer toChapter 4, Affected Environment). Current practices at T.F. <strong>Green</strong> related to ongoing remediation on-<strong>Airport</strong> andwaste management is also considered under cumulative impacts. Potential impacts of Alternatives B2 and B4are assessed as part of the <strong>FEIS</strong> impact assessment.5.17.4 Impact AssessmentSeveral potential sources of soil or groundwater contamination are present within or adjacent to the ProjectArea. Construction activities for Alternatives B2 and B4 may encounter contaminated soils, groundwater, orsurface water, or may generate regulated and hazardous wastes. This section summarizes the potential impactswith respect to hazardous materials, solid waste and pollution prevention for Alternatives B2 and B4, and theNo-Action Alternative.5.17.4.1 No-Action AlternativeIn early 2010, RIAC continued the Part 150 NCP (referred to as the Current Part 150 VLAP). Under the 2020No-Action Alternative, it is assumed that up to 115 residential parcels (59 parcels at the Runway 5 End and56 parcels at the Runway 23 End) would be eligible for voluntary acquisition (Figure 5-49). This would generatedebris, such as ACM, lead based paint (LBP) impacted demolition debris, and solid waste, which would bedemolished and disposed of appropriately. No registered USTs are located within the Current Part 150 VLAPareas (Figure 5-49). There is a minor chance that new releases would be encountered or created during theNo-Action Alternative construction or demolition activities. However, this risk is low because the amount ofconstruction planned under the No-Action Alternative is limited.Chapter 5 - Environmental Consequences 5-263 July 2011\\mawatr\ev\09228.00\reports\<strong>FEIS</strong>_Final_July_2011\<strong>PVD</strong>_CH05_Environmental_Cons_JUL_2011.doc
T.F. <strong>Green</strong> <strong>Airport</strong> <strong>Improvement</strong> <strong>Program</strong>Environmental Impact Statement and Final Section 4(f) EvaluationIndirect ImpactsCommercial and industrial properties subject to ongoing groundwater monitoring include Mobil SS #01 and Spring<strong>Green</strong> Corporation (Figure 5-49). The No-Action Alternative would not have a significant impact on any ongoingcontamination assessment or remediation program in the Study Area. Demolition debris from the structures onacquired land under the Current Part 150 VLAP would be disposed of at an appropriately licensed landfill. Ifpreviously unidentified USTs or new releases were encountered during demolition, RIAC would close and/orremediate these sites as part of the demolition activity. The No-Action Alternative would result in beneficial impactsby accelerating the remediation of any of the known or previously unidentified releases in the Project Area.5.17.4.2 Alternative B2The following direct and indirect impacts may occur during the implementation of Alternative B2. Table 5-128presents a summary of these impacts.Direct ImpactsAs listed in Table 5-128, the proposed limit of disturbance for Alternative B2 could potentially encountercontaminated soil, groundwater, or surface water at six existing release areas: the Spring <strong>Green</strong> Corporation, theForest Company, Budget Rent-A-Car, Mobil SS# 01, the former <strong>Airport</strong> Fuel Farm, and the Truk-Away Landfill.These sites are associated with the Runway 16 End (three sites), the Runway 34 End (one site), the Fully Relocated<strong>Airport</strong> Road (one site), and taxiway improvement and Integrated Cargo Facility construction (one site). Thelocation of the release areas in relation to the limit of disturbance is shown in Figure 5-49.Based on conceptual design plans, up to 247 residential and commercial parcels consisting of 126 structureswould be fully acquired for Alternative B2, including 126 mandatory acquisitions for construction, 41 for thenoise mitigation program under a Future Build VLAP, and 80 voluntary acquisitions for FAA-recommendedclearing of the RPZs (Table 5-128). Twenty-seven parcels would be partially acquired for construction(mandatory acquisition).Fifty-three of the properties consisting of 30 structures that are required to be acquired for construction ofAlternative B2 are currently being used for commercial, industrial, or agricultural purposes (Table 5-128). Threeof the properties eligible for voluntary acquisition for the RPZ for Runway 23 End are currently being used forcommercial purposes. The majority of the properties that would be acquired would be for the Fully Relocated<strong>Airport</strong> Road and the extension of Runway 23, although the greatest number of commercial or industrialproperties that would be acquired is at the Runway 16 End in the vicinity of the Partially Relocated <strong>Airport</strong>Road. Due to the known existing land uses of these parcels (commercial, industrial, and agriculture), they couldpotentially have soil and groundwater contamination. Alternative B2 would require demolishing Hangar No. 1,which is known to contain asbestos.Nineteen registered USTs would be impacted (removed) under Alternative B2. Seventeen of the USTs are at theRunway 16 End or near the construction of the new Integrated Cargo Facility and two USTs are near the RPZ atthe Runway 5 End (Figure 5-49). Construction of Alternative B2 would result in approximately 26.3 acres ofasphalt (Table 5-128).Chapter 5 - Environmental Consequences 5-264 July 2011\\mawatr\ev\09228.00\reports\<strong>FEIS</strong>_Final_July_2011\<strong>PVD</strong>_CH05_Environmental_Cons_JUL_2011.doc
T.F. <strong>Green</strong> <strong>Airport</strong> <strong>Improvement</strong> <strong>Program</strong>Environmental Impact Statement and Final Section 4(f) EvaluationTable 5-128Alternatives B2 and B4: Comparison of Environmental Consequences, HazardousMaterials, and Solid WasteImpacts Alternative B2 Alternative B4Direct ImpactsContaminated Soils and GroundwaterSpring <strong>Green</strong> Corp. 1 (S, GW) –The Forest Co. 1 (GW) –Budget 1 (S, GW) 1 (S, GW)Mobil SS# 01 1 (GW) 1 (GW)Former Fuel Farm 1 (GW 1 ) 1 (GW 1 )Truk-Away Landfill 1 (S, GW) 1 (S, GW)Property AcquisitionTotal Properties 247 180Properties for Construction (Mandatory) 2 126 39Commercial/Industrial 53 23Properties for Noise Mitigation/RPZ (Voluntary) 121 141Commercial/Industrial 3 0Demolition DebrisTotal Buildings 173 146Structures for Construction (Mandatory) 2 84 19Commercial/Industrial 30 8Structures for Noise Mitigation/RPZ (Voluntary) 89 127Commercial/Industrial 3 0Area of Asphalt Impacts (Acres) 26.3 5.5UST Removals 19 7Indirect ImpactsBeneficial Impacts Y YOngoing Release Monitoring Y YOff-Site Impacts 3 Y YSources: EDR Report July 26, 2005; VHB, Inc.Notes: S= Potential soil impact, GW = Potential groundwater impact, Y = Potential impact, – = No foreseeable impact. UST = Underground storage tank.1 The risk of a groundwater impact is noted here because an active groundwater contamination remediation system is in place. However, recent sampling hasindicated that groundwater contamination may be below regulatory levels. Due to its uncertain closure status, this impact has been left in consideration althoughthe levels of groundwater contamination from this release are likely to be low.2 Includes demolition of on-<strong>Airport</strong> structures.3 Note that off-site impacts are not specifically related to the <strong>Improvement</strong> <strong>Program</strong> and reflect a general risk associated with all hazardous and regulated materialdisposal. Due to RCRA laws, the risk of off-site impacts is considered to be low.Chapter 5 - Environmental Consequences 5-265 July 2011\\mawatr\ev\09228.00\reports\<strong>FEIS</strong>_Final_July_2011\<strong>PVD</strong>_CH05_Environmental_Cons_JUL_2011.doc
T.F. <strong>Green</strong> <strong>Airport</strong> <strong>Improvement</strong> <strong>Program</strong>Environmental Impact Statement and Final Section 4(f) EvaluationIndirect ImpactsIn the event that contaminated soil is encountered, it would likely be removed and groundwater would likelybe treated on-site from six release sites (listed in the Direct Impacts section above), thereby reducing the amountof contamination in the area. USTs would also be removed as described above. Removing the USTs wouldeliminate potential future sources of contamination.Alternative B2 may impact the active remediation systems at the former Fuel Farm (although contamination inthis area may have been reduced to acceptable levels) and the Spring <strong>Green</strong> Corporation site. The constructionmay also affect the groundwater monitoring wells in place at the Mobil SS #01 site.Significant Impacts: There are no sites in the Project Area, Study Area, or City of Warwick that are listed on theNPL. Therefore there are no significant impacts in the category of Hazardous Materials, Solid Waste, andPollution Prevention as a result of Alternative B2.5.17.4.3 Alternative B4The following direct and indirect impacts may occur during the implementation of Alternative B4. Table 5-128presents a summary of these impacts.Direct ImpactsAs presented in Table 5-128, the proposed limit of disturbance for Alternative B4 could potentially encountercontaminated soil, groundwater, or surface water at four existing nearby release areas: Budget Rent-A-Car,Mobil SS# 01, the former <strong>Airport</strong> Fuel Farm, and the Truk-Away Landfill. None of these release areas fall withinthe limit of disturbance but may impact soil and/or groundwater within the limit of disturbance. These sites areassociated with the Runway 16 End (three sites) and the Runway 34 End (one site) (Figure 5-49).Based on 30 percent conceptual design plans, 180 residential and commercial parcels consisting of 146 structureswould be fully acquired for Alternative B4, including 39 mandatory acquisitions for construction, 64 voluntaryacquisitions for clearing the Runway 5 End RPZ, and 77 residential parcels are eligible for voluntaryparticipation in an acquisition program for noise mitigation (Table 5-128). Sixteen parcels would be partiallyacquired for construction (mandatory acquisition).Twenty-three of the properties consisting of eight structures that would be acquired for construction arecurrently being used for commercial or industrial purposes. The greatest number of commercial and industrialproperties that would be fully or partially acquired for construction is at the Runway 16 End in the vicinity ofthe Partially Relocated <strong>Airport</strong> Road. These properties could potentially have soil and groundwatercontamination. Alternative B4 would require demolishing Hangar No. 1, which is known to contain asbestos.Seven registered USTs would be impacted (removed) under Alternative B4 (Table 5-128). Four of the USTs areat the Runway 16 End or near the construction of the new Split Cargo Facility, and three USTs are in the vicinityof the runway protection zone at the Runway 5 End (Figure 5-49). Construction of Alternative B4 would resultin approximately 5.5 acres of asphalt (Table 5-128).Chapter 5 - Environmental Consequences 5-266 July 2011\\mawatr\ev\09228.00\reports\<strong>FEIS</strong>_Final_July_2011\<strong>PVD</strong>_CH05_Environmental_Cons_JUL_2011.doc
T.F. <strong>Green</strong> <strong>Airport</strong> <strong>Improvement</strong> <strong>Program</strong>Environmental Impact Statement and Final Section 4(f) EvaluationIndirect ImpactsIn the event that contaminated soil is encountered, it would likely be removed and groundwater would likelybe treated on-site from four release sites (listed in the Direct Impacts section above), thereby reducing theamount of contamination in the area. Removing the USTs would eliminate potential future sources ofcontamination. Alternative B4 is not anticipated to impact active remediation systems or groundwatermonitoring at nearby release sites.Significant Impacts: There are no sites in the Project Area, Study Area, or City of Warwick that are listed on theNPL. Therefore there are no significant impacts in the category of Hazardous Materials, Solid Waste, andPollution Prevention as a result of Alternative B4.5.17.5 Short-Term Impacts from Temporary Construction ActivitiesAlternatives B2 and B4 would have no temporary construction impacts on hazardous materials and solid waste.The potential for new releases from either construction activities or from encountering a previously unidentifiedrelease is considered generally the same because each Alternative would involve construction activities of arelatively similar magnitude and duration. While it is not possible to determine the likelihood of encountering apreviously unidentified release as part of conceptual design, measures to protect workers and the environment,such as special management procedures for any hazardous, contaminated, or special wastes generated duringconstruction as part of a site-specific Health and Safety Plan would be implemented. Construction materials anddebris would require disposal at appropriately licensed off-site facilities, including landfills, recycling centers,and treatment/asphalt batch plants.5.17.6 Cumulative ImpactsNeither the No-Action Alternative nor Alternatives B2 and B4 will result in the generation of additionalhazardous materials or solid waste. Alternatives B2 and B4 would result in an overall net benefit related tohazardous materials and solid waste because RIAC would close and remediate known or previouslyunidentified USTs impacted by program elements as part of the demolition activity. Demolition debris from thestructures on acquired land would be disposed of at an appropriately licensed landfill.5.17.7 Comparison of Alternatives B2 and B4Alternatives B2 and B4 would not result in significant impacts related to hazardous materials or solid waste.There are no feasible means of avoiding areas of potential subsurface contamination or waste materials.It is anticipated that Alternatives B2 and B4 would comply with Rhode Island and federal hazardous materialsand solid waste regulations because Alternatives B2 and B4 would be designed in compliance with applicableregulatory requirements.Based on the magnitude of each potential impact, Alternative B4 would have the fewest environmentalconsequences related to OHM because there would be fewer overall required property acquisitions andproperty demolitions. Alternatives B2 would require the removal of 19 USTs and Alternative B4 would requirethe removal of seven USTs. Alternatives B2 and B4 would provide beneficial impacts due to the potentialremoval of impacted soil during construction activities. For both Alternatives, in the event that contaminatedsoil is encountered, it would likely be removed and groundwater would likely be treated on-site from theChapter 5 - Environmental Consequences 5-267 July 2011\\mawatr\ev\09228.00\reports\<strong>FEIS</strong>_Final_July_2011\<strong>PVD</strong>_CH05_Environmental_Cons_JUL_2011.doc
T.F. <strong>Green</strong> <strong>Airport</strong> <strong>Improvement</strong> <strong>Program</strong>Environmental Impact Statement and Final Section 4(f) Evaluationrelease sites, thereby reducing the amount of contamination in the area. USTs would also be removed whichwould eliminate potential future sources of contamination.5.17.8 Avoidance and MinimizationAlternatives B2 and B4 would not result in significant impacts as defined in FAA Order 1050.1E. They would bedesigned and constructed in compliance with applicable local, state, and federal laws and regulationsconcerning hazardous or solid waste management. Measures to protect workers and the environment would berequired before and during construction. This section describes measures to avoid and minimize direct andindirect impacts identified for Alternatives B2 and B4. Mitigation is not proposed because all state and federallaws can be met.5.17.8.1 AvoidanceBased on the location of existing and potential contamination sites and regulated materials issues, there are nomeasures that entirely avoid the impacts.5.17.8.2 MinimizationAlthough there are no measures that would avoid encountering subsurface contamination or generating wastematerials, the following preventive measures can be used during construction to minimize any potential costincreases or construction schedule delays. The following measures will help to minimize the impacts fromsubsurface contamination and waste materials.Coordination with Rhode Island Department of Environmental ManagementTo minimize the construction impacts from known release areas, response plans would be developed incoordination with RIDEM and in accordance with federal and state regulations.Preliminary InvestigationsAlternatives B2 and B4 would involve acquiring numerous properties and demolishing buildings, includingthose with commercial and industrial histories. Just as with the process RIAC already has in place with theCompleted and Current Part 150 VLAPs, due diligence in the form of environmental site assessments will beconducted after acquisition and before demolition of the properties. Specifically, preliminary investigations ofeach property would be conducted to assess and prevent the direct impacts of demolishing buildings containingACM and/or LBP. Preliminary investigations may include a Phase 1 Environmental Site Assessment prior tocommercial or industrial property acquisition, pre-demolition Inspection/Transaction Screen for ACM, LBP, orregulated waste materials, and any follow-up investigations required to address Recognized EnvironmentalConditions identified during Phase 1 Site Assessments. Additionally, during the design of the PreferredAlternative, properties where releases have been identified but not fully characterized (such as the Truk-AwayLandfill) 454 may also require additional investigation to further define the limits of contamination.454 The Department of Administration is responsible for the Truk-Away Landfill. A Site Investigation Report was submitted to the RIDEM on September 18,2008 for the Truk-Away Landfill by EA Engineering, Science and Technology, Inc. RIDEM has not commented on this report or the remedial alternativescontained therein as of the time of this filing.Chapter 5 - Environmental Consequences 5-268 July 2011\\mawatr\ev\09228.00\reports\<strong>FEIS</strong>_Final_July_2011\<strong>PVD</strong>_CH05_Environmental_Cons_JUL_2011.doc
T.F. <strong>Green</strong> <strong>Airport</strong> <strong>Improvement</strong> <strong>Program</strong>Environmental Impact Statement and Final Section 4(f) EvaluationHazardous Waste and Special Waste ManagementAny hazardous, contaminated, or special wastes generated through construction activities will be managed incompliance with applicable laws. A detailed Soil Management Plan would be prepared in accordance with theRemediation Regulations. If areas of excavation require dewatering during construction, they would bemanaged in accordance with applicable RIDEM regulations.Alternatives B2 and B4 would require demolishing Hangar No. 1, which contains asbestos. A pre-demolitionbuilding survey for suspected ACM would be performed in accordance with National Emission Standards forHazardous Air Pollutants procedures. 455 Bulk asbestos sampling will be performed in accordance with OSHAregulatory requirements pursuant to the Asbestos Hazard Emergency Response Act. 456The presence of LBP within the buildings to be demolished primarily represents a construction worker healthand safety exposure issue. Work practices would be designed to prevent exposure of lead dust (sawing, cutting,and sanding) and lead fumes (torch cutting and welding) to contractors.The health and safety of construction workers who may come in contact with identified contaminated materialsare regulated by preparation of a site-specific Health and Safety Plan. Any demolition or impact involvingimpacts to ACM or LBP would require compliance under federal, state, and local health and safety regulations.5.18 Light Emissions and Visual EnvironmentThis section provides an overview of the analysis of impacts from light emissions and visual effects andincludes the methodology for determining their potential impacts. For an assessment of visual impacts tohistorical resources in the Study Area, refer to Chapter 7, Final Section 4(f)/Section 6(f) Evaluation.5.18.1 Regulatory ContextNo federal regulations govern light emissions or visual intrusions. In the case of light emissions, FAA’s NEPAguidance directs consideration of the extent to which any lighting associated with an action will createannoyance among people in the vicinity or interfere with their activities. 457 In the case of visual effects, theguidance directs the FAA to consider the appearance and other visual qualities of airport development projects,and encourage airport sponsors to consider visual qualities in a project’s preliminary design stage and toprovide this information in the <strong>FEIS</strong> to the extent that it is available.5.18.2 Significance ThresholdFAA Order 5050.4B defines a significant impact for light emissions as one where an action’s light emissionscreate annoyance to interfere with normal activities, and a significant impact for visual impacts as one whenconsultation with Federal, State, or local agencies, tribes, or the public shows the visual effects contrast withexisting environments and the effect is objectionable.455 40 CFR Part 61, Subpart M.456 29 CFR 1910.1001.457 FAA Order 1050.1E, Appendix A, paragraph 12.2a.Chapter 5 - Environmental Consequences 5-269 July 2011\\mawatr\ev\09228.00\reports\<strong>FEIS</strong>_Final_July_2011\<strong>PVD</strong>_CH05_Environmental_Cons_JUL_2011.doc
T.F. <strong>Green</strong> <strong>Airport</strong> <strong>Improvement</strong> <strong>Program</strong>Environmental Impact Statement and Final Section 4(f) Evaluation5.18.2.1 Finding: No Significant Light Emissions and Visual Environment ImpactsThere are no significant light or visual impacts since neither Alternative B2 nor Alternative B4 would result inlight emissions that would create annoyance that would interfere with normal activities in the surroundingareas, and visual impacts would be consistent with the existing visual environment. The visual impacts to theeligible airport historic district and contributing elements and historical properties are discussed in Section 5.8,Historic, Architectural, Archaeological, and Cultural Resources.5.18.3 MethodologyIn order to determine if lighting from any of proposed facilities would create an annoyance to the surroundingcommunity, Alternatives B2 and B4, and the corresponding components, were analyzed based on the sourcesand locations of additional or modified lighting, in relation to the baseline ambient light (see Figure 4-37 forlocations of existing lighting). The location of proposed lighting from new on-<strong>Airport</strong> facilities, roadways, andrunway approach lighting systems in relation to surrounding neighborhoods was assessed for potential impactsto surrounding neighborhoods.According to the Environmental Desk Reference for <strong>Airport</strong> Actions, “visual or aesthetic effects are inherently moredifficult to define and assess because they involve subjectivity. Visual effects deal broadly with the extent towhich airport development contrasts with the existing environment, architecture, historical or cultural setting,or land use planning.” The visual impact analysis includes a qualitative assessment of impacts to views fromsurrounding residential neighborhoods as a result of property acquisitions and roadway changes.5.18.4 Impact AssessmentThis section addresses light emissions impacts for Alternatives B2 and B4, and the No-Action Alternative.5.18.4.1 No-Action AlternativeA variety of lighting systems are required by the FAA at airports that operate in all weather conditions. Theselighting systems are designed to permit aircraft to operate safely, both day and night.Light EmissionsAirfield and landside lighting systems at T.F. <strong>Green</strong> <strong>Airport</strong> include: rotating beacon, taxiway edge andcenterline lights, runway edge and centerline lights, runway threshold lights, runway end identifier lights(REIL), runway approach light systems, lighted runway and taxiway signs, obstruction lights, terminal buildinglighting, and parking lot and access road lighting.Under the No-Action Alternative, Taxiway M was equipped with appropriate edge and centerline lights as wellas required lighted signage. The AMF did not require any additional lighting other than typical buildingmountedlighting. Because the additional airfield and runway lighting was located on the inner portions of theairfield, away from view of any surrounding community, and the minimal amount of additional lighting for thetaxiway and the AMF, it was not anticipated that these enhancements would cause annoyance or interfere withnormal activities in the surrounding community.Chapter 5 - Environmental Consequences 5-270 July 2011\\mawatr\ev\09228.00\reports\<strong>FEIS</strong>_Final_July_2011\<strong>PVD</strong>_CH05_Environmental_Cons_JUL_2011.doc
T.F. <strong>Green</strong> <strong>Airport</strong> <strong>Improvement</strong> <strong>Program</strong>Environmental Impact Statement and Final Section 4(f) EvaluationVisual ImpactsThe activities proposed under the No-Action Alternative (including the Taxiway M lighting upgrade and theAMF) were not expected to change the visual environment at the <strong>Airport</strong> because they were constructed inareas currently occupied by airport facilities and were not substantially different from what exists today.However, the Current Part 150 VLAP could result in additional properties being acquired and demolished,thereby changing the visual environment in these areas.5.18.4.2 Alternative B2The following section describes lighting and visual impacts associated with on- and off-<strong>Airport</strong> components forAlternative B2.Light EmissionsConsideration is given to light emissions associated with on-<strong>Airport</strong> elements and off-<strong>Airport</strong> roadways.On-<strong>Airport</strong> <strong>Program</strong> ComponentsThe expanded passenger terminal and adjacent facilities would include additional lighting for the concourseexpansion and associated apron. It is anticipated that the additional lighting would not adversely impact thesurrounding community. The existing terminal concourse facility would continue to block general and tasklighting on the airside from the residents and businesses to the northwest, and the proposed South Service Areawould block the lighting from the residents and businesses to the south.The South Service Area would be located near an existing GSE maintenance and belly cargo facility with similarfunctions and, therefore the lighting associated with the program enhancements would not be perceived by thesurrounding community as a significant change or increase. Also, a new parking garage located between thesefacilities and the nearest residential area would shield residents from the associated light emissions.Both the new structured parking garage and the expanded surface parking lot would be located in areas alreadyused for vehicle parking. By locating the access to the parking garage facing <strong>Airport</strong>-owned land and having asolid wall or screening facing the adjacent neighborhood, it is not anticipated that additional light emissionsfrom new or expanded parking facilities would cause annoyance or interfere with normal activities.Additional light poles associated with the expansion and modification of the <strong>Airport</strong> roadway system are notexpected to cause an annoyance or interfere with normal activities because the areas currently have ambientlighting from either the existing roadways or adjacent facilities along the roadways. All new lighting fixtureswould use downcast hoods that avoid light propagation to neighboring areas.The Integrated Cargo Facility light emissions are not expected to cause significant annoyance or interfere withnormal activities. The new lighting would be similar to the cargo facility lighting at this location under theNo-Action Alternative. The facility is located on <strong>Airport</strong> property and is not near residential areas. Standardlighting of the building and employee lot would be used to enhance security of the area.Because these program components would be located on-<strong>Airport</strong> and are typical of airport-related uses, theywould not contribute to a noticeable increase in light impacts to the surrounding community.Chapter 5 - Environmental Consequences 5-271 July 2011\\mawatr\ev\09228.00\reports\<strong>FEIS</strong>_Final_July_2011\<strong>PVD</strong>_CH05_Environmental_Cons_JUL_2011.doc
T.F. <strong>Green</strong> <strong>Airport</strong> <strong>Improvement</strong> <strong>Program</strong>Environmental Impact Statement and Final Section 4(f) EvaluationRunway Lighting and Navigational AidsThe Runway 16-34 safety enhancements are not expected to result in adverse lighting impacts to thecommunity. The Runway 16 End currently does not have approach lighting and would not have approachlighting in the future, so new lighting for a shift of the runway north 400 feet would be needed for runwaycenterline and edge lights (Figure 5-50, Table 5-129). The Runway 34 End and its lights would be shifted 400 feetfarther away from the surrounding community.Table 5-129No-Action Alternative and Alternatives B2 and B4: Distances and Heights of ApproachLighting (feet)No-Action Alternative B2 Alternative B4Lighting at Runway Ends 5 23 34 5 23 34 5 23 34 1Distance from NearestResidences 720 360 360 400 360 760 400 360 360Height (AGL) 47 59 36 59 54 71 52 59 36Source: Jacobs Engineering Group, Inc.AGL Above ground level.Note: Runway 16 End currently does not have approach lighting.1 Because the Runway 34 is shifted farther north under Alternative B4, the FAA Technical Operations (TechOps) has determined that one approach light on theRunway 34 End may need to be higher than currently exists. The exact height will be determined when the design for the project is more advanced.Alternative B2 would move the approach lighting at the Runway 5 End 320 feet closer to the <strong>Green</strong>woodneighborhood than under the No-Action Alternative (Figure 5-50, Table 5-129). The proposed approach lightingwould be located well within the boundaries of the <strong>Airport</strong> and the RPZ. RIAC would purchase parcels withinthe RPZ through the VLAP. Therefore, there would be a buffer of at least 400 feet between the nearestresidences and the outermost approach light. Even without full participation in the VLAP for the RPZ, therewould be a required easement, providing a buffer of at least 200 feet on either side of the approach lightingcenterline as well as a 200-foot buffer from the end of approach lighting. 458At the Runway 23 End, the RPZ would provide an additional buffer, resulting in no change in distance from theoutermost approach light to the adjacent residential area when compared to the No-Action Alternative. 459 Thiswould result in the closest residences being 360 feet from the outermost approach light, the same distance as theNo-Action Alternative.Off-<strong>Airport</strong> RoadwaysRoadway lighting for the Partially Relocated <strong>Airport</strong> Road and Fully Relocated <strong>Airport</strong> Road will be designedfor the Preferred Alternative. These roads will be designed following Rhode Island Department ofTransportation and City of Warwick lighting requirements, as appropriate, and the lighting would be typical ofcommunity conditions.458 FAA Order 6850.2, Visual Guidance Lighting Systems, page 8, establishes a minimum buffer of 200 feet on either side of the approach lighting center lineand 200 feet from the end of the approach lighting. An easement of 2,600 feet in length and 400 feet in width from the end of the runway is required for anapproach lighting system.459 For the purposes of the analysis 100 percent participation in the voluntary acquisition of the RPZ is assumed.Chapter 5 - Environmental Consequences 5-272 July 2011\\mawatr\ev\09228.00\reports\<strong>FEIS</strong>_Final_July_2011\<strong>PVD</strong>_CH05_Environmental_Cons_JUL_2011.doc
T.F. <strong>Green</strong> <strong>Airport</strong> <strong>Improvement</strong> <strong>Program</strong>Environmental Impact Statement and Final Section 4(f) EvaluationVisual ImpactsUnder Alternative B2, new on-<strong>Airport</strong> program elements including relocated taxiways, expanded passengerterminal, new ground support, belly cargo, and fuel farm facilities, expanded automobile parking facilities, andreconfigured terminal access roadways, are not expected to have an impact on the visual environment. Theseelements will not look substantially different from what exists today at T.F. <strong>Green</strong> <strong>Airport</strong> in terms of theirarchitecture, location, and use.The visual setting of the eligible airport historic district would be changed. Hangar No. 1, a contributingelement to the eligible historic district, would be demolished under Alternative B2 to enhance safety. Anychanges in the visual context or setting of these historical properties would result in an Adverse Effect underSection 106 of the National Historic Preservation Act, and in a use under Section 4(f) of the U.S. Department ofTransportation Act. 460 These visual effects would be addressed and mitigated as part of the Section 106 andSection 4(f) processes (see Chapter 6, Mitigation).Runway 5-23 would be extended both north and south, resulting in visual changes at both ends of the runway.Residences north of the <strong>Airport</strong> and south of the <strong>Airport</strong> would be eligible for acquisition as a result ofsignificant noise impacts or from their location in the RPZ. Residences that remain in those neighborhoodswould have different views.Visual changes would also occur at the Runway 16 End, particularly at the intersection of Post Road and<strong>Airport</strong> Road. A substantial number of commercial properties in this area would be acquired and demolished toaccommodate the safety areas surrounding the Runway 16 End (RSA, ROFA, and RPZ), changing the visualcontext in this area.Significant Impacts: Alternative B2 would not result in significant lighting impacts since the project-relatedlighting elements would not create annoyance that would interfere with normal activities in the surroundingareas, and visual impacts would be consistent with the existing visual environment.5.18.4.3 Alternative B4The following section describes lighting impacts and visual impacts associated with on- and off-airportcomponents for Alternative B4.Light EmissionsConsideration is given to on-light emissions associated with <strong>Airport</strong> elements and off-<strong>Airport</strong> roadways.On-<strong>Airport</strong> <strong>Program</strong> ComponentsThe expanded passenger terminal, South Service Area, expanded parking facilities, and terminal accessroadways are the same for Alternative B4 as for Alternative B2 and have been described in the previous section.Under Alternative B4, the split Integrated Cargo Facility lighting would be similar to the cargo facility lightingat this location under the No-Action Alternative. The facility is located on <strong>Airport</strong> property and is not near460 U.S. Department of Transportation Act of 1966, Section 4(f), 49 USC, section 303(c).Chapter 5 - Environmental Consequences 5-273 July 2011\\mawatr\ev\09228.00\reports\<strong>FEIS</strong>_Final_July_2011\<strong>PVD</strong>_CH05_Environmental_Cons_JUL_2011.doc
T.F. <strong>Green</strong> <strong>Airport</strong> <strong>Improvement</strong> <strong>Program</strong>Environmental Impact Statement and Final Section 4(f) Evaluationresidential areas. Standard lighting of the building and employee lot would be used to enhance security of thearea. The Integrated Cargo Facility light emissions are not expected to cause significant annoyance or interferewith normal activities.Runway Lighting and Navigational AidsRunway 16-34 would shift approximately 100 feet to the north; however, the approach lighting system wouldremain in its current location at the Runway 34 End. The approach lighting at the Runway 34 End would belocated 360 feet from the nearest residences, which is the same distance as under the No-Action Alternative(Table 5-129). Appropriate taxiway edge and centerline lights as well as any required lighted signage would belocated along the taxiway and apron. The Runway 16 End currently does not have approach lighting, but a shiftof the runway 100 feet north would be needed for the runway centerline, Precision Approach Path Indicator(PAPI) lights, and edge lights.The light emissions impacts associated with Runway 5-23 under Alternative B4 include shifting the approachlighting at the Runway 5 End approximately 1,500 feet south. The Runway 5 End approach lighting would berelocated on land currently owned by RIAC. The RPZ would provide a 400-foot buffer between the outermostapproach light to the nearest residences in the <strong>Green</strong>wood neighborhood (320 feet closer than the No-ActionAlternative). RIAC would also acquire an easement of at least 200 feet on either side of the approach lightingcenterline as well as a 200-foot buffer from the end of approach lights. The Runway 23 End would not shiftunder Alternative B4, so there would be no change in approach lighting when compared to the No-ActionAlternative (Table 5-129).Off-<strong>Airport</strong> RoadwaysRoadway lighting for the Partially Relocated <strong>Airport</strong> Road and Realigned Main Avenue will be designed for thePreferred Alternative. These roads will be designed following Rhode Island Department of Transportation andCity of Warwick lighting requirements, as appropriate, and their lighting would be typical of communityconditions.Visual ImpactsUnder Alternative B4, the visual setting of the eligible airport historic district would be changed. Hangar No. 1,a contributing element to the District, would be demolished to enhance safety. Any changes in the visualcontext or setting of these historical properties would result in an Adverse Effect under Section 106 of theNational Historic Preservation Act, 461 and in a use under Section 4(f) of the U.S. Department of Transportation Act. 462These visual effects would be addressed and mitigated as part of the Section 106 and Section 4(f) processes (seeChapter 6, Mitigation).Under Alternative B4, there would be moderate visual changes at the extended Runway 5 End and along thenew alignment of Main Avenue. A number of residences along Main Avenue and at the Runway 5 End wouldbe acquired for construction, or would be eligible for acquisition (either as a result of noise mitigation orbecause of their location in the RPZ). Residences that remained in that area would have unobstructed views ofthe <strong>Airport</strong>. There would be some visual change at the Runway 16 End, resulting from Partially Relocated461 Section 106 of the National Historic Preservation Act of 1966, 36 CFR 800.16(l).462 U.S. Department of Transportation Act of 1966, Section 4(f), 49 USC, section 303(c).Chapter 5 - Environmental Consequences 5-274 July 2011\\mawatr\ev\09228.00\reports\<strong>FEIS</strong>_Final_July_2011\<strong>PVD</strong>_CH05_Environmental_Cons_JUL_2011.doc
T.F. <strong>Green</strong> <strong>Airport</strong> <strong>Improvement</strong> <strong>Program</strong>Environmental Impact Statement and Final Section 4(f) Evaluation<strong>Airport</strong> Road, but to a lesser extent than under Alternative B2. There would be no visual changes at theRunway 23 or 34 Ends.Significant Impacts: Alternative B4 would not result in significant lighting impacts since the project-relatedlighting elements would not create annoyance that would interfere with normal activities in the surroundingareas, and visual impacts would be consistent with the existing visual environment.5.18.5 Short-term Impacts from Temporary Construction ActivitiesThere are no significant short-term construction impacts associated with Alternatives B2 and B4. Construction ofthe <strong>Improvement</strong> <strong>Program</strong> elements on-<strong>Airport</strong> would be in already developed areas in existing <strong>Airport</strong> uses.Lighting at night for roadway construction could potentially increase light emissions and cause annoyance tosurrounding residential neighborhoods. New roadway construction for Fully Relocated <strong>Airport</strong> Road underAlternative B2 and Realigned Main Avenue under Alternative B4 may be visually disruptive to surroundingresidential neighborhoods.5.18.6 Cumulative ImpactsConsideration is given to the light and visual impacts to the environment that have occurred over time.Light EmissionsLight emissions in the City of Warwick and from the T.F. <strong>Green</strong> <strong>Airport</strong> have increased gradually since the<strong>Airport</strong> was constructed. As the City has become an urbanized setting, the lighting in the area has increased,leading to an overall increase in ambient lighting in the community. T.F. <strong>Green</strong> <strong>Airport</strong>, established in 1931, hasadded to the ambient light emissions. The areas bordering the <strong>Airport</strong> include light emissions associated withcommercial development and public roadways, as well as from T.F. <strong>Green</strong> <strong>Airport</strong> itself. While Alternatives B2and B4 include some additional lighting for the Integrated Cargo Facility, new parking facilities, expandedpassenger terminal, and the South Service Area, the areas where these enhancements would be located alreadyhave lighting and are within an urbanized, developed setting. Lighting associated with Partially Relocated<strong>Airport</strong> Road and Realigned Main Avenue is not expected to add to the cumulative light emissions in the area.Under Alternative B2, Fully Relocated <strong>Airport</strong> Road would be located in a relatively undeveloped area nearadjacent farmland. Design of roadway lighting would need to ensure that lighting would not significantlyincrease light emissions in this area.In the case of the approach lighting, the proposed lighting would shift to a different location and would not addto the cumulative light emissions. Alternatives B2 and B4 would not substantially add to the cumulative lightemissions within the Project Area.Visual ImpactsThere are no cumulative impacts associated with the visual environment, since the <strong>Airport</strong> will continue to haveairport facilities and buildings consistent with existing uses. T.F. <strong>Green</strong> <strong>Airport</strong> and its surroundingenvironment are within an urbanized, developed setting. The <strong>Airport</strong> itself has had airport-related facilities andstructures for the past eighty years. The <strong>Improvement</strong> <strong>Program</strong> would not be inconsistent with the visualenvironment that currently exists in and around T.F. <strong>Green</strong> <strong>Airport</strong>.Chapter 5 - Environmental Consequences 5-275 July 2011\\mawatr\ev\09228.00\reports\<strong>FEIS</strong>_Final_July_2011\<strong>PVD</strong>_CH05_Environmental_Cons_JUL_2011.doc
T.F. <strong>Green</strong> <strong>Airport</strong> <strong>Improvement</strong> <strong>Program</strong>Environmental Impact Statement and Final Section 4(f) Evaluation5.18.7 Comparison of Alternatives B2 and B4Neither Alternative B2 nor B4 would result in significant light emission or visual impacts.Light EmissionsAlternatives B2 and B4 would not result in significant light emissions impacts to the surrounding communitynor would they interfere with normal activities. Alternatives B2 and B4 share common program elementsassociated with light emission impacts, including the expanded passenger terminal, the South Service Area,expanded automobile parking facilities, reconfigured terminal access roadways, and new Integrated CargoFacility. Because these program components would be located on-<strong>Airport</strong> and are typical of airport-related uses,they would not contribute to a noticeable increase in light impacts to the surrounding community. In addition,measures such as positioning a solid wall or providing screening for the proposed new garage adjacent toneighboring residences and using pole lighting with shoebox-style fixtures directing light downward onproposed roadways and the proposed surface parking lots would provide shielding to the surroundingcommunity. Shifting and relocating runway lighting and navigational aids of Runway 5-23 and Runway 16-34under Alternatives B2 and B4 would not result in noticeable light emission impacts.Visual ImpactsAlternatives B2 and B4 are not expected to result in significant changes to the visual environment surroundingT.F. <strong>Green</strong> <strong>Airport</strong>. The proposed airport development is intended to support functional, efficient, and safeairport operations while being sensitive to local, cultural, and architectural concerns. Most of the new buildingsand structures will be built in areas of the <strong>Airport</strong> that are already developed. The runway extensions androadway relocations or realignments have the potential to change the visual setting in certain areas surroundingthe <strong>Airport</strong> by creating new view corridors to the <strong>Airport</strong> or to new or relocated roadways. However, thesechanges are not expected to be significant.5.18.8 Avoidance and MinimizationAlternatives B2 and B4 would not result in significant light emissions impacts or interfere with normal activities. Whileno significant impacts would occur and no mitigation is required, BMPs are proposed to further reduce impacts fromlight emissions for Alternatives B2 and B4. Best management practices include designing parking lot and roadwaylighting with shoebox-style fixtures and downcast hoods, which project light down onto parking and roadways ratherthan up and out to the surrounding community. Lighting for the new parking garage would be shielded from theadjacent neighborhood through use of shoe-box style lighting fixtures and landscape screening.5.19 Energy Supply, Natural Resources, and Sustainable DesignThis section evaluates the effects of airport projects on energy supply and natural resources that are related tothe amount of energy required for stationary facilities, such as terminal buildings and airfield lighting, and formobile uses, such as aircraft, aircraft, GSE, and motor vehicles. Sustainable design is also considered theprimary approach to minimizing or mitigating the effects of increased energy and natural resourcesconsumption associated with airport developments. 463463 Environmental Desk Reference for <strong>Airport</strong> Actions, FAA, October 5, 2007.Chapter 5 - Environmental Consequences 5-276 July 2011\\mawatr\ev\09228.00\reports\<strong>FEIS</strong>_Final_July_2011\<strong>PVD</strong>_CH05_Environmental_Cons_JUL_2011.doc
T.F. <strong>Green</strong> <strong>Airport</strong> <strong>Improvement</strong> <strong>Program</strong>Environmental Impact Statement and Final Section 4(f) Evaluation5.19.1 Regulatory ContextExecutive Order 13123, <strong>Green</strong>ing the Government Through Efficient Energy Management, 464 encourages each federalagency to expand the use of renewable energy in its facilities and for its actions. It is also the policy of the FAA,consistent with NEPA and the CEQ regulations, to encourage the development of facilities that exemplify thehighest standards of design including principles of sustainability.5.19.2 Significance ThresholdsAs presented in Table 5-6, FAA Order 5050.4B, Table 7-1, defines a significant impact for natural resources andenergy supply as one where an action’s construction, operation, or maintenance would cause demands thatwould exceed available or future (project year) natural resource or energy supplies.5.19.2.1 Finding: No Significant Energy Supply, Natural Resources ImpactsAlternatives B2 and B4 would not have a significant impact on natural resources or energy supply since neitherAlternative would cause an excessive demand for available natural resources or energy supplies.5.19.3 MethodologyAs described in the Environmental Desk Reference for <strong>Airport</strong> Actions, factors which were considered in thisanalysis include, “consumable natural resources necessary for construction are rare; the action would cause asubstantial demand on available energy or natural resource supplies; when compared to no action conditions,changes in aircraft movements or ground vehicle use would cause a statistically significant increase in fuelconsumption; or the action would not be consistent with smart growth requirements of the agency havingjurisdiction over the area where the airport is located.” 465Consideration is given to the proposed major changes in stationary and mobile facilities as a result of theT.F. <strong>Green</strong> <strong>Airport</strong> <strong>Improvement</strong> <strong>Program</strong> to determine what type of effect they would have on local energysupplies; construction activities and their effect on natural resource and fuel consumption; and elements ofsustainable and energy efficient design which may reduce the <strong>Airport</strong>’s total future potential impact on energysupply and natural resources.Future energy consumption was projected for the No-Action and Alternatives B2 and B4 for the categories ofStationary Facilities, Aircraft, GSE, Ground Service Vehicles (GSV) and Generators, and is displayed inTable 5-130. This analysis used baseline 2004 aircraft operations, terminal square footage, and energy use forthese major energy categories. In comparing these known quantities, a ratio was calculated for each energycategory, such as watts per square foot for the stationary facilities or gallons per aircraft operation. Thesebaseline ratios were applied to aircraft operations forecasts and the projected square footage of the terminal forAlternatives B2 and B4, and the No-Action Alternative in order to ascertain anticipated energy use estimates ineach category. The estimates conservatively assume that the future terminal building is equally as efficient orinefficient as the current terminal and that future aircraft and future GSE vehicles are equally as efficient orinefficient as the current fleet. With advancements in building, aircraft, and GSE technology in the past 10 yearsand beyond, these estimations represent a worst case scenario.464 64 FR 30851; June 8, 1999465 Environmental Desk Reference for <strong>Airport</strong> Actions, FAA, October 5, 2007.Chapter 5 - Environmental Consequences 5-277 July 2011\\mawatr\ev\09228.00\reports\<strong>FEIS</strong>_Final_July_2011\<strong>PVD</strong>_CH05_Environmental_Cons_JUL_2011.doc
T.F. <strong>Green</strong> <strong>Airport</strong> <strong>Improvement</strong> <strong>Program</strong>Environmental Impact Statement and Final Section 4(f) EvaluationFor the purposes of this analysis, certain assumptions were made pertaining to direct and indirect impacts. Forthe T.F. <strong>Green</strong> <strong>Airport</strong> <strong>Improvement</strong> <strong>Program</strong>, access time (the time it takes for motor vehicles to travel to andfrom the <strong>Airport</strong>) and on-airport traffic patterns are not expected to change substantially. In addition, theexpanded terminal building in Alternatives B2 and B4 is assumed to have similar energy requirements since thepassenger activity levels are the same for each alternative.5.19.4 Impact AssessmentThe operation of T.F. <strong>Green</strong> <strong>Airport</strong> requires energy in the form of electricity, natural gas, Jet A fuel, aviationgasoline, motor gasoline, and diesel. Estimates of future energy use for the No-Action and Alternatives B2and B4 are shown in Table 5-130. The impact on energy supply and natural resources are also discussed.5.19.4.1 No-Action AlternativeThe new facilities proposed under the No-Action Alternative are not expected to change energy supplies ornatural resources use.5.19.4.2 Alternatives B2 and B4Alternatives B2 and B4 are expected to have the same energy supply and natural resources impacts, except thatwith the extension of Runway 5-23 in 2015 for Alternative B4, additional jet and diesel fuel would be usedstarting in 2015 instead of 2020. This is attributable to additional aircraft operations, associated fuelrequirements of long-haul flights, higher passenger load factors, as well as additional passenger vehicle tripsaccessing the airport. However, these increased demands are not of such a magnitude as to adversely affectlocal or regional energy supplies.Energy UseThe following section outlines the anticipated energy use for the Alternatives B2 and B4 (refer to Table 5-130).Stationary FacilitiesElectricity is used to light and cool the terminal buildings, provide 400 Hz power to aircraft at the gates, lightthe airfield and power the NAVAIDS equipment. Natural gas is used to heat buildings in the winter. Futureestimates of energy use by stationary facilities are presented in Table 5-130. There would be an increase inenergy use for Alternatives B2 and B4 compared to the No-Action Alternative. The increase in electrical demandis due to a combination of an anticipated 720,000 square feet of parking garage, an additional 50,000 square feetof passenger terminal space, an additional 20,000 square feet of space for the Integrated Cargo Facility, andadditional airside electrical load due to new airfield lights, signs, and cable (a relatively small energy demand).It is assumed that this additional energy demand would be able to be met by the New England electrical gridand, therefore, would not result in an adverse impact on energy supplies.AircraftAircraft use of Jet A fuel and aviation gasoline at T.F. <strong>Green</strong> <strong>Airport</strong> is limited to landing, taxiing, idling, takeoff,and climbout. Fuel use by on-board APUs is also included in the estimated Jet A and aviation gasoline fuelconsumption shown in Table 5-130. Aircraft fuel use will not significantly increase on the ground becauseground movement times for aircraft do not increase substantially for Alternatives B2 and B4. In addition,taxiway and apron projects are expected to enhancements operational efficiency. However, a direct impact ofChapter 5 - Environmental Consequences 5-278 July 2011\\mawatr\ev\09228.00\reports\<strong>FEIS</strong>_Final_July_2011\<strong>PVD</strong>_CH05_Environmental_Cons_JUL_2011.doc
T.F. <strong>Green</strong> <strong>Airport</strong> <strong>Improvement</strong> <strong>Program</strong>Environmental Impact Statement and Final Section 4(f) EvaluationAlternatives B2 and B4 is the ability for T.F. <strong>Green</strong> <strong>Airport</strong> to handle longer haul flights. Aircraft fuelconsumption will increase due to the increased fuel requirements of long-haul flights. Flight times on approachor departure paths are not expected to change.Ground Service EquipmentFuture estimates of fuel consumption by GSE, GSV, and generators that use gasoline and diesel is shown inTable 5-130. Changes to the terminal and apron as part of the <strong>Improvement</strong> <strong>Program</strong> would not substantiallyincrease the number of on-<strong>Airport</strong> service vehicles or substantially alter the time needed for the existing servicefleet to arrive at gates. However, indirectly aircraft operations and load factors are projected to increase duringAlternatives B2 and B4, and No-Action Alternative, requiring more GSE or extended use of GSE vehicles whichwould cause an increase in fuel usage.Table 5-130 Future Estimated Annual Energy Consumption by Source Category and Alternative 12015 2020 2025Alternative Alternative Alternatives Alternatives B2Source No-Action B2 B4 No-Action B2 and B4 No-Action and B4Stationary FacilitiesElectricity 1 (kilowatts-hours per year) 15,537,300 15,537,300 15,537,300 15,537,300 33,398,100 15,537,300 33,398,100Natural Gas 2 (cubic feet per year) 17,055,000 17,055,000 17,055,000 17,055,000 20,931,100 17,055,000 20,931,100AircraftJet A (gallons) 3 36,205,500 36,205,500 57,064,100 38,766,300 59,337,400 41,182,900 61,639,700Av Gas (gallons) 126,700 126,700 138,600 135,700 146,600 144,200 155,000GSE/GSV/GeneratorsGasoline (gallons) 47,900 47,900 52,400 51,300 55,400 54,500 58,500Diesel (gallons) 99,700 99,700 109,100 106,800 115,300 113,500 121,900Note: A public access compressed natural gas station (CNG) opened in 2006. Average annual gallons dispensed are approximately 57,500 gallons which is not expectedto change as a result of the proposed airport enhancements.1 Future year electricity based on the following data: parking garage – 720,000 sq ft @ 1.5w/sq ft = 1080KW, Terminal expansion – 50,000 sq ft @ 12w sq ft = 600KW,Cargo building – 20,000 sq ft @ 1.5w/sq ft= 30KW and 10kw for additional airside electricity load for new lights, signs, and cable, multiplied by 24 hours, multiplied by365 days to be expressed in kWh/Yr. If the Runway 5-23 extension for Alternatives B2 or B4 would require additional gates, electricity consumption could go up to33,758,100 kWh/Yr by 2020.2 Future year usage of natural gas based on estimated energy needs for the terminal expansion. Natural gas usage is extremely variable and dependent on weather conditions.3 Future year fuel usage based on aircraft operations from the EIS Forecast which assumes additional long-haul flights. This assumes the average short-hauloperation is 600 nm, the average long-haul operation is 2,700 nm.Motor VehiclesMotor vehicle fuel consumption includes fuel use by motor vehicles on airport roadways, in parking facilities, andidling at terminal curbsides. The <strong>Improvement</strong> <strong>Program</strong> will not increase access time (the time it takes for motorvehicles to travel to and from the <strong>Airport</strong>) because on-<strong>Airport</strong> traffic patterns are not expected to change substantially.Fuel consumption by individual motor vehicles associated with accessing the <strong>Airport</strong> will not change substantially.Indirectly related to these enhancements, the quantity of passengers is projected to increase in Alternatives B2 and B4,and the No-Action Alternative, which would increase the overall quantity of vehicles, thereby increasing overall motorvehicle fuel consumption. This estimated increase would not adversely affect regional supplies of motor vehicle fuel inNew England. Roadway changes in the City of Warwick under Alternatives B2 and B4 are not expected to causechanges in fuel consumption when compared to the No-Action Alternative.Chapter 5 - Environmental Consequences 5-279 July 2011\\mawatr\ev\09228.00\reports\<strong>FEIS</strong>_Final_July_2011\<strong>PVD</strong>_CH05_Environmental_Cons_JUL_2011.doc
T.F. <strong>Green</strong> <strong>Airport</strong> <strong>Improvement</strong> <strong>Program</strong>Environmental Impact Statement and Final Section 4(f) EvaluationNatural ResourcesNon-energy related natural resources include consumable construction materials such as wood, asphalt, metals,and concrete, in addition to potable water. The construction of the various project elements proposed underAlternatives B2 and B4 would require only these common construction materials. These materials are availableregionally, and are not considered to be unusual or in short supply. The type of construction necessary for eachelement of the <strong>Improvement</strong> <strong>Program</strong> would not be exceptional in nature for the local or regional construction andmaterials markets. There will be an increase in potable water consumption in Alternatives B2 and B4, and the No-Action Alternative, primarily due to projected increases in passengers and filling potable water tanks on a largernumber of aircraft. This water consumption is not expected to adversely affect local or regional supplies.5.19.4.3 Sustainable Design and Future TechnologiesFAA Order 1050.1E notes that, “all elements of the transportation system should be designed with a view totheir aesthetic impact, conservation of resources such as energy, pollution prevention, harmonization with thecommunity environment, and sensitivity to the concerns of the traveling public.” The State of Rhode Island hasalso demonstrated a commitment to sustainability. With some exceptions, any new, substantially expanded, orrenovated building owned by the State of Rhode Island must meet the design, construction, operation, andmaintenance standards of the U.S. <strong>Green</strong> Building Council (USGBC) Leadership in Energy and EnvironmentalDesign (LEED) Silver certification. 466Significant Impacts: Alternatives B2 and B4 would not have a significant impact on natural resources or energysupply since neither program would result in construction, operation or maintenance activities that wouldcause demands that would exceed available natural resources or energy supplies. Adequate energy supplies areavailable to support the T.F. <strong>Green</strong> <strong>Airport</strong> <strong>Improvement</strong> <strong>Program</strong>.5.19.5 Short-Term Impacts from Temporary Construction ActivitiesAlternative B2 and B4 and not anticipated to have any short-term impacts associated with energy use or naturalresource consumption. There are sufficient building materials in Rhode Island to supply the materials needs forAlternatives B2 and B4 without exceeding available natural resources.5.19.6 Cumulative ImpactsThe incremental impact of the T.F. <strong>Green</strong> <strong>Airport</strong> <strong>Improvement</strong> <strong>Program</strong> on energy supplies in New England isnot anticipated to have an effect on the energy infrastructure of Rhode Island or New England. The anticipated2013/2014 generating capacity of the New England electrical grid is 289,456,680 megawatt-hours per year(MWh/Yr). 467 The increase in electrical demand from the <strong>Improvement</strong> <strong>Program</strong> as shown in Table 5-130, is17,860,800 kilowatt-hours per year (kWh/Yr) through Alternatives B2 and B4 in 2025. This represents0.0062 percent of the 2013/2014 annual generating capacity of the New England electrical grid, which is notlarge enough to adversely affect the New England electrical grid.Unlike electricity, natural gas, Jet A, aviation gasoline, gasoline and diesel fuel do not depend on regionalproduction, and are largely imported from other regions of the U.S. and other countries. Supplies of these forms466 Energy Efficiency and Renewable Energy: State Activities and Partnerships: Rhode Island. U.S. Department of Energy.apps1.eere.energy.gov/states/energy_summary.cfm/state=RI.467 ISO New England Installed Capacity Requirement Report for the 2011/2012 Capability Year. December 1, 2008.www.iso-ne.com/genrtion_resrcs/reports/nepool_oc_review/index.html.Chapter 5 - Environmental Consequences 5-280 July 2011\\mawatr\ev\09228.00\reports\<strong>FEIS</strong>_Final_July_2011\<strong>PVD</strong>_CH05_Environmental_Cons_JUL_2011.doc
T.F. <strong>Green</strong> <strong>Airport</strong> <strong>Improvement</strong> <strong>Program</strong>Environmental Impact Statement and Final Section 4(f) Evaluationof energy are more flexible and shipments vary based on demand. Shipment of these energy sources isanticipated to be able to absorb these incremental increases.5.19.7 Comparison of Alternatives B2 and B4Table 5-130 compares the energy use for Alternatives B2 and B4. For Alternatives B2 and B4, there will be nosignificant impacts resulting from construction operations or maintenance which would cause demands toexceed available or future natural resource or energy supplies. Adequate energy supplies are available tosupport the T.F. <strong>Green</strong> <strong>Airport</strong> <strong>Improvement</strong> <strong>Program</strong>.5.19.8 Avoidance and MinimizationIt is not possible to avoid using energy and natural resources as part of Alternatives B2 and B4. However,neither Alternative B2 nor B4 would lead to an adverse impact on energy supplies or natural resources. Anynew facilities would be required to have LEED Silver certification as mandated by the State of Rhode Island forall new construction and renovation of public buildings. LEED is an internationally recognized green buildingrating and certification system, and the most common nationally accepted benchmark for the design,construction, and operation of high-performance buildings. This system provides third-party verification that abuilding or community was designed and built using strategies aimed at improving performance across thefollowing metrics: energy savings, water efficiency, CO 2emissions reduction, improved indoor environmentalquality, and stewardship of resources and sensitivity to their impacts. LEED Silver is the second highest greenbuilding certification level in the rating system. <strong>Green</strong> buildings have been shown to reduce energy use byabout 24-50 percent, reduce CO 2emissions by about 33-39 percent, reduce water use up to 40 percent, andreduce solid waste generation up to 70 percent when compared to less efficient traditional building designs. Useof the LEED green building rating system at the Silver level will be an effective minimization strategy forreducing the energy and natural resource impacts of new construction of the T.F. <strong>Green</strong> <strong>Airport</strong> <strong>Improvement</strong><strong>Program</strong>.5.20 Environmental Consequences SummaryCEQ regulations 468 state that an EIS must “…present the environmental impacts of the proposal and thealternatives in comparative form, thus sharply defining the issues and providing a clear basis for choice amongoptions by the decision maker and the public.” Table 5-131 compares the significant environmental impacts ofAlternatives B2 and B4, in accordance with NEPA and based on FAA guidance for significant adverse effectsprovided in FAA Order 1050.1E. Table 5-132 compares the impacts to other environmental resources evaluatedin the impact analyses. The analysis shows that it is possible to mitigate for significant impacts as well as tomitigate for other impacts for regulatory compliance as described in Chapter 6, Mitigation.The FAA has identified Alternative B4 as the Preferred Alternative based on the impacts described in thischapter. No final FAA decision on the Preferred Alternative and associated mitigation has been or will be madeuntil the issuance of the agency’s Record of Decision (ROD).468 40 CFR section 1502.14Chapter 5 - Environmental Consequences 5-281 July 2011\\mawatr\ev\09228.00\reports\<strong>FEIS</strong>_Final_July_2011\<strong>PVD</strong>_CH05_Environmental_Cons_JUL_2011.doc
T.F. <strong>Green</strong> <strong>Airport</strong> <strong>Improvement</strong> <strong>Program</strong>Environmental Impact Statement and Final Section 4(f) EvaluationTable 5-131Significant Impacts: Summary Comparison of the Significant Impacts of Alternatives B2 andB4 Prior to MitigationPhasingNoiseAlternative B2Net Change from No-Action Alternative2015 2020All SafetyEnhancementElements 1All EfficiencyEnhancementElements 2Alternative B4Net Change from No-Action Alternative2015 2020All Safety EnhancementElements andRunway 5-23 Extension 3Remaining EfficiencyEnhancementElements 4Residences and population 0 residential units, 74 residential units, 184 residential units, 174 residential units,significantly impacted by noise 0 people 5 174 people 5 432 people 5 409 people 5(increase of at least 1.5 dB at orabove DNL 65 dB)Non-residential noise-sensitive None None Jehovah's Witnesses of Jehovah's Witnesses ofland use Warwick, Baha’i Faith 6 Warwick, Baha’i Faith 6Compatible Land UseIncompatible land use 0 residential parcels 71 residential parcels 180 residential parcels 169 residential parcels(residential) significantly totaling 0 acres totaling 11.5 acres totaling 32 acres totaling 30 acresimpacted by noise (increase ofat least 1.5 dB at or aboveDNL 65 dB)Historical, Architectural,Archaeological, and CulturalResourcesNoise-sensitive historical None None None Noneresources exposed to noise> DNL 65 dBEligible <strong>Airport</strong> Historic District — Alter historical Alter historical —configuration of airfield configuration of airfieldand remove Hangar and remove HangarNo. 1; Change in views to No. 1; Change in viewseligible airport historic to eligible airport historicdistrict.district.Hangar No. 1 — Demolish for safety. Demolish for safety —Hangar No. 2 — Interior modifications. Interior modifications; no —Reduction in views. adverse effect.Rhode Island State <strong>Airport</strong> — Reduction in views Reduction in views, direct —Terminalimpact to landscapingHistorical Cemeteries 7 — WHC 26 WHC 26 —Chapter 5 - Environmental Consequences 5-282 July 2011\\mawatr\ev\09228.00\reports\<strong>FEIS</strong>_Final_July_2011\<strong>PVD</strong>_CH05_Environmental_Cons_JUL_2011.doc
T.F. <strong>Green</strong> <strong>Airport</strong> <strong>Improvement</strong> <strong>Program</strong>Environmental Impact Statement and Final Section 4(f) EvaluationTable 5-131Significant Impacts: Summary Comparison of the Significant Impacts of Alternatives B2 andB4 Prior to Mitigation (continued)PhasingAlternative B2Net Change from No-Action Alternative2015 2020All SafetyEnhancementElements 1All EfficiencyEnhancementElements 2Alternative B4Net Change from No-Action Alternative2015 2020All Safety EnhancementElements andRunway 5-23 Extension 3Remaining EfficiencyEnhancementElements 4Section 4(f)/Section 6(f) Resources 8Noise-sensitive historical None None None Noneresources exposed to noise> DNL 65 dB or recreationalresources exposed to noise> DNL 75 dBEligible <strong>Airport</strong> Historic District — Alter historical Alter historical configuration —configuration of airfield of airfield and removeand remove Hangar Hangar No. 1No. 1; Change in viewsto eligible airport historicdistrict.Hangar No. 1 — Demolish for safety Demolish for safety —Hangar No. 2 — Interior modifications. Interior modifications; no —Change in setting and adverse effectaccessRhode Island State <strong>Airport</strong> — Reduction in views Elimination of public view, —Terminaldirect impact to landscapingWinslow Park 8 — Remove park facilities Remove park facilities —within RPZwithin RPZWetlands and Waterways 2.5 acres, 510 linear feet 3.3 acres, 263 linear feet 5.0 acres, 843 linear feet —Floodplains — 0.5 acres, 233 cubic yards 2.3 acres,726 cubic yards —Note: No significant impacts for the other environmental impact categories: Social and Economic, and Environmental Justice; Surface Transportation; Air Quality; WaterQuality; Fish, Wildlife, and Plants; Federal Threatened and Endangered Species; Coastal Resources; Farmlands; Hazardous Materials and Solid Waste; LightEmissions and Visual Environment; and Natural Resources and Energy Supply.See Table 5-132 for other environmental consequences as identified by the additional impact analyses.1 Elements expected to be completed by the end of 2015 include: Runway 16-34 safety areas; taxiways and aprons; navigational aids and lighting; Runway 16-34Perimeter Road; drainage and utilities; mandatory land acquisition for construction; Delivery Drive relocation; Partially Relocated <strong>Airport</strong> Road, including drainageand utilities and necessary land acquisition; and Hangar No. 1 demolition.2 Elements expected to be completed by 2020 include: Runway 5-23 extension and safety areas; taxiways and aprons; navigational aids and lighting; Runway 5-23Perimeter Road; drainage and utilities; necessary land acquisition; Fully Relocated <strong>Airport</strong> Road, including drainage and utilities and necessary land acquisition;Runway 5-23 and 16-34 reconstruction/repaving; expanded passenger terminal and gates; new GSE facility; new belly cargo facility; new fuel farm; newIntegrated Cargo Facility; expanded auto parking facilities; and reconfigured terminal access roadways.3 Elements expected to be completed by the end of 2015 include: Runway 16-34 safety areas; taxiways and aprons; navigational aids and lighting; Runway 16-34Perimeter Road; drainage and utilities; mandatory land acquisition for construction; Delivery Drive relocation; Partially Relocated <strong>Airport</strong> Road, including drainageand utilities, and mandatory land acquisition for construction; and Hangar No. 1 demolition.4 Elements expected to be completed by the end of 2015 include: Runway 5-23 extension and safety areas; taxiways and aprons; navigational aids and lighting;Runway 5-23 Perimeter Road, including drainage and utilities, and mandatory land acquisition for construction; and Realigned Main Avenue, including drainageand utilities, and mandatory land acquisition for construction.5 Refer to Section 5.3.2.1, Finding: Significant Noise Impacts for an explanation of the differences in noise impacts between Alternative B2 and B4. May includehomes that have already been sound insulated as part of a previous sound insulation effort under the Part 150 NCP.6 Baha’i Faith and John Wickes School have been sound insulated as part of a previous sound insulation effort under the Part 150 NCP.7 Alternatives B2 and B4 both would encroach on WHC 26 (located at the Runway 5 End) resulting in a significant impact to this resource. The boundaries of thisresource have been confirmed through field verification.8 Section 6(f) resources are within Winslow Park.Chapter 5 - Environmental Consequences 5-283 July 2011\\mawatr\ev\09228.00\reports\<strong>FEIS</strong>_Final_July_2011\<strong>PVD</strong>_CH05_Environmental_Cons_JUL_2011.doc
T.F. <strong>Green</strong> <strong>Airport</strong> <strong>Improvement</strong> <strong>Program</strong>Environmental Impact Statement and Final Section 4(f) EvaluationTable 5-132Other Environmental Consequences: Summary Comparison of the Other EnvironmentalConsequences of Alternatives B2 and B4 Prior to MitigationConstruction PhasingNoisePopulation and residenti al units exposed to noise levels at orabove DNL 70 dBPopulation exposed to noise l evels between DNL 65 and 69 dB 1Alternative B2Alternative B4Net Change from No-Action Alternative Net Change from No-Action Alternative2015 2020 2015 2020All SafetyEnhancement RemainingAll SafetyAll Efficiency Elements and EfficiencyEnhancement Enhancement Runway 5-23 EnhancementElementsElementsExtensionElements0 people,0 residenti al units7 people,3 residenti al units35 people,15 residenti al units-17 people,-40 residenti al units5 people,2 residenti al units261 people,109 residenti al units47 people,20 residenti al units160 people,68 residenti al unitsTraffi c noise analysi s – housing units exposed to traffic noise 8 residenti al units 102 residenti al units 0 residenti al units 0 residenti al unitsCompatible Land UseMandatory land acquisition for construction 7 residenti al parcels(1 unit),40 commerci al parcels(34 businesses)Voluntary land acquisition for noise mitigation (residential land useexposed to noise > 70 dB)58 residenti al parcels(66 units),3 commerci al parcels(4 businesses)— 41 resi dential parcels(36 units)Voluntary land acquisiti on for RPZ area cleari ng — 80 residenti al parcels(134 units)16 residenti al parcels(11 uni ts),23 commerci al parcels(12 busi nesses)2 residenti al parcels(2 units)64 residenti al parcels(60 units)—75 residenti al parcels(67 uni ts)Incompatible land use (residenti al) exposed to noise > 65 dB -1 parcel 25 parcels 93 parcels 53 parcelsIncompatible zoning (residenti al) exposed to noise > 65 dB 20 acres 12 acres 46 acres 37 acresSocial and Economic, Environmental Justice/Children’sHealth and Safety 2Economic – Aviation Activities and Business RelocationsTotal (direct and indirect) on-airport aviation gains to Ci tyTotal (direct and indirect) on-airport aviati on gains to StateCommercial Land Acquisition (businesses) for construction(mandatory)Total Direct Economic Impacts (“Most Threatened” JobDisplacements 3 ) due to Commerci al Land Acquisiti onsTotal (residential and commercial; mandatory and voluntary)annual loss in Ci ty property tax revenue0 jobs$0 income$0 busi ness revenue797 jobs,$24,908,000 income,$63,328,000 busi nessrevenue1,813 jobs,$53,104,000 income,$135,998,000busi ness revenue796 jobs,$24,936,000 income,$64,240,000 businessrevenue1,810 jobs,$53,089,000 income,$135,964,000busi ness revenue34 busi nesses 4 busi nesses 12 busi nesses —Included i n 202039 jobs,$1.5 milli on direct wages$5.7 milli on directbusi ness sales14 jobs,$529,000 direct wages,$1.8 milli on directbusi ness sales$536,075 $637,922 4 $156,929 $410,592 4—797 jobs,$24,908,000 income,$63,328,000 busi nessrevenue1,813 jobs,$53,104,000 income,$135,998,000busi ness revenue—Chapter 5 - Environmental Consequences 5-284 July 2011\\mawatr\ev\09228.00\reports\<strong>FEIS</strong>_Final_July_2011\<strong>PVD</strong>_CH05_Environmental_Cons_JUL_2011.doc
T.F. <strong>Green</strong> <strong>Airport</strong> <strong>Improvement</strong> <strong>Program</strong>Environmental Impact Statement and Final Section 4(f) EvaluationTable 5-132Other Environmental Consequences: Summary Comparison of the Other EnvironmentalConsequences of Alternatives B2 and B4 Prior to Mitigation (continued) Construction PhasingSocial –Residential RelocationsAlternative B2Alternative B4 Net Change from No-Action Alternative Net Change from No-Action Alternative2015 2020 2015 2020All SafetyEnhancement RemainingAll SafetyAll Efficiency Elements and EfficiencyEnhancement Enhancement Runway 5-23 EnhancementElementsElementsExtensionElementsMandatory residential land acquisiti on for construction 1 unit 66 units 11 units —Voluntary residential land acquisition for noise mitigation(homes exposed to noise l evels at or above DNL 70 dB)0 units 36 units 2 units 67 unitsVoluntary residential land acquisiti on for RPZ area cleari ng — 134 units 60 units —Total residential land acquisiti ons(2015 and 2020 combined)Affordable and Subsidized HousingTotal affordable housing land acquisiti on(Percent of total residential land acquisiti ons)Surface TransportationRoadway Constructi on1 unit 236 units(237 units total)Incl uded in 2020Partially RelocatedAi rport Road235 affordable units(99%)Fully RelocatedAi rport Road73 units 67 units(140 units total)Incl uded in 2020 135 affordabl e units(96%)Partially Relocated<strong>Airport</strong> Road andReali gned Main AvenueIntersection operations would improve over No-Action Al ternative 0 intersecti ons 6 intersecti ons 1 intersecti on 8 intersecti onsIntersections would conti nue to operate at LOS E/F l evels 0 intersecti ons 4 intersecti ons 4 intersecti ons 4 intersecti ons<strong>Airport</strong> driveways would experi ence LOS E/F (conditi ons do notoccur under the No-Action Alternati ve)1 intersecti on 2 intersecti ons 1 intersecti on 2 intersecti onsHistorical, Architectural, Archaeological, Cultural andSection 4(f) ResourcesHistorical Cemeteri es — — WHC 76 5 ; WHC 77and 78 6Notes: Refer to Table 5-131 for descriptions of the Safety and Efficiency Enhancements for Alternatives B2 and B4, and the significant environmental impacts, i naccordance wi th FAA Order 1050.1E. No other environmental consequences for the other impact categories: Environmental Justice/Chil dren’s Health and Safety;Air Quality; Section 4(f); Wetlands and Waterways; Water Quality; Fish, Wildli fe, and Plants; Federal Threatened and Endangered Species; Fl oodplains; CoastalResources; Farmlands; Hazardous Materials and Solid Waste; Light Emissions and Visual Envi ronment; and Natural Resources and Energy Supply.1 Includes residential units and non-residential noise-sensitive sites exposed to noise levels up to DNL 69.9 dB. The pri mary reason for the greater noise impacts23456wi thin DNL 65 dB for Alternative B4 is that the Runway 23 End RPZ would not be cl eared.No disproportionate significant impact to minority, Hispanic, or low-income populations, or to children’s health and safety risk.Businesses and jobs unlikely to relocate within the City of Warwick due to limited vacant/developable industrial l ands.Includes residential property tax revenue that could be lost annually due to voluntary acquisitions. For the purposes of this EIS acquisition for noise mitigati on fornoise impacts in 2020 are assumed to happen between 2020 and 2025 for Alternati ves B2 and B4; however, it is RIAC’s intenti on to acquire residenti al parcels assoon as 2012, subject to availabili ty of funding.Alternative B4 may result in a potential direct significant impact to WHC 76 because it lies within an area of Future Build VLAP for noise mitigation. If abuttinglandowners elect to have their property acquired and the building is demolished, potential i mpacts to WHC 76 will be evaluated by FAA and RIAC in consultationwi th the WHCC prior to any acquisition, per stipulati ons contained in the MOA.Alternative B4 may result in a potential significant direct impact to WHC 77 and 78 due to Realigned Main Avenue; however, the boundaries of WHC 77 and 78are based on the City’s plat maps and have not been field verified. Once permission is granted to strip top soils around the peri meter of visi ble headstones atthese cemeteries and the boundari es of WHC 77 and 78 are fully confirmed, the significant, or direct (physical), impact can be identifi ed. For the purposes of thisEIS, it is assumed that the redesign of Realigned Main Avenue to avoid the cemeteries will be implemented in final desi gn.—Chapter 5 - Environmental Consequences 5-285 July 2011\\mawatr\ev\09228.00\reports\<strong>FEIS</strong>_Final_July_2011\<strong>PVD</strong>_CH05_Environmental_Cons_JUL_2011.doc
T.F. <strong>Green</strong> <strong>Airport</strong> <strong>Improvement</strong> <strong>Program</strong>Environmental Impact Statement and Final Section 4(f) EvaluationThis Page Intentionally Left BlankChapter 5 - Environmental Consequences 5-286 July 2011\\mawatr\ev\09228.00\reports\<strong>FEIS</strong>_Final_July_2011\<strong>PVD</strong>_CH05_Environmental_Cons_JUL_2011.doc
T.F. <strong>Green</strong> <strong>Airport</strong> <strong>Improvement</strong> <strong>Program</strong>Environmental Impact Statement and Final Section 4(f) Evaluation6Mitigation6.1 IntroductionThis chapter describes measures considered to minimize adverse impacts from the Alternatives B2 and B4, andthe proposed measures aimed at mitigating significant environmental impacts. Significant impacts weredetermined based on guidance for significant adverse effects provided in FAA Orders 1050.1E and 5050.4B.Other impacts were determined based on additional impact analyses as required by local, state, or federalrequirements, including the short-term construction impacts of Alternatives B2 and B4. The CEQ regulations(40 CFR section 1508.20) define mitigation to include:• Avoiding the impact altogether by not taking a certain action or parts of an action• Minimizing impacts by limiting the degree or magnitude of the action and its implementation• Rectifying the impact by repairing, rehabilitating, or restoring the affected environment• Reducing or eliminating the impact over time by preservation and maintenance operations during the life ofthe action• Compensating for the impact by replacing or providing substitute resources or environmentsIn the DEIS Chapter 6, Mitigation, mitigation measures were identified for the T.F. <strong>Green</strong> <strong>Airport</strong> <strong>Improvement</strong><strong>Program</strong> where either Alternative B2 or B4 would result in significant impacts that are either permanent ortemporary in nature (occur during construction). The results of the environmental consequences analysis leadthe FAA to identify Alternative B4 as the Preferred Alternative and RIAC has identified Alternative B4 as itsProposed Action (see Chapter 3, Alternatives Analysis). Alternative B4, which includes extension of Runway 5-23to the south approximately 1,530 feet for a total length of 8,700 feet by 2015, would be substantially lessdisruptive to residential properties and businesses, and would impact fewer acres of wetlands compared toAlternative B2. Alternative B4 was developed to avoid land use impacts to the residential communities andbusinesses north of the <strong>Airport</strong> and to minimize the amount of construction-related residential and commercialland acquisition by limiting construction as much as possible to land already owned by RIAC located south ofthe Runway 5 End.Chapter 6 – Mitigation 6-1 July 2011\\Mawatr\ev\09228.00\reports\<strong>FEIS</strong>_Final_July_2011\<strong>PVD</strong>_CH06_Mitigation_JUL_2011.doc
T.F. <strong>Green</strong> <strong>Airport</strong> <strong>Improvement</strong> <strong>Program</strong>Environmental Impact Statement and Final Section 4(f) EvaluationAll significant impacts that would occur under Alternative B4 could be mitigated, as described in Section 6.2,Noise, through 6.20, Mitigation Implementation and Monitoring. For comparative purposes, the mitigation measuresconsidered for Alternative B2 are also described in this chapter, in Section 6.21, Alternative B2 Mitigation.Alternative B4 would meet the Purpose and Need for the T.F. <strong>Green</strong> <strong>Airport</strong> <strong>Improvement</strong> <strong>Program</strong>, providingthe same aviation and community benefits as Alternative B2; however socioeconomic benefits would begin fiveyears earlier under Alternative B4 with the extended Runway 5-23 coming on line in 2015. (The runwayextension would be completed by 2020 under Alternative B2.) Alternative B4 would also have fewer wetlandimpacts than Alternative B2. Alternative B4 would also be more feasible to construct than Alternative B2because it would have the lowest construction costs. Because of the reduced costs, the safety projects and theextension of Runway 5-23 would be phased so that work can be completed by 2015. Refer to Section 3.9.4, ThePreferred Alternative, of Chapter 3, Alternatives Analysis, for specific reasons why Alternative B4 is preferablewhen compared to Alternative B2. No final FAA decision on the selected alternative and associated mitigationwill be made until the issuance of the agency’s Record of Decision (ROD).Mitigation measures considered in this chapter of the <strong>FEIS</strong> focus on design measures to avoid or reduceimpacts, and measures to replace or restore the functions and values of lost resources for the alternatives.Tables 6-1 and 6-2 summarize Alternatives B2 and B4 mitigation measures.Through additional avoidance and minimization efforts, as well as field work conducted since the filing of theDEIS, the proposed mitigation for wetland and floodplain resources is provided in greater detail than the DEIS.Wetland mitigation-specific consultation with resource agencies occurred between the filing of the DEIS and thefiling of the <strong>FEIS</strong>. Based on the EPA’s suggestion in its comment letter on the DEIS, FAA formed a WetlandWorking Group, which met periodically since the July 2010 publication of the DEIS. The Wetland Working Groupis comprised of the EPA, USACE, RI Rivers Council, RIDEM, FAA, and RIAC. See Appendix C, Federal, State, City,and Tribal Coordination, for meeting materials and notes from Wetland Working Group Meetings. Additionalagency coordination and public outreach on mitigation is documented in Chapter 8, Consultation and Coordination.In addition to the comment from EPA to develop a Wetland Working Group to further the wetland impactmitigation, the FAA received other comment letters on the DEIS with suggestions for mitigation includingmeasures to reduce construction emissions, expanding the voluntary land acquisition areas, and identifyingWinslow Park relocation sites. The FAA also worked with the Rhode Island Historic Preservation and HeritageCommission to further develop mitigation measures for impacted historical resources and to develop an MOA.The mitigation measures that the FAA developed in conjunction with the agencies and the community aredescribed in this chapter. The FAA considered these comments on the DEIS and incorporated the suggestedmeasures into the proposed potential mitigation measures.Table 6-1 summarizes the proposed mitigation measures that would address significant impacts underAlternatives B2 and B4. Table 6-2 summarizes the proposed mitigation measures required for compliance withother requirements. This chapter demonstrates that sufficient, appropriate mitigation options are available toaddress Project-related impacts.Chapter 6 – Mitigation 6-2 July 2011\\Mawatr\ev\09228.00\reports\<strong>FEIS</strong>_Final_July_2011\<strong>PVD</strong>_CH06_Mitigation_JUL_2011.doc
T.F. <strong>Green</strong> <strong>Airport</strong> <strong>Improvement</strong> <strong>Program</strong>Environmental Impact Statement and Final Section 4(f) EvaluationTable 6-1Summary of Potential Proposed Mitigation for Significant ImpactsMitigation Measure Alternative B2 Alternative B4Noise• Provide sound insulation for residences l ocated at or above DNL 65 dB that would experience a noise increase of at l eastDNL 1.5 dB when compared to the No-Action Alternative for the same ti meframe 1 • Provide sound insulation for non-residential noise-sensiti ve receptors that would experience a noise increase of at least DNL1.5 dB at or above DNL 65 dB when compared to the No-Action Alternative for the same timeframe (Jehovah’s Wi tnesses ofWarwick) Compatible Land UseSee Noise X XHistoric, Architectural, Archaeological, and Cultural Resources• Prepare archival documentation for the National Register eli gible airport historic district (including the Historic District, StateX XTermi nal, and Hangars No. 1 and 2) 2 • Develop a physical and electronic display depicti ng the historical development of the airport.• Prepare list of items from Hangar No. 1 for possible salvage and curation.• For WHC 26, l ay the headstones flat with protecti on, relocate the headstones, or other relocation measures determi ned bythe Warwick Hi storical Cemetery Commission through permitting. • Archaeological Resources, consult with RIHPHC and NITHPO to develop appropriate archaeological surveys to identi fyarchaeological si tes and evaluate their significance and eligibili ty to the NRHP i n areas of potenti al effect unknown at thistime if not previousl y surveyed. If determined eligible for listing in the NRHP, coordinate with RIHPHC and NITHPO to review avoidance and/or mitigation options. Section 4(f) Resources• Replace i mpacted Winslow Park recreation facilities on another site to mitigate for the physical use impact X X• For eli gible airport historic district, State Termi nal, and Hangar Nos. 1 and 2 mitigati on (see Historic, Architectural,Archaeological, and Cultural Resources)XXWetlands and Waterways 3• Replace functions and values of impacted wetl ands (5.8 acres for Alternative B2 and 5.0 acres for Alternative B4) Wetland Mitigation Site 1: 3.0 acres on-site wetland creation Wetland Mitigation Si te 2: culvert replacement at Lakeshore Drive (longer culvert for B2) Wetland Mitigation Site 3: 1.5 acres on-si te wetland restorati on and enhancement (reduced to 0.7 acres under Alternati ve B2) Wetland Mitigation Si te 5: 1.7 acres of wetland restorati on along the Pawtuxet River Wetland Mitigation Si te 6: 0.4 acres on-site wetland creation (expanded to 1.0 acre for Alternative B2) Wetland Mitigation Si te 7: 1.0 acres of wetland creation/restoration in the exit ramp infield to Route 37 Wetland Mitigation Si te 8: 32.0 acres off-site wetland and upland buffer preservation Wetland Mitigation Site 12: 8.0-12.0 acres off-site coastal wetland and upland buffer preservationFloodplains• Provide compensatory flood storage (incorporated in design) X XNotes: Refer to Table 5-131 of Chapter 5, Envi ronmental Consequences, for a summary of significant i mpacts by alternative. In accordance wi th FAA Order 1050.1E,Environmental Impacts: Policies and Procedures, FAA, United States Department of Transportation, March 20, 2006, no mitigation for significant impacts is required forthe other environmental impact categories, including: Social and Economic, and Environmental Justice, Chil dren’s Health and Safety; Surface Transportation; Ai rQuality; Water Quality; Fish, Wildlife, and Plants; Threatened and Endangered Speci es; Coastal Resources; Farmlands; Hazardous Materials and Soli d Waste; LightEmissions and Vi sual Envi ronment; and Natural Resources and Energy Supply.RIHRA Rhode Island Histori c Resource Archive.RICRMC Rhode Isl and Coastal Resources Management Council .1 Accordi ng to FAA Order 1050.1E, significant impacts are those residential units and non-residential noise-sensiti ve land uses that would be exposed to noise levels ofat l east 1.5 dB increase or more withi n the DNL 65 dB contour or above due to the project.23The level of documentati on, either HABS/HAER or RIHRA will be determined through consultati on. Hangar No. 2 would be impacted by Alternati ve B2 only.Not all sites are proposed for mitigati on. This is a list of available mitigation opti ons. Table 6-12 and Table 6-21 show the corresponding acreage for wetland creati on,restoration, and buffer preservation as it relates to project i mpacts for Al ternative B4 and B2, respecti vely.XXXXXXXXXXXXXXXXXXXXXXXXXXXChapter 6 – Mitigation 6-3 July 2011\\Mawatr\ev\09228.00\reports\<strong>FEIS</strong>_Final_July_2011\<strong>PVD</strong>_CH06_Mitigation_JUL_2011.doc
T.F. <strong>Green</strong> <strong>Airport</strong> <strong>Improvement</strong> <strong>Program</strong>Environmental Impact Statement and Final Section 4(f) EvaluationTable 6-2Summary of Potential Mitigation for Compliance with Other RequirementsMitigation Measure Alternative B2 Alternative B4Noise• Continue to implement ongoing noise compatibility measures for airport operations• Acquire residential parcels exposed to noise levels of DNL dB 70 and above through participation in a voluntary landacquisition program 1• Provide sound insulation for residences exposed to noise levels at or above DNL 65 dB 2• Install noise barriers or berms along project affected roadways, as appropriate, based on RIDOT protocol (FullyRelocated <strong>Airport</strong> Road for Alternative B2 and on Main Avenue for Alternative B4)• Install Quiet Pavement on project affected roadways (Relocated <strong>Airport</strong> Road for Alternative B2 and on Main Avenuefor Alternative B4)Compatible Land Use• See Noise X X• Update Noise Land Reuse Plan X XSocioeconomic, and Environmental Justice, Children’s Health and Safety Risks• Relocate and compensate fairly, consistently, and equitably all acquired residents and businesses according to theX Xrequirements of the Uniform Relocation Act 1Surface Transportation• Relocate Park and Ride facilities and reroute RIPTA buses X X• Incorporate bicycle and pedestrian accommodation into roadway projects as appropriate• Improve intersection at Post Road/Coronado Road• Improve intersection at Main Avenue/Jefferson BoulevardXXXXHistoric, Architectural, Archaeological, and Cultural Resources• WHC 76 lies within the Future Build VLAP for noise mitigation. If abutting landowners elect to have their propertyacquired and the building is demolished, potential impacts to WHC 76 will be evaluated by FAA and RIAC inconsultation with the Warwick Historical Cemetery Commission prior to any acquisition, per stipulations contained in theMOA.• Define boundaries of WHC 77 and 78, assess potential impacts, consult with Warwick Historical Cemetery Commissionto avoid or mitigate. For the purposes of this EIS, it is assumed that the redesign of Realigned Main Avenue to avoidthe cemeteries will be implemented in final design.Water Quality• Design and construct stormwater management control systems in accordance with the 2010 RIDEM StormwaterDesign and Installation Standards ManualCoastal Resources• Design the Project to comply with the applicable performance standards, including the Special Area Management Plangoals and objectives.Hazardous Materials, Solid Waste, and Pollution Prevention• Design and construct the Project in compliance with applicable local, state, and federal laws and regulationsX Xconcerning hazardous or solid waste management 3Construction Period• Complete construction activities in compliance with the most recent edition of FAA’s Advisory Circular 150/5370-10,Standards for Specifying Construction of <strong>Airport</strong>s• Relocate the portion of the water main in <strong>Airport</strong> Road that will be under the Runway 16 RSA• Incorporate appropriate construction mitigation measures into the contract documents and specifications governing theactivities of contractors and subcontractors constructing elements of the Project 4See Tables Notes on next page.XXXXXXXXXXXXXXXXXXXXXXChapter 6 – Mitigation 6-4 July 2011\\Mawatr\ev\09228.00\reports\<strong>FEIS</strong>_Final_July_2011\<strong>PVD</strong>_CH06_Mitigation_JUL_2011.doc
T.F. <strong>Green</strong> <strong>Airport</strong> <strong>Improvement</strong> <strong>Program</strong>Environmental Impact Statement and Final Section 4(f) EvaluationNotes: Refer to Table 5-132 of Chapter 5, Environmental Consequences, for a summary of other environmental consequences by alternative. No mitigation for otherenvironmental consequences is required for the other environmental impact categories, including: Air Quality; Historic, Architectural, Archaeological, and CulturalResources; Section 4(f) Resources; Fish, Wildlife, and Plants; Threatened and Endangered Species; Farmlands; Light Emissions and Visual Environment; andNatural Resources and Energy Supply.RIHRA Rhode Island Historic Resource Archive.RICRMC Rhode Island Coastal Resources Management Council.1 According to the relocation process specified by the Uniform Relocation Assistance and Real Property Acquisition Policies Act of 1970, as amended (42 USCsection 4601, et. seq.,). For the purposes of this <strong>FEIS</strong>, it is assumed for Alternative B2 that residential properties would be acquired between 2020 and 2025 fornoise impacts in 2020, and it is assumed that for Alternative B4, that residential properties would be acquired between 2015 and 2020 for noise impacts in 2015,and between 2020 and 2025 for noise impacts in 2020; however, it is RIAC’s intention to acquire residential parcels as soon as 2012 for both Alternatives, subject toavailability of funding.2 Assuming that FAA funding is made available, RIAC would begin the sound insulation program following the last phase of project-related land acquisition mitigation.3 Refer to Section 5.17.1, Regulatory Context, of Chapter 5, Environmental Consequences, for the applicable local, state, and federal laws and regulations thatgovern hazardous materials and solid waste.4 Refer to Table 6-16 for a summary of proposed mitigation measures related to construction activities.The following sections describe the proposed mitigation of the Preferred Alternative, which is also the ProposedAction, including additional detail than previously provided in the DEIS. This is followed by a description ofproposed mitigation for Alternative B2, highlighting the difference between the two alternatives.6.2 NoiseThe Preferred Alternative, Alternative B4, was specifically developed to minimize the extent of the impacts tothe community including avoiding a full relocation of <strong>Airport</strong> Road with its associate mandatory acquisitionsfor construction and traffic noise. Alternative B4 minimizes the extent of the noise impacts to the north of the<strong>Airport</strong> more than Alternative B2 because it would extend the Runway 5 End (to the south) only. Noisemitigation is proposed for significant increases in aircraft noise levels and other noise impacts from both aircraftand vehicular traffic and includes the following measures.Mitigation for Significant Noise Impacts for Alternative B4:• Provide sound insulation for residences that would experience a noise increase of at least DNL 1.5 dB at orabove DNL 65 dB when compared to the No-Action Alternative for the same timeframe.• Provide sound insulation for sensitive receptors that have not previously been sound insulated (Jehovah’sWitnesses of Warwick).Mitigation for Other Noise Impacts for Alternative B4:• Continue implementation of ongoing noise compatibility measures for airport operations.• Acquire residential parcels exposed to noise levels of DNL 70 dB and above through participation in avoluntary land acquisition program. This area was expanded to include more homes based on thecommunity’s comments on the DEIS.• Provide sound insulation for residences exposed to noise levels between DNL 65 dB and 69 dB. 469469 Includes homes exposed to noise levels up to DNL 69.9 dB.Chapter 6 – Mitigation 6-5 July 2011\\Mawatr\ev\09228.00\reports\<strong>FEIS</strong>_Final_July_2011\<strong>PVD</strong>_CH06_Mitigation_JUL_2011.doc
T.F. <strong>Green</strong> <strong>Airport</strong> <strong>Improvement</strong> <strong>Program</strong>Environmental Impact Statement and Final Section 4(f) Evaluation• Install noise barriers or berms on <strong>Airport</strong> Road and Main Avenue as appropriate following RIDOT’sprotocol.• Install Quiet Pavement for relocated <strong>Airport</strong> Road and Main Avenue.• Implement construction-related noise mitigation.The following section provides an overview of the FAA’s guidance on controlling noise and reducingincompatible land uses.6.2.1 Overview of FAA Guidance on Noise Control and Compatible Land Use PlanningThe FAA regulation, 14 CFR Part 150, <strong>Airport</strong> Noise Compatibility Planning (Part 150) is the primary federalregulation guiding aviation noise compatibility on and around airports. The FAA Advisory Circular150/5020-1, Noise Control and Compatibility Planning for <strong>Airport</strong>s, offers guidance to airports for noise control andcompatibility planning under Part 150 and the Aviation Safety and Noise Abatement Act of 1979 (the ASNA Act), asamended. While Part 150 is voluntary and airport operators are not required to participate, an approvedPart 150 Noise Compatibility <strong>Program</strong> (NCP) is the primary vehicle for gaining approval of applications forfederal grants for noise abatement projects<strong>Airport</strong> noise compatibility planning is seen by FAA as a joint planning effort between airport operators andusers, and local governments where local consultation and citizen participation are key elements that arerequired under Section 103 of the ASNA Act and under Part 150. The Advisory Circular aims to assist airportsin reducing existing non-compatible land uses and preventing new non-compatible development through noisecontrol planning, airport master planning, and coordination with local and state governments. Typicallyrecommended noise abatement measures fall into three categories:• Operational measures, such as changes in runway use or changes in flight-track location.• Preventive measures, such as compatible land use zoning or noise overlay zoning within off-airport noiseexposure areas.• Remedial measures, such as purchase of property or sound insulation of residential property that is exposedto significant aircraft noise.Part 150 outlines a balanced approach for mitigating the noise impacts of airports upon their neighbors whilemaintaining the efficiency of the national aviation system. Part 150 establishes procedures, standards, andmethodologies to be used by airport operators for the preparation of Noise Exposure Maps (NEMs) and airportNCPs. Specifically, Part 150:• Establishes standard noise methodologies and units;• Establishes standard noise modeling methodology (Integrated Noise Model);• Identifies compatible and non-compatible land uses with various levels of airport noise;Chapter 6 – Mitigation 6-6 July 2011\\Mawatr\ev\09228.00\reports\<strong>FEIS</strong>_Final_July_2011\<strong>PVD</strong>_CH06_Mitigation_JUL_2011.doc
T.F. <strong>Green</strong> <strong>Airport</strong> <strong>Improvement</strong> <strong>Program</strong>Environmental Impact Statement and Final Section 4(f) Evaluation• Provides for voluntary development of NEMs and NPCs by airport operators;• Provides for FAA review of NEMs to insure compliance with the Part 150 regulations;• Provides for FAA review and approval of Part 150 NCPs submitted by airport operators; and• Establishes procedures and criteria for making project eligible for funding as noise projects through theFAA’s <strong>Airport</strong> <strong>Improvement</strong> <strong>Program</strong>.Each NCP must include an agreed upon implementation schedule, and identification of the entity responsiblefor implementing each of its proposed noise compatibility action and necessary funds. Additionally, the NCPmust include a plan for timely revisions, such as revised NEMs in order to stay relevant to changing aviationand local environmental components of the NCPs.Roles and Responsibilities for Compatible Land Use PlanningThe key roles and responsibilities of the entities involved in implementing actions to enhance airport andoff-airport land use compatibility include:• FAA – In addition to controlling aircraft traffic and the implementation of flight standards, the FAA isresponsible for the development of guidance related to federal laws and regulations affecting the aviationindustry and distribution of funds to support the implementation of land use compatibility planning formaking sure that airports that receive federal funding are in compliance with grant assurances.• <strong>Airport</strong> Operators – <strong>Airport</strong> owners and operators are responsible for the development of information tosupport the land use compatibility effort, such as the preparation of airport master plans, noisecompatibility and land use studies, community involvement programs, and the interaction with localplanners and elected officials related to land use compatibility. <strong>Airport</strong> management is also responsible forthe establishment of controls to reduce noise impacts.• <strong>Airport</strong> Users (Airlines, Cargo Carriers, Shippers, Passengers) – Airlines and air cargo carriers arerequired to replace or retrofit aircraft to meet the latest noise requirements. Pilots of all aircraft types,including general aviation aircraft, are responsible for operating their aircraft according to noise abatementprocedures established at an airport and within the local airspace. Portions of ticket and air bill taxesand/or passenger facility charges from passengers and shippers may be directly allocated for noise controland planning activities.• Local Government – Local land use planners, elected officials and municipalities that operate airports areresponsible for local land use zoning and control. These entities and individuals are responsible forpreparation of comprehensive plans, and reviewing and implementing zoning and land use regulations in amanner that considers the effects related to local airport facilities and aviation activity. Theseresponsibilities include paying particular attention to noise impact mitigation, tall structure location, landfilldevelopment, and wildlife interaction with aviation activity in addition to other infrastructure interfaceconsiderations.Chapter 6 – Mitigation 6-7 July 2011\\Mawatr\ev\09228.00\reports\<strong>FEIS</strong>_Final_July_2011\<strong>PVD</strong>_CH06_Mitigation_JUL_2011.doc
T.F. <strong>Green</strong> <strong>Airport</strong> <strong>Improvement</strong> <strong>Program</strong>Environmental Impact Statement and Final Section 4(f) Evaluation6.2.2 RIAC’s Ongoing Part 150 NCP and Voluntary Land Acquisition <strong>Program</strong>T.F. <strong>Green</strong> <strong>Airport</strong> was one of the first airports in New England to participate in the FAA’s Noise and Land UseCompatibility <strong>Program</strong>. 470 The <strong>Airport</strong>’s first Part 150 Study and NEM were approved by the FAA in 1986. In1991, the NEM was updated and in 1993 RIAC’s first Part 150 study update was completed. Both Part 150studies included aircraft-related noise abatement measures some of which been adopted and continue to beimplemented, and others were not enacted. In 1999, RIAC undertook a complete update of the original Part 150Study that evaluated the effectiveness and/or applicability of previously implemented noise abatement andland use compatibility measures, and provided recommendations. During the course of this Part 150 Studyupdate and based on a revised NEM (dated 2000), 58 additional noise abatement and land use alternatives wereevaluated on their feasibility to reduce the effects of noise on surrounding communities. 471 Based on the 2008Noise Exposure Map (NEM) update, 285 residential properties were identified as eligible for acquisition andwere acquired in 2009 (referred to in this <strong>FEIS</strong> as the Completed Part 150 VLAP). In early 2010, RIAC continuedimplementation of its Part 150 NCP based on the 2020 NEM, which was accepted by the FAA on July 27, 2010. 472The 2010 NEM update identified 115 residential parcels as eligible for acquisition of which 70 properties havebeen acquired as of January 2011 (referred to in this <strong>FEIS</strong> as the Current Part 150 VLAP). The Current Part 150VLAP is scheduled to be complete by 2015 and, therefore, have been taken into account when determiningProject-related impacts.As part of RIAC’s NCP, noise abatement measures such as: construction of a noise barrier parallel to theRunway 5 End; implementation of voluntary nighttime restrictions for scheduled air carrier operations;restrictions on the use of APUs in certain on-<strong>Airport</strong> locations; and restrictions on aircraft turnarounds on theRunway 5 End have been and continue to be implemented. 473 Additionally, land use mitigation actions wereevaluated and have been implemented and complete, such as: working with the State of Rhode Island and Cityof Warwick to amend building codes; working with the City of Warwick to update its Comprehensive Plan toaddress airport influence on planning districts; institution of a policy to disclose noise levels on residentialproperty; and implementation of sound insulation and land acquisition programs (including the soundinsulation of schools).6.2.3 Mitigation for Significant Noise Impacts for Alternative B4Significant noise impacts were identified after accounting for the Completed Part 150 and the Current Part 150VLAPs and Project-related land acquisitions (mandatory for construction and FAA–recommended RPZclearing). Table 5-31 of Chapter 5, Environmental Consequences, summarizes the significant noise impacts forAlternative B4. Table 6-3 summarizes the proposed mitigation for significant noise impacts for Alternative B4,which includes:• Provide sound insulation for residences located at or above DNL 65 dB that would experience a noiseincrease of at least DNL 1.5 dB when compared to the No-Action Alternative for the same timeframe.470 RIAC’s Part 150 NCP was initiated by the 1986 NEM and NCP approval, and includes the1991 NEM update, 1995 NEM update, 2000 NCP revision, 2008NEM update, and 2010 NEM update.471 T.F. <strong>Green</strong> <strong>Airport</strong> FAR Part 150 Study Update, Appendix B, Noise Abatement and Land Use Alternatives, Landrum & Brown, April 2000.472 The 2020 NEM was derived from the Level 6 2020 No-Action Alternative DNL 70 dB noise contour with additional rounding, as documented in the DEIS.473 According to the T.F. <strong>Green</strong> <strong>Airport</strong> FAR Part 150 Study Update, voluntary nighttime restrictions for scheduled air carrier operations are partiallyimplemented through a 1996 Memorandum of Understanding between RIAC and the City of Warwick.Chapter 6 – Mitigation 6-8 July 2011\\Mawatr\ev\09228.00\reports\<strong>FEIS</strong>_Final_July_2011\<strong>PVD</strong>_CH06_Mitigation_JUL_2011.doc
T.F. <strong>Green</strong> <strong>Airport</strong> <strong>Improvement</strong> <strong>Program</strong>Environmental Impact Statement and Final Section 4(f) Evaluation• Provide sound insulation for one non-residential noise-sensitive receptor: Jehovah’s Witnesses of Warwick(a place of worship).Table 6-31,2Alternative B4: Summary of Mitigation for Significant Noise Impacts2015 2020 2025Project-rel ated Signifi cant Noise I mpactsSignificantl y Impacted Housing Units Eligibl e f or Sound Insulation MitigationImpacted Non-Residential Noise-Sensitive Sites Eligibl e for Sound Insulation Mitigati184on 3 Jehovah’s Wi tnessesof Warwick174Jehovah’s Wi tnessesof Warwick108Jehovah’s Wi tnessesof WarwickI mpacted and Previousl y Sound Insul ated 4Previously Sound Insulated Housing Uni ts161Previously Sound Insulated Non-Residential Noise-Sensitive Si tes 5 Baha’i Faith151Baha’i Faith87Baha’i FaithJohn Wickes SchoolProject-Related Noi se Mitigati on for Significant NoiseNon-Insulated Significantl y Impacted Housing Uni tsI mpactsNon-Insulated Non-Residential Noise-Sensitive Si tesJehovah’s Wi tnesses of Jehovah’s Wi tnesses of Jehovah’s Wi tnessesWarwi ckWarwi ckof WarwickSource: HMMH, 2011. U.S. Census Data, 2000. Database of previously sound insulated housi ng units provi ded by RIAC.Note: Represents the number of housi ng units and non-residential noise-sensitive sites affected by significant noise levels during a specific year and are not cumulati ve.NA Not Appli cable1 Significant i mpacts are noise impacts that occur if analysis shows that the proposed action would cause noise-sensiti ve areas to experience an increase in noise of at l east DNL 1.5 dB or more at or above DNL 65 dB noise exposure when compared to the No-Action Alternative for the same ti meframe. These resi denceswould be eli gible for sound insulation mitigati on. May include homes already sound i nsulated as part of a previous sound insulati on effort under the Part 150 NCP.This i s because past NCPs accounted for Stage 1 and Stage 2 aircraft in the fleet mi x both of which have si nce been phased out due to noise and fuel use (referto Secti on 4.2, Noi se, of Chapter 4, Affected Envi ronment, for further information).2 Excl udes people that would be relocated and housing units that would be acquired for construction (mandatory), noise mitigati on under a Future Buil d VLAP andRPZ area cleari ng.3 Jehovah’s Witnesses of Warwick (Site PW017) would experience significant noise impacts i n 2015, 2020, and 2025 and would be eligible for sound insulationmitigation. Baha’i Faith (Si te PW039) would experience signifi cant noise impacts i n 2015, 2020, and 2025, but i t has already been sound insulated and it wouldnot be eli gible for additi onal sound insulation mitigati on. The John Wickes School (SCH524) would experience significant noise impacts i n 2025. It has alreadybeen sound i nsulated, but concurrent with the construction of the runway extensi on, RIAC will conduct additi onal acoustical testi ng of non-residential noisesensitiveproperti es that would be exposed to a noise level increase of at least DNL 1.5 dB at or above DNL 65 dB. Results of the testing may allow for installationof air conditi oning, or other noise related mitigati on.4 Of the Project-related significant noise impacted housi ng units, these units have already been sound i nsulated under a previous sound insulation program.Database of properties provi ded by RIAC. Previously insulated properti es will be confirmed prior to initiating a future sound insulati on program.5 Baha’ i Fai th and John Wi ckes School have been sound insulated as part of a previous sound insulati on effort under the Part 150 NCP.6 As noted, the numbers presented are not cumulative. Through 2025, a total of 24 housing units would be newly eligible for Project-related noise mitigation (soundinsulation) due to signifi cant noise impacts (23 units in 2015, one additi onal unit i n 2020, and no additional units i n 2025).23 623 621 66.2.3.1 Residential Sound Insulation for Noise MitigationAll residential units and other non-residential noise-sensitive land uses that would be exposed to a significantincrease in noise (at least 1.5 dB increase or more in the DNL 65 dB or above noise contour intervals) would beeligible for sound insulation. After taking previous sound insulation efforts of the Completed Part 150 VLAPprogram into account, in both 2015 and 2020, a total of 23 previously non-sound-insulated residences would beeligible for sound insulation mitigation. Assuming that FAA funding is made available, RIAC would begin thesound insulation program following the last phase of project-related land acquisition mitigation (under the Part150 NCP discussed below). In 2025, a total of 21 residences would be eligible for sound insulation underChapter 6 – Mitigation 6-9 July 2011\\Mawatr\ev\09228.00\reports\<strong>FEIS</strong>_Final_July_2011\<strong>PVD</strong>_CH06_Mitigation_JUL_2011.doc
T.F. <strong>Green</strong> <strong>Airport</strong> <strong>Improvement</strong> <strong>Program</strong>Environmental Impact Statement and Final Section 4(f) EvaluationAlternative B4. All eligible residences are based on the <strong>FEIS</strong> noise contours. Future Build noise mitigation for2025 would be determined based on revised noise contours and actual aircraft operations (a future FAAapprovedNEM) and would be implemented according to Part 150 guidelines.Sound Insulation ProcessThe purpose of sound insulation is to reduce the adverse impact of airport-related noise on noise-sensitive usesthrough building improvements. The previous sound insulation effort under the Part 150 NCP was voluntaryand was established under the Part 150 NCP. Eligible homeowners are notified if their home is eligible forsound insulation and, at this time, homeowners decide whether or not to participate. Homeowners are usuallyinvited to a general information meeting and are given detailed information about the program. To participate,various documents need to be completed. These documents give the airport permission to evaluate specificnoise problems and concerns and begin the modifications process.The goal of sound insulation is to achieve a noise reduction of at least a 5 dB from the insulation, resulting in nomore than 45 dB for interior noise level. Newer homes with thicker walls, additional insulation, and modernwindows may already have an interior noise level of less than 45 dB. Therefore, even if they were deemedeligible for sound insulation, they would not be sound insulated since they already met the sound mitigationgoal. Further attempts at sound insulation may not be effective. Such homes might receive some treatment, suchas additional caulking and new double pane windows, but not full sound insulation. After the completion of an<strong>FEIS</strong> or noise study, and before renovations can begin, a representative sample of homes may be subjected toacoustical testing and architectural and design surveys to determine which of the eligible homes might be soundinsulated. These tests ensure that the right types of sound insulation modifications are made. Proposedmodifications may include:• Replacing or sealing windows;• Adding better insulated doors;• Insulating the ventilation system, walls, and attic of the house; and• Adding or improving the ventilation system.After the tests and designs are complete, RIAC would present the proposed modifications to the homeowner.Contractors would be selected and the work would be performed on each residence. Following completion ofthe improvements, the home (or home of similar design) would be tested to ensure that the improvements meetthe FAA criteria of an interior 45 dB in all habitable rooms and a reduction of at least 5 dB due to theimprovements.6.2.3.2 Non-Residential Sound Insulation for Noise MitigationIn both 2015 and 2020, Alternative B4 would expose two non-residential noise-sensitive properties to asignificant increase in noise levels when compared to the No-Action Alternative: Jehovah’s Witnesses ofWarwick, Site PW017; and Baha’i Faith, Site PW039 (Figure 5-9). In 2025 under Alternative B4, threenon-residential noise-sensitive sites would experience a significant noise increase: Jehovah’s Witnesses ofWarwick, Site PW017; Baha’i Faith, Site PW039; and the John Wickes School, Site SCH524. Baha’i Faith and theJohn Wickes School (SCH524) have been sound insulated as part of a previous sound insulation effort under theChapter 6 – Mitigation 6-10 July 2011\\Mawatr\ev\09228.00\reports\<strong>FEIS</strong>_Final_July_2011\<strong>PVD</strong>_CH06_Mitigation_JUL_2011.doc
T.F. <strong>Green</strong> <strong>Airport</strong> <strong>Improvement</strong> <strong>Program</strong>Environmental Impact Statement and Final Section 4(f) EvaluationPart 150 NCP. Concurrent with the construction of the runway extension, RIAC will conduct additionalacoustical testing of non-residential noise-sensitive properties that would be exposed to a noise level increase ofat least DNL 1.5 dB at or above DNL 65 dB. Results of the testing may allow for installation of air conditioning,or other noise related mitigation. Refer to the ‘Sound Insulation Process’ presented in the previous section for adescription of how non-residential noise-sensitive sites would be sound insulated as noise mitigation.6.2.4 Mitigation for Other Noise Impacts for Alternative B4It is the intent of RIAC’s Part 150 NCP to evaluate Project-related noise levels and mitigate, as necessary, eitherthrough sound insulation or land acquisition, during construction of the T.F. <strong>Green</strong> <strong>Airport</strong> <strong>Improvement</strong> <strong>Program</strong> inorder to reduce noise impacts on noise-sensitive land use and reduce non-compatible land uses around the <strong>Airport</strong>.Additional mitigation for aircraft and vehicular traffic impacts would be provided in accordance with thecriteria of Part 150 and RIDOT vehicular traffic noise criteria, respectively and includes:• Continuing the ongoing noise compatibility measures for airport operations.• Acquiring residential parcels exposed to noise levels of DNL 70 dB.• Providing sound insulation for residences exposed to noise levels between DNL 65 dB and 69 dB.• Installing noise barriers/berms on <strong>Airport</strong> Road and on Main Avenue as appropriate following RIDOT’sprotocol.• Installing Quiet Pavement on relocated <strong>Airport</strong> Road and Main Avenue as appropriate.• Implementing construction-related noise mitigation.6.2.4.1 Ongoing Noise Compatibility MeasuresTable 6-4 presents a number of measures currently implemented by RIAC as part of ongoing efforts to mitigatefor airport noise and improve land use compatibility as part of its NCP. These measures would continue to beimplemented as part of Alternative B4.Chapter 6 – Mitigation 6-11 July 2011\\Mawatr\ev\09228.00\reports\<strong>FEIS</strong>_Final_July_2011\<strong>PVD</strong>_CH06_Mitigation_JUL_2011.doc
T.F. <strong>Green</strong> <strong>Airport</strong> <strong>Improvement</strong> <strong>Program</strong>Environmental Impact Statement and Final Section 4(f) EvaluationTable 6-4Noise Compatibility MeasuresNoise Compatibility Tool Application Primary Responsible PartyOperational Noise Control Actions 1 Operational actions to control airport noise may include capacity limits based <strong>Airport</strong> Operatoron noise, changes in takeoff and/or approach procedures, and/or theimplementation of complete or partial curfews that restrict aircraft operationsduring nighttime hours.Noise Abatement Measures 2 Measures can include actions that may be implemented by the users orcontrollers of aircrafts in-flight or on the ground as well as the implementation<strong>Airport</strong> Operator<strong>Airport</strong> Usersof noise barriers, noise insulation, and land acquisition and relocation. Noiseinsulation aims to lower indoor noise levels for residential or other noisesensitiveuses, such as schools. While land acquisition and relocation is costlyand disruptive, it effectively removes the noise-sensitive use without requiringadditional action by other political entities.Public Education and Outreach 3 <strong>Airport</strong> operators can distribute information to the public through the use of <strong>Airport</strong> Operatorbrochures, newsletters, noise complaint mechanism, and Internet web pagesas well as have an open dialogue with the public.Sources: FAA Advisory Circular 150/5020-1, Noise Control and Compatibility Planning for <strong>Airport</strong>s, August 5, 1983; Land Use Compatibility and <strong>Airport</strong>s, Compatible LandUse Planning Task Force, FAA <strong>Airport</strong> Noise Compatibility Toolkit, date unknown; The 14 CFR Part 150 <strong>Airport</strong> Noise Compatibility Planning <strong>Program</strong> – AnOverview, FAA <strong>Airport</strong> Noise Compatibility Toolkit, date unknown. (www.faa.gov/about/office_org/headquarters_offices/aep/planning_toolkit/)1 RIAC and air carriers at T.F. <strong>Green</strong> <strong>Airport</strong> currently take operational actions to control noise.2 Measures are being applied as part of the Current Part 150 VLAP and Project-related mitigation (Future Build VLAPs).3 RIAC created the following VLAP website as a resource for providing useful and relevant information for the communities surrounding T.F. <strong>Green</strong> <strong>Airport</strong>:www.riac.jonespayne.com/index.html. The T.F. <strong>Green</strong> <strong>Airport</strong> website also provides a link to detailed information on the EIS and Master Plan documents at:www.pvdairport.com/main.aspx?sec_id=896.2.4.2 Voluntary Land AcquisitionResidential units exposed to noise levels of DNL 70 dB and above would be eligible for participation in avoluntary land acquisition program, or VLAP, consistent with the criteria of Part 150. Residents of all homesacquired for noise mitigation would be compensated in accordance with the Uniform Relocation Act (URA)relocation process (described further in Section 6.4, Social and Socioeconomic, and Environmental Justice andChildren’s Health and Safety Risks). 474 Table 6-5 presents the number of residences that would be eligible forparticipation in a Future Build VLAP as mitigation for Alternative B4 impacts. For the purposes of this <strong>FEIS</strong>, it isassumed for Alternative B4 that residential properties would be acquired between 2015 and 2020 for noiseimpacts beginning in 2015, and between 2020 and 2025 for noise impacts beginning in 2020. However, it isRIAC’s intention to acquire residential parcels as soon as 2012, subject to availability of funding.474 Uniform Relocation Assistance and Real Property Acquisition Policies Act of 1970, 42 USC section 4601 et seq, U.S. Department of Housing and UrbanDevelopment.Chapter 6 – Mitigation 6-12 July 2011\\Mawatr\ev\09228.00\reports\<strong>FEIS</strong>_Final_July_2011\<strong>PVD</strong>_CH06_Mitigation_JUL_2011.doc
T.F. <strong>Green</strong> <strong>Airport</strong> <strong>Improvement</strong> <strong>Program</strong>Environmental Impact Statement and Final Section 4(f) EvaluationTable 6-5Alternative B4: Residential Units Eligible for Participation in aVoluntary Land Acquisition <strong>Program</strong> under Part 150 1,2Analysis YearResidential Units Newly Eligiblefor Participation in an Acquisition <strong>Program</strong>2015 3 22020 4 672025 5 6Total 75Source: RIGIS: Field verification by VHB, Inc., 2005; City of Warwi ck Assessor’s Parcel Data.Note: May incl ude homes already sound insulated.1 For the purposes of the EIS, it is assumed that for Alternative B4 residential properties would be acquired between 2015 and 2020 for noise impacts beginning in 2015, and between 2020 and 2025 for noise impacts beginning in 2020.However, it is RIAC’s intention to acquire residential parcels as soon as 2012, subject to availabili ty of funding.2 Subject to the provisi ons of the Part 150 <strong>Program</strong>.3 Based on the <strong>FEIS</strong> Alternati ve B4 2015 DNL 70 dB noise contour.4 Based on the <strong>FEIS</strong> Alternati ve B4 2020 DNL 70 dB noise contour wi th neighborhood rounding.5 Based on the <strong>FEIS</strong> Alternati ve B4 2025 DNL 70 dB noise contour.The FAA and RIAC closely reviewed the Project-related noise contours in order to maintain neighborhoodcohesion and limit community disruption due to land acquisition. The FAA can only fund noise mitigation(sound insulation or land acquisition) on properties where noise levels caused by a project meet specific federalcriteria. If a residential property is located within the DNL 65 dB noise contour then it is considered anincompatible land use and federal funds can be used for noise mitigation on that property. Most airportsmitigate noise between the DNL 65 and 69 dB noise contours by offering sound insulation, and mitigate fornoise above the DNL 70 dB noise contour by offering to acquire the residential properties and relocate theoccupants. FAA Order 5100.38 provides the following guidance to the FAA on how it may consider additionalproperties eligible for noise mitigation: “...projects within DNL 65 dB may be expanded beyond the DNL 65 dBcontour to include a reasonable additional number of otherwise ineligible parcels contiguous to the ProjectArea, if necessary to achieve equity in the neighborhood. Neighborhood or street boundary lines may helpdetermine what is reasonable, in addition to numbers of properties.” 475 For the purposes of this <strong>FEIS</strong>, thisconcept of "neighborhood equity,” also referred to as "neighborhood rounding”, has been applied where theFAA identified some residential parcels outside the DNL 70 dB noise contour as eligible for federal noisemitigation funding. This includes homes where any portion of the lot was included inside the DNL 70 dB noisecontour, homes that would have been the few remaining residences on the block (or dead-end street) after theproject, homes that would be left isolated or surrounded by non-residential land use, etc.6.2.4.3 Residential Sound InsulationRIAC will provide a future sound insulation program for residences exposed to noise levels betweenDNL 65 dB and 69 dB (in accordance with Part 150 requirements). Table 6-6 shows the number of newly eligibleresidential units after taking previously sound insulated residences into account. Refer to the ‘Sound InsulationProcess’ presented in the previous section for a description of how residences and non-residential noise475 FAA Order 5100.38C, <strong>Airport</strong> <strong>Improvement</strong> <strong>Program</strong> Handbook, U.S. Department of Transportation, Chapter 8, section 810.b, page 137, effective June 28,2005.Chapter 6 – Mitigation 6-13 July 2011\\Mawatr\ev\09228.00\reports\<strong>FEIS</strong>_Final_July_2011\<strong>PVD</strong>_CH06_Mitigation_JUL_2011.doc
T.F. <strong>Green</strong> <strong>Airport</strong> <strong>Improvement</strong> <strong>Program</strong>Environmental Impact Statement and Final Section 4(f) Evaluationsensitive sites would be sound insulated as noise mitigation. Assuming that FAA funding is made available,RIAC would begin the sound insulation program following the last phase of project-related land acquisitionmitigation.Table 6-6Alternative B4: Residential Units Newly Eligible for Participation in a Future SoundInsulation <strong>Program</strong> for Noise Mitigation under Part 150 1Analysis YearResidential Units SoundResidential Units Exposed to Insulated as part of a PreviousSound Levels between DNL Sound Insulation Effort Under65 dB and 69 dB 1 Part 150 NCP 1Remaining Residential UnitsNewly Eligible for VoluntaryParticipation in a FutureSound Insulation <strong>Program</strong> 12015 959 877 82 220202025Source:Note:121,1201,400RIGIS: Field verification by VHB, Inc., 2005; City of Warwick Assessor’s Parcel Data.Represents the number of housing units affected by noise during a specific year and are not cumulati ve.Incl udes homes exposed to noise levels up to DNL 69.9 dB. Totals include all eligible properties within the DNL 65 dB contour only, excluding Project-related acquisiti ons.As noted, the numbers presented are not cumulative. Through 2025, a total of 324 housing units would be newly eligible for Project-related noise mitigation(sound insulation) due to significant noise impacts (82 units in 2015, 75 additional units i n 2020, and 167 additi onal units i n 2025).6.2.4.4 Install Noise Barriers or Berms on Main AvenueIn accordance with RIDOT criteria for vehicular traffic noise, the feasibility of constructing noise barriers orberms has been examined and consideration will be provided wherever vehicular traffic noise impact isexpected to occur as a result of the proposed road changes. Preliminary results indicate that noise barriers orberms appear to be feasible at six locations along Realigned Main Avenue under Alternative B4 (Figure 6-1).Table 6-7 describes and locates these feasible barriers, and provides preliminary data for the barriers includingtheir physical size, insertion loss (noise reduction), total cost, and cost per protected home. Barriers 2 and 4 ofthe DEIS Level 6 noise analysis required revision as part of this <strong>FEIS</strong> because Barrier 2 and one section ofBarrier 4 are no longer feasible. The DEIS Level 6 Barrier 2 was eliminated and, therefore, the remaining barriershave been re-numbered for this <strong>FEIS</strong>. The remaining section of Barrier 4 between Morse and Palace Avenueswas still able to be designed cost-effectively. Also, since the DEIS, it has been determined that the DEIS Barrier 5(now Barrier 4) is not in the protected airspace. The portion of Barrier 4 that is located in the RPZ would mostlikely be constructed as a berm.9631,076157 2324 2At five of the locations, the preliminary noise barrier/berm designs appear to meet RIDOT’s Cost EffectivenessIndex (CEI) of $2,500/dBA(IL)/unit or $25,000/unit. As described above, all noise barriers/berms identified asreasonable and feasible may be included in the project plans and specifications as appropriate followingRIDOT’s protocol. As part of the RIDOT process, homeowners would be consulted after the ROD has beenissued and as part of the design process. Seventy-five percent of the abutters would need to agree to constructthe noise barrier. Barriers not agreed to by the abutters would not be carried through for additional design.Barriers that are carried through for additional design will also need to be shown not to conflict with line-ofsightat intersections or conflict with underground utilities.Chapter 6 – Mitigation 6-14 July 2011\\Mawatr\ev\09228.00\reports\<strong>FEIS</strong>_Final_July_2011\<strong>PVD</strong>_CH06_Mitigation_JUL_2011.doc
T.F. <strong>Green</strong> <strong>Airport</strong> <strong>Improvement</strong> <strong>Program</strong>Environmental Impact Statement and Final Section 4(f) EvaluationTable 6-7Alternative B4: Summary of Potential Noise BarriersBarrier Project Road NeighborhoodLength(feet)(feet) Cost 1 Loss (dB)Range ofHeightInsertionNumber ofProtectedDwelling UnitsCEI($$/unit) 2CEI ($$/dBA(IL)/unit) 31 Main Ave <strong>Green</strong>wood 114 12 $27,300 13 1 $27,300 $2,1502 Main Ave <strong>Green</strong>wood 106 12 $25,480 6 1 $25,480 $4,5503 Main Ave <strong>Green</strong>wood 278 12 $66,660 14 2 $33,330 $2,4334 Main Ave <strong>Green</strong>wood 1,398 12 $335,520 5 to 15 15 $22,368 $2,1725 Main Ave <strong>Green</strong>wood 468 12 $112,420 8 to 10 7 $16,060 $1,7276 Main Ave <strong>Green</strong>wood 230 12 $55,280 10 to 15 2 $27,640 $2,229Note: See Figure 6-1 for location of the proposed noise barriers.Source: HMMH, 2011.1 Estimated barrier costs based on a unit cost of $20/square-feet.2 The cost-effectiveness index (CEI) was calculated two different ways, both of which are according to RIDOT policy. In the second column from the right, the CEI was computed in units of cost per protected dwelling unit ($/unit). Per RIDOT, a barrier is cost effective if the CEI, calculated in this manner, is less than or equalto $25,000/unit.3 The cost-effectiveness index (CEI) was calculated two different ways, both of which are according to RIDOT policy. In the rightmost column, the CEI wascomputed in units of cost per decibel of weighted insertion loss per protected dwelling unit ($/dBA(IL)/unit). Per RIDOT, a barrier is cost effective if the CEI,calculated in this manner, is less than or equal to $2,500.00/dbA(IL)/unit.Although both noise barriers (or “sound walls”) and berms both can provide effective noise mitigation, use ofberms often is limited by available right-of-way. Typically, berms are graded with a maximum vertical-tohorizontalslope of 1:2. That is, for each one foot of height, each side of the berm requires two feet of horizontalright of way. Therefore, a 12-foot high berm typically would require a minimum 48-foot footprint along its entirelength. The berm would look like a small hill along the roadway. In the majority of the Project Area, the use ofberms, rather than noise barriers, would require the acquisition of additional property or easements. Thewestern portion of Barrier 4 (Figure 6-1) that is on RIAC property is one area where a berm could be reasonablyconstructed. This area is already owned by RIAC and a wide footprint would not be a constraint. Furtherevaluation of the feasibility of constructing berms as an alternative to noise barriers will occur during laterstages of project design for the Preferred Alternative. Wherever possible the noise barriers or berms would beattractively landscaped and would be designed to not be an obstruction to air traffic.6.2.4.5 Install Quiet Pavement on Relocated <strong>Airport</strong> Road and Main AvenueAs part of constructing Partially Relocated <strong>Airport</strong> Road and Realigned Main Avenue for Alternative B4, RIACproposes to install open-graded asphaltic concrete (OGAC) pavement, or other quieter pavement, subject toRIDOT approval. Quieter pavement is a relative term for any pavement that produces less noise than another fromthe action of vehicle tires rolling over it. Quieter pavements are not limited to either asphalt or concrete, but ratherincorporate known practices, such as fine-tuning texture and/or porosity, to make either quieter. These measureshave the potential to reduce traffic noise levels by one to two decibels for nearby receptors, when compared toconventional pavement. These benefits tend to be greatest when traffic is mostly cars, speeds are greater than30 mph, and traffic is free flowing. In other cases, the roadside noise reduction from a quieter pavement can beChapter 6 – Mitigation 6-15 July 2011\\Mawatr\ev\09228.00\reports\<strong>FEIS</strong>_Final_July_2011\<strong>PVD</strong>_CH06_Mitigation_JUL_2011.doc
T.F. <strong>Green</strong> <strong>Airport</strong> <strong>Improvement</strong> <strong>Program</strong>Environmental Impact Statement and Final Section 4(f) Evaluationdiminished because of other noise contributors, such as engine and exhaust noise. 476 This is particularly true whenthere are many trucks, traffic speeds are slow or variable, and/or the road is on a grade.6.3 Compatible Land UseAlternative B4 was developed to avoid land use impacts to the residential communities and businesses north ofthe <strong>Airport</strong> and to minimize the amount of construction-related residential and commercial land acquisition bylimiting construction as much as possible to land already owned by RIAC located south of the Runway 5 End.6.3.1 Mitigation for Significant Compatible Land Use Impacts for Alternative B4As discussed in Section 6.2, Noise, mitigation in the form of sound insulation is proposed for compatible landuse impacts related to a significant increase in noise to noise-sensitive land uses (residential) as well asnon-residential noise-sensitive sites (e.g., schools). Commercial, industrial, and agricultural uses, however, areconsidered to be compatible with all noise levels and do not require noise level reduction measures.6.3.2 Mitigation for Other Compatible Land Use Impacts for Alternative B4As presented in Section 6.2, Noise, additional mitigation for aircraft noise impacts would be provided inaccordance with the criteria of Part 150, including acquisition of residential parcels exposed to noise levels ofDNL dB 70 and above through participation in a VLAP. Land use impacts and proposed mitigation addressedin this section are associated with changes to land use due to Project-related land acquisition, includingmandatory land acquisition due to construction in 2015, and voluntary due to noise mitigation (as presented inSection 6.2, Noise) and FAA-recommended RPZ clearing. Compatible land use mitigation is proposed for otherland use impacts include the following:• See Section 6.2, Noise, for potential mitigation for other noise impacts on noise-sensitive land uses.• See Section 6.4, Social and Socioeconomic, and Environmental Justice and Children’s Health and Safety Risks, forrequired mitigation for all full and partial land acquisitions (a relocation process, in accordance with theUniform Relocation Assistance and Real Property Acquisition Policies Act of 1970 requirements).• Update Noise Land Reuse Plan.6.3.2.1 Noise Land Reuse Plan UpdateUpon completion of the EIS process and in accordance with FAA guidelines (specifically <strong>Program</strong> GuidanceLetter 08-2, or PGL 08-2, dated February 1, 2008), RIAC will update the Noise Land Reuse Plan and willcontinue to consult with the City of Warwick to develop compatible land uses for those lands deemed notrequired for airport purposes. RIAC will update the Noise Land Reuse Plan as EIS projects are implemented orwithin 18 months of the issuance of the ROD, whichever comes first.476 Background information on quieter pavements excerpted from “Questions and Answers About Quieter Pavements,” developed by the Tire-Pavement NoiseResearch Consortium under Transportation Pooled Fund project number TPF-5(135), January 2011.Chapter 6 – Mitigation 6-16 July 2011\\Mawatr\ev\09228.00\reports\<strong>FEIS</strong>_Final_July_2011\<strong>PVD</strong>_CH06_Mitigation_JUL_2011.doc
T.F. <strong>Green</strong> <strong>Airport</strong> <strong>Improvement</strong> <strong>Program</strong>Environmental Impact Statement and Final Section 4(f) EvaluationRIAC’s Noise Land Reuse PlanFollowing land acquisition under the Part 150 process, an airport operator is required to document itsacquisitions (also known as “noise lands”). 477 Whether unneeded noise land is sold, kept by the airport andleased, or kept by the airport for airport purposes is the airport operator’s decision. In accordance with FAAGrant Assurances and guidance to manage land acquired by airports under its Part 150 NCP (<strong>Program</strong>Guidance Letter 08-2, Management of Acquired Noise Land: Inventory, Reuse, Disposal, or PGL 08-2, issued inFebruary 2008 478 ), RIAC has compiled a list of all lands acquired under the Completed Part 150 VLAP and theircurrent usage to determine if land is required for airport purposes as part of a Noise Land Reuse Plan. As EISprojects are implemented, or within 18 months of the issuance of the ROD, whichever comes first, RIAC willupdate the Noise Land Reuse Plan. RIAC’s Noise Land Update will first determine what noise lands, if any, arerequired for airport development purposes. RIAC will then consider other compatible uses for release of theselands in an Update.RIAC will continue to maintain the airport noise lands (i.e., mowing and providing airport police surveillance).Structures are demolished as quickly as possible following acquisition; however, the timeline for demolitiondepends on when asbestos abatement is completed and the time of year. RIAC does not remove any existingtrees or vegetation during demolition unless it is related to an obstruction removal project, per FAA regulation.Potential Reuse of Noise LandsFor those lands that will not be needed for airport purposes, there are many potential reuse outcomes dependanton a number of factors such as, the size of the available vacant land, the access to that land, and state andmunicipal planning processes. Under the FAA Grant Assurances, RIAC is restricted from releasing any noiselands for land uses considered incompatible due to noise, such as residential land uses. RIAC cannot provide forvisual buffers, open space, or other uses that might interfere with the intended, viable reuse. After updating itsNoise Land Reuse Plan, RIAC will attempt to coordinate with the City of Warwick to rezone land, asappropriate, to allow compatible land uses, such as commercial or industrial land uses for those lands that willnot be needed for airport purposes and will be released for private development. Upon completion of the <strong>FEIS</strong>,it is anticipated that the City of Warwick will update its Comprehensive Plan to reflect land use changes as aresult of the T.F. <strong>Green</strong> <strong>Airport</strong> <strong>Improvement</strong> <strong>Program</strong> and to ensure its consistency with the State Guide Plan.As recommended as part of the 2000 Part 150 Study Update, updates to the Comprehensive Plan should addressinformal and formal fair disclosure policies, encourage amendments to the building code, and, whereappropriate, recommend zoning that is compatible with the <strong>Airport</strong>. RIAC is currently participating in theCity’s update of its Comprehensive Plan.As discussed in Chapter 7, Final Section 4(f)/Section 6(f) Evaluation, one example of reuse of RIAC’s noise lands is forthe replacement of park facilities impacted by the T.F. <strong>Green</strong> <strong>Airport</strong> <strong>Improvement</strong> <strong>Program</strong>. Since the DEIS, RIAChas selected the Cedar Swamp Road site as the location for the replacement Winslow Park facilities (refer toFigure 7-10). This site is just east of the <strong>Airport</strong> is part of the RIAC’s noise lands under a previous Part 150 VLAP.477 According to FAA <strong>Program</strong> Guidance Letter 08-02, Noise Land is land that is acquired to remove or prevent an incompatible land use and then disposed ofso that it can be developed compatibly.478 The Federal Aviation Administration, Federal Guidance Letter, 08-02, Management of Acquired Noise Land: Inventory - Reuse – Disposal, February 1,2008 (last updated 3/26/2009).Chapter 6 – Mitigation 6-17 July 2011\\Mawatr\ev\09228.00\reports\<strong>FEIS</strong>_Final_July_2011\<strong>PVD</strong>_CH06_Mitigation_JUL_2011.doc
T.F. <strong>Green</strong> <strong>Airport</strong> <strong>Improvement</strong> <strong>Program</strong>Environmental Impact Statement and Final Section 4(f) EvaluationThe impacts to Winslow Park are unavoidable since Winslow Park lies with the RPZ under the No-ActionAlternative and Alternatives B2 and B4 (refer to Chapter 7, Final Section 4(f)/Section 6(f) Evaluation). 4796.4 Social and Socioeconomic, and Environmental Justice and Children’s Healthand Safety RisksUnder Alternative B4, designing the Runway 5 End in order to allow for effective and efficient realignment ofMain Avenue would avoid the need to tunnel Main Avenue. As discussed in Section 5.5, Social andSocioeconomic, and Environmental Justice and Children’s Health and Safety Risks, of Chapter 5, EnvironmentalConsequences, Alternative B4 would not result in significant impacts to social and socioeconomic conditions.Also, Alternative B4 would not result in a disproportionate effect on the socioeconomic environment or result indisproportionate adverse impacts to environmental justice populations (minority, Hispanic, or low-incomepopulations) and, therefore, no mitigation measures are required. In addition, there are no significant impacts tochildren’s health and safety.Other social and socioeconomic impacts addressed in this section include the relocation of residences andbusinesses due to mandatory and voluntary property acquisitions.6.4.1 Mitigation for Other Social and Socioeconomic Impacts for Alternative B4Alternative B4 would result in the relocation of residences and businesses due to mandatory and voluntaryproperty acquisitions. Refer to Table 5-42 for a summary of property acquisitions. The relocation process for thefull and partial property acquisitions would be carried out in accordance with the Uniform Relocation Act(URA) requirements, as described below and fully in Appendix G.4, Conceptual Relocation Plan, of this <strong>FEIS</strong>.6.4.1.1 Relocate and Compensate According to the Uniform Relocation ActThe purpose of the URA is to promulgate rules to implement the programs in accordance with the followingobjectives:• To ensure owners of real property to be acquired for federal and federally assisted projects are treated fairlyand consistently, to encourage and expedite acquisition by agreements with such owners, to minimizelitigation and relieve congestion in the courts, and to promote public confidence in federal and federallyassisted land acquisition programs;• To ensure persons displaced as a direct result of federal or federally assisted projects are treated fairly,consistently, and equitably so that such displaced persons would not suffer disproportionate injuries as aresult of projects designed for the benefit of the public as a whole; and• To ensure agencies implement these regulations in a manner that is efficient and cost effective.In order to assure that each owner affected by the T.F. <strong>Green</strong> <strong>Airport</strong> <strong>Improvement</strong> <strong>Program</strong> is treated fairly andconsistently, the process required by the URA will be followed.479 U.S. Department of Transportation Act of 1966, Section 4(f), 49 U.S.C., section 303(c), or Section 4(f), requires DOT agencies to protect certain public resources.Chapter 6 – Mitigation 6-18 July 2011\\Mawatr\ev\09228.00\reports\<strong>FEIS</strong>_Final_July_2011\<strong>PVD</strong>_CH06_Mitigation_JUL_2011.doc
T.F. <strong>Green</strong> <strong>Airport</strong> <strong>Improvement</strong> <strong>Program</strong>Environmental Impact Statement and Final Section 4(f) EvaluationThe conceptual relocation plan provided in Appendix G.4, Conceptual Relocation Plan, of this <strong>FEIS</strong> includes thefollowing:• An estimate of number of displaced households and businesses• General discussion of available housing• Discussion of relocation advisory services and benefits available• Estimate of costs to implement the program• General discussion of past challenges and impacts on market6.5 Surface TransportationOff-airport roadway improvements to the <strong>Airport</strong> Connector, Post Road, <strong>Airport</strong> Road, Warwick Avenue(under Alternative B2), and Main Avenue (under Alternative B4) have been proposed to ensure that the impactsof additional traffic demands are avoided or minimized. These roadway improvements would incorporatesidewalks, shoulders, and bus stops where possible so that pedestrians and bicyclists would be betteraccommodated. The proposed Main Avenue Realignment under Alternative B4 was modified to include adesign of the Runway 5 End in order to reduce the curve in Main Avenue for more efficient roadway design,avoidance of cemetery impacts, and reduced land acquisition.Based on the traffic analysis findings presented in Chapter 5, Environmental Consequences, there would be nosignificant impacts because there would be no permanent disruption to local traffic patterns that wouldsubstantially reduce the Level of Service (LOS) of roads serving the <strong>Airport</strong> and its surrounding communities.Where the traffic analysis revealed intersections with degraded LOS, mitigation measures were included in theproposed roadway improvement, so that the proposed roadways would meet RIDOT requirements.The following measures would be constructed concurrently with the Preferred Alternative and would becoordinated with the appropriate local, state, and federal agencies:• Geometry and signal improvements associated with construction of Partially Relocated <strong>Airport</strong> Road;• Relocation of existing traffic signals associated with the realignment of Main Avenue;• Optimization of study area traffic signal timings and phasing as necessary to support traffic volumes onstudy roadways at the time of construction.Alternative B4 would not cause an adverse impact at any of the signalized intersections in the Study Area in2015, 2020, or 2025. Once projected 2020 traffic volumes are realized, minor signal timing changes are proposed,as necessary, at the majority of study area intersections to support general traffic growth both related andunrelated to the <strong>Airport</strong>. It is envisioned that these changes would be designed and implemented duringconstruction of terminal roadway improvements. RIAC and FAA have continued to coordinate with FHWA andRIDOT on the design of the surface transportation improvements. No additional recommendations formitigation were made by FHWA and RIDOT on the conceptual level plans developed as part of the EIS process.Chapter 6 – Mitigation 6-19 July 2011\\Mawatr\ev\09228.00\reports\<strong>FEIS</strong>_Final_July_2011\<strong>PVD</strong>_CH06_Mitigation_JUL_2011.doc
T.F. <strong>Green</strong> <strong>Airport</strong> <strong>Improvement</strong> <strong>Program</strong>Environmental Impact Statement and Final Section 4(f) Evaluation6.5.1 Mitigation for Other Surface Transportation Impacts for Alternative B4Proposed surface transportation enhancements for the Preferred Alternative include:• Incorporating relocated ‘Park and Ride’ facilities and relocated RIPTA bus stops into the roadwaymodifications; and• Providing pedestrian and bicycle accommodations as appropriate as part of the roadway relocation andrealignment projects if practicable.6.5.1.1 Identify Bus Stops and Park and Ride FacilityRIAC will coordinate with the appropriate decision makers at RIPTA to ensure that any bus stops affected bythe relocation of <strong>Airport</strong> Road or the realignment of Main Avenue are replaced as appropriate along the newportions of each roadway. RIAC will coordinate with RIDOT to identify possible locations for a new park andride facility.6.5.1.2 Provide Pedestrian and Bicycle AccommodationsAppropriate pedestrian and bicycle accommodations will be provided along the newly constructed portions of<strong>Airport</strong> Road and Main Avenue. These accommodations will be identified further in the design phase of theproject through continued coordination with RIDOT and would conform to RIDOT’s preferred “completestreets” guidance. Sidewalks, wheelchair ramps, and pedestrian accommodations at existing traffic signalswould be upgraded along the reconstructed portions of the roadway to comply with the American’s withDisabilities Act, and all applicable state and local statutes. All roadway designs and layouts (i.e., CompleteStreets) would adhere to the applicable policies of RIDOT, and RIDOT would be involved in the design process.The roadway design details could follow the conclusion of the NEPA process, which would include locations ofimprovements, sidewalk widths, bus stops (location and amenities), crosswalks, and bike accommodations.6.6 Air QualityProject impacts affecting air quality were assessed according to whether the impact was significant. Inaccordance with the NAAQS, 480 the air quality impact assessment findings show that Alternatives B2 and B4 arenot expected to have a significant effect on air quality conditions locally, regionally, or statewide (seeSection 5.7, Air Quality, of Chapter 5, Environmental Consequences). Therefore, no specific air quality avoidance,minimization, or mitigation measures are required under NEPA or the General Conformity Rule. Other impactsrelated to air quality associated with the construction activities would be mitigated as described below inSection 6.19, Construction Period Mitigation. The construction period air quality mitigation was expanded basedon comments the FAA received on the DEIS.6.7 Historic, Architectural, Archaeological, and Cultural ResourcesMitigation is proposed for T.F. <strong>Green</strong> <strong>Airport</strong> <strong>Improvement</strong> <strong>Program</strong> impacts on historical, architectural,archaeological, and cultural resources that would have an adverse affect on a resource (a taking or alteration of480 CFR Title 40, Part 50.Chapter 6 – Mitigation 6-20 July 2011\\Mawatr\ev\09228.00\reports\<strong>FEIS</strong>_Final_July_2011\<strong>PVD</strong>_CH06_Mitigation_JUL_2011.doc
T.F. <strong>Green</strong> <strong>Airport</strong> <strong>Improvement</strong> <strong>Program</strong>Environmental Impact Statement and Final Section 4(f) Evaluationthe characteristics that make the resource eligible for listing in the NRHP). Alternative B4 would not causeimpacts on historical properties as a result of a significant increase in noise levels; however, Alternative B4would have an adverse effect on NRHP-listed and eligible historical resources. The FAA consulted with RIHPHC and the NITHPO to develop mitigation for impacts on historical, architectural, archaeological, andcultural resources.Mitigation measures for significant Project-related impacts to historical, architectural, archaeological, andcultural resources include:• Prepare archival documentation for the NRHP eligible airport historic district (including the HistoricDistrict, State Terminal, and Hangar No. 1) 481• Develop an interpretive display (physical and electronic) depicting the historical development of the<strong>Airport</strong>.• Prepare list of items from Hangar No. 1 for possible salvage and curation.• Define boundaries of Warwick Historical Cemetery Nos. 26, 76, 77, and 78, assess potential impacts, consultto protect (avoid or mitigate).• For Warwick Historical Cemetery 26 (WHC 26), potential mitigation could include laying the headstones flat with protection, relocating the headstones, or other relocation measures determined by the WarwickHistorical Cemetery Commission through permitting.• Conduct archaeological investigations as needed in areas of proposed direct impacts not previously surveyed (e.g., wetland mitigation areas, Realigned Main Avenue, etc.).Mitigation for other historical, architectural, archaeological, and cultural resources impacts includes:• RIAC continuing to consult with the Warwick Historical Cemetery Commission per Rhode Island GeneralLaw 23-18-11 et seq. and Chapter 12 of the Code of Ordinances of the City of Warwick to address potentialimpacts to four historical cemeteries located within the area of direct impacts.When an undertaking results in a finding of adverse effect, Section 106 requires federal agencies to consult withthe appropriate SHPO and THPO and other consulting parties to develop and evaluate alternatives ormodifications that could avoid, minimize, or mitigate adverse effects on historical properties. Section 5.8.8.1,Avoidance, and 5.8.8.2, Minimization, of Chapter 5, Environmental Consequences, discuss avoidance andminimization used to reduce impacts to historical properties, archaeological sites, and historical cemeteries.6.7.1 Mitigation for Significant Historical Resources Impacts for Alternative B4Table 6-8 presents the adverse effects to historical and archaeological resources for Alternative B4.481 The level of documentation, either HABS/HAER or RIHRA will be determined through consultation.Chapter 6 – Mitigation 6-21 July 2011\\Mawatr\ev\09228.00\reports\<strong>FEIS</strong>_Final_July_2011\<strong>PVD</strong>_CH06_Mitigation_JUL_2011.doc
T.F. <strong>Green</strong> <strong>Airport</strong> <strong>Improvement</strong> <strong>Program</strong>Environmental Impact Statement and Final Section 4(f) EvaluationTable 6-8Alternative B4: Summary of Adverse Effects to Historical and Archaeological ResourcesProperty Adverse Effect Reason for Adverse Effect Type of Adverse EffectEligible <strong>Airport</strong> Historic DistrictDemolish Hangar No. 1, diminishedpublic view, alter historicalrunway/taxiway configurationRemove airspace obstruction andairside modifications andenhancementsSignificant Direct and IndirectImpactsHangar No. 1 Demolish Hangar No. 1 Remove airspace obstruction Significant Direct ImpactRhode Island State TerminalLandside landscaping removal anddiminished public viewConstruction of split IntegratedCargo FacilitySignificant Direct and IndirectImpactWHC 26 Headstones impact Clear Object Free Area Significant Direct ImpactSources: The Public Archaeology Laboratory, Inc.; VHB, Inc.; National Register Database; Rhode Island Cemetery Database; and RIGIS.FAA and RIAC have consulted with the RIHPHC and NITHPO regarding the adverse effect of the project onhistorical properties and locally important historical cemeteries. This consultation has resulted in a signedMemorandum of Agreement (MOA) that includes stipulations to address and mitigate the adverse effect of theproject. The executed MOA has been submitted by the FAA to the Advisory Council of Historic Preservation(ACHP) (for filing) along with supporting documentation as specified in 36 CFR Part 800.11(f). Refer toAppendix I, Historic, Architectural, Archaeological, and Cultural Resources, for a signed copy of the MOA. TheMOA stipulations are described in the following sections.6.7.1.1 Historical Properties Archival DocumentationThe FAA will consult with the Historic American Buildings Survey/Historic American Engineering Record(HABS/HAER) to determine if Hangar 1 and the eligible airport historic district are appropriate subjects fortheir archives.RIAC will prepare appropriate documentation, either HABS/HAER or Rhode Island Historic ResourcesArchive (RIHRA) of the eligible airport historic district. The documentation will be completed by a qualifiedprofessional who meets the standards and regulations provided in the Archaeology and Historic Preservation:Secretary of the Interior’s Standards and Guidelines [48 FR 190 (1983)], 482 and shall include a narrative report, largeformat photographs, and other graphic materials, all prepared to meet archival standards. Unless otherwiseagreed to by HABS/HAER or RIHPHC, the FAA shall ensure that all documentary recording is completed andaccepted prior to the initiation of construction, and that copies of this documentation are made available to theappropriate federal, state and local archives designated by HABS/HAER or RIHPHC.6.7.1.2 Interpretive DisplayRIAC, in consultation with the RIHPHC, shall develop a display that interprets the historical significance of theeligible airport historic district to the public. The display will incorporate images of historical views, plans, and/orhistorical documents; archival documentation photographs; and narrative information describing the history andsignificance of the airport. Themes that will be addressed will include, but may not be limited to, the eventsleading up to the establishment of the Hillsgrove State <strong>Airport</strong> as the first state airport in the nation, its use by the482 Archeology and Historic Preservation: Secretary of the Interior's Standards and Guidelines, [as amended and annotated] www.cr.nps.gov/locallaw/arch_stnds_0.htm.Chapter 6 – Mitigation 6-22 July 2011\\Mawatr\ev\09228.00\reports\<strong>FEIS</strong>_Final_July_2011\<strong>PVD</strong>_CH06_Mitigation_JUL_2011.doc
T.F. <strong>Green</strong> <strong>Airport</strong> <strong>Improvement</strong> <strong>Program</strong>Environmental Impact Statement and Final Section 4(f) Evaluationmilitary during World War II and the Cold War; significant events in its physical evolution over time, includinginformation about the T.F. <strong>Green</strong> <strong>Airport</strong> <strong>Improvement</strong> <strong>Program</strong>; and the architectural and engineeringsignificance of the buildings and structures within the eligible airport historic district. The display will be in apanel format located in the existing passenger terminal and electronically posted on the RIAC website.6.7.1.3 Architectural SalvageBefore the demolition of Hangar No. 1, RIAC shall, in consultation with the RIHPHC, prepare an inventory ofsignificant architectural items or features that might be salvaged from the building. The inventory will becompiled by a qualified professional who meets the standards and regulations provided in the Secretary of theInterior’s standards and guidelines for archaeology and historic preservation. It will consist of a list of the itemsor features along with photographs and a site plan showing their location within the building. Subject to federalgrant, state property and purchasing requirements, and subject to the consent of the property owner, the RhodeIsland Department of Transportation, RIAC shall provide an opportunity for local and regional historicalmuseums, historical societies, or other public organizations to express an interest in significant salvageablearchitectural items or features for interpretation purposes and permanent display accessible to the public. A listof organizations to be contacted will be compiled in consultation with the RIHPHC.6.7.1.4 Define and Protect Archaeological ResourcesFAA shall consult with the RIHPHC and NITHPO to develop appropriate archaeological surveys to identifyarchaeological sites and evaluate their significance and eligibility to the NRHP in areas of potential effectunknown at this time if not previously surveyed. If a site is determined eligible for listing in the NRHP, FAAwill further coordinate with RIHPHC and NITHPO to review avoidance and/or mitigation options.In the event that potentially significant archaeological sites are encountered during construction RIAC woulddetermine what actions can be taken to resolve any adverse effects and would notify the RIHPHC and NITHPO,as well as the Advisory Council on Historic Preservation (ACHP). Any subsequent actions undertaken by RIACwould reflect RIHPHC, NITHPO, and ACHP comments.6.7.1.5 Mitigate Impacts to Warwick Historical Cemetery 26For the direct impacts to WHC 26, potential mitigation could include laying the headstones flat with protection,relocating the headstones, or other relocation measures determined by the Warwick Historical CemeteryCommission through permitting.6.7.2 Mitigation for Other Historical Resources Impacts for Alternative B4While none of the Rhode Island Historical Cemeteries identified within the APE meet the criteria for listing inthe NRHP and, therefore, are not considered historical properties under Section 106 of the National HistoricPreservation Act, they are afforded certain protections under Rhode Island General Law 23-18-11 et seq., whichconditionally prohibits any town or city to permit “construction, excavation or other ground disturbing activitywithin 25 feet of a recorded historical cemetery.” Table 6-9 summarizes the impacts on historical cemeteries forAlternative B4.Chapter 6 – Mitigation 6-23 July 2011\\Mawatr\ev\09228.00\reports\<strong>FEIS</strong>_Final_July_2011\<strong>PVD</strong>_CH06_Mitigation_JUL_2011.doc
T.F. <strong>Green</strong> <strong>Airport</strong> <strong>Improvement</strong> <strong>Program</strong>Environmental Impact Statement and Final Section 4(f) EvaluationTable 6-9Alternative B4: Summary of Impacts to Historical CemeteriesProperty Impact Reason for Impact Type of ImpactWHC 26 Headstones impact Clear Object Free Area andPart 77 Primary SurfaceSignificant Direct ImpactWHC 76 Voluntary Land Acquisition Project-related Noise Impacts Potential Direct Impact 1WHC 77 Construction potentially occurring within 25 feet of WHC 77 Realigning Main Avenue Potential Significant Direct Impact 2WHC 78 Construction potentially occurring within 25 feet of WHC 78 Realigning Main Avenue Potential Significant Direct Impact 2Sources: The Public Archaeology Laboratory, Inc.; VHB, Inc.; National Register Database; Rhode Island Cemetery Database; and RIGIS.WHC Warwick Historical Cemetery.1 Alternative B4 may result in a potential significant direct impact to WHC 76 because it lies within an area of Future Build VLAP for noise mitigation. If abutting landowners elect to have their property acquired and the building is demolished, potential impacts to WHC 76 will be evaluated by FAA and RIAC in consultationwith the WHCC prior to any acquisition, per stipulations contained in the MOA.2 Alternative B4 may result in a potential significant direct impact to WHC 77 and 78 due to Realigned Main Avenue; however, the boundaries of WHC 77 and 78are based on the City’s plat maps and have not been field verified. Once permission is granted to strip top soils around the perimeter of visible headstones atthese cemeteries and the boundaries of WHC 77 and 78 are fully confirmed, the significant, or direct (physical), impact can be identified. For the purposes of thisEIS, it is assumed that the redesign of Realigned Main Avenue to avoid the cemeteries will be implemented in final design.6.7.2.1 Consult with Warwick Historical Cemetery CommissionRIAC will continue to consult with the Warwick Historical Cemetery Commission per Rhode Island GeneralLaw 23-18-11 et seq. and Chapter 12 of the Code of Ordinances of the City of Warwick to address potentialimpacts to four historical cemeteries located within the area of direct impacts. The limits of each cemetery willbe defined through archaeological investigations and the location of project impacts with respect to cemeteryboundaries will be assessed. If project impacts occur within, or within 25 feet of, any cemetery RIAC will consultwith the Warwick Historical Cemetery Commission and the City of Warwick to develop measures to avoid ormitigate the project impacts.6.8 Section 4(f) ResourcesMitigation is proposed for the Section 4(f) resources that will be physically or constructively used underAlternative B4: the eligible airport historic district; Hangar No. 1; the Rhode Island State <strong>Airport</strong> Terminal; andWinslow Park. Mitigation and a detailed analysis of alternatives evaluated to avoid use of Section 4(f) resourcesis described more fully in the Section 4(f) evaluation found in Chapter 7, Final Section 4(f)/Section 6(f) Evaluation.Mitigation for historical resources protected under Section 4(f) is described in Section 6.7, Historic, Architectural,Archaeological, and Cultural Resources.6.8.1 Mitigation for Significant Section 4(f) Resources Impacts for Alternative B4Mitigation for significant impacts to Section 4(f) resources includes:• Replace Winslow Park recreation facilities that are impacted on another site to mitigate for the Physical Useimpact. The FAA received comments from the community on Winslow Park facilities and associated trafficand parking and used them in its evaluation of the relocation plan.Chapter 6 – Mitigation 6-24 July 2011\\Mawatr\ev\09228.00\reports\<strong>FEIS</strong>_Final_July_2011\<strong>PVD</strong>_CH06_Mitigation_JUL_2011.doc
T.F. <strong>Green</strong> <strong>Airport</strong> <strong>Improvement</strong> <strong>Program</strong>Environmental Impact Statement and Final Section 4(f) Evaluation• Mitigation for eligible airport historic district and Hangar No. 1 (refer to Section 6.7, Historic, Architectural,Archaeological, and Cultural Resources).6.8.1.1 Replace Winslow Park Recreation FacilitiesUnder Alternative B4, Winslow Park recreational facilities (four full-sized softball fields, a clubhouse, twoparking lots, a playground, and soccer fields) would be significantly impacted in order to remove incompatibleland uses from the RPZ at the Runway 5 End. The impacted recreation facilities (those within the RPZ) wouldbe replaced at another site as mitigation. The facilities that are not within the RPZ (two smaller softball fields,walking path, and one playground) could remain at the current Winslow Park. These park facilities couldcontinue to serve as a recreational resource for Warwick residents and the adjacent <strong>Green</strong>wood neighborhood.Refer to Chapter 7, Final Section 4(f)/Section 6(f) Evaluation, for further details on the proposed mitigation forSection 4(f) resources.6.9 Wetlands and WaterwaysWetland impacts would be addressed in three sequential steps: avoidance through the examination of potentialproject alternatives; minimization through the incorporation of special design measures that reduce unavoidableimpacts; and mitigation to offset unavoidable impacts that cannot be reduced through sound design measures.Section 5.10.8.1, Avoidance, and 5.10.8.2, Minimization, discuss avoidance and minimization used to reduceimpacts to wetlands and waterways. The FAA evaluated the wetland impacts and determined that there is nopracticable alternative to construction in the wetland, and that all practicable measures to minimize harm havebeen included.Proposed mitigation for the Project-related significant impacts to wetlands and waterways includes on- andoff-site wetland restoration and enhancement, preservation of wetlands and associated upland buffers that areunder development pressure, and wetland creation. Based on the mitigation assessment, it is possible to provideappropriate mitigation for the Preferred Alternative, Alternative B4. Throughout this process, the FAA andRIAC have coordinated with the USACE, RIDEM, EPA, RI Rivers Council, and other interested parties.6.9.1 Mitigation for Significant Wetlands Impacts for Alternative B4The DEIS described 11 conceptual wetland mitigation sites to compensate for unavoidable losses of 7.3 acres ofwetland associated with safety enhancements to Runway 34. As described in Chapter 5, EnvironmentalConsequences, this area has been subsequently reduced to 5.0 acres. Proposed mitigation measures focus onprotecting or restoring wetlands to the maximum extent practicable. The impacted wetlands associated with thePreferred Alternative are presented in Table 6-10. 483 The safety enhancements to Runway 34, including therelocation of Taxiway C would result in the loss of 2.9 acres of wetland providing flood storage and waterquality functions at the principal level, 2.2 acres of wetland providing groundwater recharge and dischargefunction, and 2.9 acres of wetland providing a wetland wildlife function.483 The Preferred Alternative would impact 3.5 acres of emergent wetland (2.1 acres is dominated by the invasive common reed), 1.3 acres scrub-shrub, and0.2 acres forested wetland.Chapter 6 – Mitigation 6-25 July 2011\\Mawatr\ev\09228.00\reports\<strong>FEIS</strong>_Final_July_2011\<strong>PVD</strong>_CH06_Mitigation_JUL_2011.doc
T.F. <strong>Green</strong> <strong>Airport</strong> <strong>Improvement</strong> <strong>Program</strong>Environmental Impact Statement and Final Section 4(f) EvaluationTable 6-10Alternative B4: Wetland Functions and Values Impacted (acres)<strong>Program</strong>ElementGWR/DSWGWFFAS/T/P RWQNR/R/TWQ PE S&S S F&SHRunway 34 2.2 2.9 2.9 2.9 2.9X.XX.XGWR/DSWGWFFAS/T/P RNR/R/TWQPEPrinci pal Wetland Functi on or Value.Additi onal Wetland Function or Value likely provided by wetl and.Groundwater Recharge/Di scharge.Surface Water and Groundwater.Floodflow Alterati on.Sediment/Toxicant/Pathogen Retenti on.Nutrient Removal/Retention/Transformati on.Water Quali ty.Production Export.S&S SF&SHWLHWWHT&E SHRECED/SVU/HAESVQ/AWLHWWHT&ESHRECSediment and Shoreline Stabilizati on.Fish and Shellfi sh Habitat.Wildlife Habitat.Wildlife and Wildlife Habitat.Threatened and Endangered Speci es Habitat.Recreati on.Educational/Scientifi c Value.Uniqueness/Heri tage.Aesthetic. Visual Quality/Aestheti cs.U/HAESVQ/A-AESThe USACE New England District provides guidance for recommended minimum compensatory mitigationratios based on the wetland cover types impacted (e.g., emergent wetland 2:1, forested wetland 3:1, etc.). 484 ThePreferred Alternative would fill 5.0 acres of federally regulated wetland with a recommended minimumequivalent of 10.2 acres of mitigation based on the USACE New England District guidance.Some activities such as the replacement of a culvert under Lakeshore Drive to improve anadromous fishpassage and correct flooding problems and the removal of the security fence <strong>Airport</strong> property along BuckeyeBrook and Wetland A5 to restore wetland wildlife habitat continuity are difficult to evaluate in terms of amitigation acre equivalent. According to the Final Rule: “The district engineer must determine the compensatorymitigation to be required in a Department of the Army permit, based on what is practicable and capable of compensating forthe aquatic resource functions that will be lost as a result of the permitted activity.” 485 The compensatory mitigationprovided in this program achieves this goal of compensating for aquatic functions lost due to the project.Based on Table 6-11, the mitigation program will provide compensatory wetland areas (creation andrestoration) which provide 4.3 acres flood storage as a principal function and 3.0 acres of wetland with waterquality as a principal function. Some of the potential mitigation sites will be incorporated into a program tomitigate for aquatic resources functions that will be lost. Approximately 1.5 acres of wetland wildlife habitatwill be restored or enhanced. In addition, replacement of the culvert at Lakeshore Drive will enhance fishpassage along an anadromous fish run, facilitate wildlife passage, and correct a localized flooding problem thatleads to frequent road closures. Wetland wildlife habitat is proposed to be preserved in two off-site locationsthat are facing threats of encroachment by development. Table 6-11 provides a summary of potential wetlandmitigation sites in the program and the conceptual wetland mitigation estimated acreages for the PreferredAlternative. These are further described in the following section.484 USACE New England District July 20, 2010. New England District Compensatory Mitigation Guidance: Compensation for Impacted Aquatic HabitatResource Functions.485 Federal Register, 40CFR Part 230. Compensatory Mitigation for Losses of Aquatic Resources; Final Rule. April 2008.Chapter 6 – Mitigation 6-26 July 2011\\Mawatr\ev\09228.00\reports\<strong>FEIS</strong>_Final_July_2011\<strong>PVD</strong>_CH06_Mitigation_JUL_2011.doc
T.F. <strong>Green</strong> <strong>Airport</strong> <strong>Improvement</strong> <strong>Program</strong>Environmental Impact Statement and Final Section 4(f) EvaluationTable 6-11Alternative B4: Potential Wetland Mitigation Sites - Functions and ValuesMitigation Site No./Location/Wetland ID Mitigation TypeWetlandClassAcres(est.)OwnershipFunctions and Values Provided by MitigationWLHGWR/D FFA WQ PEx F&SH WWH RECSite 1 /Onsite/WL A13Creation (includes somerestoration )PSS 3.0 RIAC P P ----Site 2 /Onsi te/Lakeshore DriveReplace culvert -- RIAC/Ci ty P P --Site 3 /Onsi te/WL A5 Restore: remove old fill sEnhance: micro-relief andplanting of wet roadsPSS/PFOPSS/PFO1.30.2RIAC -P X X P -Site 6 /Onsite Creation PSS 0.4 RIAC X X XSite 8 /Offsite/ThreePonds Brook MarshPreservation: Wetland andUpland BufferPEM/PSSBuffer32.0 Public/Private P X P X P -Site 12/OffsiteConimi cut Point MarshPXGWR/DFFAF&S HPEMPExPreservation: Coastal Estuarinewetland and upland buffer Interti dalEmergentPrinci pal Wetland Functi on or Value.Additional Wetland Function or Value likely provided by wetl and.Groundwater Recharge/Di scharge.Floodflow Alterati on.Fish and Shellfi sh Habitat.Palustrine Emergent Wetl and.Production Export.8-12 Private X P P XPFO Palustrine Forested Wetl and.PSS Palustrine Scrub-Shrub Wetl and.WLH Wildlife Habitat.WQ Water Quali ty.WWH Wildlife and Wildlife Habitat.REC Recreati on.6.9.2 Proposed Mitigation SitesOn November 4, 2010, the FAA and RIAC hosted a meeting with representatives of the City of Warwick,non-government agencies, and other stakeholders with interests in natural resource conservation including theBuckeye Brook Coalition, Save the Bay, and the Rhode Island Rivers Council. After touring the proposedwetland impact areas associated with Runway 34 safety enhancements, the group met to discuss opportunitiesfor adding new mitigation sites into the program. This meeting resulted in the addition of Site 12 which seeks topreserve properties with the Mill River 486 estuary known as the Conimicut Point Marsh. See Figure 6-2 forlocations of the potential wetland mitigation sites.Further evaluation of wetland mitigation opportunities led to a program consisting of six sites. Mitigation Site 1,3 and 6 are on the <strong>Airport</strong> and two preservation sites, Mitigation Site 8 and 12 are off the <strong>Airport</strong>. A sixth site,Mitigation Site 2, involves replacing the existing Buckeye Brook culvert under Lakeshore Drive north ofWarwick Pond. This project would enhance fish and wildlife passage between Warwick Pond and Wetland A5and would also serve to alleviate a localized flooding problem.486 The Mill River begins below the confluences of Lockwood Brook and Warner Brook with Buckeye Brook.Chapter 6 – Mitigation 6-27 July 2011\\Mawatr\ev\09228.00\reports\<strong>FEIS</strong>_Final_July_2011\<strong>PVD</strong>_CH06_Mitigation_JUL_2011.doc
T.F. <strong>Green</strong> <strong>Airport</strong> <strong>Improvement</strong> <strong>Program</strong>Environmental Impact Statement and Final Section 4(f) Evaluation6.9.2.1 Mitigation Site DescriptionsThe following sections provide descriptions of each mitigation site.Mitigation Site 1This mitigation site (Figure 6-3) is located on the <strong>Airport</strong> within the Buckeye Brook watershed south ofRunway 34. It has been designed to compensate for the flood storage lost from fill that would be placed inWetland A13 for the Runway 34 RSA. This compensatory wetland area would be constructed in uplandsadjacent to Wetland A13. Soil investigations conducted in this area revealed sandy outwash deposits restingover slowly permeable glacial lakebed deposits composed of thinly interbedded very fine sand and silt. Thislakebed deposit forms a restrictive layer that inhibits surface water infiltration. Groundwater elevationmonitoring in the uplands revealed an apparent flow direction toward Wetland A13. Surface water elevationdata were collected at the outlet of Warwick Pond and Tributary A at the outlet of Wetland A13 from May toDecember 2010. These data revealed that the surface water elevation in Wetland A13 is outlet-controlled by theculvert that restricts the flow in Tributary A between Wetland A13 and A10. The water level in Wetland A13was never recorded below elevation 12.1 feet NAVD 88, approximately 0.1 feet below the culvert invert. Itremained at the culvert invert elevation or lower for 55 percent of the monitoring period. Water levels inWetland A13 rose to elevation 13.0 feet NAVD 88 or above a total of 14 times during the 189-day monitoringperiod; the longest duration it remained at or above this elevation was 7.5 hours, with an average time of only3.5 hours. This information is important as the mitigation area within the <strong>Airport</strong> cannot be designed to pondwater for prolonged periods, which could create a wildlife hazard to aviation. The mitigation area has beendesigned to only hold water during the duration of larger storms and will be graded to drain positively backinto Wetland A13.A low shrub cover consisting of species which do not produce fruits that attract wildlife (e.g., willow or sweetpepperbush) would be planted to obscure the brief periods of shallow flood. Crushed stone beds would beinstalled beneath the manufactured high organic content soil in portions of the created wetland to enhancesubsurface flow in the direction of the outlet culvert. This would enhance the opportunity for plants growing inthis substrate to sequester nutrients even when surface water is not present. Other water quality benefits may bederived by the installation of stone check dams to create pool and riffle morphology in Tributary A11. Thesefeatures would be installed in eroding segments of this stream and in segments to be relocated for the project.The oxygenation promoted by this practice should lower levels of dissolved iron and manganese in surfacewaters reaching Wetland A13.Mitigation Site 2This site (Figure 6-4) involves replacing the existing restrictive culvert under Lakeshore Drive. This actionwould correct flooding resulting from cumulative impacts from development and enhance fish and wildlifepassage between Warwick Pond and Wetland A5. The existing culvert, which consists of three parallel 30-inchdiameter reinforced concrete pipes installed with inverted slopes, cannot handle flows generated by a one-yearstorm. This existing culvert is approximately 85 feet long.The conceptual design for a new culvert consists of three box culverts, two 4-foot wide by 3-foot high unitssandwiching a single 10-foot wide by 5-foot wide box that is to be embedded two feet into the stream bed. ThisChapter 6 – Mitigation 6-28 July 2011\\Mawatr\ev\09228.00\reports\<strong>FEIS</strong>_Final_July_2011\<strong>PVD</strong>_CH06_Mitigation_JUL_2011.doc
T.F. <strong>Green</strong> <strong>Airport</strong> <strong>Improvement</strong> <strong>Program</strong>Environmental Impact Statement and Final Section 4(f) Evaluationcentral box would be filled to the stream bottom elevation with river stone to create a natural bottom. With theelimination of the gravel road along the <strong>Airport</strong> perimeter, this new culvert can be shortened to approximately60 feet (refer to Site 3 below). Flow velocities would be analyzed to ensure river herring can pass through thestructure during spring flows.This culvert would have an openness ratio of approximately 0.5 which exceeds the minimum recommended0.25 ratio recommended for wildlife passage by the USACE. 487 Lakeshore Drive does not have particularlyheavy traffic and most larger mammals will likely continue to cross over the road to reach habitats north ofWarwick Pond. This culvert would also pass the 10-year storm without overtopping the roadway. Since theexisting Lakeshore Drive road profile would be maintained, no additional permanent wetland impacts wouldbe required to complete this mitigation.Mitigation Site 3Site 3 (Figure 6-5) involves removing existing roads built on fill along Buckeye Brook in Wetland A5 to restoreburied wetlands, and enhancing other road segments constructed in shallow fill that are jurisdictional wetlands.These roads were originally constructed for rescue operations when the first <strong>Airport</strong> runway was oriented in aneast to west direction parallel to <strong>Airport</strong> Road. These roads no longer serve this purpose and are not essential tosafe airport operations. This plan was prepared by field delineating wetland limits and using instrument surveyto prepare a topographic plan of the road network that was mostly obscured in the aerial survey. Larger treesestablished in the road fill section were also surveyed so they could be preserved on “hummocks” withexcavation activities excluded from the drip lines. Removal of these roads would not only restore theunderlying wetland, but would also restore the wetland’s floodplain function during smaller, more frequentstorms that do not overtop the existing road fill sections.This mitigation site would provide 1.3 acres of wetland restoration through fill removal from the buriedwetland. In addition 0.2 acres of road which consists of partially filled wetland would be enhanced throughre-grading to provide micro-relief followed by seeding and planting with wetland tree species. Compensationfor forested wetland impacts (0.2 acres) would be nearly immediate as the adjacent wetland is forested andwould provide shade and litter inputs immediately upon the mitigation site project completion.In addition, 49 linear feet of Buckeye Brook presently conveyed through culverts would be day-lighted andplaced in constructed stream channels at two locations. Two other existing culverts under the <strong>Airport</strong> PerimeterRoad would be removed to provide an additional 49 linear feet of open channel. The perimeter fence whichfollows the <strong>Airport</strong> boundary currently excludes wildlife from approximately 13 acres of forested upland andwetland and scrub-shrub habitat in Wetland A5. Most of this fence would be removed and relocated to the westof this wetland to connect to the Airfield Maintenance Facility (AMF) access road fence. This would greatlyenhance the wildlife function of Wetland A13 and contiguous habitats north of Warwick Pond. One fencesegment is proposed to remain toward the middle of the wetland to limit future extension of fill slopes fromabutting properties.487New England District, U.S. Army Corps of Engineers Regulatory Division Openness Ratio Spreadsheet (1/4/2006)Chapter 6 – Mitigation 6-29 July 2011\\Mawatr\ev\09228.00\reports\<strong>FEIS</strong>_Final_July_2011\<strong>PVD</strong>_CH06_Mitigation_JUL_2011.doc
T.F. <strong>Green</strong> <strong>Airport</strong> <strong>Improvement</strong> <strong>Program</strong>Environmental Impact Statement and Final Section 4(f) EvaluationMitigation Site 6The Spring <strong>Green</strong> Pond Inlet Stream originates in Wetland A2 as a ditch dug through the wetland (Figure 6-6).This ditch was apparently installed to lower the surface and groundwater elevation in the wetland. Whilerestoration of the original hydrology of wetland system could be achieved by backfilling the ditch and raisingthe culvert invert under Lydick Avenue, this action could result in unintended damage to properties abuttingthe wetland, including City-owned roads. This ditch is very steeply incised south of Lydick Avenue where itpasses through a former home site acquired by the <strong>Airport</strong>. A portion of the lawn area which abuts this channelwould be excavated to create approximately 0.4 acres of shrub and forested wetland next to the stream. Anupland buffer would be planted in the slopes grading to the wetland and existing mature trees would bepreserved. This would provide a floodplain function to attenuate flood flows and provide a wetland buffer toenhance the water quality of runoff. The site would be graded to drain back into the stream so a wildlife hazardis not created. Planting would consist of species that do not produce fruit sought after by wildlife such aswillow, alder, and sweet pepperbush. This area would provide a wildlife corridor for mammals travelingbetween habitats at Spring <strong>Green</strong> Pond and Wetland A2.The incorporation of wetland and buffer preservation at Mitigation Sites 8 and 12 may permit the project toachieve its wetland mitigation goals without Mitigation Site 6. This will be evaluated once agreements for thepreservation sites have been negotiated and mitigation credits have been assigned by the USACE.Mitigation Site 8The Three Ponds Brook wetland system south of the <strong>Airport</strong> Connector is located in the Pawtuxet Riverwatershed (Figure 6-7). The Three Ponds Wetland system is listed in City of Warwick Comprehensive Plan,Chapter 8, as one of the “priority open space sites for protection.” 488 This site offers an opportunity forpreservation of wildlife (primarily waterfowl and wading birds) and warm water fish habitats. Approximately2.1 acres of wetland impact would be offset by acquiring the development rights to 32 acres of dry oak forest,upland grassland, and a portion of the marsh. The preserved area would consist of approximately 12 acres ofmarsh. These acquisitions would protect the upland areas to the south and west of the marsh along with aportion of the wetland. Attempts to acquire development rights for 20 acres of surrounding uplands along thenortheastern part of the Marsh were abandoned after it was learned that a commercial office development hadalready been planned and designed for the area.Mitigation Site 12The Conimicut Point Marsh is named for its proximity to Conimicut Point in Warwick (Figure 6-8). It is theeasternmost part of the Mill River estuary (part of the Buckeye Brook Watershed) and is separate from the largermore prominent Mill Cove. The Mill River is formed below the confluences of Buckeye Brook with first WarnerBrook and then Lockwood Brook. The City of Warwick Comprehensive Plan Open Space Recreation Elementstates “The marshlands along Mill Cove support a large amount of aquatic life and are one of the City’s bestshelters for ducks”. 489488 www.warwickri.gov/index.php?option=com_content&view=article&id=852:city-warwick-comprehensive-plan&catid=67:planning-department&Itemid=159accessed January 24, 2011.489 www.warwickri.gov/index.php?option=com_content&view=article&id=852&Itemid=159 accessed January 24, 2011.Chapter 6 – Mitigation 6-30 July 2011\\Mawatr\ev\09228.00\reports\<strong>FEIS</strong>_Final_July_2011\<strong>PVD</strong>_CH06_Mitigation_JUL_2011.doc
T.F. <strong>Green</strong> <strong>Airport</strong> <strong>Improvement</strong> <strong>Program</strong>Environmental Impact Statement and Final Section 4(f) EvaluationThe Conimicut Point Marsh is divided by Point Avenue into northern and southern parts. The larger southernmarsh (Site 12A) is contiguous with the coast and bounded to the north by Point Avenue. The smaller northernpart (Site 12B) is landlocked between Point Avenue and Shawomet Avenue. Site 12A consists of approximately12 acres, two thirds of which is marsh or tidal river. Site 12B consists of approximately six acres, half of which iswet. Tidal restrictions have degraded the quality of the marsh in Site 12B. Mitigation opportunities for thePreferred Alternative will focus on preservation as restoration work could take years of study prior toimplementation.This area was platted out into very small lots in the 1920s and supported dense development of summercottages up until the 1938 hurricane. This area continues to face development pressure due to its high aestheticvalue and precedent set by Rhode Island case law that considers denial of the right to on a non-conformingexisting building lot to be a “taking”. The Mill Cove Conservancy (MCC) was formed to protect and restoreportions of the marsh that be degraded by filling and loss of tide exchange. Together with Save the Bay, theMCC has prepared a program identifying nearly 19 acres of land along the marsh where they wish to purchasedevelopment rights. In addition to the previously stated aesthetic value, the marsh provides wildlife habitat forwaterfowl and wading birds and important fish and shellfish habitat. Recreational values include kayaking andbird watching. Although RIAC could assist the MCC in acquiring between eight to 12 acres of land within theConimicut Point Marsh, focusing on properties that include uplands at risk for development, it would becomplicated by the number of parcels and RIAC’s inability to commit until after ROD issued.6.9.2.2 Estimated Acreage for Alternative B4 Wetland MitigationThe Preferred Alternative would impact 5.0 acres of wetland within the Buckeye Brook Watershed. Except forpreservation proposed at Site 8, all of the proposed mitigation sites are located within the Buckeye Brookwatershed. Table 6-12 provides an assessment of the compensatory wetland mitigation acreage values for thepriority mitigation sites to demonstrate that the mitigation program complies with USACE-recommendedminimum mitigation ratios. 490 Furthermore, the mitigation approach includes preservation sites that areconsistent with the City of Warwick Comprehensive Plan.490 USACE New England District, July 2010. New England District Compensatory Mitigation Guidance.Chapter 6 – Mitigation 6-31 July 2011\\Mawatr\ev\09228.00\reports\<strong>FEIS</strong>_Final_July_2011\<strong>PVD</strong>_CH06_Mitigation_JUL_2011.doc
T.F. <strong>Green</strong> <strong>Airport</strong> <strong>Improvement</strong> <strong>Program</strong>Environmental Impact Statement and Final Section 4(f) EvaluationTable 6-12Alternative B4: Wetland Mitigation Estimated AcreageWetland Mitigation TypeCreation/Restoration (In Kind) 3Restoration/Enhancement (In Kind)Wetland/Buffer PreservationWetland MitigationSite Numbers1, 3, & 638 & 12CompensationSite Area(acres) 14.70.240.0USACENew England DistrictRecommended Ratio 22.04:1 43:115:1ImpactedWetland AreaEquivalent2.30.12.7Total 44.9 NA 5.1 51 The mitigation program will replace the functions and values of the impacted wetlands as required by USACE.2 Weighted average for all wetland classes impacted from New England District Compensatory Mitigation Guidance (7-20-2010) Table 1.3 PEM dominated by Phragmites will not be replaced in kind.4 The mitigation equivalent of a creation/restoration site is calculated by dividing the area of the site by 2.04 5 Alternative B4 would require mitigation for the loss of 5.0 acres of wetland.In addition to mitigating for impacts to vegetated wetlands, Site 2 involves the replacement of the BuckeyeBrook culvert at Lakeshore Drive that could enhance fish and wildlife passage and correct flooding problems onLakeshore Drive. If selected, the mitigation area equivalent of this activity would be negotiated with the USACEthrough an adjustment of ratios of impact to mitigation. The culvert replacement would substitute for otheractions listed in Table 6-11.6.10 Water QualityAlternative B4 would avoid water quality impacts by reducing roadway and parking areas within the TuscatucketBrook and Brush Neck Cove watersheds, thereby reducing pollutant loading. In addition, Alternative B4 wouldinclude improved water quality treatment for the relocation of existing roadways (<strong>Airport</strong> Road and MainAvenue). Alternative B4 would be designed to avoid disturbing Truk-Away Landfill soils. Total avoidance of thepotential to impact water quality would not be possible, as Alternative B4 would involve new impervioussurfaces, new parking, and increased aircraft operations. The design of Alternative B4 includes avoidance andminimization efforts to prevent any risks to water quality.Based on the impact analysis presented in Chapter 5, Environmental Consequences, there would be no significantimpacts on water quality, but there would be increases in impervious surfaces within some drainage areas forAlternative B4. Proposed mitigation measures developed in compliance with RIDEM standards would ensurethe receiving waters would not be impacted from new discharges. These standards would require on- andoff-site stormwater control measures to mitigate the impacts from the new impervious surfaces for AlternativeB4 and includes designing Alternative B4 in compliance with all applicable state and federal regulatorystandards, including the 2010 RIDEM Stormwater Design and Installation Standards Manual (SWDM), 491 to mitigatethe impacts to water quality and ensure the receiving waters are not impacted from new discharges.491 RIDEM and Coastal Resources Management Council, Rhode Island Stormwater Design and Installation Standards Manual, December 2010.Chapter 6 – Mitigation 6-32 July 2011\\Mawatr\ev\09228.00\reports\<strong>FEIS</strong>_Final_July_2011\<strong>PVD</strong>_CH06_Mitigation_JUL_2011.doc
T.F. <strong>Green</strong> <strong>Airport</strong> <strong>Improvement</strong> <strong>Program</strong>Environmental Impact Statement and Final Section 4(f) EvaluationWhile Alternative B4 would increase impervious surfaces and the amount of glycol used for deicing departingaircraft, the proper design of a new stormwater management system and construction of the new DeicerManagement system would ensure that Alternative B4 would meet state stormwater standards.6.10.1 Mitigation for Water Quality Impacts for Alternative B4Alternative B4 includes mitigation for increases in impervious surfaces. Proposed mitigation measures focus oncompliance with federal regulatory standards and including RIDEM standards and the SWDM, adopted inDecember 2010, which are described in Section 5.11.1, Regulatory Context, of Chapter 5, EnvironmentalConsequences.6.10.1.1 Design Alternative B4 in Compliance with all Applicable State and Federal Regulatory StandardsAlternative B4 would incorporate three types of control measures to minimize changes to hydrology and waterquality:• Designed stormwater controls,• Operations and maintenance procedures, and• Construction-period control measures (presented in Section 6.19, Construction Period Mitigation).In addition, as a component of state environmental permitting and the T.F. <strong>Green</strong> <strong>Airport</strong> <strong>Improvement</strong><strong>Program</strong>, RIAC would enhance the stormwater management system in accordance with state requirements andprepare a supporting stormwater management report that complies with the SWDM. The stormwatermanagement report developed for the <strong>Improvement</strong> <strong>Program</strong> would contain an analysis of existing andproposed stormwater conditions, a description of erosion and sedimentation controls to be used duringconstruction, plans for long-term operation and maintenance of the stormwater system, and documentation todemonstrate compliance with the current SWDM.Designed Stormwater ControlsA conceptual stormwater design (see Appendix K, Water Quality) was developed for the Alternative B4 todetermine the maximum size and suitable locations (Figure 5-43) for the larger stormwaterdetention/infiltration systems. The design could be developed to comply with the higher rainfall intensities andpeak runoff requirements from the SWDM. While these stormwater detention and infiltration systems could bedesigned to mitigate peak rates of runoff, additional smaller systems would also be required to supplementthese systems to provide additional groundwater recharge and water quality mitigation. Low-impactdevelopment (LID) best management practices (BMPs), such as bioretention basins, vegetated swales, andengineered gravel wetlands, and structural BMPs, such as sedimentation chambers, oil/water separators, stonecheck dams etc., would be installed to provide additional peak flow attenuation and address TSS removalrequirements. The LID BMPs would serve as pretreatment to the larger detention/infiltration systems wherepossible to provide additional opportunities for infiltration and satisfy the groundwater recharge requirementsfrom the SWDM to provide treatment of stormwater as close to the source as possible. Table 6-13 lists potentialstormwater control measures that could be included in the final design. These measures will be designed tomeet RIDEM stormwater requirements and RIPDES requirements.Chapter 6 – Mitigation 6-33 July 2011\\Mawatr\ev\09228.00\reports\<strong>FEIS</strong>_Final_July_2011\<strong>PVD</strong>_CH06_Mitigation_JUL_2011.doc
T.F. <strong>Green</strong> <strong>Airport</strong> <strong>Improvement</strong> <strong>Program</strong>Environmental Impact Statement and Final Section 4(f) EvaluationTable 6-13LocationAlternative B4: Potential Stormwater Control MeasuresStormwater Control Measures<strong>Airport</strong> Infi eldCargo and Fueling AreasVegetated swales, vegetated buffers, soi l modificati ons, subsurface and surface infiltration/detenti on systemsSecondary containment, oil/water separatorsMain Avenue Vegetated swales, vegetated buffers, bioretenti onStormwater Drainage SystemOil/water separators, sedimentation chambers, hoods and deep sumps in catch basins, subsurfaceinfiltration/detention,Partially and Fully Relocated Ai rport Road Vegetated swales, vegetated buffers, subsurface infiltration/detention, surface infiltration/detention, bioretenti onOutfall sSource: VHB, Inc.Engineered gravel wetlands, aeration structures, stone check damsA HydroCAD model was developed using Technical Release 20 (TR-20) to determine the resultant increase instormwater runoff for the 100-year storm event between the 2004 existing conditions and the Alternatives B2and B4 (see Appendix K, Water Quality). The HydroCAD preliminary basin sizing analysis was then used todetermine the maximum volume of stormwater retention required to mitigate any increases in stormwaterrunoff. The stormwater management report for the <strong>Improvement</strong> <strong>Program</strong> projects would include a moredetailed analysis that would include an evaluation of the smaller storm events and could also redistribute thesubsurface and surface infiltration/detention systems within smaller sub-watersheds. This analysis would alsoinclude design of the outlet control structures to increase the efficiency of these systems resulting in smallersystems than those determined in the <strong>FEIS</strong> analysis.The <strong>Improvement</strong> <strong>Program</strong> was evaluated for the five watersheds that discharge to one of five design pointswhere peak discharge rates were evaluated in the environmental consequences analysis. Table 6-14 shows thenet change in the peak flow rate requiring mitigation for the 100-year storm event and the maximum requiredstormwater storage volume for Alternative B4.Although there would be no significant water quality impacts, the <strong>Improvement</strong> <strong>Program</strong> would mitigate forincreases in impervious surfaces through compliance with RIDEM standards. Alternative B4 would be designedto meet the requirements of the SWDM.Chapter 6 – Mitigation 6-34 July 2011\\Mawatr\ev\09228.00\reports\<strong>FEIS</strong>_Final_July_2011\<strong>PVD</strong>_CH06_Mitigation_JUL_2011.doc
T.F. <strong>Green</strong> <strong>Airport</strong> <strong>Improvement</strong> <strong>Program</strong>Environmental Impact Statement and Final Section 4(f) EvaluationTable 6-14Alternative B4: Required Stormwater Storage VolumeDrainage Area2004Existing ConditionPeak Flow(cubic feet per second) 1Alternative B4Net ChangeRequiring MitigationMaximum RequiredStorage Volume(acre-feet) 2Alternative B4Buckeye Brook North 1437 1514 77 14.2Warwick Pond 85 94 9 0.3Buckeye Brook South 1025 1214 189 22.4Tuscatucket Brook 230 300 70 8.6Callahan Brook 281 245 (36) NA 3Source: VHB, Inc.1 Peak Outflow determined from hydrologic model calculations performed using HydroCAD in Appendix K, Water Quality.2 Required storage volume determined using TR-20 Preliminary Basin Sizing Analysis in Appendix K.2, Pond Sizing Analysis.3 No increase in peak flow is anticipated that would require mitigation through storage.Potential Operations and Maintenance ProceduresAs stated in the SWDM, “there are two key components to adequately maintaining a stormwater managementinfrastructure: periodic and scheduled inspections; and maintenance scheduling and performance.” Table 6-15summarizes the Operations and Maintenance (O&M) procedures that would be required for the stormwatercontrol measures that could be included in the final design of the Preferred Alternative based on the SWDM.Chapter 6 – Mitigation 6-35 July 2011\\Mawatr\ev\09228.00\reports\<strong>FEIS</strong>_Final_July_2011\<strong>PVD</strong>_CH06_Mitigation_JUL_2011.doc
T.F. <strong>Green</strong> <strong>Airport</strong> <strong>Improvement</strong> <strong>Program</strong>Environmental Impact Statement and Final Section 4(f) EvaluationTable 6-15Potential Stormwater Control Measures Operations and Maintenance ProceduresStormwaterControl Measures Inspection Frequency Minimum Maintenance and Key Items to CheckDetention SystemsInfiltration SystemsVegetated SwalesAnnually and after stormevents greater than or equalto a 1-year storm eventAnnually and after stormevents greater than or equalto a 1-year storm eventAnnually and after stormevents greater than or equalto a 1-year storm eventBioretention During the si x monthsimmediately followi ngconstruction the facility shal l bei nspected at l east twi ce and afterany storm events great than orequal to a 1-year storm event.Thereafter, the facili ty shall bei nspected annually and afterstorm events greater than orequal to a 1-year storm event• Sl• Reinforce existing riprap i n areas that have been compromised.•• Sediment should be removed from the forebay when the desi• All• Mow the grass at l east grass at least four times annually.• Remove any dead or dyi ng vegetati• Replace any vegetati on that has died off.opes of the basin should be inspected for erosion and gullying. Stabili ze and reseed as needed.All structural components should be inspected and repaired if necessary.gn depth has been reduced by 50%.trash and debris shall be removed and disposed of in accordance with all federal and local regulati ons.on and any vegetation that has a negati ve impact on stormwater fl ow.• Inspect facility to ensure desi gn rates are being met.• Repair and stabilize any eroded areas.• If sediment or organic debris build-up has limited the infiltration capabilities to below the design rate,the top 6 inches should be removed and the surface roto-till ed to a depth of 12 i nches. Restore basinth original design specifications.on pads and dispose of in accordance with all federal andbottom in accordance wi• Remove any oil or grease with oil absorptilocal regulations.•regulations.• Mow the grass at l• Inspect for si• Remove any dead or dying vegetation.• Replace any vegetati on that has died off.All trash and debris should be removed and disposed of in accordance with al l federal and localeast grass at least four times annually.gns of wetness or damage to structures.• Mow the grass to maintain grass height of 4-6 i nches, wi th mandatory mowi• Remove litter and debri s.• All structural components should be inspected and repaired if necessary.• Sl opes of the basin should be inspected for erosion and gullyi ng. Stabili• Nutrient and pesticide use management annuall y.• Dethatch swal e bottom and remove thatch annuall y.• Disc or aerate swale bottom annually.• Sediment shall be removed from the swale when sediment accumulates to a depth of approxi3 inches.ng when height exceeds 10 i nches.ze and reseed as needed.mately• Vegetati on along maintenance roads shall be mowed annually.• Scrape the channel bottom every five years to restore the original cross section and infiltration rate.• Soil erosion shal l be repaired.•• Reinforcement planting shall be performed if at least 50 percent of the vegetatiachieved within two years.• Herbaceous vegetation shall be separated when overcrowded is observed (approxi• The mulch layer shal l be replenished to its original depth every two years, or as di• Vegetati on along maintenance roads shall be mowed annually.• If the facility hol ds water 48 hours after precipitation events, the surface shall be roto-tillPruning or replacement of woody vegetation shall occur when dead or dying vegetation is observed.on coverage is notmately every three years).rected based on inspecti ons.ed and re-vegetated.Chapter 6 – Mitigation 6-36 July 2011\\Mawatr\ev\09228.00\reports\<strong>FEIS</strong>_Final_July_2011\<strong>PVD</strong>_CH06_Mitigation_JUL_2011.doc
T.F. <strong>Green</strong> <strong>Airport</strong> <strong>Improvement</strong> <strong>Program</strong>Environmental Impact Statement and Final Section 4(f) Evaluation6.11 Fish, Wildlife, and PlantsBased on the impact analysis presented in Chapter 5, Environmental Consequences, Alternative B4 would notsignificantly impact fish, wildlife, and plants. While the habitat for two state-listed species were observed in theProject Area (the pine barrens tiger beetle and sickle-leaved golden aster), these habitats would not be impactedby Alternative B4.The airfield provides potentially suitable habitat for a number of regionally rare grassland bird species,including the upland sandpiper (Bartramia longicauda), horned lark (Eremophila alpestris), and grasshoppersparrow (Ammodramus savannarum). These bird species are rare at the state level but have no special federalstatus beyond the normal protection afforded all migratory birds. The potential “greatest conservation need”grassland bird species habitat located south of Runway 34 would be avoided by revisions to the design of theglide slope area in the Preferred Alternative. Therefore, no mitigation is required. Section 5.12.8, Avoidance andMinimization, of Chapter 5, Environmental Consequences, discusses avoidance and minimization used to reduceimpacts to fish, wildlife, and plants.It should be noted that the mitigation program developed to compensate for significant impacts to wetlands willalso benefit biodiversity through the restoration of former wetland habitats and the preservation of wetland andupland habitats as discussed in this chapter Section 6.9, Wetlands and Waterways.6.12 Threatened and Endangered SpeciesThere are no federally listed species of concern or threatened or endangered species within the Project Area and,therefore, there would be no significant impacts to threatened or endangered species as a result of the<strong>Improvement</strong> <strong>Program</strong>. No mitigation is required.6.13 FloodplainsAlternative B4 would result in significant impacts as it would require filling of approximately 2.3 acres ofFEMA-mapped floodplain. Alternative B4 would constitute a “significant encroachment” according to FAAOrder 1050.1E since it would cause adverse impacts on natural and beneficial floodplain values. Table 5-126summarizes the significant impacts to floodplains for Alternative B4, which would result in the loss of a total of726 cubic yards of flood storage. This loss would affect the natural moderation of floods, groundwater recharge,and water quality maintenance. Design measures to avoid and minimize impacts to floodplains are described inChapter 5, Environmental Consequences, Section 5.14.8, Avoidance and Minimization.6.13.1 Mitigation for Significant Floodplain Impacts for Alternative B4Mitigation for floodplain impacts (flood storage volumes filled below elevation 14 feet NAVD 88, theFEMA-regulated base flood elevation) is generally accomplished by excavating one or more areas adjacent tobut higher than the floodplain, down to elevations equal to those in the impacted floodplain area. The createdfloodplain would replace the flood storage displaced by fill. Significant impacts to floodplains would beChapter 6 – Mitigation 6-37 July 2011\\Mawatr\ev\09228.00\reports\<strong>FEIS</strong>_Final_July_2011\<strong>PVD</strong>_CH06_Mitigation_JUL_2011.doc
T.F. <strong>Green</strong> <strong>Airport</strong> <strong>Improvement</strong> <strong>Program</strong>Environmental Impact Statement and Final Section 4(f) Evaluationmitigated by providing compensatory flood storage in areas outside of the existing base flood limits whichwould also be consistent with RIDEM regulations. Under RIDEM regulations, floodplain compensation isrequired to be replaced in an incremental manner meaning that flood storage volumes lost between discreteelevations within the floodplain, such as between elevation 12 feet and 13 feet and between elevation 13 feet and14 feet, are matched by creating new floodplain storage with the same volumes between these same elevationintervals. For unavoidable floodplain impacts, RIAC will provide compensatory flood storage and may replacethe undersized Buckeye Brook culvert which causes flooding of Lakeshore Drive.Mitigation for floodplain impacts associated with Runway 34 safety enhancements would be achieved throughthe addition of floodplain storage in the upland area south of Runway 34 adjacent to Wetland A13, as describedin Section 6.9, Wetlands and Waterways, for Mitigation Site 1. This 3.0-acre wetland mitigation site will alsorestore the flood storage function associated with the floodplain area lost due to filling.6.14 Coastal ResourcesBased on the impact analysis presented in Chapter 5, Environmental Consequences, there would be no significantimpacts to coastal resources as a result of the <strong>Improvement</strong> <strong>Program</strong> and, therefore, no mitigation is required.While there is no established significance threshold for coastal resources, Alternative B4 would be designed tocomply with applicable performance standards of the Rhode Island Coastal Resources Management Plan(RICRMP), Rhode Island Soil Erosion and Sediment Control Handbook, and Rhode Island Stormwater Design andInstallation Standards Manual, and the Special Area Management Plan (SAMP) goals and objectives.6.15 FarmlandsBased on the impact analysis presented in Chapter 5, Environmental Consequences, there would be no significantimpacts to farmlands as a result of the <strong>Improvement</strong> <strong>Program</strong>. Alternative B4 would not directly, indirectly, orcumulatively impact Farmland of Statewide Importance or other regulated farmland and, therefore, nomitigation is required. The Natural Resource Conservation Service (NRCS) Farmland Conversion ImpactRating, as reported on Form AD-1006, is 74. This is well below the significance threshold identified in the FAAOrder 1050.1E, which identifies significant impacts to farmlands, as impacts to existing, intact farmland unitsthat receive a score between 200 and 260 points using Form AD 1006. Form AD-1006 has been completed by theNRCS and is included in Appendix C, Federal, State, City, and Tribal Coordination.6.16 Hazardous Materials, Pollution Prevention, and Solid WasteBased on the impact analysis presented in Chapter 5, Environmental Consequences, there would be no significantimpacts to hazardous materials, solid waste, or pollution prevention and, therefore, no mitigation is required.Alternative B4 would be designed and constructed in compliance with applicable local, state, and federal lawsand regulations concerning hazardous or solid waste management. Refer to Section 5.17.1, Regulatory Context ofChapter 5, Environmental Consequences, for the applicable local, state, and federal laws and regulations thatgovern hazardous materials and solid waste.Chapter 6 – Mitigation 6-38 July 2011\\Mawatr\ev\09228.00\reports\<strong>FEIS</strong>_Final_July_2011\<strong>PVD</strong>_CH06_Mitigation_JUL_2011.doc
T.F. <strong>Green</strong> <strong>Airport</strong> <strong>Improvement</strong> <strong>Program</strong>Environmental Impact Statement and Final Section 4(f) Evaluation6.17 Light Emissions and Visual EnvironmentBased on the impact analysis presented in Chapter 5, Environmental Consequences, Alternative B4 would notresult in significant impacts related to light emissions or the visual environment. While no mitigation isrequired, BMPs would be followed to reduce impacts from light emissions of the Preferred Alternative.Additional light poles associated with the expansion and modification of the <strong>Airport</strong> roadway system woulduse downcast hoods that avoid light propagation to neighboring areas. Access to the new structured parkinggarage would face <strong>Airport</strong> land and a solid wall or screening would be designed facing the adjacentneighborhood to minimize light propagation to neighboring areas.6.18 Energy Supply, Natural Resources, and Sustainable DesignBased on the impact analysis presented in Chapter 5, Environmental Consequences, Alternative B4 would notresult in significant impacts concerning energy, natural resources, or sustainable design and, therefore, nomitigation is required. Acknowledging the intent of the FAA to encourage construction that exemplifies thehighest standards of design including principles of sustainability, and the intent of the State of Rhode Island torequire State buildings to be constructed to a LEED Silver rating, RIAC has committed to managing the design,construction, operation, and maintenance of the <strong>Airport</strong> using sustainability principles to the extent practicable.6.19 Construction Period MitigationTemporary, short-term impacts from construction activities would not be significant and would be mitigated tothe maximum extent practicable. All construction activities would comply with the most recent edition of FAA’sAdvisory Circular 150/5370-10, Standards for Specifying Construction of <strong>Airport</strong>s. 492 During construction, a portionof the water main in <strong>Airport</strong> Road that will be under the Runway 16 RSA would be relocated as a constructionmitigation measure. Additionally, appropriate construction mitigation measure requirements would beincorporated into the contract documents and specifications governing the activities of contractors andsubcontractors constructing elements of the Preferred Alternative. On-site resident engineers and inspectorswould monitor construction activities to ensure that mitigation measures are properly implemented. Table 6-16presents the proposed construction mitigation measures. Construction period mitigation is only included forthose environmental categories for which there would be short-term construction-related impacts.492 FAA Circular 150/5370-10, Standards for Specifying Construction of <strong>Airport</strong>s, U.S. Department of Transportation, FAA, September 30, 2009.Chapter 6 – Mitigation 6-39 July 2011\\Mawatr\ev\09228.00\reports\<strong>FEIS</strong>_Final_July_2011\<strong>PVD</strong>_CH06_Mitigation_JUL_2011.doc
T.F. <strong>Green</strong> <strong>Airport</strong> <strong>Improvement</strong> <strong>Program</strong>Environmental Impact Statement and Final Section 4(f) EvaluationTable 6-16Alternative B4: Summary of Construction Period Mitigation MeasuresMitigation MeasuresNoise• All equipment powered by an internal combustion engine would utilize a properly maintained muffler.• Conduct truck loading, unloading, and hauling so that noise is kept to a minimum.• Route constructi on equipment and vehicles i n areas that would cause the least disturbance to nearby receptors where possi ble.• Fit air-powered equipment with pneumatic exhaust sil encers.• Stati onary equipment powered by an internal combustion engine would not be wi thin 150 feet of noise-sensitive sites without portable noise barri ersplaced between the equipment and the residences. Portable noise barriers most li kely would be constructed of plywood or tongue-and-groove boardsand would have a sound absorbing treatment on the surface facing the equipment.• If appropriate, temporary noise barrier wall s may be constructed to protect noise-sensitive areas from construction noise.Surface Transportation• Maintain pedestri an access through work zone as appropriate.• Maintain vehicle and bicycl e access as appropri ate, provide temporary traffi c detours only when needed.• Coordinate with the state and appropriate officials throughout design and construction phase. Coordinate with abutters as needed.Air Quality• Limit idling diesel-powered construction vehicles and equipment engines to no more than five consecutive minutes wi thin any 60-minute period.• Construction equipment will be operated with Tier 3 controls where feasible and appli cable.• Encourage Contractors to substi tute low- and zero-emitting constructi on equipment whenever possible.• Implement a construction employee shuttle service, ri deshare program, and/or on-site food service to reduce vehicle tri ps.• Use electrical drops in place of temporary electri cal generators wherever possible.Other construction-related air quali ty mitigation measures aimed at reducing the occurrence and potential impacts from “fugitive” dust could also bei mplemented as needed. These measures could incl ude, but are not limited to, the following:• Apply non-toxic soil stabilizers to all inactive construction areas including areas with disturbed soils and stockpil es of raw materi als.• Stabilize on-si te truck haul routes and staging areas with dust-prevention materials.• Reduce truck speeds on haul routes to minimize dust re-entrainment.• Remove mud and dirt from haul truck wheels and cover truck bodies before leaving the construction si te(s).• Permanently cover all ground surfaces with vegetation or impervious materials as soon as practi cable.• Post a publicly visible sign with the contact information for reporti ng dust complaints.Water Quality• Develop and implement a construction stormwater pollution and prevention plan (SWPPP), including installation of temporary BMPs andimplementation of erosion and sediment controls, in accordance wi th NPDES and RIDEM standards/permits.• Ensure proper timing of construction to minimize the time that an area is left exposed, temporary stabilizati on of exposed areas using protectivecovers, and perimeter controls such as sil t fences and straw bales to capture sediment before it leaves the si te.• Perform regular monitoring to ensure that the controls are effecti ve.• Install spill control procedures at desi gnated temporary fueling locations and any temporary sanitary facilities during construction• Waste materials would be managed properl y.• Address any contaminated soil or groundwater encountered during construction in accordance with all applicable regulations.• If dewatering activities were necessary, all applicable regulations will be complied with and all permits will be obtained.Wetlands and Waterways• Implement erosion and sedimentation control measures according to the construction SWPPP.• Appropriate constructi on measures such as the use of swamp mats or would be used to avoid or minimize the construction effects on wetl ands.Hazardous Materials and Solid Waste• Implement measures to protect workers and the environment, such as a speci al management procedures for any hazardous, contaminated, orspecial wastes generated during constructi on.• Prepare a site-specific Health and Safety Plan, if required.1 The air quality impact assessment fi ndings, presented in Chapter 5, Environmental Consequences, show that the construction of Alternati ve B4would not have a signifi cant effect on air quality conditions locally, state-wide, or regionally and, therefore, specific air quality avoidance, minimization or mitigationmeasures are not required under NEPA or the General Conformity Rule. These measures could be included to help reduce construction-related emissionsassociated with construction vehicles and equipment during the temporary construction peri od.Chapter 6 – Mitigation 6-40 July 2011\\Mawatr\ev\09228.00\reports\<strong>FEIS</strong>_Final_July_2011\<strong>PVD</strong>_CH06_Mitigation_JUL_2011.doc
T.F. <strong>Green</strong> <strong>Airport</strong> <strong>Improvement</strong> <strong>Program</strong>Environmental Impact Statement and Final Section 4(f) Evaluation6.20 Mitigation Implementation and MonitoringOn January 14, 2011, CEQ issued new guidance for federal departments and agencies on “establishing,implementing, and monitoring mitigation commitments identified and analyzed in EnvironmentalAssessments, Environmental Impact Statements, and adopted in the final decision documents.” 493 The guidancecalls for agencies to be transparent and to set measurable performance standards. The guidance emphasizes thatthe agency should disclose mitigation monitoring plans. Mitigation monitoring includes implementationmonitoring and effectiveness monitoring. Implementation monitoring identifies whether mitigationcommitments are performed. Effectiveness monitoring determines if the implemented mitigation is successful.The FAA and RIAC will comply with the CEQ guidance by cataloging a baseline for resource conditions,establishing measurable performance standards, developing monitoring plans, and monitoring mitigation toconfirm its implementation and effectiveness. The FAA and RIAC will determine appropriate steps if themonitoring discloses mitigation failure. The FAA and RIAC will make information available to the public.Tables 6-17 and 6-18 provide a summary of proposed mitigation implementation and monitoring for significantimpacts and mitigation required for compliance with other requirements.493 Council on Environmental Quality Appropriate Use of Mitigation and Monitoring and Clarifying the Appropriate Use of Mitigated Findings of No SignificantImpact, January 14, 2011.Chapter 6 – Mitigation 6-41 July 2011\\Mawatr\ev\09228.00\reports\<strong>FEIS</strong>_Final_July_2011\<strong>PVD</strong>_CH06_Mitigation_JUL_2011.doc
T.F. <strong>Green</strong> <strong>Airport</strong> <strong>Improvement</strong> <strong>Program</strong>Environmental Impact Statement and Final Section 4(f) EvaluationTable 6-17Alternative B4: Summary of Proposed Mitigation Implementation and Monitoring for Significant ImpactsMitigation MeasureNoise• Provide sound insulation for residences l ocated at or above DNL 65 dB thatwould experience a noise increase of at least DNL 1.5 dB when compared to theNo-Action Alternative for the same ti meframe 1• Provide sound insulation for sensiti ve receptors (places of worship): Jehovah’sWitnesses of Warwi ckCompatible Land Use• See NoiseHistoric, Architectural, Archaeological, and Cultural Resources• Prepare archival documentation for the NRHP-eli gible airport historic district(including the Historic District, State Termi nal, and Hangars No. 1 and 2)2• Develop an interpreti ve display (physical and electronic) depicting the historicaldevelopment of the <strong>Airport</strong>.• Prepare list of items from Hangar No. 1 for possible salvage and curation.• Define boundaries of Warwick Hi storical Cemetery Nos. 26, 76, 77, and 78,assess potential impacts, consult with Warwick Historical Cemetery Commissionto protect (avoid or mitigate).• For WHC 26, relocate the existi ng markers or markers and remains to anappropriate location nearby, create a new memorial outsi de the object free area,or laying the headstones flat with protection, relocating the headstones, or otherrelocati on measures determined by the Warwick Hi storical CemeteryCommission through permitting.• Conduct archaeological investigati ons at areas of direct impact not previousl ysurveyed (e.g., wetland mitigation areas, etc.)• Section 4(f) Resources• Replace impacted Winslow Park recreation facilities on another site to mitigatefor the physical use impact• For eli gible airport historic district and Hangar No. 1 mitigation(see Historic, Architectural, Archaeological, and Cultural Resources)Wetlands and Waterways• Replace functi ons and values of 5.0 acres of wetl ands – Potential Mitigation Sites Wetland Mitigation Si te 1: 3.0 acres on-site wetland creation Wetland Mitigation Si te 2: culvert replacement at Lakeshore Drive Wetland Mitigation Si te 3: 1.5 acres on-si te wetland restorati on and enhancement Wetland Mitigation Si te 6: 0.4 acres on-site wetland creation Wetland Mitigation Si te 8: 32.0 acres off-site wetl and and upland buffer preservati on Wetland Mitigation Si te 12: 8.0-12.0 acres off-site coastal wetland and uplandbuffer preservationResponsiblePartyRIACRIACRIACRIACRIACRIACRIACRIACRIACSee aboveRIACRIACRIACRIACRIACRIACProposed Implementation andEffectiveness MonitoringNo monitoring requiredpost completionNo monitoring requiredpost completionNo monitoring requiredpost completionNo monitoring requiredpost completionNo monitoring requiredpost completionNo monitoring requiredpost completionNo monitoring requiredpost completionNo monitoring requiredpost completionNo monitoring requiredpost completionSee above5 years post construction5 years post construction5 years post construction5 years post construction5 years post construction5 years post constructionTiming2015 – 2020 for homes impacted byRunway 5-23 extension2020 – 2025 for receptors i mpacted byRunway 5-23 extensionPrior to demolition of buil dingsTo be determined in consultation withRIHPHCPrior to demolition of Hangar No. 1Prior to Final design phasePost constructi on of Runway 5 EndPrior to wetland mitigation constructionPrior to operati on of Runway 5 EndPrior to Construction of Runway 34 RSAPrior to Construction of Runway 34 RSAPrior to Construction of Runway 34 RSAPrior to Construction of Runway 34 RSAPrior to Construction of Runway 34 RSAPrior to Construction of Runway 34 RSAFloodplainsProvide compensatory flood storage (incorporated in final design) RIAC No monitoring required Prior to Construction of Runway 34 RSApost constructionNotes: Refer to Table 5-131 of Chapter 5, Envi ronmental Consequences, for a summary of significant i mpacts by alternative.No mitigation for significant impacts is required for the other environmental impact categories, including: Social and Economic, and Environmental Justice, Children’s Healthand Safety; Surface Transportation; Air Quality; Water Quality; Fish, Wildlife, and Plants; Threatened and Endangered Species; Coastal Resources; Farml ands; HazardousRIHRARICRMC12Materials and Solid Waste; Light Emissions and Visual Envi ronment; and Natural Resources and Energy Supply.Rhode Island Histori c Resource Archive.Rhode Isl and Coastal Resources Management Council .According to Order 1050.1E, significant impacts are those residential units and non-residential noise-sensitive land uses that would be exposed to a significant increase in noise (atl east 1.5 dB increase or more in the DNL 65 dB or above noise contour intervals) due to the project. Resi dences exposed to noise levels 70 dB and above are not consi deredsignificantl y impacted; however, those residences would be eligible for land acquisition. See Tables 6-5 and 6-6 for mitigation proposed for i mpacts that are not defi ned assignifi cant.The level of documentati on, either HABS/HAER or RIHRA will be determined through consultati on.Chapter 6 – Mitigation 6-42 July 2011\\Mawatr\ev\09228.00\reports\<strong>FEIS</strong>_Final_July_2011\<strong>PVD</strong>_CH06_Mitigation_JUL_2011.doc
T.F. <strong>Green</strong> <strong>Airport</strong> <strong>Improvement</strong> <strong>Program</strong>Environmental Impact Statement and Final Section 4(f) EvaluationTable 6-18Mitigation MeasureAlternative B4: Summary of Proposed Mitigation for Compliance with Other RequirementsNoise• Conti nue to impl ement ongoing noise compatibili ty measures for airport operati ons.• Acquire residenti al parcels exposed to noise levels of DNL 70 dB and abovethrough participation in a voluntary land acquisiti on program.• Provide sound insulation for residences exposed to noise l evels between DNL65 dB and 69 dB• Install noise barriers or berms on <strong>Airport</strong> Road and Main Avenue as appropriatefollowing RIDOT’s protocol• Install qui eter pavement for relocated Ai rport Road and Mai n Avenue as appropri ateCompatible Land Use• See NoiseResponsiblePartyRIACRIACRIACRIACRIACProposed Implementation andEffectiveness MonitoringNANo monitoring required post completionNo monitoring required post completionNo monitoring required post completionNo monitoring required post completion• Update Noise Land Reuse Plan RIAC No monitoring required post completionSocioeconomi c, and Environmental Justice, Children’s Heal th and Safety Ri sks• Rel ocate and compensate fairl y, consistently, and equitabl y all acquired residents andbusi nesses according to the requi rements of the Uniform Relocati on ActSurface Transportation• Relocate Park and Ride faciliti es and reroute RIPTA buses• Incorporate bicycl e and pedestrian accommodation i nto roadway projects as appropri ateHistoric, Architectural, Archaeological, and Cultural Resources• Consult with the Warwick Historical Cemetery Commission to address potentiali mpacts to four historical cemeteriesWater Quality• Design and construct stormwater management control systems in accordancewi th the 2010 RIDEM Stormwater Design and Installation Standards ManualCoastal Resources• Design the <strong>Improvement</strong> <strong>Program</strong> to comply with the applicable performancestandards, including the Special Area Management Plan goals and objecti ves.Ongoing2015 - 20202015 – 202020152015RIAC No monitoring required post completion 2015 – 2020RIACRIACNo monitoring required post completionNo monitoring required post completionRIAC No monitoring required post completion 2011TimingTBDPl an would be updated asEIS projects are impl ementedor wi thin 18 months of thei ssuance of the ROD,whi chever comes fi rst.2015Final design phaseRIAC TBD Final design phaseRIAC NA Final design phaseHazardous Materials, Solid Waste, and Pollution Prevention• Desi gn and construct the <strong>Improvement</strong> <strong>Program</strong> i n compliance with applicable local, state, RIAC No monitoring required post completion Final design phaseand federa l l aws and regulations concerning hazardous or soli d waste management 1Construction Period• Complete al l construction activities in compliance wi th the most recent editi on of FAA’ sAdvisory Circul ar 150/5370-10 Standards for Specifying Construction of <strong>Airport</strong>s• Relocate the portion of the water main in Ai rport Road that will be under theRunway 16 RSA• Incorporate appropriate construction mitigation measures i nto the contractRIACRIACRIACMonitoring during construction periodNo monitoring required post completionNo monitoring required post completionDuring constructionPrior to constructi on ofRunway 16 RSADuring constructiondocuments and specifications governing the activiti es of contractors andsubcontractors constructi ng elements of the <strong>Improvement</strong> <strong>Program</strong> 2Notes: Refer to Table 5-132 of Chapter 5, Envi ronmental Consequences, for a summary of other envi ronmental consequences by alternative. No mitigati on for otherenvironmental consequences is required for the other environmental impact categories, including: Air Quality; Histori c, Architectural, Archaeological, and CulturalResources; Section 4(f) Resources; Fish, Wildlife, and Pl ants; Threatened and Endangered Species; Farmlands; Light Emissions and Vi sual Envi ronment; and NaturalResources and Energy Supply.RIHRA Rhode Island Histori c Resource Archive.RICRMC Rhode Isl and Coastal Resources Management Council .1 Refer to Secti on 5.17.1, Regulatory Context, of Chapter 5, Envi ronmental Consequences, for the applicable local, state, and federal laws and regulations that governhazardous materials and soli d waste.2 Refer to Table 6-16 for a summary of proposed mitigation measures related to constructi on activiti es.Chapter 6 – Mitigation 6-43 July 2011\\Mawatr\ev\09228.00\reports\<strong>FEIS</strong>_Final_July_2011\<strong>PVD</strong>_CH06_Mitigation_JUL_2011.doc
T.F. <strong>Green</strong> <strong>Airport</strong> <strong>Improvement</strong> <strong>Program</strong>Environmental Impact Statement and Final Section 4(f) Evaluation6.21 Alternative B2 MitigationMitigation measures were identified for the T.F. <strong>Green</strong> <strong>Airport</strong> <strong>Improvement</strong> <strong>Program</strong> where eitherAlternatives B2 or B4 would result in significant impacts that are either permanent or temporary in nature(occur during construction). The results of the environmental consequences lead the FAA to identifyAlternative B4 as the Preferred Alternative, and RIAC has indicated a preference for Alternative B4 as itsProposed Action (see Chapter 3, Alternatives Analysis).Mitigation measures considered in this chapter of the <strong>FEIS</strong> focus on design measures to avoid or reduceimpacts, and measures to replace or restore the functions and values of lost resources. Section 6.2, Noise throughSection 6.20, Mitigation Implementation and Monitoring, focus on Alternative B4. This section includesAlternative B2 mitigation measures for comparative purposes only. Tables 6-1 and 6-2 also provide acomparison of Alternative B2 and B4 mitigation measures.6.21.1 NoiseAlternative B2 would require the acquisition of several properties due to the Fully Relocated <strong>Airport</strong> Road andassumes full participation in the clearing of the Runway 23 RPZ, neither of which are part of Alternative B4.These two items reduce the number of residential properties to the north of the airport under the noise contoursand thus reduce the numbers of properties affected by <strong>Improvement</strong> <strong>Program</strong>-related airport noise underAlternative B2. Thus, Alternative B2 would require fewer homes to be mitigated from aircraft noise whencompared to Alternative B4.6.21.1.1 Mitigation for Significant Noise Impacts for Alternative B2The number of homes exposed to noise levels greater than DNL 65 dB and eligible for sound insulation wouldbe approximately 10 percent lower in Alternative B2 than for Alternative B4 due to the land acquisition for RPZclearing and Fully Relocated <strong>Airport</strong> Road as noted above. The number of homes requiring mitigation due toexposure to significant impacts (for residences located at or above DNL 65 dB that would experience a noiseincrease of at least DNL 1.5 dB when compared to the No-Action Alternative) with Alternative B2 would beapproximately half that of Alternative B4.In 2020, Alternative B4 would expose two non-residential noise sensitive sites to a significant noise impact andAlternative B2 would expose none to a significant noise impact. (One of the two non-residential noise sensitivesite (Baha’i Faith) was already sound insulated as part of a previous sound insulation effort under the Part 150NCP and, therefore, would not require additional mitigation.) Almost twice as many homes would be exposedto a noise increase from traffic impacts in Alternative B2 when compared to Alternative B4. Both Alternative B4and Alternative B2 traffic noise impacts could be potentially mitigated with up to six noise barriers, howeverhalf of these for Alternative B2 would not be cost effective based on the RIDOT criteria described inSection 6.2.4.4, Install Noise Barriers or Berms on Main Avenue. For Alternative B2, through 2025, a total of zerohousing units would be newly eligible for Project-related noise mitigation (sound insulation) due to significantnoise impacts (no additional units in 2015, 2020, or 2025) compared to 24 units total under Alternative B4.Chapter 6 – Mitigation 6-44 July 2011\\Mawatr\ev\09228.00\reports\<strong>FEIS</strong>_Final_July_2011\<strong>PVD</strong>_CH06_Mitigation_JUL_2011.doc
T.F. <strong>Green</strong> <strong>Airport</strong> <strong>Improvement</strong> <strong>Program</strong>Environmental Impact Statement and Final Section 4(f) Evaluation6.21.1.2 Mitigation for Other Noise Impacts for Alternative B2In comparison to Alternative B4, the number of homes eligible for acquisition in a Future Build VLAP for noisemitigation (exposed to noise levels at or above DNL 70 dB consistent with Part 150) would be half as many withAlternative B2 (36 units under Alternative B2 verses 69 units under Alternative B4). This is due to the highernumber of residential parcels that would be acquired for construction for Alternative B2, including for FullyRelocated <strong>Airport</strong> Road, which is not proposed under Alternative B4, thus reducing the number of parcels thatwould be exposed to noise levels at or above DNL 70 dB.In comparison to Alternative B4, in 2015, Alternative B2 would not expose residential units to noise levelsbetween DNL 65 dB and DNL 69 dB and, therefore, no residents would be eligible for sound insulation, inaccordance with Part 150 criteria. In 2020 and 2025 under Alternative B2, the number of newly eligible residentsfor sound insulation mitigation would be comparable to Alternative B4 (131 units in 2020 and 299 units in 2025under Alternative B2 versus 157 units in 2020 and 324 units in 2025 under Alternative B4, as presented in Table6-6). For Alternative B2, through 2025, a total of 299 housing units would be newly eligible for Project-relatednoise mitigation (sound insulation) due to noise impacts (zero units in 2015, 131 units in 2020, and168 additional units in 2025) compared to 324 units total under Alternative B4.6.21.2 Compatible Land UseAs discussed previously in Section 6.3, Compatible Land Use, like for Alternative B4, compatible land usemitigation for Alternative B2 would be related to significant noise impacts, as identified by FAA Order 1050.1E,and to other increases in noise, in accordance with the Part 150 NCP as well as land acquisition.6.21.2.1 Mitigation for Significant Compatible Land Use Impacts for Alternative B2Refer to Section 6.2, Noise, for the significant noise impacts and required mitigation associated withAlternative B2 as compared to Alternative B4. As discussed in Section 6.2, Noise, mitigation in the form of soundinsulation is proposed for incompatible land uses (residential) and non-residential noise-sensitive sites (e.g.,schools) that would be exposed to a significant increase in noise as a result of the T.F. <strong>Green</strong> <strong>Airport</strong><strong>Improvement</strong> <strong>Program</strong>. Commercial, industrial, and agricultural uses are considered to be compatible with allnoise levels and do not require noise level reduction measures.6.21.2.2 Mitigation for Other Compatible Land Use Impacts for Alternative B2As with Alternative B4, other compatible land use impacts and proposed mitigation for Alternative B2addressed in this section are associated with changes to land use due to land acquisition for the T.F. <strong>Green</strong><strong>Airport</strong> <strong>Improvement</strong> <strong>Program</strong>.Compatible land use mitigation proposed for other land use impacts under Alternative B2 include the following:• See Section 6.21.1, Noise, for potential noise mitigation (in the form of sound insulation and land acquisitionconsistent with the criteria of Part 150) for other compatible land use (aircraft noise impacts).• See Section 6.21.3, Social and Socioeconomic, and Environmental Justice and Children’s Health and Safety Risks, forrequired mitigation for mandatory land acquisition due to construction.Chapter 6 – Mitigation 6-45 July 2011\\Mawatr\ev\09228.00\reports\<strong>FEIS</strong>_Final_July_2011\<strong>PVD</strong>_CH06_Mitigation_JUL_2011.doc
T.F. <strong>Green</strong> <strong>Airport</strong> <strong>Improvement</strong> <strong>Program</strong>Environmental Impact Statement and Final Section 4(f) Evaluation• See Section 6.3.2.1, Noise Land Reuse Plan Update, for RIAC’s proposed update to its Noise Land Reuse Plan(this proposed mitigation measure is the same for Alternatives B2 and B4).6.21.3 Social and Socioeconomic, and Environmental Justice and Children’s Health andSafety RisksAs with Alternative B4, Alternative B2 would not result in significant impacts to social and socioeconomicconditions, as discussed in Section 5.5, Social and Socioeconomic, and Environmental Justice and Children’s Health andSafety Risks, of Chapter 5, Environmental Consequences. Also, Alternative B2 would not result in adisproportionate effect on the socioeconomic environment or result in disproportionate adverse impacts toenvironmental justice populations (minority, Hispanic, or low-income populations) and, therefore, nomitigation measures are required. In addition, there are no significant impacts to children’s health and safety.Other social and socioeconomic impacts addressed in this section include the relocation of residences andbusinesses due to mandatory and voluntary property acquisitions for Alternative B2.6.21.3.1 Mitigation for Other Social and Socioeconomic Impacts for Alternative B2Alternative B2 would result in the relocation of residences and businesses due to mandatory and voluntaryproperty acquisitions (refer to Table 5-38 for a summary of property acquisitions). Overall, Alternative B2would result in a higher number of land acquisitions (mandatory and voluntary) compared to Alternative B4(247 parcels total consisting of 237 residential units and 41 businesses, and 105 parcels total consisting of140 residential units and twelve businesses, respectively). As proposed under Alternative B4, the relocationprocess for the full and partial property acquisitions for Alternative B2 would be carried out in accordance withthe URA requirements, as described previously in Section 6.4.1.1, Relocate and Compensate According to theUniform Relocation Act and in Appendix G.4, Conceptual Relocation Plan, of this <strong>FEIS</strong>.6.21.4 Surface TransportationWhen compared to the proposed mitigation for Alternative B4, two additional intersections would requiremitigation under Alternative B2: Post Road at Coronado Road and Main Avenue at Jefferson Boulevard.Mitigation measures could include, but are not limited to, geometric modifications and/or signal timing andphasing adjustments. Additionally, traffic signal timing and phasing adjustments throughout the Study Areawould differ for Alternative B2. This is due to the substantial shift in traffic that would be realized underAlternative B2 with the full relocation of <strong>Airport</strong> Road. The expected shift in regional traffic volume wouldrequire greater modifications to signal timing and phasing at some locations and no changes at others.Parking impacts are expected to be the same under both Alternative B2 and B4, therefore mitigation would alsobe the same for both alternatives.In addition to the transit impacts identified for Alternative B4, RIPTA Route 3, which operates on WarwickAvenue, would be affected by Alternative B2. Some bus stops along Warwick Avenue would require relocationunder Alternative B2. The route of travel itself would be unaffected.Chapter 6 – Mitigation 6-46 July 2011\\Mawatr\ev\09228.00\reports\<strong>FEIS</strong>_Final_July_2011\<strong>PVD</strong>_CH06_Mitigation_JUL_2011.doc
T.F. <strong>Green</strong> <strong>Airport</strong> <strong>Improvement</strong> <strong>Program</strong>Environmental Impact Statement and Final Section 4(f) EvaluationRoadway widening along Warwick Avenue under Alternative B2, and the increased traffic demand expectedcould impact the designation of the roadway segment as a “Suitable Road” for bicycle travel by RIDOT.Squantum Drive is also classified as a “Most Suitable Road” by RIDOT. This designation could be altered due tothe proposed alignment of Squantum Drive with Fully Relocated <strong>Airport</strong> Road under Alternative B2.Appropriate pedestrian and bicycle accommodations would be included in the final design of Fully Relocated<strong>Airport</strong> Road.6.21.5 Air QualityIn accordance with the NAAQS, 494 the air quality impact assessment findings show that, like Alternative B4,Alternative B2 is not expected to have a significant effect on air quality conditions locally, regionally, orstatewide (see Section 5.7, Air Quality, of Chapter 5, Environmental Consequences). Therefore, no specific airquality mitigation measures are required under NEPA or the General Conformity Rule. Other impacts related toair quality associated with the construction activities would be mitigated as described for Alternative B4 inSection 6.19, Construction Period Mitigation.6.21.6 Historic, Architectural, Archaeological, and Cultural ResourcesAs both Alternative B2 and B4 result in a finding of adverse effect to historical properties as defined underSection 106 of the NHPA and will impact historical cemetery (WHC 26) protected under Rhode Island GeneralLaw 23-18-22 et seq. and Chapter 12 of the Code of Ordinances of the City of Warwick, the proposed mitigationmeasures presented in Section 6.7, Historic, Architectural, Archaeological, and Cultural Resources, are the same forboth alternatives. Under Alternative B2 additional archaeological investigations and mitigation in the form of adata recovery program would be required to address an adverse effect to the Double L Site, an archaeologicalresource that is potentially eligible to the NRHP. Additional archaeological investigations would be required forthe AMF Road modification; if significant archaeological resources are identified, mitigation in the form of datarecovery would be required.6.21.7 Section 4(f) ResourcesMitigation is proposed for Section 4(f) resources that will be physically or constructively used under AlternativeB2: the eligible airport historic district; Hangar No. 1; Hangar No. 2, the Rhode Island State <strong>Airport</strong> Terminal;and Winslow Park. 495 Both Alternatives B2 and B4 would result in adverse effects to historical properties underNHPA Section 106 and a use under Section 4(f) of the USDOT Act. Both Alternatives B2 and B4 result in aphysical use of Winslow Park, a Section 4(f) recreational resource. Mitigation for Section 4(f) impacts tohistorical resources and recreational resources is the same under Alternative B2 and B4. Mitigation for historicalresources protected under Section 4(f) is described in Section 6.7, Historic, Architectural, Archaeological, andCultural Resources, and Chapter 7, Final Section 4(f)/Section 6(f) Evaluation. Mitigation for impacts to WinslowPark include relocation of the impacted facilities to the Cedar Swamp Road location as detailed in Chapter 7,Final Section 4(f)/Section 6(f) Evaluation.494 CFR Title 40, Part 50.495 Alternative B2 would result in a constructive use of Hangar No. 2 because of visual and access impacts but there would be no use under Alternative B4.Chapter 6 – Mitigation 6-47 July 2011\\Mawatr\ev\09228.00\reports\<strong>FEIS</strong>_Final_July_2011\<strong>PVD</strong>_CH06_Mitigation_JUL_2011.doc
T.F. <strong>Green</strong> <strong>Airport</strong> <strong>Improvement</strong> <strong>Program</strong>Environmental Impact Statement and Final Section 4(f) Evaluation6.21.8 Wetlands and WaterwaysThe DEIS included 11 conceptual wetland mitigation sites to compensate for unavoidable losses of 7.8 acres ofwetlands associated with Alternative B2 airport enhancements to Runway 23 and Runway 34. Wetland impactsassociated with safety enhancements to Runway 34 (including the relocation of Taxiway C, extension ofRunway 23 north across <strong>Airport</strong> Road, the relocation of the AMF access drive, and the full relocation of <strong>Airport</strong>Road) have been subsequently reduced to 5.8 acres. Unlike the Preferred Alternative, Alternative B2 woulddirectly impact Buckeye Brook and Wetland A5 immediately adjacent to the brook and would therefore involvethe loss of a greater array of wetland functions and values. The wetland impacts associated with Alternative B2are listed below and presented in Table 6-19. 496• 5.6 acres of wetlands providing a groundwater discharge function,• 2.9 acres of wetlands providing flood storage at the principal level,• 2.0 acres and 2.1 acres of wetlands providing sediment/toxicant/pollutant removal and nutrientremoval/retention/transformation, at the principal level, respectively,• 5.6 acres of wetlands providing groundwater recharge and discharge function,• 1.7 acres of wetlands providing a production export function,• 0.1 acres of wetlands providing sediment/shoreline stabilization,• 1.7 acres of wetlands providing fish and shellfish habitat function mostly at the principal level,• 3.8 acres of wetlands providing a wetland wildlife habitat function mostly at the principal level,• 0.2 acres of wetlands providing recreational value, and• 1.7 acres of wetlands with uniqueness/heritage value.Table 6-19Alternative B2: Wetland Functions and Values Impacted (acres)<strong>Program</strong> GWR/D- S/T/P R- NR/R/T- WLH- T&E U/H- VQ/A Element SWGW FFA WQ WQ PE S&S S F&SH WWH SH REC AES AESRunway 34 5.6 2.9 2.0 2.1 1.7 0.1 1.7 3.8 - 0.2 1.7X.X Principal Wetland Function or Value. S&S S Sediment and Shoreline Stabilization.X.X Additional Wetland Function or Value likely provided by wetland. F&SH Fish and Shellfish Habitat.GWR/D Groundwater Recharge/Discharge. WLH Wildlife Habitat.SWGW Surface Water and Groundwater. WWH Wildlife and Wildlife Habitat.FFA Floodflow Alteration. T&E SH Threatened and Endangered Species Habitat.S/T/P R Sediment/Toxicant/Pathogen Retention. REC Recreation.NR/R/T Nutrient Removal/Retention/Transformation. ED/SV Educational/Scientific Value.WQ Water Quality. U/H Uniqueness/Heritage.PE Production Export. AES Aesthetic.VQ/A Visual Quality/Aesthetics.As shown in Tables 6-19 and 6-20, Alternative B2 would have greater impacts to wetlands than Alternative B4and would therefore require more acres of wetland mitigation and more wetland mitigation sites.Alternative B2 would impact 5.8 acres of wetland, 5.2 acres of which are within the Buckeye Brook watershed.Except for the wetland creation/restoration proposed at Mitigation Sites 5 and 7, and preservation proposed at496 Alternative B2 would impact 1.8 acres of emergent wetland (0.4 acres is dominated by the invasive common reed), 0.6 acres scrub-shrub, and 3.4 acresforested wetland.Chapter 6 – Mitigation 6-48 July 2011\\Mawatr\ev\09228.00\reports\<strong>FEIS</strong>_Final_July_2011\<strong>PVD</strong>_CH06_Mitigation_JUL_2011.doc
T.F. <strong>Green</strong> <strong>Airport</strong> <strong>Improvement</strong> <strong>Program</strong>Environmental Impact Statement and Final Section 4(f) EvaluationMitigation Site 8, all of the compensatory wetland mitigation activities would take place in the Buckeye Brookwatershed.Table 6-20Alternative B2: Potential Wetland Mitigation Sites - Functions and ValuesFunctions and Values Provided by MitigationMitigation Site No./ Wetland Acres WLHLocation/Wetland ID Mitigation Type Class (est.) Ownership GWR/D FFA WQ PEx F&SH WWH RECSite 1 /Onsite/ WL A13Site 2 /Onsite/Lakeshore DriveSite 3 / Onsite/ WL A5Site 5/OffsiteCreation (includes somerestoration )PSS 3.0 RIAC P P - - - -Replace culvert - - RIAC/City P P - -Restore: remove old fillsEnhance: micro-relief andplanting of wet roadsRestore fill wetland alongPawtuxet RiverPSS/PFOPSS/PFO0.50.2RIAC - P X X X -PFO 1.8 P P X X XSite 6 / Onsite Creation PFO 1.0 RIAC X X XSite 7 / Offsite/ WL I 2 Create/restore in ramp infield PEM 1.0 RIDOT - - P - - - -Site 8 / Offsite/ ThreePonds Brook MarshSite 12 / OffsiteConimicut Point MarshPreservation: Wetland andUpland BufferPreservation: Coastal wetlandand upland bufferPEM/PSSBufferEstuarineIntertidalEmergent32.0 Public/Private P - X P X P -12.0 Private X P P XP Principal Wetland Function or Value. PFO Palustrine Forested Wetland.X Additional Wetland Function or Value likely provided by wetland. PSS Palustrine Scrub-Shrub Wetland.GWR/D Groundwater Recharge/Discharge.WLH Wildlife Habitat.FFA Floodflow Alteration. WQ Water Quality.F&S H Fish and Shellfish Habitat. WWH Wildlife and Wildlife Habitat.PEM Palustrine Emergent Wetland. REC Recreation.PEx Production Export.The following subsections and Table 6-21 summarize the differences in Alternative B2 and B4 mitigation.Mitigation sites 1, 8, and 12 would remain as described for Alternative B4.6.21.8.1 Mitigation Site 2Under Alternative B2 this culvert would have to be extended under the proposed new AMF access road inaddition to Lakeshore Drive. This would result in a culvert which is approximately 115 linear feet long and apotential restriction to fish passage.6.21.8.2 Mitigation Site 3Under Alternative B2 approximately 0.7 acres of this mitigation could not be completed as the new AMF accessroad would widen the <strong>Airport</strong> Perimeter Road rather than remove it.Chapter 6 – Mitigation 6-49 July 2011\\Mawatr\ev\09228.00\reports\<strong>FEIS</strong>_Final_July_2011\<strong>PVD</strong>_CH06_Mitigation_JUL_2011.doc
T.F. <strong>Green</strong> <strong>Airport</strong> <strong>Improvement</strong> <strong>Program</strong>Environmental Impact Statement and Final Section 4(f) Evaluation6.21.8.3 Mitigation Site 5This site has been added for Alternative B2 only. It is a wetland restoration site adjacent to the Pawtuxet Riverin Cranston.6.21.8.4 Mitigation Site 6This site would be expanded to approximately 1.0 acres for Alternative B2 with the target cover type forestedwetland.6.21.8.5 Mitigation Site 7This wetland restoration/creation site is located within the exit ramp infield that includes filled wetlands. Thissite is only being considered for mitigation for Alternative B2. This mitigation site would replace the waterquality function of Wetland I lost due to the construction of Fully Relocated <strong>Airport</strong> Road.Table 6-21Alternative B2: Wetland Mitigation Estimated AcreageWetland Mitigation TypeWetland MitigationSite NumbersCompensation SiteArea (acres) 1USACE New England DistrictRecommended Ratio 2Impacted WetlandArea EquivalentCreation/Restoration (In Kind) 3 1, 3, 5, 6, & 7 7.3 2.59:1 4 2.8Restoration/Enhancement (In Kind) 3 0.2 3:1 0.1Wetland/Buffer Preservation 8 & 12 44.0 15:1 2.9Total 44.9 NA 5.1 51 The mitigation program will replace the functions and values of the impacted wetlands as required by USACE.2 Weighted average for all wetland classes impacted from New England District Compensatory Mitigation Guidance (7-20-2010) Table 1.3 PEM dominated by Phragmites will not be replaced in kind.4 The mitigation equivalent of a creation/restoration site is calculated by dividing the area of the site by 2.59.5 Alternative B2 would require mitigation for the loss of 5.8 acres of wetland.The mitigation program for Alternative B2 requires more sites than Alternative B4 to achieve its goal due to thegreater area of wetland impact and the greater amount of forested wetland impacted (3.4 acres forAlternative B2 versus 0.2 acres for the Preferred Alternative). A mitigation program including more sites wouldbe proposed to compensate for the impacts associated with Alternative B2.6.21.9 Water QualityBased on the impact analysis presented in Chapter 5, Environmental Consequences, there are no significantimpacts on water quality as a result of Alternative B2. There would be no significant impacts to water quality,although there would be increases in impervious surfaces within some drainage areas for Alternatives B2 andB4 and lost water quality function of some wetlands as described above. Proposed stormwater mitigationmeasures developed in compliance with all applicable regulatory standards, including the RIDEM 2010Stormwater Design and Installation Standards Manual, would address the water quality impacts and ensure thereceiving waters would not be impacted from new discharges.Alternative B2 would have greater water quality impacts than Alternative B4 due to a substantial increase inroadway and parking areas. Alternative B2 requires greater overall new impervious area and would have a newstormwater discharge to Spring <strong>Green</strong> Pond from the Fully Relocated <strong>Airport</strong> Road. Alternative B2 would resultChapter 6 – Mitigation 6-50 July 2011\\Mawatr\ev\09228.00\reports\<strong>FEIS</strong>_Final_July_2011\<strong>PVD</strong>_CH06_Mitigation_JUL_2011.doc
T.F. <strong>Green</strong> <strong>Airport</strong> <strong>Improvement</strong> <strong>Program</strong>Environmental Impact Statement and Final Section 4(f) Evaluationin a net increase in roadway and parking area (impervious surfaces), with a 17.8-acre net increase, andAlternative B4 would result in no net change in roadway and parking area (impervious surfaces).Alternative B2 would incorporate three types of control measures to minimize changes to hydrology and waterquality: designed stormwater controls; operations and maintenance procedures; and construction-period controlmeasures, as described in Section 6.10, Water Quality, for Alternative B4. The conceptual design for AlternativeB2 is intended to comply with the most recent draft of the Rhode Island Stormwater Design and InstallationStandards Manual. No mitigation is required aside from compliance with RIDEM standards.6.21.10 Fish, Wildlife, and PlantsBased on the impact analysis presented in Chapter 5, Environmental Consequences, Alternative B2 would notsignificantly impact fish, wildlife, and plants. While the habitat for two state-listed species were observed in theProject Area (the pine barrens tiger beetle, and sickle-leaved golden aster), these habitats would not be impactedby Alternative B2. Alternative B2 would impact a 142-linear foot segment of Buckeye Brook north of LakeshoreDrive including the extension of an existing culvert by 30 linear feet. In order to avoid obstructing river herringpassage to spawning areas in Spring <strong>Green</strong> Pond, a new culvert would be designed to maintain passage. Therelocated stream channel would also be designed to promote fish passage to and from Spring <strong>Green</strong> Pond.Similar to Alternative B4, Alternative B2 avoids impact to important plant and wildlife habitat south ofRunway 34 and would not require additional mitigation.6.21.11 Threatened and Endangered SpeciesThere are no federally listed species of concern or threatened or endangered species within the Project Area and,therefore, there would be no significant impacts to threatened or endangered species as a result of theT.F. <strong>Green</strong> <strong>Airport</strong> <strong>Improvement</strong> <strong>Program</strong>. No mitigation is required.6.21.12 FloodplainsAlternative B2 would result in significant impacts as it would require filling of approximately 0.5 acres offloodplain. Alternative B2 would constitute a “significant encroachment” since it would cause adverse impactson natural and beneficial floodplain values. Alternative B2 would impact 0.7 acres less floodplain thanAlternative B4, and therefore less mitigation would be required.Alternative B2 impacts Lower Buckeye Brook through the construction of a new access road to the AMF andconstruction of the glide slope critical area east of the Runway 23 End. Partial mitigation for fill placed in theLower Buckeye Brook floodplain between <strong>Airport</strong> Road and Lakeshore Drive would be achieved by theremoval of an existing roadway fill section in this floodplain that is no longer needed by the <strong>Airport</strong>. Floodingof Lakeshore Drive would also be mitigated by replacing the existing, restrictive culvert under Lakeshore Drivewith a new structure with greater capacity. Additional mitigation measures would be implemented in BuckeyeBrook through the removal of existing roadway fill sections between <strong>Airport</strong> Road and Lakeshore Drive northof Warwick Pond (Wetland Mitigation Site 3) and with the construction of Wetland Mitigation Site 1, describedin Section 6.9, Wetlands and Waterways.Chapter 6 – Mitigation 6-51 July 2011\\Mawatr\ev\09228.00\reports\<strong>FEIS</strong>_Final_July_2011\<strong>PVD</strong>_CH06_Mitigation_JUL_2011.doc
T.F. <strong>Green</strong> <strong>Airport</strong> <strong>Improvement</strong> <strong>Program</strong>Environmental Impact Statement and Final Section 4(f) EvaluationAnalysis of state-regulated floodplain found that Alternative B2 also impacts floodplain associated withTributary A11 outside of the FEMA FIRM base flood boundary. This impact would also be mitigated at WetlandMitigation Site 1.6.21.13 Coastal ResourcesBased on the impact analysis presented in Chapter 5, Environmental Consequences, there would be no significantimpacts related to coastal resources as a result of the T.F. <strong>Green</strong> <strong>Airport</strong> <strong>Improvement</strong> <strong>Program</strong>. Therefore nomitigation is required.6.21.14 FarmlandsBased on the impact analysis presented in Chapter 5, Environmental Consequences, there would be no significantimpacts related to farmlands as a result of the T.F. <strong>Green</strong> <strong>Airport</strong> <strong>Improvement</strong> <strong>Program</strong>. Alternative B2 woulddirectly and indirectly impact a total of 18.8 acres of Farmland of Statewide Importance north of existing <strong>Airport</strong>Road due to the proposed Fully Relocated <strong>Airport</strong> Road and the Integrated Cargo Facility. Indirect impactscould ultimately result in the loss of the remaining 20.6-acre portion of the Confreda Farm under Alternative B2.The NRCS Farmland Conversion Impact Rating, as reported on Form AD 1006, is 125. This is well below thesignificance threshold identified in the FAA Order 1050.1E, which identifies significant impacts to farmlands, asimpacts to existing, intact farmland units that receive a score between 200 and 260 points using Form AD 1006.Form AD-1006 has been completed by the NRCS and is included in Appendix C, Federal, State, City, and TribalCoordination. Therefore, no mitigation would be required.6.21.15 Hazardous Materials, Pollution Prevention, and Solid WasteBased on the impact analysis presented in Chapter 5, Environmental Consequences, there would be no significantimpacts to hazardous materials, solid waste, or pollution prevention and, therefore, no mitigation is required.Alternative B2 would be designed and constructed in compliance with applicable local, state, and federal lawsand regulations concerning hazardous or solid waste management, as discussed in Chapter 5, EnvironmentalConsequences.6.21.16 Light Emissions and Visual EnvironmentBased on the impact analysis presented in Chapter 5, Environmental Consequences, Alternative B2 would notresult in significant impacts related to light emissions or the visual environment. While no mitigation isrequired, BMPs would be followed to further reduce impacts from light emissions. Additional light polesassociated with the expansion and modification of the <strong>Airport</strong> roadway system would use downcast hoods thatavoid light propagation to neighboring areas. Access to the new structured parking garage would face <strong>Airport</strong>land and a solid wall or screening would be designed facing the adjacent neighborhood.6.21.17 Energy Supply, Natural Resources, and Sustainable DesignBased on the impact analysis presented in Chapter 5, Environmental Consequences, Alternative B2 would notresult in significant impacts concerning energy, natural resources, or sustainable design and, therefore, nomitigation is required. However, acknowledging the intent of the FAA to encourage construction thatexemplifies the highest standards of design including principles of sustainability, and the intent of the State ofChapter 6 – Mitigation 6-52 July 2011\\Mawatr\ev\09228.00\reports\<strong>FEIS</strong>_Final_July_2011\<strong>PVD</strong>_CH06_Mitigation_JUL_2011.doc
T.F. <strong>Green</strong> <strong>Airport</strong> <strong>Improvement</strong> <strong>Program</strong>Environmental Impact Statement and Final Section 4(f) EvaluationRhode Island to require State buildings, with some exceptions, to be constructed to a LEED Silver rating, RIAChas committed to managing the design, construction, operation, and maintenance of the <strong>Airport</strong> usingsustainability principles, to the extent practicable.6.21.18 Construction Period MitigationTemporary, short-term impacts from construction activities would not be significant and would be mitigated tothe maximum extent practicable. All construction activities would comply with the most recent edition of FAA’sAdvisory Circular 150/5370-10 Standards for Specifying Construction of <strong>Airport</strong>s. 497 During construction a portionof the water main in <strong>Airport</strong> Road that will be under the Runway 16 RSA would be relocated as a constructionmitigation measure. Additionally, appropriate construction mitigation measures would be incorporated into thecontract documents and specifications governing the activities of contractors. On-site resident engineers andinspectors would monitor construction activities to ensure that mitigation measures are properly implemented.Alternative B2 construction would be phased differently than Alternative B4 with the Runway 5-23 extensionbeing constructed by 2020 for Alternative B2 instead of 2015 under Alternative B4. Construction impacts wouldalso occur in different locations as Alternative B2 includes Fully Relocated <strong>Airport</strong> Road and does not includethe Main Avenue Realignment. The Alternative B2 Partially Relocated <strong>Airport</strong> Road also follows an alignmentfarther to the north.Table 6-16 presents the proposed construction mitigation measures, which would be the same forAlternatives B2 and B4, but in different locations and phases as described in the paragraph above. Constructionperiod mitigation is only included for those environmental categories for which there would be short-termconstruction-related impacts.6.21.19 Mitigation Implementation and MonitoringThe FAA and RIAC will comply with the CEQ mitigation implementation and monitoring guidance bycataloging a baseline for resource conditions, establishing measurable performance standards, developingmonitoring plans, and monitoring mitigation to confirm its implementation and effectiveness. The FAA andRIAC will determine appropriate steps if the monitoring discloses mitigation failure. The FAA and RIAC willmake information available to the public. Tables 6-22 and 6-23 provide a summary of proposed mitigationimplementation and monitoring for significant Alternative B2 impacts and mitigation required for compliancewith other requirements.497 FAA Circular 150/5370-10, Standards for Specifying Construction of <strong>Airport</strong>s, U.S. Department of Transportation, FAA, September 30, 2009.Chapter 6 – Mitigation 6-53 July 2011\\Mawatr\ev\09228.00\reports\<strong>FEIS</strong>_Final_July_2011\<strong>PVD</strong>_CH06_Mitigation_JUL_2011.doc
T.F. <strong>Green</strong> <strong>Airport</strong> <strong>Improvement</strong> <strong>Program</strong>Environmental Impact Statement and Final Section 4(f) EvaluationTable 6-22Alternative B2: Summary of Proposed Mitigation Implementation and Monitoring forSignificant ImpactsMitigation MeasureResponsiblePartyProposedImplementation andEffectivenessMonitoringNoise• Provide sound insulation for residences l ocated at or above DNL 65 dB thatmonitori ng requi redwould experience a noise increase of at least DNL 1.5 dB when compared to theNo-Action Alternative for the same ti meframe 1 RIAC Nopost completi onCompatible Land Use• See NoiseHistoric, Architectural, Archaeological, and Cultural Resources• Prepare archival documentati on for the NRHP- eli gible airport historic district(including the Histori c District, State Termi nal, and Hangars No. 1 and 2) 2• Develop an interpretive display (physical and electronic) depicting the historica ldevelopment of the <strong>Airport</strong>.• Prepare list of items from Hangar No. 1 for possible salvage and curation.• Conduct archaeological investigati ons at Double L Si te, AMF Road, and areas ofdirect i mpact not previously surveyed (e.g., wetland mitigation areas, etc.)Section 4(f) Resources• Replace impacted Winslow Park recreation facilities on another site to mitigatefor the physical use impact• For eli gible airport historic district and Hangar No. 1 mitigation(see Historic, Architectural, Archaeological, and Cultural Resources)Wetlands and Waterways• Replace functions and values of 5.8 acres of wetl ands – Potential Mitigation Si tes Wetland Mitigation Si te 1 – 3.0 acres on-site wetland creation Wetland Mitigation Si te 2 – culvert replacement at Lakeshore Drive Wetland Mitigation Si te 3 – 0.7 acres on-site wetland restoration andenhancement Wetland Mitigation Si te 5 – 1.8 acres off-site restoration for wetland fill alongPawtuxet River Wetland Mitigation Si te 6 – 1.0 acres on-site wetland creation Wetland Mitigation Si te 7 – 1.0 acres off-site wetland creation/restorationRIACRIACRIACRIACRIACSee aboveRIACRIACRIACNo monitori ng requi redpost completi onNo monitori ng requi redpost completi onNo monitoring requiredpost completi onNo monitori ng requi redpost completi onNo monitori ng requi redpost completi onSee above5 years post constructi on5 years post constructi on5 years post constructi onRIAC 5 years post constructi onRIACRIAC5 years post constructi on5 years post constructi onTiming2020 – 2025 for homes impacted byRunway 5-23 extensionPrior to demolition of buil dingsTo be determined in consultation withRIHPHCPrior to demolition of Hangar No. 1Prior to wetland mitigation constructionPrior to operati on of Runway 5 EndPrior to Construction of Runway 34 RSAPrior to Construction of Runway 34 RSAPrior to Construction of Runway 34 RSAPrior to Construction of Runway 34 RSAPrior to Constructi on of Runway 34 RSAPrior to Construction of Runway 34 RSA Wetland Mitigation Si te 8 – 32.0 acres off-site wetl and and upland buffer preservati on Wetland Mitigation Si te 12 – 12.0 acres off-site coastal wetland and uplandbuffer preservationRIACRIAC5 years post constructi on5 years post constructi onPrior to Construction of Runway 34 RSAPrior to Construction of Runway 34 RSAFloodplains• Provide compensatory flood storage (incorporated in final design) RIAC No monitori ng requi red Prior to Construction of Runway 34 RSApost constructi onNotes: Refer to Table 5-131 of Chapter 5, Envi ronmental Consequences, for a summary of significant impacts by alternative.No mitigation for significant impacts is required for the other environmental impact categories, including: Social and Economic, and Environmental Justi ce,Children’s Health and Safety; Surface Transportati on; Air Quality; Water Quality; Fish, Wildlife, and Plants; Threatened and Endangered Speci es; CoastalResources; Farmlands; Hazardous Materials and Solid Waste; Light Emissions and Visual Envi ronment; and Natural Resources and Energy Supply.RIHRA Rhode Island Histori c Resource Archive.RICRMC Rhode Isl and Coastal Resources Management Council .1 According to Order 1050.1E, significant impacts are those residenti al units and non-residential noise-sensitive land uses that would be exposed to a signifi canti ncrease in noise (at least 1.5 dB increase or more in the DNL 65 dB or above noise contour intervals) due to the project. Resi dences exposed to noise levels70 dB and above are not considered significantly impacted; however, those residences would be eligible for land acquisiti on. See Tables 6-5 and 6-6 formitigation proposed for impacts that are not defined as signifi cant.2 The level of documentati on, either HABS/HAER or RIHRA will be determined through consultati on.Chapter 6 – Mitigation 6-54 July 2011\\Mawatr\ev\09228.00\reports\<strong>FEIS</strong>_Final_July_2011\<strong>PVD</strong>_CH06_Mitigation_JUL_2011.doc
T.F. <strong>Green</strong> <strong>Airport</strong> <strong>Improvement</strong> <strong>Program</strong>Environmental Impact Statement and Final Section 4(f) EvaluationTable 6-23Alternative B2: Summary of Proposed Mitigation Implementation and Monitoring forMitigation for Compliance with Other RequirementsMitigati on MeasureNoise• Continue implementi ng ongoing noi se compatibili ty measures for airport operati ons• Acquire residential parcel s exposed to noi se levels of DNL 70 dB and above throughparticipati on in a voluntary l and acquisition program• Provide sound insulati on for resi dences exposed to noise l evels between DNL 65 dB and69 dB• Install noise barri ers or berms on Ai rport Road as appropri ate following RIDOT’s protocol• Install qui eter pavement for rel ocated <strong>Airport</strong> Road as appropri ateResponsiblePartyRIACRIACRIACRIACRIACProposed Implementation andEffectiveness MonitoringNANo monitori ng requi red post completi onNo monitori ng requi red post completi onNo monitori ng requi red post completi onNo monitori ng requi red post completi onCompatible Land Use• See Noise• Update Noi se Land Reuse Pl an RIAC No monitori ng requi red post completi onSocioeconomi c, and Environmental Justice, Children’s Heal th and Safety Ri sks• Rel ocate and compensate fairl y, consistently, and equitabl y all acquired residents andbusi nesses according to the requi rements of the Uniform Relocati on ActSurface Transportati on• Relocate Park and Ride faciliti es and reroute RIPTA buses• Incorporate bicycl e and pedestrian accommodation i nto roadway projects as appropri ateWater Quali ty• Design and construct stormwater management contro l systems in accordance wi th the2010 RIDEM Stormwater Design and Installation Standards ManualOngoing2105 - 20252020 – 2025RIAC No monitori ng requi red post completi on 2020 – 2025RIACRIACNo monitori ng requi red post completi onNo monitori ng requi red post completi onTiming2015 - 20202015 for Partiall y RelocatedAi rport Road, 2020 for Full yRelocated Ai rport RoadTBDPlan woul d be updated asEIS proj ects are impl ementedor withi n 18 months of thei ssuance of the ROD,whichever comes fi rst.2015Final desi gn phaseRIAC TBD Fi nal desi gn phaseCoastal Resources• Desi gn the Project to comply wi th the applicable performance standards, includi ng the RIAC NA Fi nal desi gn phaseSpecial Area Management Plan goals and objecti ves.Hazardous Materials, Solid Waste, and Pollution Preventi on• Design and construct the Project i n compli ance with applicable local, state, and federa l RIAC No monitori ng requi red post completi on Fi nal desi gn phasel aws and regulations concerni ng hazardous or soli d waste management 1Construction Period• Complete al l construction activities in compliance wi th the most recent editi on of FAA’ sAdvisory Circul ar 150/5370-10 Standards for Specifying Construction of <strong>Airport</strong>s• Relocate the portion of the water mai n in Ai rport Road that will be under the Runway 16 RSARIACMonitori ng during construction peri odDuring constructi onRIAC No monitori ng requi red post completi on Pri or to constructi on ofRunway 16 RSA• Incorporate appropriate construction mitigati on measures i nto the contract documents andspecificati ons governing the activiti es of contractors and subcontractors constructi ngel ements of the Project 2RIAC No monitori ng requi red post completi on During constructi onNotes: Refer to Table 5-132 of Chapter 5, Envi ronmental Consequences, for a summary of other envi ronmental consequences by alternati ve. No mitigation for other envi ronmentalconsequences i s required for the other environmental i mpact categories, including: Air Quality; Historic, Architectural, Archaeological, and Cultural Resources; Secti on 4(f) Resources;Fish, Wildlife, and Plants; Threatened and Endangered Species; Farmlands; Light Emissions and Visual Envi ronment; and Natural Resources and Energy Supply.RIHRA Rhode Island Histori c Resource Archive.RICRMC Rhode Isl and Coastal Resources Management Council .1 Refer to Secti on 5.17.1, Regul atory Context, of Chapter 5, Envi ronmental Consequences, for the applicable local, state, and federal laws and regulations that governhazardous materials and soli d waste.2 Refer to Table 6-16 for a summary of proposed mitigation measures related to construction activiti es.Chapter 6 – Mitigation 6-55 July 2011\\Mawatr\ev\09228.00\reports\<strong>FEIS</strong>_Final_July_2011\<strong>PVD</strong>_CH06_Mitigation_JUL_2011.doc
T.F. <strong>Green</strong> <strong>Airport</strong> <strong>Improvement</strong> <strong>Program</strong>Environmental Impact Statement and Final Section 4(f) EvaluationThis Page Intentionally Left BlankChapter 6 – Mitigation 6-56 July 2011\\Mawatr\ev\09228.00\reports\<strong>FEIS</strong>_Final_July_2011\<strong>PVD</strong>_CH06_Mitigation_JUL_2011.doc
T.F. <strong>Green</strong> <strong>Airport</strong> <strong>Improvement</strong> <strong>Program</strong>Environmental Impact Statement and Final Section 4(f) Evaluation7Final Section 4(f)/Section 6(f) Evaluation7.1 IntroductionThe U.S. Department of Transportation Act of 1966, Section 4(f) requires Department of Transportation (DOT) agenciesto protect certain public resources when making transportation improvements. These resources, collectively referredto as Section 4(f) resources, include publicly owned parks, recreation areas, wildlife or waterfowl refuges, or historicalproperties of national, state, or local significance. This chapter describes Section 4(f) resources within the Study Areathat would be impacted by the alternatives under consideration for the Proposed Action. If a prudent and feasiblealternative exists that avoids Section 4(f) resources and it meets the project purpose and need, the federal agenciesmay not select the alternative that uses a Section 4(f) resource. 498 This chapter contains a prudent and feasiblealternatives analysis, and discusses mitigation measures that would be employed to minimize harm to Section 4(f)properties resulting from use. Section 4(f) properties in the Study Area that will not be subject to a physical orconstructive use under Section 4(f) (as defined in Section 7.3, Methodology) were evaluated in Chapter 5, EnvironmentalConsequences. This chapter also discusses Section 6(f) resources. Section 6(f) resources are those that have beenacquired or improved with grants under Section 6(f) of the Land and Water Conservation Fund Act (L&WCFA) of 1965.7.2 Regulatory ContextCongress’ intent to preserve publicly owned parks and recreation lands, wildlife and waterfowl refuges ofnational, state, or local significance, or any historical site of national, state, or local significance is outlined inU.S. Department of Transportation Act of 1966, Section 4(f), as re-codified at 49 U.S.C., section 303(c). Consistentwith FAA Order 1050.1E, this <strong>FEIS</strong> refers to section 303(c) as “Section 4(f).” The FAA used the FHWA/FTAregulations set forth at 23 CFR Parts 771 and 774 as guidance to the extent relevant to the FAA programs.The historical resources determined to be protected under the provisions of Section 4(f) and subject to use underthe Proposed Action are all on-<strong>Airport</strong> and include: an eligible airport historic district, the Rhode Island State<strong>Airport</strong> Terminal Building, Hangar No. 1, and Hangar No. 2. These historical resources are protected underSection 4(f) since they are either listed in the National Register of Historic Places (NRHP) or determined to be498 Environmental Desk Reference for <strong>Airport</strong> Actions, FAA, October 5, 2007, Chapter 7, Section 4(f) Resources.Chapter 7 – Final Section 4(f)/Section 6(f) Evaluation 7-1 July 2011\\Mawatr\ev\09228.00\reports\<strong>FEIS</strong>_Final_July_2011\<strong>PVD</strong>_CH07_4(f)_JUL_2011.doc
T.F. <strong>Green</strong> <strong>Airport</strong> <strong>Improvement</strong> <strong>Program</strong>Environmental Impact Statement and Final Section 4(f) Evaluationeligible for listing in the NRHP. One Section 4(f) recreational resource subject to use is Winslow Park, a publicrecreational facility located south of the <strong>Airport</strong>.7.3 MethodologyThe Secretary of Transportation may not approve any program or project that requires the use of any propertyprotected under the U.S. Department of Transportation Act of 1966, Section 4(f), unless there is no feasible and prudentalternative to the use of such land, and the project includes all possible planning to minimize harm resulting from theuse. 499,500 The FAA considers the following criteria to determine whether an action would result in a physical orconstructive use: 501• A physical use would occur when a project would require the physical taking of lands being used for aSection 4(f) resource, including when the proposed project would physically occupy a portion of or all of aSection 4(f) resource; when the proposed project permanently incorporates the resource for project purposesthrough acquisition or easement; or if alteration of structures or facilities located on Section 4(f) resources isnecessary, even though the action does not require buying property. A temporary occupancy of land wouldalso result in a physical use when the duration of the occupancy is greater than the duration needed to buildthe project and there is a change in ownership of the land; the project’s work scope is major in the natureand magnitude of changes to the Section 4(f) resource; permanent adverse physical impacts would occur,the land use is not fully restored; or there is no documented agreement with the appropriate official havingjurisdiction over the resources with regard to the aforementioned conditions.• A constructive use does not physically occupy or require purchase of the Section 4(f) resource but wouldoccur when an action would substantially impair that resource. Substantial impairment occurs only whenthe activities, features, or attributes of the resource that contribute to the resource’s significance orenjoyment are substantially diminished.Once the FAA determines a use of a Section 4(f) property for transportation purposes, after consideration of anyimpact avoidance, minimization and mitigation or enhancement measures, results in a de minimis impact on thatproperty, an analysis of avoidance alternatives is not required and the Section 4(f) evaluation process is complete.De minimis impacts related to historical sites are defined as the determination of either “no adverse effect” or “nohistoric properties affected” in compliance with Section 106 of the National Historic Preservation Act of 1966. Deminimis impacts to publicly owned parks, recreation areas, and wildlife and waterfowl refuges are defined as thosethat do not “adversely affect the activities, features and attributes” of the Section 4(f) resource. 502The Study Area for the T.F. <strong>Green</strong> <strong>Airport</strong> <strong>Improvement</strong> <strong>Program</strong> (Figure 7-1) is defined noise impacts:specifically, by the area in which DNL would potentially reach 60 dB and above. The Study Area was developedbased on changes in noise levels because increased noise constitutes the largest geographic effect with the499 U.S. Department of Transportation Act of 1966, Section 4(f), 49 U.S.C., section 303(c).500 FAA Order 1050.1E, Environmental Impacts: Policies and Procedures, U.S. Department of Transportation, March 20, 2006, Appendix A, section 6,Department of Transportation Act, Section 4(f), March 20, 2006.501 Environmental Desk Reference for <strong>Airport</strong> Actions, FAA, October 5, 2007.502 Ibid.Chapter 7 – Final Section 4(f)/Section 6(f) Evaluation 7-2 July 2011\\Mawatr\ev\09228.00\reports\<strong>FEIS</strong>_Final_July_2011\<strong>PVD</strong>_CH07_4(f)_JUL_2011.doc
T.F. <strong>Green</strong> <strong>Airport</strong> <strong>Improvement</strong> <strong>Program</strong>Environmental Impact Statement and Final Section 4(f) Evaluationpotential to impair the use of Section 4(f) properties. The Study Area also includes the footprint of constructionand land acquisition associated with the T.F. <strong>Green</strong> <strong>Airport</strong> <strong>Improvement</strong> <strong>Program</strong>. GIS mapping combinedwith the property acquisition boundaries was used to identify properties that would be directly impacted.7.4 Description of Section 4(f) PropertiesThe following sections describe the context of the Section 4(f) historical and recreational properties that wouldbe used by the proposed T.F. <strong>Green</strong> <strong>Airport</strong> <strong>Improvement</strong> <strong>Program</strong>.7.4.1 Eligible <strong>Airport</strong> Historic DistrictThrough this EIS evaluation, the FAA determined that a portion of the airport is eligible for listing in the NRHPas a historic district at the state level under National Register Criteria A and C in the areas of Transportation,Commerce, Architecture, Engineering, and Military. 503 This determination of the eligible airport historic district(Figure 7-2) was triggered by FAA’s survey provided to the Rhode Island State Historic Preservation Officer(RISHPO) and RISHPO’s subsequent statement that it appeared to be eligible for listing as a historic district. 504The eligible airport historic district derives its significance from its association with the development of RhodeIsland’s first state airport and aeronautical transportation system. The “unified” approach to airport design andinfrastructure were responses to the rapidly evolving requirements of the commercial air travel industry, aswell as the U.S. military presence before, during, and after World War II.The eligible airport historic district is a 277-acre area (Figure 7-2) on a larger 1,100-acre parcel owned by the Stateof Rhode Island and operated by RIAC containing the airport runways, terminal, and ancillary facilities. Theeligible airport historic district contains a total of seven resources: five contributing historical aviation buildings,one contributing structure (Runway and Taxiway Complex), and one non-contributing building (hangar at596 <strong>Airport</strong> Road). One contributing building, the Rhode Island State Terminal Building, was previously listed in1983 in the NRHP as part of the Warwick, Rhode Island Multiple Resource Area nomination. Two contributingbuildings, Hangar No. 1 and Hangar No. 2, were determined individually eligible for listing in the NRHP throughconsensus between the FAA and the RISHPO. The landscape and surroundings are flat, with the buildingsarranged in a 2,500-foot long east-west line along the south edge of <strong>Airport</strong> Road, with the open runway/taxiwaycomplex extending approximately 4,000 feet to 6,000 feet to the south. The buildings include, from west to east,Hangar No. 1 (1938), the Fire Station (circa [ca.] 1931, 1959), the Rhode Island <strong>Airport</strong> State Terminal Building(1933), Hangar No. 2 (1942), and Hangar No. 3 (1950). The eligible airport historic district boundary was drawn toinclude the extent of the surviving original runway and taxiway pattern, and to exclude a row of five modernaircraft hangars between the State Terminal Building and Hangar No. 2 located at 570 through 544 <strong>Airport</strong> Road.The eligible airport historic district, located on the south side of existing <strong>Airport</strong> Road, is on the <strong>Airport</strong> within adeveloped urban area of Warwick, Rhode Island. The public travelling by car or on foot along <strong>Airport</strong> Road can503 36 CFR 60.4 Criteria of Evaluation.504 The eligible airport historic district was determined to be eligible for listing on the NRHP through consensus between the FAA and the RISHPO in 2009.Refer to DEIS Appendix B, Federal, State, City and Tribal Correspondence, for correspondence between the FAA and the RISHPO. It has not been formallyplaced on the Register.Chapter 7 – Final Section 4(f)/Section 6(f) Evaluation 7-3 July 2011\\Mawatr\ev\09228.00\reports\<strong>FEIS</strong>_Final_July_2011\<strong>PVD</strong>_CH07_4(f)_JUL_2011.doc
T.F. <strong>Green</strong> <strong>Airport</strong> <strong>Improvement</strong> <strong>Program</strong>Environmental Impact Statement and Final Section 4(f) Evaluationeasily view the historic district and its contributing buildings in what remains of the original setting at T.F.<strong>Green</strong> <strong>Airport</strong>.7.4.2 Individual Historical PropertiesHangar No. 1, Hangar No. 2, and the Rhode Island State <strong>Airport</strong> Terminal Building, located within the eligibleairport historic district, are also individually listed or determined eligible for listing in the NRHP throughconsensus between FAA and the RISHPO.Rhode Island State <strong>Airport</strong> Terminal BuildingThe Rhode Island State <strong>Airport</strong> Terminal Building(Figure 7-2), located at 572 <strong>Airport</strong> Road, was listedin the NRHP in 1983. It is a two-story Art Decostylebuilding, T-shaped in plan, measuring 84 feeteast-west by 44 feet north-south. It has flat roofs,stucco-clad concrete walls, and a concrete slabfoundation. The building is strongly symmetrical,with a prominent center entrance on the northelevation. The exterior retains much of itsarchitectural integrity. The building is currentlyused for RIAC offices. Remaining portions of theView of RI State <strong>Airport</strong> Terminal from <strong>Airport</strong> Roadoriginal landscaping elements add to its historicalsignificance and include dual curved driveways from <strong>Airport</strong> Road to the north and on the airside to the south, and asemi-circular lawn with three radiating walkwaysleading to the apron.AccessThe Rhode Island State <strong>Airport</strong> Terminal Buildingborders existing <strong>Airport</strong> Road on the northern edge ofthe T.F. <strong>Green</strong> <strong>Airport</strong>. The public travelling by carand on foot along <strong>Airport</strong> Road can view the RhodeIsland State <strong>Airport</strong> Terminal Building in its historicalsetting.Hangar No. 1Hangar No. 1 (Figure 7-2), located at 628-662 <strong>Airport</strong>Road northeast of the intersection of Runway 16 andView of Hangar No. 1 from <strong>Airport</strong> RoadTaxiway F, was determined to be eligible for listing inthe NRHP. It is also an example of the Art Deco style and consists of three visually distinct attached buildings. Thebuilding that fronts on <strong>Airport</strong> Road, the office block, houses offices, a hangar for small general aviation aircraft,and shop facilities. The main hangar is attached to the south elevation of the office building. Attached to the southelevation of the main hangar is a former operations and aircraft control tower. All of the buildings that make upChapter 7 – Final Section 4(f)/Section 6(f) Evaluation 7-4 July 2011\\Mawatr\ev\09228.00\reports\<strong>FEIS</strong>_Final_July_2011\<strong>PVD</strong>_CH07_4(f)_JUL_2011.doc
T.F. <strong>Green</strong> <strong>Airport</strong> <strong>Improvement</strong> <strong>Program</strong>Environmental Impact Statement and Final Section 4(f) EvaluationHangar No. 1 have flat roofs, yellow brick masonry walls, and concrete slab foundations. Hangar No. 1 wasdetermined to be eligible because it is significant under NRHP Criteria A and C in the areas of architecture,commerce, and transportation with significance at the state and local level as an example of mid-twentieth centuryair travel infrastructure.AccessHangar No. 1 is located within a developed commercial and residential area of Warwick. Hangar No. 1 bordersexisting <strong>Airport</strong> Road on the northern edge of the T.F. <strong>Green</strong> <strong>Airport</strong>. The public travelling by car and on footalong existing <strong>Airport</strong> Road can view Hangar No. 1 in its historical setting.Hangar No. 2The Lt. Gerald P. Kennedy Hangar (Hangar No. 2) (Figure 7-2), located at 540 <strong>Airport</strong> Road, 1,050 feet east of theTerminal Building and north of the intersection of Taxiway A and Taxiway M, was determined to be eligible forlisting in the NRHP. It is an example of the Art Modernestyle and consists of three visually distinct attachedblocks. At its core is the main aircraft hangar, whichmeasures 222 feet long east to west by 137 feet widenorth to south. An approximately 375-foot long, 23-footwide maintenance block is attached to the northelevation of the main hangar, and a 222-foot long by27-foot wide office block is attached to its southelevation. Hangar No. 2 is significant under Criteria Aand C in the areas of architecture, commerce, andtransportation with significance at the state and locallevel as an example of mid-twentieth century air travelinfrastructure.View of Hangar No. 2 from <strong>Airport</strong> RoadAccessHangar No. 2 borders existing <strong>Airport</strong> Road on the northern edge of the T.F. <strong>Green</strong> <strong>Airport</strong>. The publictravelling by car and on foot along existing <strong>Airport</strong> Road can view Hangar No. 2 in its historical setting.Runway and TaxiwayThe Hillsgrove State <strong>Airport</strong> was an early example of late 1930s/early 1940s trends in and philosophies of civilairport design and construction, some of which espoused the concept of “unity.” With increasing size of aircraftin the 1930s, airport facilities became more spread out, and new facility layouts were developed to maximizeefficiency. By the late 1930s, philosophies of comprehensive design for airports treating the buildings andrunways as complete coordinated efficient systems were being promoted in the aeronautics press. In late 1937,Aviation magazine published a three-part article about comprehensive airport planning by John Walter Wood,who’s “Wood System” basic principles were patented in the U.S., Canada, England, and France. Themid-1930s/early 1940s Hillsgrove State <strong>Airport</strong>/T.F. <strong>Green</strong> <strong>Airport</strong> infrastructure reflects many of the WoodSystem requirements, including multiple runways on an X-shaped plan maximizing use of airport land,minimizing taxiing distances from terminal and hangars to runways, and allowing safe takeoff and landing invarious wind conditions; incorporating a network of perimeter taxiways to prevent planes from passing acrossChapter 7 – Final Section 4(f)/Section 6(f) Evaluation 7-5 July 2011\\Mawatr\ev\09228.00\reports\<strong>FEIS</strong>_Final_July_2011\<strong>PVD</strong>_CH07_4(f)_JUL_2011.doc
T.F. <strong>Green</strong> <strong>Airport</strong> <strong>Improvement</strong> <strong>Program</strong>Environmental Impact Statement and Final Section 4(f) Evaluationprimary runways, and a large apron connecting all terminal and hangar buildings, and the runways andtaxiways, for maximum flexibility of movement. The expansions and addition of Runway 5R-23L in 1951reflected additional aspects of the Wood System associated with planning for airport expansion, includingseparate parallel runways for simultaneous take-offs and landings. The original configuration of the runwayand taxiway has been modified over the years. The original Runway 5L-23R is currently operating asTaxiway V.7.4.3 Recreational AreasOne public recreation area, Winslow Park (Figure 7-3), would be used by the T.F. <strong>Green</strong> <strong>Airport</strong> <strong>Improvement</strong><strong>Program</strong>. Winslow Park is a 31.7-acre facility located at Greeley Avenue, primarily within the existing RPZ ofRunway 5. Twenty-six acres of the park are actively used for recreational activities. Winslow Park contains asoftball complex with six softball fields, soccer fields, two playgrounds, a concessions building and restroom, alandscaped walking path, and three parking areas. The park has two main playing field areas. The softballcomplex, which includes four full-sized softball fields and two smaller softball fields, is bounded by GreeleyAvenue on the west, Stephens Avenue on the south, Groveland Avenue on the east, and Taft and BedfordAvenues on the north. The soccer fields and passive recreational area with walking trails are approximatelybounded by Gladys Court on the west, Stephens Avenue on the south, Groveland Avenue on the east, andundeveloped land owned by RIAC on the north. The softball complex is actively used by the Apponaug GirlsSoftball League, based in the City of Warwick. One playground is located in the passive recreational area andone playground is located within the area of the softball field complex.The park is located to the south of the Runway 5 End and borders the <strong>Green</strong>wood neighborhood, a developedresidential area of Warwick. The majority of the park is located on land owned by RIAC (27.4 acres) and twosmaller portions of the park are located on land owned by the City of Warwick (4.2 acres). The City ofWarwick’s area includes two softball fields, and a smaller 0.1-acre area of the soccer field parking lot as shownon Figure 7-3.The City of Warwick has leased the 27.4 acre area of the park for recreational use from RIAC since 1987 at a costof one dollar per year. 505 The 1987 lease agreement indicates that the land is in the “immediate proximity” to theT.F. <strong>Green</strong> State <strong>Airport</strong> and located within the <strong>Airport</strong>’s clear zone (now referred to as an RPZ). As a term ofthe lease, the City agreed to “alter, curtail, relocate or temporarily, permanently, or immediately cease its use ofthe premises upon notice from the Landlord.” 506 FAA Order 1050.1E, Appendix A at 6.2c and the EnvironmentalDesk Reference for <strong>Airport</strong> Actions (October 2007) indicate that a Section 4(f) determination is not ordinarilyrequired where land used as a recreational facility or park is temporary and interim. However, the recreationalfacilities are in active use by the public and the ownership of the facilities that make up and allow access to theWinslow Park ballfields and soccer fields is intermingled between RIAC and the City of Warwick. As a result ofthis intermingled ownership and in an abundance of caution for purposes of the EIS analysis, the FAA will treatthe entire park (including leased area) as a Section 4(f) resource.505 The land was originally leased from the Rhode Island Department of Transportation in 1987. In 1992, RIAC was formed at which time RIAC became the leaser.506 According to the lease, the landlord has the right to terminate at any time by giving at least 180 days written notice of intent. The City must remove at itscost all structures and materials, including foundations, level off surface of land and restore the property to the condition that it was in prior to Tenant’s use.Chapter 7 – Final Section 4(f)/Section 6(f) Evaluation 7-6 July 2011\\Mawatr\ev\09228.00\reports\<strong>FEIS</strong>_Final_July_2011\<strong>PVD</strong>_CH07_4(f)_JUL_2011.doc
T.F. <strong>Green</strong> <strong>Airport</strong> <strong>Improvement</strong> <strong>Program</strong>Environmental Impact Statement and Final Section 4(f) Evaluation7.5 Use of Section 4(f) PropertiesThis section describes the use of properties under the T.F. <strong>Green</strong> <strong>Airport</strong> <strong>Improvement</strong> <strong>Program</strong> affordedprotection under Section 4(f). For a noise impact to constitute a constructive use, the noise level must be highenough to substantially impair the use and enjoyment of the impacted Section 4(f) property. The noise impactanalysis contained in Chapter 5, Environmental Consequences, includes an evaluation of potential noise impactsand concludes that Alternatives B2 and B4 would not result in a constructive use of Section 4(f) properties dueto noise. At this time, the FAA does not anticipate that any temporary occupancy of Section 4(f) propertiesduring construction as a result of the need for temporary construction easements or activities.7.5.1 Section 4(f) Impacts to Historical PropertiesFigure 7-4 shows the relationship of the No-Action Alternative and Alternatives B2 and B4 to the eligible airporthistoric district and its contributing elements.7.5.1.1 No-Action AlternativeThe No-Action Alternative would have no Section 4(f) impacts to historical properties but does not meet theproject Purpose and Need. The No-Action Alternative was included to comply with the requirements of NEPAand to provide a benchmark against which the benefits and impacts of Alternatives B2 and B4 could becompared. Based on its inability to meet the project Purpose and Need, the No-Action Alternative is feasible,but not prudent, since Hangar No. 1 would remain as an obstruction.7.5.1.2 Alternative B2Alternative B2 was developed to avoid impacts to Main Avenue and to Buckeye Brook south and north of the<strong>Airport</strong> and to minimize impacts to residential communities. Alternative B2 includes extending Runway 5-23 toa total length of 8,700 feet, which would also require fully relocating <strong>Airport</strong> Road. <strong>Airport</strong> Road is an east-westurban arterial, with commercial development at the east and west ends that connects Post Road with WarwickAvenue at Hoxsie Four Corners. Under Alternative B2, <strong>Airport</strong> Road would be partially relocated to the northby 2015 (Partially Relocated <strong>Airport</strong> Road) and fully relocated from Warwick Avenue to Post Road (FullyRelocated <strong>Airport</strong> Road) by 2020. Fully Relocated <strong>Airport</strong> Road would provide a direct connection to Route 37.An Integrated Cargo Facility would be constructed west of the Runway 23 End in the area currently occupiedby existing <strong>Airport</strong> Road.Eligible <strong>Airport</strong> Historic DistrictAlternative B2 would result in physical and constructive uses of contributing elements of the eligible airporthistoric district. Under Alternative B2, modifications and improvements to runways and taxiways at thenorthern end of the airfield would further alter the historical configuration of the airfield, resulting in anadverse effect to the eligible airport historic district and a physical use of the historic district. Specific impacts tocontributing buildings in the district, as more fully discussed below, include visual impacts to the Rhode IslandState <strong>Airport</strong> Terminal and Hangar No. 2, the demolition of Hangar No. 1, and minor physical impacts toHangar No. 2 and alteration of the runways and taxiways.Chapter 7 – Final Section 4(f)/Section 6(f) Evaluation 7-7 July 2011\\Mawatr\ev\09228.00\reports\<strong>FEIS</strong>_Final_July_2011\<strong>PVD</strong>_CH07_4(f)_JUL_2011.doc
T.F. <strong>Green</strong> <strong>Airport</strong> <strong>Improvement</strong> <strong>Program</strong>Environmental Impact Statement and Final Section 4(f) EvaluationRhode Island State <strong>Airport</strong> TerminalUnder Alternative B2, Fully Relocated <strong>Airport</strong> Road would limit the public’s view and access to the historicalsetting of the Rhode Island State <strong>Airport</strong> Terminal, resulting in an adverse effect. There would be a constructiveuse of the Rhode Island State <strong>Airport</strong> Terminal because the ability of the public to view the terminal fromexisting <strong>Airport</strong> Road contributed to the enjoyment of this historical property and due to the relocation of<strong>Airport</strong> Road, this feature would no longer exist.Hangar No. 1Hangar No. 1 would be completely removed, resulting in a physical use of a contributing element of the eligiblehistoric district, as well as an individually eligible property (Figure 7-4). Hangar No. 1 is currently anobstruction as defined by 14 CFR Part 77, Objects Affecting Navigable Airspace, which establishes standards fordetermining obstructions in navigable airspace surrounding airports. The navigable airspace is defined for eachairport by a series of imaginary surfaces, which are dependent on the configuration and approach categories ofeach of the airport’s runways. The dimensions of the imaginary surfaces for a precision instrument approachrunway (such as Runway 5-23 at T.F. <strong>Green</strong> <strong>Airport</strong>) are larger than those associated with a visual ornon-precision runway approach (such as Runway 16 at T.F. <strong>Green</strong> <strong>Airport</strong>), to provide greater safety marginsfor operations in low visibility conditions when the instrument landing system navigational equipment is mostcommonly used. Runway 16 has a 5,000-foot visibility minimum (slightly less than one mile) due to approacharea obstructions of Hangar No. 1. Failure to remove the hangar affects the utility of Runway 16 for futureprecision instrument approaches that require a greater visibility range. The Part 77 primary surface alongRunway 16-34 is 1,000 feet wide (500 feet on each side of the runway centerline). Hangar No. 1 is situated so thatthe majority of the building is an obstruction within the Part 77 primary surface, as shown in Figure 7-5.Hangar No. 1 is also located within the runway object free area (ROFA) and the taxiway object free area (TOFA)(Figure 7-5). 507 The ROFA and TOFA are “areas on the ground centered on a runway, taxiway, or taxilanecenterline provided to enhance the safety of aircraft operations by having the area free of objects, except forobjects that need to be located in the OFA for air navigation or aircraft ground maneuvering purposes.” 508 TheROFA provides an area adjacent to the runway safety area that is clear of objects that could cause damage to theengine pods or other parts of an aircraft if an aircraft inadvertently overruns or veers off a runway.FAA 14 CFR Part 77 regulations are used to determine Part 77 primary surface and enhance safety during theapproach phase of flight while the ROFA and TOFA enhance safety during airplane movements on the ground.Hangar No. 2The interior of the Hangar No. 2 structure would be modified to accommodate the proposed Integrated CargoFacility. Hangar No. 2 is currently being used for cargo operations. Some modifications to the interior of thehangar would constitute a physical use of Hangar No. 2. However, there are no proposed changes to theexterior of the building or any feature that contributes to its historical significance. Upon further consultationwith the RISHPO, the FAA has determined that the proposed interior modifications would not result in anadverse effect to Hangar No. 2. Based upon these considerations, the impacts meet the criteria for a finding ofde minimis impact according to the FAA Environmental Desk Reference for <strong>Airport</strong> Actions. The FAA may make a507 FAA Advisory Circular 150/5300-13 establishes dimensional standards for object free areas and runway taxiway separations.508 Ibid.Chapter 7 – Final Section 4(f)/Section 6(f) Evaluation 7-8 July 2011\\Mawatr\ev\09228.00\reports\<strong>FEIS</strong>_Final_July_2011\<strong>PVD</strong>_CH07_4(f)_JUL_2011.doc
T.F. <strong>Green</strong> <strong>Airport</strong> <strong>Improvement</strong> <strong>Program</strong>Environmental Impact Statement and Final Section 4(f) Evaluationde minimis finding if, after public notice and opportunity for public review and comment, it has determined thatthe project will not adversely affect the activities, features, and attributes of the eligible Section 4(f) property andthe officials having jurisdiction over the Section 4(f) property (in this case, the RISHPO) have concurred withthis determination. 509However, Fully Relocated <strong>Airport</strong> Road under Alternative B2 would result in a constructive use ofHangar No. 2 since <strong>Airport</strong> Road would be fully relocated to the north of the <strong>Airport</strong>. The public’s access andview of Hangar No. 2 from existing <strong>Airport</strong> Road would be eliminated. There would be a constructive usebecause the ability of the public to view Hangar No. 2 from <strong>Airport</strong> Road contributed to the enjoyment of thishistorical resource.Runway and TaxiwayUnder Alternative B2, modifications and improvements to runways and taxiways at the northern end of theairfield would further alter the historical configuration of the airfield, resulting in an adverse effect and aphysical use of the eligible airport historic district.7.5.1.3 Alternative B4Alternative B4 was developed to minimize impacts to residential communities and businesses and BuckeyeBrook. Alternative B4 would extend Runway 5-23 to the south to a total of 8,700 feet. Main Avenue would bepartially realigned to accommodate extending Runway 5-23 to the south. Alternative B4 would not require a fullrelocation of <strong>Airport</strong> Road, but <strong>Airport</strong> Road would be partially relocated at the intersection with Post Road. Anew Integrated Cargo Facility would consist of a split operation, including the existing Hangar No. 2, wherecargo operations currently are housed, and a new cargo building east of the Runway 16 End.Eligible <strong>Airport</strong> Historic DistrictAlternative B4 would result in physical uses of contributing elements of the eligible airport historic district.Similar to Alternative B2, Alternative B4 would result in modifications and improvements to runways andtaxiways at the northern end of the airfield, further altering the historical configuration of the airfield andresulting in an adverse effect to and a physical use of the eligible airport historic district. The proposed partialrelocation of <strong>Airport</strong> Road and the split Integrated Cargo Facility would have direct and indirect impacts to theRhode Island State <strong>Airport</strong> Terminal Building. In addition, similar to Alternative B2, Hangar No. 1 would bedemolished. It is anticipated that there would be de minimis physical impacts to Hangar No. 2.Runway and TaxiwayUnder Alternative B4, modifications and improvements to runways and taxiways at the northern end of theairfield would further alter the historical configuration of the airfield, resulting in an adverse effect and physicaluse of the eligible airport historic district.509 Environmental Desk Reference for <strong>Airport</strong> Actions, FAA, October 5, 2007, Chapter 7, Section 4(f) Resources, section 1(c)(2), page 1.Chapter 7 – Final Section 4(f)/Section 6(f) Evaluation 7-9 July 2011\\Mawatr\ev\09228.00\reports\<strong>FEIS</strong>_Final_July_2011\<strong>PVD</strong>_CH07_4(f)_JUL_2011.doc
T.F. <strong>Green</strong> <strong>Airport</strong> <strong>Improvement</strong> <strong>Program</strong>Environmental Impact Statement and Final Section 4(f) EvaluationRhode Island State <strong>Airport</strong> TerminalConstruction of the split Integrated Cargo Facility would cause direct and indirect impacts to the Rhode IslandState <strong>Airport</strong> Terminal Building resulting in an adverse effect. Alternative B4 would avoid the Rhode IslandState Terminal building but would take part of the front (landside) lawn of the historical property (resulting in aphysical use due to the loss of landscaping and the historical entry to the terminal building) and would changeits setting. The Rhode Island State <strong>Airport</strong> Terminal building is currently visible from <strong>Airport</strong> Road, whichcontributes to its setting (i.e., the view that the public has from <strong>Airport</strong> Road provides a sense of the landsideapproaches and operations when the terminal was in operation). The public view of the Rhode Island State<strong>Airport</strong> Terminal Building from <strong>Airport</strong> Road would be obstructed by the proposed split Integrated CargoFacility (Figure 7-4).Hangar No. 1Hangar No. 1 impacts are the same as under Alternative B2 and are described in the previous section.Hangar No. 2Alternative B4 would also use the interior of Hangar No. 2 for cargo operations (described in detail in theprevious section for Alternative B2). Upon consultation with the RISHPO, FAA has determined that theproposed interior modifications would not result in an adverse effect to Hangar No. 2. These interiormodifications would likely meet the criteria for a finding of de minimis impact. 510 As <strong>Airport</strong> Road would not befully relocated under Alternative B4; thus, the public's view of Hangar No. 2 would not be obstructed under thisAlternative.7.5.2 Section 4(f) Impacts to Winslow ParkFigure 7-6 shows the impacts to Winslow Park under the No-Action Alternative and Alternatives B2 and B4 toWinslow Park. The No-Action Alternative and Alternatives B2 and B4 all result in a physical use of WinslowPark. The function of the RPZ is to protect people and property on the ground. This is achieved through airportowner control over RPZs and includes clearing RPZ areas (and maintaining them clear) of incompatible objectsand activities. At a minimum, RPZs should be clear of all facilities which lead to an assembly of people. 511 Underthe No-Action Alternative, the recreational areas within the No-Action RPZ should be removed to enhancesafety. The impacted recreational areas will be removed and replaced under Alternatives B2 and B4. The passiverecreational area with walking trails could remain within the RPZ because this use is not an assembly of people.RIAC has been working in consultation with the City of Warwick regarding relocating the Winslow Parkfacilities.7.5.2.1 No-Action AlternativeThe No-Action Alternative would result in the physical use of 17.4 acres of the recreational area that lie withinthe existing RPZ, including 0.2 acres of the city-owned portion and 17.2 acres of the RIAC-owned portion. Ofthe actively used parkland, 14.0 acres of the RIAC-owned parcel and 0.1 acres of City-owned parcel would becleared. In order to clear the RPZ under the No-Action Alternative, the recreational facilities that would beremoved include one of the smaller softball fields and one full-sized softball field, two playgrounds, and the510 Environmental Desk Reference for <strong>Airport</strong> Actions, FAA, October 5, 2007.511 FAA Advisory Circular 150/5300-13, <strong>Airport</strong> Design, U.S. Department of Transportation, FAA, September 29, 2006.Chapter 7 – Final Section 4(f)/Section 6(f) Evaluation 7-10 July 2011\\Mawatr\ev\09228.00\reports\<strong>FEIS</strong>_Final_July_2011\<strong>PVD</strong>_CH07_4(f)_JUL_2011.doc
T.F. <strong>Green</strong> <strong>Airport</strong> <strong>Improvement</strong> <strong>Program</strong>Environmental Impact Statement and Final Section 4(f) Evaluationsoccer fields (Figure 7-6). The clubhouse, walking path/passive recreational area, three full-sized softball fields,one small softball field, as well as the parking lot adjacent to the smaller softball fields could remain. The accessto the remaining park at Taft Avenue would be allowed to remain since access would be possible off GreeleyAvenue. The entire soccer field area would be eliminated under the No-Action Alternative. The facilities locatedoutside the No-Action Alternative RPZ are on land owned by RIAC (one full-sized softball field and one smallsoftball field, walking path/passive recreation area, and parking); and the City of Warwick (two full-sizedsoftball fields, a portion of a third softball field, clubhouse, and parking).7.5.2.2 Alternatives B2 and B4Alternative B2 would result in the physical use of 21 acres of the park that lie within the newly created RPZ,including 3.6 acres of the City-owned portion and 17.4 acres of the RIAC-owned portion. The actively usedparkland that would be directly impacted includes 10.3 acres of the RIAC-owned portion and 3.6 of theCity-owned portion resulting in total direct impacts of 13.9 acres (Figure 7-6).Alternative B4 would result in the physical use of 20.8 acres of Winslow Park that lie within the newly createdRPZ and improvements related to Realigned Main Avenue, including 2.8 acres of the city-owned portion and18 acres of the RIAC-owned portion. The actively used parkland that would be directly impacted includes10.6 acres of the RIAC-owned portion and 2.7 acres of the City-owned portion resulting in total direct impacts of13.3 acres (Figure 7-6). Under Alternative B4 only, Realigned Main Avenue would directly impact the parkingnear the small softball fields on Bedford Avenue and the northwest section of the soccer fields.Under both Alternatives B2 and B4, the recreational facilities that would be removed include all four full-sizedsoftball fields, the clubhouse, most of the soccer field area, and one playground. The two smaller softball fields,the parking lot adjacent to the two softball fields, the walking path/passive recreational area, and oneplayground could remain. Alternatives B2 and B4 would result in the removal of most of the recreationalfacilities at Winslow Park including the main playing field areas, which would substantially diminish therecreational usefulness of the park as a whole.Under Alternatives B2 and B4, the impacted recreational facilities (four full-sized softball fields, clubhouse,playground, and two soccer fields) would be replaced at other sites as mitigation. In addition to the replacementrecreational facilities, the facilities that are not within the RPZ (two smaller softball fields, walking path, andplayground) could remain at the current Winslow Park. Under Alternatives B2 and B4, the facilities locatedoutside the newly created RPZs are on land owned by RIAC. The remaining park facilities could continue toserve as a recreational resource for Warwick residents and the adjacent <strong>Green</strong>wood neighborhood. RIAC wouldreplace the Winslow Park facilities that would be impacted under Alternatives B2 and B4. The acquisition ofparkland for airport use would result in a physical use although the impact can be mitigated through thereplacement of impacted park functions as described in Section 7.7, Measures to Minimize Harm and Mitigation.Chapter 7 – Final Section 4(f)/Section 6(f) Evaluation 7-11 July 2011\\Mawatr\ev\09228.00\reports\<strong>FEIS</strong>_Final_July_2011\<strong>PVD</strong>_CH07_4(f)_JUL_2011.doc
T.F. <strong>Green</strong> <strong>Airport</strong> <strong>Improvement</strong> <strong>Program</strong>Environmental Impact Statement and Final Section 4(f) Evaluation7.6 Avoidance AlternativesFor each property that would be incorporated (in whole or in part) into the T.F. <strong>Green</strong> <strong>Airport</strong> <strong>Improvement</strong><strong>Program</strong>, this section provides an evaluation of location and design alternatives that would avoid the use ofand/or minimize harm to Section 4(f) properties. Section 4(f) defines a “feasible and prudent alternative” as onethat “avoids using Section 4(f) property and does not cause other severe problems of a magnitude thatsubstantially outweighs the importance of protecting the Section 4(f) property.” 512 As stated in FAAOrder 5050.4B, an EIS “must contain all feasible and prudent alternatives meeting the project’s purpose andneed that avoid using the 4(f) resource.” If an alternative is rejected, “an EIS must explain why a rejectedalternative presents unique problems or explain the cost to carry out the action or its resultant communitydisruption is extraordinary.” 513 A detailed analysis of the alternatives reviewed to avoid use of Section 4(f)properties is provided in this section. Overall avoidance alternatives are described at the end of this section.7.6.1 Historical Properties Avoidance AlternativesAlternatives B2 and B4 would use the eligible airport historic district and some of its contributing elements.7.6.1.1 Alternative B2This section describes the avoidance alternatives that were evaluated for each Section 4(f) property impactedunder Alternative B2.Eligible <strong>Airport</strong> Historic DistrictAlternative B2 would result in a physical use of the eligible airport historic district because of the removal ofHangar No. 1 (a contributing element) and modifications and improvements to runways and taxiways at thenorthern end of the airfield. There are no avoidance alternatives for modifications and improvements torunways and taxiways other than the No-Action Alternative, which is not prudent as it does not meet theproject’s Purpose and Need. Specific avoidance alternatives for contributing elements Hangar No. 1,Hangar No. 2, and the Rhode Island State <strong>Airport</strong> Terminal are discussed in the following sections.Rhode Island State <strong>Airport</strong> TerminalAlternative B2 would avoid direct impacts (physical use) to the Rhode Island State <strong>Airport</strong> Terminal, but wouldhave an indirect impact (constructive use) on the Terminal because of Fully Relocated <strong>Airport</strong> Road whichimpacts the public view and access to the Rhode Island State <strong>Airport</strong> Terminal. Thus, the relocation of <strong>Airport</strong>Road would result in an adverse effect. Constructive use of the Rhode Island State <strong>Airport</strong> Terminal isunavoidable because the existing <strong>Airport</strong> Road would have to be relocated to accommodate the runwayextension at the Runway 23 End. A full relocation of <strong>Airport</strong> Road between Post Road and Warwick Avenue isnecessary to allow Runway 5-23 to be extended northward across existing <strong>Airport</strong> Road. The roadwayalignment of Fully Relocated <strong>Airport</strong> Road was developed to meet highway safety standards and to align withRoute 37 on the West and Warwick Avenue at Squantum Drive on the east.512 As defined in 23 CFR 774.513 Federal Aviation Administration Order 5050.4B, National Environmental Policy Act (NEPA) Implementing Instructions for <strong>Airport</strong> Actions, U.S. Department ofTransportation, April 28, 2006, Chapter 10, section 1007, Paragraph e(5), p.10-10.Chapter 7 – Final Section 4(f)/Section 6(f) Evaluation 7-12 July 2011\\Mawatr\ev\09228.00\reports\<strong>FEIS</strong>_Final_July_2011\<strong>PVD</strong>_CH07_4(f)_JUL_2011.doc
T.F. <strong>Green</strong> <strong>Airport</strong> <strong>Improvement</strong> <strong>Program</strong>Environmental Impact Statement and Final Section 4(f) EvaluationTwo avoidance alternatives were considered to avoid constructing Fully Relocated <strong>Airport</strong> Road and to avoidimpacts to the public view and access to the Rhode Island State <strong>Airport</strong> Terminal.<strong>Airport</strong> Road TunnelOne option to avoid fully relocating <strong>Airport</strong> Road would be to construct a tunnel under the Runway 23 End sothat <strong>Airport</strong> Road would maintain its current alignment adjacent to the eligible airport historic district. This wouldrequire approximately 1,000 feet of approach roadway on either side of the tunnel, with no driveway access.<strong>Airport</strong> Road currently crosses Buckeye Brook, which is culverted under the road. A tunnel structure could not beconstructed at this location without significantly affecting flows in Buckeye Brook. It would also require significantreconstruction of the storm drainage system. In addition, the cost to construct a tunnel under the runway would beapproximately $50 million. Therefore, placing <strong>Airport</strong> Road in a tunnel is not feasible due to the elevation ofBuckeye Brook and substantial cost.Runway 5-23 Extension SouthThe second option to avoid fully relocating <strong>Airport</strong> Road would be to extend Runway 5-23 to the south to avoidcrossing <strong>Airport</strong> Road. Alternative B4 meets this objective but results in direct and indirect impacts to the RhodeIsland State <strong>Airport</strong> Terminal due to the location of the split Integrated Cargo Facility. Avoidance alternatives forAlternative B4 are described in the next section.Hangar No. 1Four avoidance alternatives were evaluated to avoid impacts to Hangar No. 1.Runway 16-34 Shift SouthImpacts to Hangar No. 1 might be avoided by shifting Runway 16-34 substantially to the south along its axis toachieve the minimum required height that effectively removes Hangar No. 1 from airspace penetration and theROFAs and TOFAs. The wetland impacts from such a runway shift would be significantly higher than impactsassociated with Alternatives B2 and B4 due to the presence of extensive wetland systems at the Runway 34 End.Under <strong>Airport</strong> <strong>Improvement</strong> <strong>Program</strong> (IP) Option A, described in greater detail in Appendix E, AlternativesAnalysis, of the DEIS, Runway 16-34 was shifted to the south approximately 1,000 feet. Even with the 1,000 footshift south, Hangar No. 1 would still penetrate the ROFA (DEIS Appendix E, Alternatives Analysis, Figure E-36).IP Option A would result in significant wetland impacts (approximately 32 acres at the Runway 34 End) thatcould not be mitigated under the USACE New England District recommended wetlands mitigation guidelines.Therefore, the option of shifting Runway 16-34 farther south to avoid impacts to Hangar No. 1 is not feasible orprudent because of the number of acres required for wetland mitigation.Runway 16-34 Lateral ShiftIn order to remove Hangar No. 1 from protected airspace, Runway 16-34 would have to be laterally shifted430 feet to the west toward the existing Sundlund Passenger Terminal and Post Road. Realigning the entirerunway to avoid Hangar No. 1 would directly impact the existing Sundlund Passenger Terminal, the Air TrafficControl Tower (ATCT), businesses along Post Road between the Terminal and <strong>Airport</strong> Road, and businessesand residences southwest of the ATCT. It would also require relocating taxiways and navigational aids. ShiftingRunway 16-34 to the east toward Warwick Avenue to remove Hangar No. 1 from airspace penetration wouldChapter 7 – Final Section 4(f)/Section 6(f) Evaluation 7-13 July 2011\\Mawatr\ev\09228.00\reports\<strong>FEIS</strong>_Final_July_2011\<strong>PVD</strong>_CH07_4(f)_JUL_2011.doc
T.F. <strong>Green</strong> <strong>Airport</strong> <strong>Improvement</strong> <strong>Program</strong>Environmental Impact Statement and Final Section 4(f) Evaluationdirectly impact the eligible airport historic district, the Rhode Island State <strong>Airport</strong> Terminal, and Hangar No. 2.At a minimum, both the Terminal and Hangar No. 2 would become airspace penetrations and would need to bedemolished. Because of the magnitude of direct impacts to commercial businesses and residences along PostRoad, the existing Sundlund Passenger Terminal, and other historical properties, a major realignment ofRunway 16-34 either to the east or to the west is not feasible or prudent.Relocate Hangar No. 1Moving Hangar No. 1 to another location so that it is no longer an obstruction to the navigable airspace wouldavoid its demolition. Evaluation of this option raised a number of physical and practical issues. A practicalconsideration is that there is not another location on the airfield (with direct airfield access) where the Hangarcould be relocated outside of the protected airspace of the T.F. <strong>Green</strong> <strong>Airport</strong>. (If it is not relocated in an area ofthe <strong>Airport</strong> with direct airfield access, it can no longer continue to be used as an airplane hangar.) There are noairport locations within Rhode Island at Quonset, Block Island, North Central Newport, or Westerly <strong>Airport</strong>sthat could accommodate Hangar No. 1 with appropriate airside and landside access. Additionally, moving the54,000-square foot building to another location may not be feasible due to the size and mass of the structure.Although it may be physically possible to separate and move the individual sections of the building, the processof separation and reconstruction would compromise the Hangar’s structural integrity and would result insubstantial costs (approximately $4.5 million). Finally, relocating Hangar No. 1 to a location outside of theeligible airport historic district would remove the Hangar from its historical setting on T.F. <strong>Green</strong> <strong>Airport</strong>.Therefore, this option is not prudent.Partially Demolish Hangar No. 1The fourth option would be to remove only the section of Hangar No. 1 which protrudes into the Part 77primary surface and the TOFA (Figure 7-5). However, the limits of Part 77 primary surface and the TOFAwould result in impacts (removal) to over two-thirds of Hangar No. 1. The only part of the building that wouldremain would be the east office wing of the structure. The historically significant five bay central façade facing<strong>Airport</strong> Road would be impacted by both the Part 77 primary surface and the TOFA. Removing these portionsof the building would severely compromise the historical integrity of the building and those characteristics thatmake the structure eligible for listing in the NRHP; therefore, this option would not be prudent.Hangar No. 2Alternative B2 would result in a constructive use of Hangar No. 2 because Fully Relocated <strong>Airport</strong> Road wouldsubstantially limit the public view and access to the Hangar. Two avoidance alternatives were considered toavoid relocating <strong>Airport</strong> Road so as to avoid impacting the public view and access to Hangar No. 2. These twooptions, constructing a tunnel under the Runway 23 End and extending Runway 5-23 to the south, are describedfor the Rhode Island State <strong>Airport</strong> Terminal evaluation in the previous section.7.6.1.2 Alternative B4This section describes the avoidance alternatives that were evaluated for each Section 4(f) property impactedunder Alternative B4.Chapter 7 – Final Section 4(f)/Section 6(f) Evaluation 7-14 July 2011\\Mawatr\ev\09228.00\reports\<strong>FEIS</strong>_Final_July_2011\<strong>PVD</strong>_CH07_4(f)_JUL_2011.doc
T.F. <strong>Green</strong> <strong>Airport</strong> <strong>Improvement</strong> <strong>Program</strong>Environmental Impact Statement and Final Section 4(f) EvaluationEligible <strong>Airport</strong> Historic DistrictAs with Alternative B2, Alternative B4 would result in a physical use of the eligible airport historic districtbecause of the removal of Hangar No. 1 and modifications and improvements to Runway 16-34 and taxiways atthe northern end of the airfield. There are no avoidance alternatives for modifications and improvements torunways and taxiways other than the No-Action Alternative, which is not feasible as it does not meet thePurpose and Need. Avoidance alternatives for Hangar No. 1, Hangar No. 2, and the Rhode Island State <strong>Airport</strong>Terminal are discussed in the next section.Hangar No. 1Avoidance alternatives for Hangar No. 1 are the same as for Alternative B2 and have been discussed in theprevious section.Hangar No. 2As discussed in Section 7.5.1.2, Alternative B2, Alternative B4 would likely result in a de minimis impact toHangar No. 2 because only minor interior modifications are proposed. Therefore, no avoidance alternatives areconsidered. There would be no constructive use of Hangar No. 2 under Alternative B2.Rhode Island State <strong>Airport</strong> TerminalAlternative B4 results in a physical use of the Rhode Island State <strong>Airport</strong> Terminal because the proposedIntegrated Cargo Facility would directly impact landside landscaping between the Rhode Island State <strong>Airport</strong>Terminal and <strong>Airport</strong> Road. The landscaping is inside the property boundary and provides important visualand historical context. Five different options for locating the Integrated Cargo Facility in a different area of the<strong>Airport</strong> so as not to impact the landside landscaping of the Rhode Island State <strong>Airport</strong> Terminal wereconsidered. Constructing the Integrated Cargo Facility in a different area of the <strong>Airport</strong> would avoid impacts tothe Rhode Island State <strong>Airport</strong> Terminal.Integrated Cargo Facility – Cargo Site #1The first potential site, referred to as Cargo Site #1 (Figure 7-7), is in the southern portion of the <strong>Airport</strong>,between the Runway 34 End and the <strong>Airport</strong> Industrial Park. Locating the Integrated Cargo Facility at this sitewould avoid impacts to the Rhode Island State <strong>Airport</strong> Terminal. However, this site would impact wetlandsassociated with a tributary to Buckeye Brook. The analysis revealed that approximately 2.5 acres of wetlandswould require filling to construct this cargo site. Furthermore, Cargo Site #1 would result in a safety concernsince aircraft entering or leaving the cargo site would have to cross Runway 5-23 near its center point (where thetwo runways intersect), creating an incursion hazard. An alternative is not prudent under Section 4(f) if itresults in unacceptable safety or operational problems. Therefore, this alternative is not prudent.Integrated Cargo Facility – Cargo Site #2A second potential site, referred to as Cargo Site #2 (Figure 7-7), was identified on the eastern edge of the <strong>Airport</strong>,between the existing Aircraft Rescue Fire Fighting (ARFF) facility and the Airfield Maintenance Facility. This sitewould avoid impacts to the Rhode Island State <strong>Airport</strong> Terminal. However, the analysis concluded that CargoSite #2 would result in a safety situation: an aircraft entering or leaving the cargo site would have to crossRunway 5-23, creating an incursion hazard. Therefore, this alternative is not prudent.Chapter 7 – Final Section 4(f)/Section 6(f) Evaluation 7-15 July 2011\\Mawatr\ev\09228.00\reports\<strong>FEIS</strong>_Final_July_2011\<strong>PVD</strong>_CH07_4(f)_JUL_2011.doc
T.F. <strong>Green</strong> <strong>Airport</strong> <strong>Improvement</strong> <strong>Program</strong>Environmental Impact Statement and Final Section 4(f) EvaluationIntegrated Cargo Facility - North Apron AreaThere are numerous constraints in the North Apron area of the <strong>Airport</strong>, including the legal constraint of 14 CFRPart 77, which dictates the acceptable locations of buildings and parked aircraft in relation to runways. Forexample, Hangar No. 1 presents a safety issue because it penetrates the ROFA of Runway 16-34. Outside theROFA, there is an additional 14 CFR Part 77 constraint: the tails of parked aircraft must be at least 815 feet fromthe centerline of a runway. This leaves a wide area adjacent to both runways unusable for many airport facilitiesbecause aircraft cannot park there. The suitable area can be seen on Figure 7-8 as a V shape east ofRunway 16-34 and west of Runway 5-23. The size of the Integrated Cargo Facility is large enough that it cannotreasonably be constructed in the North Apron area without impacting the existing buildings south of <strong>Airport</strong>Road, or without requiring that <strong>Airport</strong> Road be relocated north of its existing alignment. Moving the proposedIntegrated Cargo facility farther to the west in the area vacated by the demolished Hangar No. 1 would not befeasible because of the 14 CFR Part 77 constraint on parked aircraft (Figure 7-8). There would not be sufficientroom for airplane parking if the Integrated Cargo Facility was sited in another location within the North ApronArea. Therefore, the option of locating the Integrated Cargo Facility to a different site within the North Apronarea is not feasible or prudent.Integrated Cargo Facility – Alternative B2 LocationAnother option considered to avoid impacts to the Rhode Island State <strong>Airport</strong> Terminal was to construct thesame Integrated Cargo Facility proposed under Alternative B2 (Option 1 in Figure 7-8) for Alternative B4.However, the Integrated Cargo Facility proposed under Alternative B2 could only be constructed if <strong>Airport</strong>Road were fully relocated (as proposed under Alternative B2). A portion of the existing road would have to beclosed, removed, and converted to taxiway to allow aircraft to access the Integrated Cargo Facility directly(Figure 7-8). Fully Relocated <strong>Airport</strong> Road is expensive (construction and land acquisition costs are estimated at$50 million) and results in natural resource and community impacts that would not occur under Alternative B4.In fact, Alternative B4 was developed to minimize impacts to natural resources and the community, and as aresult costs were reduced. Adding Fully Relocated <strong>Airport</strong> Road to Alternative B4 to avoid impacts to theRhode Island State <strong>Airport</strong> Terminal would result in the impacts Alternative B4 was specifically designed toavoid, in terms of community disruption, the effects on the natural environment, and costs. These considerableimpacts outweigh the importance of protecting the setting of Rhode Island State <strong>Airport</strong> Terminal. The buildingitself would not be impacted under Alternative B4. Therefore, this option is not prudent.Integrated Cargo Facility – Modify Hangar No. 2 OnlyAnother option was to modify Hangar No. 2 to accommodate the integrated cargo operations but not constructthe additional cargo building that is proposed under Alternative B4 (Option 2 in Figure 7-8). This would alsoavoid impacts to the Rhode Island State <strong>Airport</strong> Terminal. Hangar No. 2 would have minimal interiormodifications to accommodate the cargo operations and this would result in de minimis physical impacts.However, by not providing an additional 50,000 square feet of space for integrated cargo, this option onlypartially meets the Purpose and Need (documented in Chapter 2, Purpose and Need). While this option is notprudent because it does not fully meet the project Purpose and Need, it may be retained for furtherconsideration at a later date, when improved cargo facilities are to be implemented.Chapter 7 – Final Section 4(f)/Section 6(f) Evaluation 7-16 July 2011\\Mawatr\ev\09228.00\reports\<strong>FEIS</strong>_Final_July_2011\<strong>PVD</strong>_CH07_4(f)_JUL_2011.doc
T.F. <strong>Green</strong> <strong>Airport</strong> <strong>Improvement</strong> <strong>Program</strong>Environmental Impact Statement and Final Section 4(f) Evaluation7.6.2 Winslow Park Avoidance AlternativesUnder the No-Action Alternative and Alternatives B2 and B4, impacts to Winslow Park (both Cityand RIAC-owned portions) are unavoidable. Winslow Park lies within the RPZ under theNo-Action Alternative and Alternatives B2 and B4. The <strong>Airport</strong> Design Standards (FAA AdvisoryCircular 150/5300-13) recommend against land uses, such as public ballfields, that constitute a congregation ofpeople. For this reason, the ballfields will be removed from the RPZ under the No-Action Alternative. Toremove the RPZ from the park, Runway 5-23 would need to be shifted approximately 730 feet to the north of theexisting runway location and extended north to a total length of 8,700 feet. This shift would result in significantcommunity and environmental impacts, including direct impacts to the Hoxsie residential neighborhood. Itwould also result in impacts to wetlands north of existing <strong>Airport</strong> Road, Buckeye Brook, and Spring <strong>Green</strong>Brook. Therefore, there is no feasible and prudent alternative to the use of the land from this property.7.6.3 Overall Avoidance AlternativesThis section describes avoidance alternatives that avoid impacts related to the T.F. <strong>Green</strong> <strong>Airport</strong> <strong>Improvement</strong><strong>Program</strong> to all Section 4(f) resources. The No-Action Alternative does not avoid impacts to all Section 4(f)resources. Although impacted historical resources protected under Section 4(f) could be avoided byimplementation of the No-Action Alternative, Winslow Park, a Section 4(f) recreational resource, could still beimpacted under the No-Action Alternative because, as described earlier, the park facilities within the existingRPZ will be removed to enhance safety. The following avoidance alternatives were analyzed during the Level 1screening process described in Chapter 3, Alternatives Analysis.• Greater Use of Other <strong>Airport</strong>s. Nine airports in the region were considered as potential off-<strong>Airport</strong> alternatives tothe T.F. <strong>Green</strong> <strong>Airport</strong> <strong>Improvement</strong> <strong>Program</strong>, including Logan <strong>Airport</strong> (Boston, MA), Bradley International<strong>Airport</strong> (Hartford, CT), Worcester Regional <strong>Airport</strong>, Hanscom Field (Bedford, MA), New Bedford Regional<strong>Airport</strong>, (New Bedford, MA), Quonset <strong>Airport</strong> (North Kingstown, RI), North Central <strong>Airport</strong>(Smithfield/Lincoln, RI), Groton-New London <strong>Airport</strong> (Groton, CT), and Otis Air National Guard Base(Falmouth, MA). Based on the deficiencies and constraints associated with each of these airports, the GreaterUse of Other <strong>Airport</strong>s alternative would not adequately fulfill the Purpose and Need because none of theseairports would be able to provide the appropriate facilities. Refer to Chapter 3, Alternatives Analysis for details.• Developing a New <strong>Airport</strong>. Two potential areas for a new airport were identified. One of these sites waslocated in Massachusetts; and one site was located in Rhode Island; however, there are no suitable siteswithin the study area that could be constructed without environmental impacts substantially in excess ofthe environmental impacts likely to result from any of the on-<strong>Airport</strong> alternatives. Therefore, thedevelopment of a new airport alternative was eliminated from further evaluation. Refer to Chapter 3,Alternatives Analysis for details.• Other Modes of Transportation. This alternative examined the use of other (non-aviation) modes oftransportation, including trains, automobiles, and buses, to reasonably and feasibly meet the Purpose andNeed by providing an alternative form of transportation to air passengers who otherwise would use the<strong>Airport</strong> to fulfill their long-haul travel needs. The efficiency purpose of the T.F. <strong>Green</strong> <strong>Airport</strong> <strong>Improvement</strong>Chapter 7 – Final Section 4(f)/Section 6(f) Evaluation 7-17 July 2011\\Mawatr\ev\09228.00\reports\<strong>FEIS</strong>_Final_July_2011\<strong>PVD</strong>_CH07_4(f)_JUL_2011.doc
T.F. <strong>Green</strong> <strong>Airport</strong> <strong>Improvement</strong> <strong>Program</strong>Environmental Impact Statement and Final Section 4(f) Evaluation<strong>Program</strong> is to meet the travel needs for non-stop service from the T.F. <strong>Green</strong> <strong>Airport</strong> service area and,thereby, enhance the efficiency of the New England Regional Aviation System. Passenger rail service andhighway transportation were eliminated because the travel times were too long to be considered areasonable alternative to commercial air service.7.7 Measures to Minimize Harm and MitigationSection 4(f) defines a “feasible and prudent alternative” as one that “avoids using Section 4(f) property and doesnot cause other severe problems of a magnitude that substantially outweigh the importance of protecting theSection 4(f) property.”7.7.1 Historical PropertiesFAA and RIAC have consulted with the RISHPO and the Narragansett Indian Tribal Historic PreservationOffice (NITHPO) regarding the adverse effect of the project on historical properties and locally importanthistorical cemeteries. This consultation has resulted in a Memorandum of Agreement (MOA) that includesstipulations to address and mitigate the adverse effect of the project. The executed MOA has been submitted byFAA to the Advisory Council on Historic Preservation (for filing) along with supporting documentation asspecified in 36 CFR Part 800.11(f). Refer to Appendix I, Historic, Architectural, Archaeological, and CulturalResources, for a signed copy of the MOA. These stipulations in the MOA include:7.7.1.1 Historical Properties Archival DocumentationThe FAA will consult with the Historic American Buildings Survey/Historic American Engineering Record(HABS/HAER) to determine if Hangar No. 1 and the eligible airport historic district are appropriate subjects fortheir archives.RIAC will prepare appropriate documentation, either HABS/HAER or Rhode Island Historic ResourcesArchive (RIHRA) of the eligible airport historic district. The documentation will be completed by a qualifiedprofessional who meets the standards and regulations provided in the Secretary of the Interior’s Standards andGuidelines for Archaeology and Historic Preservation, and shall include a narrative report, large formatphotographs, and other graphic materials, all prepared to meet archival standards. Unless otherwise agreed toby HABS/HAER or RISHPO, the FAA shall ensure that all documentary recording is completed and acceptedprior to the initiation of construction, and that copies of this documentation are made available to theappropriate federal, state and local archives designated by HABS/HAER or RISHPO.7.7.1.2 Interpretive DisplayRIAC, in consultation with the RISHPO, shall develop a display that interprets the historical significance of theeligible airport historic district to the public. The display will incorporate images of historical views, plans,and/or historical documents; archival documentation photographs; and narrative information describing thehistory and significance of the airport. Themes that will be addressed will include, but may not be limited to, theevents leading up to the establishment of the Hillsgrove State <strong>Airport</strong> as the first state airport in the nation, itsuse by the military during World War II and the Cold War; significant events in its physical evolution over time,Chapter 7 – Final Section 4(f)/Section 6(f) Evaluation 7-18 July 2011\\Mawatr\ev\09228.00\reports\<strong>FEIS</strong>_Final_July_2011\<strong>PVD</strong>_CH07_4(f)_JUL_2011.doc
T.F. <strong>Green</strong> <strong>Airport</strong> <strong>Improvement</strong> <strong>Program</strong>Environmental Impact Statement and Final Section 4(f) Evaluationincluding information about the T.F. <strong>Green</strong> <strong>Airport</strong> <strong>Improvement</strong> <strong>Program</strong>; and the architectural andengineering significance of the buildings and structures within the eligible airport historic district. The displaywill be in a panel format located in the existing passenger terminal and electronically posted on the RIACwebsite.7.7.1.3 Architectural SalvageBefore the demolition of Hangar No. 1, RIAC shall, in consultation with the RISHPO, prepare an inventory ofsignificant architectural items or features that might be salvaged from the building. The inventory will becompiled by a qualified professional who meets the standards and regulations provided in the Secretary of theInterior’s Standards and Guidelines for Archaeology and Historic Preservation. 514 It will consist of a list of the items orfeatures along with photographs and a site plan showing their location within the building. Subject to federalgrant, state property and purchasing requirements, and subject to the consent of the property owner, the RhodeIsland Department of Transportation, RIAC shall provide an opportunity for local and regional historicalmuseums, historical societies, or other public organizations to express an interest in significant salvageablearchitectural items or features for interpretation purposes and permanent display accessible to the public. A listof organizations to be contacted will be compiled in consultation with the RISHPO.7.7.2 Winslow ParkSince the Winslow Park is located within the RPZ under the No-Action and Alternatives B2 and B4, there are nofeasible minimization measures. Under the No-Action Alternative, the park facilities within the RPZ would beremoved to enhance safety. Under Alternatives B2 and B4, the facilities would be removed and mitigationwould be provided. Proposed mitigation for the project-related impacts to Winslow Park include replacement ofthe impacted park facilities (four softball fields, two soccer fields, parking, playground, and clubhouse) at adifferent location within the City of Warwick that is publicly accessible.After further review of potential park relocation sites, RIAC eliminated two park relocation sites that werepreviously under consideration in the DEIS. The Barton Farm site was eliminated from further consideration inthe DEIS because of the physical constraints of the site and construction costs. In the DEIS, RIAC evaluated theCommunity College of Rhode Island (CCRI) site and the Strawberry Field Road site (Figure 7-11). After theDEIS, RIAC eliminated the CCRI site from further consideration because of physical constraints of the site(adjacent wetlands, slopes, and wooded portions) and associated higher construction costs and potentialimpacts. RIAC continued to keep the 18-acre Strawberry Field site as a potential relocation site and identifiedanother potential site on Cedar Swamp Road. The 21-acre Cedar Swamp Road site is located on RIAC-ownedland that was acquired through the residential land acquisition program for noise mitigation during previousPart 150 voluntary land acquisition efforts (Figure 7-10). Figure 7-9 provides a map showing the locations of allsites evaluated for the relocated Winslow Park facilities.After further evaluation of the Strawberry Field and Cedar Swamp sites and coordination with the City ofWarwick, RIAC selected the Cedar Swamp Road Site as the location for the relocated park facilities. Based on514 Archeology and Historic Preservation: Secretary of the Interior's Standards and Guidelines, [As Amended and Annotated] www.cr.nps.gov/locallaw/arch_stnds_0.htm.Chapter 7 – Final Section 4(f)/Section 6(f) Evaluation 7-19 July 2011\\Mawatr\ev\09228.00\reports\<strong>FEIS</strong>_Final_July_2011\<strong>PVD</strong>_CH07_4(f)_JUL_2011.doc
T.F. <strong>Green</strong> <strong>Airport</strong> <strong>Improvement</strong> <strong>Program</strong>Environmental Impact Statement and Final Section 4(f) Evaluationcoordination with the City of Warwick, new access was developed to the Cedar Swamp Road site from <strong>Airport</strong>Road.The Cedar Swamp Road site (Figure 7-10) includes onsite parking and is approximately 2.5 miles from theexisting Winslow Park. Refer to Appendix J, Section 4(f) and Section 6(f) Resources, which contains a qualitativeanalysis of regional and neighborhood access. Appendix J also includes an analysis of future noise conditionsunder Alternatives B2 and B4. 14 CFR 150, <strong>Airport</strong> Noise Compatibility Planning, establishes that recreationalresources are compatible with noise levels at DNL 75 db and below. The outdoor recreational activities at CedarSwamp Road would be compatible with anticipated noise levels under Alternatives B2 and B4. A preliminaryevaluation of wetlands impacts also concludes that there would be no impacts to wetlands at the proposed parkrelocation site (see Appendix J).The recreation facilities at Winslow Park are anticipated to be relocated in 2012 in advance of the construction ofrealigned Main Avenue and the construction and operation of extended Runway 5-23. The relocation would betimed so that either the existing or new relocated facilities would be available for public access as currentlyutilized. RIAC consulted with the City of Warwick to develop an agreement regarding facilities that are notwithin the future RPZ but no agreement was reached. Table 7-1 provides a list of the recreational facilities thatcould be accommodated at the Cedar Swamp Road site.Table 7-1Potential Replacement Options for Recreational FacilitiesExisting Winslow Park Cedar Swamp Road Site (Figure 7-10)• Six softball fields (four full-sized and two smaller softball fields) 1 • Four softball fields that match the dimensions of the existing fields at Winslow Park• Two to three soccer fields (configuration adjustable)• Two standard size soccer fields• A concession and restroom facility• A concession and restroom facility• Field lighting• Field lighting• Two playgrounds 2• One playground• Three separate parking lots (177 spaces).• Two parking lots accommodating 177 spaces. <strong>Airport</strong> Road and a new accessroad would be used for ingress and egress to the site• Landscaped walking path 3• 21 Acres (replacement site area)• Total of active parkland is 26 acresSources: RIAC; Louis Berger Group, Inc.Notes: Replacement options may include relocating impacted park functions at different locations within the City of Warwick.1 Two small softball fields could remain at current location under Alternatives B2 and B4. 2 One playground could remain at current location under Alternatives B2 and B4. 3 Walking path could remain at current location.Chapter 7 – Final Section 4(f)/Section 6(f) Evaluation 7-20 July 2011\\Mawatr\ev\09228.00\reports\<strong>FEIS</strong>_Final_July_2011\<strong>PVD</strong>_CH07_4(f)_JUL_2011.doc
T.F. <strong>Green</strong> <strong>Airport</strong> <strong>Improvement</strong> <strong>Program</strong>Environmental Impact Statement and Final Section 4(f) Evaluation7.8 SummaryTable 7-2 provides a comparison of the impacts and proposed mitigation Section 4(f) properties forAlternatives B2 and B4.Table 7-2Summary of Use and Mitigation of Section 4(f) Properties by AlternativeAlternative PropertyNo-ActionAlternativeFigureNo. Impact Reason for Impact UseWinslow Park 7-6 Significant Impact: remove onesmall softball fi eld, one full-sizedsoftball fi eld, two playgrounds,soccer fiel ds, and two parking l ots.Clear Runway Protecti on ZonePhysica lProposedMitigationNone proposedAlt. B2Eligible <strong>Airport</strong>Historic District7-4 Significant Impact: demolishHangar No. 1, public vi ew andaccess impact, alter historicalrunway/taxiway configurati onHangar No. 1 7-4 Significant Impact: demolishHangar No. 1Hangar No. 2 7.4 Significant Impact: interiormodifications, public view andaccess i mpactRhode Island StateTermi nal7-4 Significant Impact: public view andaccess impactWinslow Park 7-6 Signi ficant Impact: remove fourfull-sized softball fields, cl ubhouse,two parking lots, soccer fi elds, andone playground.Remove airspace obstruction, airsidemodifications and improvements;roadway relocati onRemove airspace obstructi onUse interior space for IntegratedCargo; roadway relocati onPhysica lPhysica lConstructiveArchiva ldocumentation;hi storical displayArchiva ldocumentati on;hi storical displayArchiva ldocumentati on;hi storical displayRelocation of Ai rport Road Constructive Archiva ldocumentati on;hi storical displayClear Runway Protecti on ZonePhysica lReplace impactedWinslow ParkfacilitiesAlt. B4 Eligibl e <strong>Airport</strong>Historic DistrictSource:RIHRA7-4 Significant Impact: demolishHangar No. 1, diminished publi cview, alter historicalrunway/taxiway configurati onHangar No. 1 7-4 Significant Impact: demolishHangar No. 1Hangar No. 2 7-4 No Significant Impact: interiormodificati onsRhode Island StateTermi nal7-4 Significant Impact: landsidel andscaping removal anddiminished public viewWinslow Park 7-6 Signi ficant Impact: remove fourfull-sized softball fields, cl ubhouse,two parking lots, soccer fi elds, andone playgroundVHB, Inc.Rhode Island Histori c Resource Archive.Remove airspace obstruction andairside modifications andi mprovementsRemove airspace obstructi onPhysica lPhysica lUse interi or space for Integrated Cargo De mi nimisConstructi on of split Integrated CargoFacility. Visual impacts andl andscaping impacts.Clear Runway Protecti on ZonePhysica lPhysica lArchivaldocumentati on;hi storical displayArchiva ldocumentati on;hi storical displayNoneArchiva ldocumentati on;hi storical displayReplace impactedWinslow ParkfacilitiesChapter 7 – Final Section 4(f)/Section 6(f) Evaluation 7-21 July 2011\\Mawatr\ev\09228.00\reports\<strong>FEIS</strong>_Final_July_2011\<strong>PVD</strong>_CH07_4(f)_JUL_2011.doc
T.F. <strong>Green</strong> <strong>Airport</strong> <strong>Improvement</strong> <strong>Program</strong>Environmental Impact Statement and Final Section 4(f) Evaluation7.9 Coordination and ConsultationThe FAA and RIAC have coordinated with the following agencies: City of Warwick, RISHPO, NITHPO, theRhode Island Department of Environmental Management (RIDEM), and the National Park Service (NPS).Copies of this correspondence are included in Appendix C, Federal, State, City, and Tribal Coordination.FAA and RIAC have consulted with the RISHPO and NITHPO regarding the adverse effect of the project onhistorical properties and locally important historical cemeteries. This consultation has resulted in a MOA thatincludes stipulations to address and mitigate the adverse effect of the project (see Appendix I, Historic,Architectural, Archaeological, and Cultural Resources).Coordination with the City of Warwick included determining the use of Section 4(f) properties by the public.The FAA and RIAC met with the City of Warwick on January 20, 2011 to assess ways to minimize or mitigateimpacts to recreational resources and coordinate plans for replacing the impacted Winslow Park facilities. TheCity of Warwick did not have objections to the proposed relocation sites (Strawberry Field Road and CedarSwamp Road sites) but requested a traffic study of the proposed relocation sites to better determine thesuitability of each site. The City also requested that RIAC investigate an alternative access route from <strong>Airport</strong>Road to one of the proposed sites at the Cedar Swamp Road location. In response to this request, RIAC hasrevised the Cedar Swamp Road access plan to include an alternative access route from <strong>Airport</strong> Road. The FAAconducted a qualitative analysis of access and parking to evaluate the relocation sites (refer to Appendix J,Section 4(f) and Section 6(f) Resources).RIAC consulted with the City of Warwick to develop an agreement regarding the relocation of non-impactedfacilities that are within the leased area of Winslow Park but no agreement was reached.The FAA has determined, and the Department of Interior (DOI) has concurred in its comment letter on the DEIS,that that there is no feasible and prudent alternative to the use of Section 4(f) resources. The DOI requested that acopy of the signed MOA be included as part of the Section 4(f) compliance documentation (see Appendix I,Historic, Architectural, Archaeological, and Cultural Resources).FAA and RIAC will continue to consult with the City of Warwick and the NPS, as needed in the development ofa Winslow Park mitigation plan.7.10 Least Overall Harm AnalysisAccording to Section 4(f) regulations, at 23 CFR section 774.3, Section 4(f) approvals, when there is no feasible orprudent avoidance alternative, the FAA must select an alternative from among those that use Section 4(f)properties that “causes the least overall harm in light of the statute’s preservationist purpose.” The sevenbalancing factors the FAA considers in determining the alternative that causes the least overall harm include: 515515 The FAA used the FHWA/FTA regulations set forth at 23 CFR Parts 771 and 774 as guidance to the extent relevant to the FAA programs.Chapter 7 – Final Section 4(f)/Section 6(f) Evaluation 7-22 July 2011\\Mawatr\ev\09228.00\reports\<strong>FEIS</strong>_Final_July_2011\<strong>PVD</strong>_CH07_4(f)_JUL_2011.doc
T.F. <strong>Green</strong> <strong>Airport</strong> <strong>Improvement</strong> <strong>Program</strong>Environmental Impact Statement and Final Section 4(f) Evaluation(i)(ii)The ability to mitigate adverse impacts to each Section 4(f) property (including any measures that result inbenefits to the property);The relative severity of the remaining harm, after mitigation, to the protected activities, attributes, orfeatures that qualify each Section 4(f) property for protection;(iii) The relative significance of each Section 4(f) property;(iv) The views of the official(s) with jurisdiction over each Section 4(f) property;(v)The degree to which each alternative meets the purpose and need for the project;(vi) After reasonable mitigation, the magnitude of any adverse impacts to resources not protected bySection 4(f); and(vii) Substantial differences in costs among the alternatives.As documented in this chapter, there are no feasible or prudent avoidance alternatives that avoid all Section 4(f)resources. Impacts to Winslow Park can be mitigated under both Alternatives B2 and B4 through thereplacement of impacted park facilities at a different location. After consulting with representatives from theCity of Warwick, RIAC has selected the Cedar Swamp Road location as the site for the relocated park facilities.Under Alternatives B2 and B4, impacts through demolishing Hangar No. 1 would be the same and cannot beavoided. Alternative B2 would result in the substantial impairment of public access and views to the eligibleairport historic district and the two remaining contributing elements (after the removal of Hangar No. 1).Without Fully Relocated <strong>Airport</strong> Road, Alternative B4 would not have the same impacts to public access andviews to the eligible airport historic district but would directly impact the landscaping of the Rhode Island<strong>Airport</strong> State Terminal, a NRHP-listed property, and block views of it from a public way.The FAA has identified Alternative B4 as the Preferred Alternative. The Preferred Alternative includes allpossible planning to minimize harm (as defined by 23 CFR 774.17) and after balancing all of the differentaspects of the project, there is no “feasible and prudent avoidance alternative,” as defined by 23 CFR 774.17. Afull description of measures to minimize harm is provided in Chapter 6, Mitigation, under each specific elementof the environment. All possible planning means that all reasonable measures identified in the Section 4(f)evaluation to minimize harm or mitigate for adverse impacts and effects must be included in the project.While Alternatives B2 and B4 would meet the Purpose and Need and provide the same aviation andcommunity benefits, the FAA has identified Alternative B4 as the Preferred Alternative because Alternative B2would have substantially greater impacts to community resources (i.e., disruption to community, mandatoryrelocation of businesses, and mandatory relocation of residences), and higher construction costs thanAlternative B4. Alternative B4 would be substantially less disruptive to residential properties and businesses,and would impact fewer wetlands. Alternative B4 would meet the Purpose and Need for the T.F. <strong>Green</strong> <strong>Airport</strong><strong>Improvement</strong> <strong>Program</strong>, providing the same aviation and community benefits as Alternative B2; howeversocioeconomic benefits would begin in 2015 with the extended Runway 5-23 coming on line. From aconstructability perspective, Alternative B4 would also be more feasible to construct than Alternative B2Chapter 7 – Final Section 4(f)/Section 6(f) Evaluation 7-23 July 2011\\Mawatr\ev\09228.00\reports\<strong>FEIS</strong>_Final_July_2011\<strong>PVD</strong>_CH07_4(f)_JUL_2011.doc
T.F. <strong>Green</strong> <strong>Airport</strong> <strong>Improvement</strong> <strong>Program</strong>Environmental Impact Statement and Final Section 4(f) Evaluationbecause it would have the lower construction costs by $85 million. All significant impacts that would occurunder Alternative B4 could be mitigated (see Chapter 6, Mitigation). When compared to Alternative B2,Alternative B4 is preferable for the following reasons:• Alternative B4 would result 80 percent greater economic gains between 2015 and the end of 2020 thanAlternative B2 because of the expedited construction schedule. Potential economic gains for Alternative B4between 2015 and the end of 2020 would total $680 million more for the State of Rhode Island than underAlternative B2.• Alternative B4 would require the acquisition of 97 fewer residential units, all of which are considered“affordable.”• Alternative B4 would impact 26 fewer businesses.• Alternative B4 would impact 250 fewer jobs, including 50 fewer “most threatened” jobs. 516• Alternative B4 would introduce 782 total jobs in the City of Warwick in 2015. (Alternative B2 would notresult in job growth until 2020.)• Alternative B4 would remove 99 fewer housing units and 26 fewer businesses from the tax role preserving$606,476 more in annual City of Warwick property taxes in 2020.• Alternative B4 would preserve the Spring <strong>Green</strong> Neighborhood because it would not include FullyRelocated <strong>Airport</strong> Road.• Alternative B4 would expose 102 fewer residential units to roadway traffic noise impacts (when comparedto No-Action noise levels).• Alternative B4 would impact 0.8 fewer acres of wetlands and would not impact Buckeye Brook.• Alternative B4 would cost $77 million less to construct and mitigate for impacts.In this <strong>FEIS</strong>, the FAA has identified Alternative B4 as the Preferred Alternative and the alternative that wouldresult in the least overall harm. However, the final decision selecting the FAA’s Preferred Alternative will bemade in the Record of Decision (ROD).7.11 Section 6(f) ConsiderationsSection 6(f) of the Land and Water Conservation Fund Act of 1965, as amended 16 U.S.C. 4601, et. seq., whichprovides funds for buying or developing public use recreational lands through grants to local and stategovernments, states that property purchased or developed with funds under the Act may not be converted toother than outdoor public recreation uses without approval of the DOI and the NPS:516 Businesses and jobs unlikely to relocate within the City of Warwick due to limited vacant/developable industrial lands.Chapter 7 – Final Section 4(f)/Section 6(f) Evaluation 7-24 July 2011\\Mawatr\ev\09228.00\reports\<strong>FEIS</strong>_Final_July_2011\<strong>PVD</strong>_CH07_4(f)_JUL_2011.doc
T.F. <strong>Green</strong> <strong>Airport</strong> <strong>Improvement</strong> <strong>Program</strong>Environmental Impact Statement and Final Section 4(f) EvaluationSection 6(f)(3) – No property acquired or developed with assistance under this section shall, without the approval of theSecretary, be converted to other than public outdoor recreation uses. The Secretary shall approve such conversion only if hefinds it to be in accord with the then existing comprehensive statewide outdoor recreation plan and only upon suchconditions as he deems necessary to assure the substitution of other recreation properties of at least equal fair market valueand of reasonably equivalent usefulness and location.This requirement applies to all parks and other sites that have been the subject of L&WCF grants of any type,and includes acquisition of parkland and development of park facilities. 517 Because recreational resources thatreceive L&WCF funding are often also Section 4(f) properties, the Section 4(f) process is used to assess andminimize improper conversion of Section 6(f) lands. A review of the L&WCF grants database and consultationwith the City of Warwick and RIDEM, the NPS State Liaison Officer, indicate that three projects at City-ownedland at Winslow Park were funded by L&WCF grants. The Winslow Park projects that received L&WCF are:1. Basketball court rehabilitation (#44-00255; approval in 1984; Grant amount: $3,200)2. Landscaping installation for three city parks including Winslow Field (#44-00251; approval in 1984; Totalgrant amount: $10,411)3. Softball field rehabilitation to bring to standard specifications and playground installation (#44-00127;approval in 1976; Grant amount: $8,000)The FAA and RIAC consulted with RIDEM and the City of Warwick to obtain information regarding theL&WCF-assisted property in Winslow Park that is subject to Section 6(f) restrictions. Initial writtencorrespondence was sent to RIDEM on December 8, 2010. A meeting with RIDEM, FAA and RIAC was held onJanuary 11, 2011. Subsequently, a meeting with RIDEM, FAA, and the City of Warwick was held on January 20,2011. See Appendix C, Federal, State, City, and Tribal Coordination, for details on these meetings. Consultationamong the parties is ongoing, and the following information is known.7.11.1 Effects on Land and Water Conservation Fund-Assisted PropertyThe City-owned portion of Winslow Park has been improved using L&WCF grants and is protected underSection 6(f). Both Alternatives B2 and B4 would encroach on Section 6(f)-protected land at Winslow Park andthus result in a conversion of this land from recreational to non-recreational use (refer to Figure 7-6). The Section6(f) boundary map on file with the NPS was recently revised to include only the City-owned portion ofWinslow Park. The L&WCF grants were approved by the NPS approximately three years before theRIAC-owned land was leased to the City. Please refer to refer to Appendix J, Section 4(f) and Section 6(f)Resources, for the City of Warwick’s request to RIDEM’s State Liaison Officer for a boundary change limiting theSection 6(f) boundary to the City-owned portion of the park. In May 2011, RIDEM’s State Liaison Officer for theNPS indicated that the boundary change request from the City was approved by the NPS. 518517 Land and Water Conservation Fund State Assistance <strong>Program</strong>, National Park Service, U.S. Department of Interior, Federal Financial Assistance Manual,October 1, 2008.518 Dias, Joseph. Telephone communication with Kendra Beaver. May 19, 2011.Chapter 7 – Final Section 4(f)/Section 6(f) Evaluation 7-25 July 2011\\Mawatr\ev\09228.00\reports\<strong>FEIS</strong>_Final_July_2011\<strong>PVD</strong>_CH07_4(f)_JUL_2011.doc
T.F. <strong>Green</strong> <strong>Airport</strong> <strong>Improvement</strong> <strong>Program</strong>Environmental Impact Statement and Final Section 4(f) Evaluation7.11.2 Section 6(f) Conversion RequirementsBoth Alternatives B2 and B4 would encroach on Section 6(f)-protected land at Winslow Park. The City ofWarwick will need to follow the Section 6(f) conversion process for the City-owned parcel, if either Alternativeis selected. The DOI has confirmed this in its comment letter on the DEIS stating that “once the Section 4(f)process has been completed, the City must promptly undertake resolution of the Section 6(f)(3) conversion,working directly with the Rhode Island Department of Environmental Management and the National ParkService to complete this LWCF requirement.” (Refer to Appendix A, Responses to Comments, for the entire letter).Section 6(f) Conversion RequestIf Alternative B2 or B4 is selected, the following documentation will be submitted to RIDEM and NPS tofacilitate review of the proposed Section 6(f) conversion for project-impacted Section 6(f) lands. The conversionprocess and NPS approval will likely be concluded after the <strong>FEIS</strong> is issued.1. Boundaries of property to be converted.2. Prudent and feasible alternatives analysis completed as part of Section 4(f) Evaluation.3. Replacement Areaa. Descriptionb. Appraisals of fair market value. Proof will be provided that the fair market value of the replacementarea is at least equal to that of the converted propertyc. Political jurisdiction over the replacement aread. Proof that all necessary coordination has occurrede. Any intergovernmental clearing house review that may be required (RISHPO)f. Statewide Outdoor Recreation Plan Consistency documenting that the proposed conversion is inaccordance with any statewide recreation plansRIDEM’s State Liaison Officer for the NPS indicated during a meeting with FAA and RIAC that the Section 4(f)prudent and feasible alternatives analysis should be sufficient to satisfy the documentation required in #2.With respect to the conversion requirement (i.e., provision of comparable replacement property), RIAC hasbegun coordinating with the City of Warwick to identify appropriate replacement areas. RIAC and the FAA metwith the City of Warwick on January 20, 2011 to initiate this process (see Appendix C, Federal, State, City, andTribal Coordination, for the meeting notes). To meet the replacement provisions of the Section 6(f) conversionrequirements, an area of equal or greater market value would be selected as a replacement Section 6(f) property.The location and boundary of a replacement property and a specific mitigation plan will be developed incooperation with the City of Warwick, NPS, RIDEM, RIAC, and the FAA. The replacement Section 6(f) propertymay be located at the same replacement site provided or it may be located at a different site as part of theSection 4(f) mitigation plan. Regarding the intergovernmental clearing house review requirement, RIDEM’sNPS State Liaison Officer has indicated that the RISHPO will need to review and approve the conversionrequest.Chapter 7 – Final Section 4(f)/Section 6(f) Evaluation 7-26 July 2011\\Mawatr\ev\09228.00\reports\<strong>FEIS</strong>_Final_July_2011\<strong>PVD</strong>_CH07_4(f)_JUL_2011.doc
T.F. <strong>Green</strong> <strong>Airport</strong> <strong>Improvement</strong> <strong>Program</strong>Environmental Impact Statement and Final Section 4(f) Evaluation8Consultation and Coordination8.1 IntroductionPublic consultation and coordination on the T.F. <strong>Green</strong> <strong>Airport</strong> <strong>Improvement</strong> <strong>Program</strong> was undertaken inaccordance with FAA Order 1050.1E and FAA’s Community Involvement Policy Statement. 519 The publicinvolvement process was conducted to obtain meaningful public input regarding RIAC’s proposed T.F. <strong>Green</strong><strong>Airport</strong> <strong>Improvement</strong> <strong>Program</strong>. Specifically, the public involvement process was undertaken to:• Make diligent efforts to involve the public in FAA’s decision making process;• Provide public notice of NEPA-related hearings, public meetings, and the availability of environmentaldocuments to inform people and agencies who may be interested or affected;• Hold or sponsor public information meetings or statutorily required public hearings; and• Solicit appropriate information from the public.As part of the <strong>FEIS</strong> preparation process, the FAA conducted the public outreach activities to comply withSection 106 of the National Historic Preservation Act of 1966, as amended, and other applicable laws havingpublic outreach requirements.The FHWA is a Cooperating Agency on this project in accordance with NEPA and the CEQ regulations forimplementing NEPA (40 CFR 1501.6). FHWA’s role on the EIS included reviewing draft Purpose and Need,Alternatives Analysis, Noise, Air Quality, and Surface Transportation reports. FHWA’s involvement in the EISfocused on the surface transportation improvements necessary to mitigate the impacts of the <strong>Improvement</strong><strong>Program</strong>.In order to allow for substantive early and continuous review and coordination with local, state, and federalagencies and the Narragansett Tribe on the EIS, an Inter-Agency/Tribal Coordination Group (the Coordination519 Community Involvement Policy Statement, FAA, April 17, 1995.Chapter 8 - Coordination and Consultation 8-1 July 2011\\Mawatr\ev\09228.00\reports\<strong>FEIS</strong>_Final_July_2011\<strong>PVD</strong>_CH08_Consultation_JUL_2011.doc
T.F. <strong>Green</strong> <strong>Airport</strong> <strong>Improvement</strong> <strong>Program</strong>Environmental Impact Statement and Final Section 4(f) EvaluationGroup) was established at the beginning of the EIS preparation process. See Section 8.3 for information on thecomposition and activities of the Coordination Group.This chapter summarizes the consultation and coordination process through which federal, state, and localagencies, elected officials, members of the public, and other interested entities were involved in this EIS. Inaddition to providing a description of the public outreach and consultation, this chapter also discusses requiredpermits associated with the proposed T.F. <strong>Green</strong> <strong>Airport</strong> <strong>Improvement</strong> <strong>Program</strong>. Public involvement isdiscussed in Section 8.2, Inter-Agency/Tribal Consultation and Coordination is described in Section 8.3,Section 106 consultation between the FAA, the Rhode Island State Historic Preservation Office (RISHPO) andthe Narragansett Indian Tribal Historic Preservation Office (NITHPO) is provided in Section 8.4, Section 4(f)and Section 6(f) Coordination is in Section 8.5, and coordination with the City of Warwick is described inSection 8.6. A description of the anticipated required permits and approvals is in Section 8.7, a summary of the<strong>FEIS</strong> notifications and distribution is provided in Section 8.8, and a summary of public comments on the EIS inSection 8.9.8.2 Public InvolvementThe FAA conducted a public outreach program for the T.F. <strong>Green</strong> <strong>Airport</strong> <strong>Improvement</strong> <strong>Program</strong> EIS to solicitinformation relevant to the study from agencies and the public and to keep local officials, community membersand other parties informed about the process and status of the EIS. Public outreach included an initial scopingmeeting in 2002 and a second scoping meeting in 2005 when the project scope was revised. There were alsofour public information meetings, small group meetings, a public hearing on the DEIS, public notices, mailings,emails, newspaper and cable television advertisements, and a website (www.vhb.com/pvd/eis/) dedicated tothe <strong>Airport</strong> <strong>Improvement</strong> <strong>Program</strong>.Public outreach activities were carried out in the area surrounding T.F. <strong>Green</strong> through newspaper and cableadvertisements; however, the majority of outreach was done in the City of Warwick, where T.F. <strong>Green</strong> <strong>Airport</strong>is located. The following sections describe the public outreach program in more detail.8.2.1 Public Scoping MeetingScoping is an early, open, and on-going part of the NEPA process used to determine the range of alternatives,issues, and impacts that the EIS will address in detail. The process includes appropriate federal, state, regional,and local agencies and occurs early in the NEPA process before final decisions have been made on the types ofstudies, study area, or content of the EIS. Scoping provides agencies and the public with the opportunity tocontribute to the technical direction and analysis of the EIS and to contribute information that could be relevantto evaluation of the impacts of the proposed action. Scoping meetings are held after a Notice of Intent ispublished in the Federal Register.Following the publication of the first Notice of Intent in the Federal Register on June 27, 2002, a Public ScopingMeeting was held on July 25, 2002. After the projects included in the proposed T.F. <strong>Green</strong> <strong>Airport</strong> <strong>Improvement</strong><strong>Program</strong> changed, a second Notice of Intent was published in the Federal Register on January 19, 2005, and aSupplementary Public Scoping Meeting was held on February 8, 2005 at the Radisson Hotel in Warwick. TheChapter 8 - Coordination and Consultation 8-2 July 2011\\Mawatr\ev\09228.00\reports\<strong>FEIS</strong>_Final_July_2011\<strong>PVD</strong>_CH08_Consultation_JUL_2011.doc
T.F. <strong>Green</strong> <strong>Airport</strong> <strong>Improvement</strong> <strong>Program</strong>Environmental Impact Statement and Final Section 4(f) Evaluationgoal of a Scoping Meeting is to define the purpose and need of the project, show consistency withFAA Order 1050.1E, FAA Order 5050.4B, and the NEPA process, and to solicit input from the public that will beused to prepare the EIS. The public was notified of the scoping meeting through several means. Newspaperadvertisements were run in the Providence Journal on January 20, 2005 and February 3, 2005, in the WarwickBeacon on January 27, 2005 and February 3, 2005, and the Cranston Herald on February 3, 2005. Posters weremailed to 29 locations for posting on community bulletin boards, cable advertisements ran daily fromJanuary 25 to February 3, 2005, and a public mailing was sent to over 90 individuals in the area.The February 8, 2005 Public Scoping Meeting included a video presentation that summarized the proposedprojects and described need for enhancements at T.F. <strong>Green</strong> <strong>Airport</strong>. Informational boards staffed by technicalexperts provided detailed technical data to interested attendees. A separate area was set aside where membersof the public could provide oral comment or could submit written comments to the FAA.During the scoping process over 260 comments in 44 individual letters, comment forms, or through oralcomment were submitted during the two week comment period. The majority of comments received related toalternatives considered, the purpose and need of the project, noise issues, air quality issues, social andcommunity effects, and economic impacts.8.2.2 Public Information Meetings and Public HearingDuring the DEIS preparation process, the FAA conducted four sets of Public Informational Meetings whichwere held in 2005, 2006, 2007, and 2009. The purpose of the first set of meetings (held in both Warwick andCranston) in 2005 was to discuss the purpose and need of the project with the public and explain the role ofgroups involved in the NEPA process. Approximately 90 members of the public attended these meetings. Thesecond set of meetings held in 2006 (also held in Warwick and Cranston) were attended by over 280 members ofthe public. The purpose of the second set of meetings was to provide an update on the status of the NEPAprocess and to discuss possible airport improvement program alternatives. The third meeting was held in 2007and was attended by approximately 400 members of the public. The purpose of the third meeting was to discussthe alternatives analysis screening process and to review the environmental impacts analysis associated with thealternatives. The most recent public meeting was held in June 2009. Approximately 650 members of the publicattended this meeting. The focus of the meeting was to discuss the proposed alternatives and to discuss possiblemitigation. Table 8-1 provides a list, in chronological order, of public information meetings and the publichearing held related to the T.F. <strong>Green</strong> <strong>Airport</strong> <strong>Improvement</strong> <strong>Program</strong> EIS.Notification to the public prior to public meetings was made through advertisements in the Warwick Beacon,Cranston Herald, and Providence Journal and through cable television. Over 1,300 individual mailings weresent to the public as were emails. Personal phone calls were made to stakeholders and posters were sent tocommunity organizations and were posted on community bulletin boards.According to section 47 106 (c)(1)(A)(i) of the 1982 <strong>Airport</strong>s and Airway <strong>Improvement</strong> Act, the opportunity forpublic hearings needs to be offered for this project. 520, 521 The FAA scheduled a public hearing on the DEIS within520 1982 <strong>Airport</strong>s and Airway <strong>Improvement</strong> Act, FAA, 49 USC section 47106 (c)(1)(A)(i).Chapter 8 - Coordination and Consultation 8-3 July 2011\\Mawatr\ev\09228.00\reports\<strong>FEIS</strong>_Final_July_2011\<strong>PVD</strong>_CH08_Consultation_JUL_2011.doc
T.F. <strong>Green</strong> <strong>Airport</strong> <strong>Improvement</strong> <strong>Program</strong>Environmental Impact Statement and Final Section 4(f) Evaluationa comment period ending no sooner than 45 days after issuance of the DEIS. As part of the CWA Section 404Permit, the USACE published a public notice and held a joint public hearing with FAA’s public hearing on theDEIS. The joint public hearing was held on August 17, 2010. The purpose of the public hearing was to providethe public with the opportunity to make comments and state opinions on the DEIS. Approximately 380 peopleattended the public hearing, which was held at the Community College of Rhode Island at the Knight Campusauditorium. Notification to the public prior to the public hearing was through newspaper advertisements,individual mailings, email notifications, internet postings on the project website and on a number of stategovernment websites, posters placed on community boards, and telephone calls.Throughout the EIS preparation process, the FAA held meetings with stakeholders such as communityorganizations, neighborhood groups, airport users, chambers of commerce, and non-governmentalorganizations. These meetings were held as one-on-one discussions as well as small group meetings to give thecommunity an opportunity to ask questions and provide input.Table 8-1EIS Public Outreach and ReviewMeeting Date TopicInitial Public Scoping Meeting July 25, 2002 EIS scope issuesPublic Scoping Meeting [EIS Restarted in 2005] February 8, 2005 EIS scope issuesPublic Workshop July 11, 2005 Identify noise monitoring locationsPublic Information Meeting (Warwick) October 19, 2005 <strong>Program</strong> Purpose and NeedPublic Information Meeting (Cranston) October 20, 2005 <strong>Program</strong> Purpose and NeedPublic Information Meeting (Warwick) March 22, 2006 Alternatives analysisPublic Information Meeting (Cranston) March 23, 2006 Alternatives analysisSmall Group Meetings (Warwick) November 14, 2007 Open discussion with residentsPublic Information Meeting (Warwick) June 14, 2007 Environmental consequencesPublic Information Meeting (Warwick) June 3, 2009 Review additional Alternative B4DEIS Notification July 16, 2010 Notification of availability of the DEIS published according toSection 6.4 of FAA Order 1050.1EDEIS Public Comment Period July 16, 2010 Beginning of 61 day public comment periodPublic Hearing August 17, 2010 Opportunity for public oral and written comment(Joint Hearing on DEIS and USACE Corps Permit)521 As noted, a public hearing is a formal process that needs to be offered during the public comment period to promote public involvement in the NEPAprocess. Public meetings, on the other hand, are informal meetings that can be offered as a means to update the public on project status and receiveinformal feedback.Chapter 8 - Coordination and Consultation 8-4 July 2011\\Mawatr\ev\09228.00\reports\<strong>FEIS</strong>_Final_July_2011\<strong>PVD</strong>_CH08_Consultation_JUL_2011.doc
T.F. <strong>Green</strong> <strong>Airport</strong> <strong>Improvement</strong> <strong>Program</strong>Environmental Impact Statement and Final Section 4(f) Evaluation8.2.3 Project Web Site and UpdatesA website was developed for the T.F. <strong>Green</strong> <strong>Airport</strong> <strong>Improvement</strong> <strong>Program</strong> and has been operational since 2003. Thewebsite provides the public with an overview of the project and an explanation of the NEPA process as well asproviding updates regarding public meetings and coordination. Following each public meeting notes and meetingpresentations are available online for interested parties who were unable to attend meetings in person. The websitealso allows members of the public to register to be included on the project mailing list.The website address is www.vhb.com/pvd/eis/ and can also be accessed via the T.F. <strong>Green</strong> <strong>Airport</strong> main website:www.pvdairport.com/.Additional information was sent to individuals on the T.F. <strong>Green</strong> Public Interested Parties Mailing List in the form ofUpdate Letters. Information included in 2006 and 2007 Update Letters provided the public with an update on thecurrent status of the project and next steps.8.3 Inter-Agency/Tribal Consultation and CoordinationAn initial Notice of Intent was published in 2002. Following the publication of a second Notice of Intent in theFederal Register on January 19, 2005, an agency scoping meeting was held on February 8, 2005. The agencyscoping meeting was attended by representatives from the following federal and state agencies:• EPA • USFWS • RIDOT• FHWA • USHUD • RIHPHC• FTA • NMFS • Office of the Governor• USACE • RIDEMRepresentatives of Congressman James Langevin’s office and the City of Warwick, as well as members of thepress corps, also attended the scoping meeting.The agency scoping meeting included a short presentation about the <strong>Airport</strong> <strong>Improvement</strong> <strong>Program</strong> and theNEPA process and provided meeting attendees with a handout explaining the scoping process. The NEPAhandout provided background information, the reason for the proposed action, possible alternatives beingconsidered, and an overview of the environmental process.After the second scoping meeting in February 2008, an agency scoping meeting was held with federal, state, andlocal agencies and other interested entities with jurisdiction by law or with special expertise on resources that theprogram may affect were invited to participate in the NEPA process as part of an Inter-Agency/TribalCoordination Group (the Coordination Group). The group was modeled after the streamlining recommendationsincluded in the Vision 100- Century of Aviation Reauthorization Act, Pub. L. 108-176, 117 Stat. 2490 (2003). ThisAct directs the U.S. Secretary of Transportation to develop an expedited and coordinated environmental reviewprocess that provides for better coordination among all agencies concerned with the EIS, and in which allenvironmental review and approvals by federal, state, and local agencies are conducted concurrently.Chapter 8 - Coordination and Consultation 8-5 July 2011\\Mawatr\ev\09228.00\reports\<strong>FEIS</strong>_Final_July_2011\<strong>PVD</strong>_CH08_Consultation_JUL_2011.doc
T.F. <strong>Green</strong> <strong>Airport</strong> <strong>Improvement</strong> <strong>Program</strong>Environmental Impact Statement and Final Section 4(f) EvaluationThe first Coordination Group Meeting was held on March 15, 2005 (Table 8-2). The purpose of this meeting wasto discuss the role agencies would play and to come to consensus on an Inter-Agency/Tribal CoordinationAgreement (the Coordination Agreement). A Coordination Agreement was developed as part of theenvironmental review process for the EIS. The Agreement, which was drafted at the March 15, 2005Coordination Group Meeting, provides guidelines for working together as partners to coordinate and expeditethe environmental review process while also improving decision-making. At the conclusion of the firstCoordination Group Meeting, the initial Coordination Agreement was signed by agency representatives. At thesecond Coordination Group Meeting, held on April 27, 2005, federal and state agencies finalized the language tobe used in the Coordination Agreement. By the conclusion of the April 27, 2005 meeting, eight agencies hadsigned the Coordination Agreement to work together in a partnership on the environmental review for the T.F.<strong>Green</strong> <strong>Airport</strong> <strong>Improvement</strong> <strong>Program</strong>. The remaining six agencies signed the Coordination Agreement at a laterdate. The Coordination Agreement establishes a mutually agreed-upon environmental review process andschedule for agency review of the draft materials prepared in support of the EIS. This Coordination Groupprocess in no way supersedes the regulatory review requirements of the participating agencies and tribe.Twelve Coordination Group Meetings were held to discuss the <strong>Airport</strong> <strong>Improvement</strong> <strong>Program</strong> as the FAAprepared the EIS between 2005 and 2011. The Coordination Group participating in the EIS process consists ofthe following agencies and organizations:• FAA • USFWS • RIDOH• NITHPO • HUD • RI Rivers Council• FHWA • RICRMC • RI Statewide Planning• EPA • RIDEM • RIDOT• USACE • RIHPHC • RIAC• FTA • RI Office of the GovernorAfter the Coordination Agreement was signed, a third meeting was held on October 3, 2005, at which thefinalized Coordination Agreement was distributed to agencies. The Draft Purpose and Need Statement for the<strong>Airport</strong> <strong>Improvement</strong> <strong>Program</strong> also was shared with the Coordination Group members.The fourth Coordination Group Meeting was held on November 8, 2005. Thirteen agencies were represented atthis meeting. The Coordination Group reviewed the revised Purpose and Need statement and began to worktoward consensus on the wording of the statement.The next two Coordination Group meetings held on March 21, 2006 and July 25, 2006 focused on <strong>Airport</strong><strong>Improvement</strong> <strong>Program</strong> Alternatives. The initial alternatives were reviewed in March 2006. Agencies submittedquestions and comments which were incorporated into a Supplemental Alternatives Analysis Report. TheSupplemental Alternatives Analysis Report was reviewed at the July 25, 2006 meeting.Chapter 8 - Coordination and Consultation 8-6 July 2011\\Mawatr\ev\09228.00\reports\<strong>FEIS</strong>_Final_July_2011\<strong>PVD</strong>_CH08_Consultation_JUL_2011.doc
T.F. <strong>Green</strong> <strong>Airport</strong> <strong>Improvement</strong> <strong>Program</strong>Environmental Impact Statement and Final Section 4(f) EvaluationThe next two meetings held on February 5, 2007 and April 11, 2007, focused on the preliminary findings of theenvironmental consequences assessment. Coordination Group members were sent draft environmentalconsequences technical reports to review prior to the meetings. Comments or questions that were submitted tothe FAA on these technical reports were compiled and responded to in the revised analysis. In certaincircumstances, follow up meetings or conference calls were held with individual reviewing agencies.The ninth Coordination Group meeting was held on June 13, 2007. This meeting focused on the alternativesscreening process. The group reviewed the Level 4 alternatives screening results and discussed including a Level 5alternatives screening. The Level 5 screening was reviewed at the tenth Coordination Group meeting held onApril 8, 2009. Alternative B4 was introduced at the April 8, 2009 meeting. The Coordination Group reviewed theimpacts of the additional alternative and compared these impacts to previously analyzed alternatives.The eleventh Coordination Group meeting was held on June 3, 2009. This meeting occurred on the morning ofthe fourth public information meeting, later that evening. Coordination Group representatives continued toreview Alternative B4 and discussed possible mitigation opportunities associated with this alternative.Coordination Group members were also given the opportunity to tour T.F. <strong>Green</strong> <strong>Airport</strong>.The twelfth Coordination Group meeting was held on April 11, 2011. This meeting focused on providing theCoordination Group representatives a status report of the EIS process, mitigation, and permitting. An overviewof updates and changes to the project since the publication of the DEIS was also given. Coordination Groupmembers were given the opportunity to ask questions about the project and receive responses from the FAA.In addition to regular meetings, agencies and organizations were involved in the review of technical reports tobe included in the EIS. Technical reports drafted by consultants and reviewed by FAA were selectively sent toentities with regulatory jurisdiction for further review and input. Agencies were also given the opportunity tosubmit comments and questions relating to the technical reports and were able to discuss these commentsduring the Coordination Group meetings. See Appendix C, Federal, State, City, and Tribal Coordination formeeting materials and notes from Coordination Group Meetings.Chapter 8 - Coordination and Consultation 8-7 July 2011\\Mawatr\ev\09228.00\reports\<strong>FEIS</strong>_Final_July_2011\<strong>PVD</strong>_CH08_Consultation_JUL_2011.doc
T.F. <strong>Green</strong> <strong>Airport</strong> <strong>Improvement</strong> <strong>Program</strong>Environmental Impact Statement and Final Section 4(f) EvaluationTable 8-2Coordination Group MeetingsMeeting Date Topics Issues RaisedAgency Scoping Meeting February 8, 2005 DEIS Scope Definition1st Coordination Group Meeting March 15, 2005 Coordination Agreement Consultation process, agreementguidelines2nd Coordination Group Meeting April 27, 2005 Finalized Coordination Agreement Jurisdiction, permitting, coordinationprinciples3rd Coordination Group Meeting October 3, 2005 Presented Draft Purpose and Need Project purpose, regional aviation,alternatives4th Coordination Group Meeting November 8, 2005 Reviewed and Revised Purpose and Need <strong>Airport</strong> capacity, projects included in theAIP, and safety and efficiency5th Coordination Group Meeting March 21, 2006 Reviewed Draft Alternatives Analysis Level 1 screening of alternatives, range ofalternatives, and EIS scheduleCoordination Group Tour April 26, 2006 <strong>Airport</strong> and Surrounding Communities Tour Wetland resources, Buckeye Brook, and<strong>Airport</strong> Road6th Coordination Group Meeting July 25, 2006 Reviewed Draft SupplementalAlternatives AnalysisRunway length, EMAS, range ofalternatives7th Coordination Group Meeting February 6, 2007 Presented Draft Summary of Findings Mitigation and minimization, surfacetransportation, and runway length8th Coordination Group Meeting April 11, 2007 Presented Draft Summary of Findings RPZ, historical properties, noise and thePart 150 <strong>Program</strong>9th Coordination Group Meeting June 13, 2007 Reviewed New Alternative Level 5 alternative screening, feasibility,and program costCoordination Group Tour November 7, 2008 <strong>Airport</strong> and Surrounding Communities Tour Surface transportation, social andeconomic impacts10th Coordination Group Meeting April 8, 2009 Reviewed Alternative B4 Environmental consequences, noise,community impacts11th Coordination Group Meeting June 3, 2009 Reviewed Alternative B4 Impacts Alternatives implementation schedule andmitigation associated with Alternative B412th Coordination Group Meeting April 11, 2011 Update on <strong>FEIS</strong> and Mitigation Updates and changes since the DEIS,current and ongoing agency consultation,and status of mitigation, permitting, and theRODSource: VHB, Inc.Chapter 8 - Coordination and Consultation 8-8 July 2011\\Mawatr\ev\09228.00\reports\<strong>FEIS</strong>_Final_July_2011\<strong>PVD</strong>_CH08_Consultation_JUL_2011.doc
T.F. <strong>Green</strong> <strong>Airport</strong> <strong>Improvement</strong> <strong>Program</strong>Environmental Impact Statement and Final Section 4(f) Evaluation8.4 Section 106 Consultation between the FAA, the Rhode Island State HistoricPreservation Office, and the Narragansett Indian Tribal Historic PreservationOfficeSection 106 of the National Historic Preservation Act of 1966 (NHPA), as amended, requires federal agencies toconsider the effects of their actions on historical properties and to seek comments from the RISHPO and theAdvisory Council on Historic Preservation (ACHP). The NHPA was amended in 1992 (section 101(d)(6)(A) andsection 101(d)(6)(B)) to clarify that historical properties of religious and cultural significance to Indian tribes maybe eligible for listing in the NHRP and that federal agencies, in carrying out their Section 106 responsibilities, mustconsult with any Indian tribe that attaches religious and cultural significance to historical properties that may beaffected by an undertaking. The ACHP reviewed materials and supporting documentation provided by theFAA, and determined that its participation in the consultation is not needed. Refer to Appendix C, Federal, State,City, and Tribal Coordination.As required by 36 CFR Part 800, which governs the Section 106 consultation process, and as described inFAA Order 1050.1E, the FAA has consulted with the RISHPO, represented by the RIHPHC, and the NITHPO, aswell as the City of Warwick Historical Cemetery Commission. The RIHPHC and the NITHPO were invited, andaccepted, to participate in consultation as part of the Coordination Group. Consultation has been ongoing since2005 and has included formal Coordination Group meetings and individual meetings between FAA and RIHPHCand FAA and the NITHPO. The area of potential effect (APE) was developed by the FAA in consultation with theRIHPHC and the NITHPO. NITHPO identified the importance of protecting archaeological sites and the need tomonitor archaeological investigations that would be carried out during the course of the project. FAA andNITHPO reached agreement for NITPHO to monitor subsurface archaeological investigations conducted by thePublic Archaeology Laboratory. Table 8-2 provides an overview of the Coordination Group meetings, andTable 8-3 provides a summary of the consultation between FAA and RIHPHC and the NITHPO.This consultation has resulted in a Memorandum of Agreement (MOA) that includes stipulations to addressand mitigate the adverse effect of the project. The executed MOA has been submitted by FAA to the ACHP (forfiling) along with supporting documentation as specified in 36 CFR Part 800.11(f). Refer to Appendix I, Historic,Architectural, Archaeological, and Cultural Resources, for a signed copy of the MOA. The FAA sent the MOA to theNITHPO, who was invited to participate. No NITHPO comments were received. For further information on theMOA, refer to Chapter 6, Mitigation, Section 6.7, Historic, Architectural, Archaeological, and Cultural Resources.Chapter 8 - Coordination and Consultation 8-9 July 2011\\Mawatr\ev\09228.00\reports\<strong>FEIS</strong>_Final_July_2011\<strong>PVD</strong>_CH08_Consultation_JUL_2011.doc
T.F. <strong>Green</strong> <strong>Airport</strong> <strong>Improvement</strong> <strong>Program</strong>Environmental Impact Statement and Final Section 4(f) EvaluationTable 8-3DateAugust 2, 2001Section 106 ConsultationTopics and Issues RaisedRIHPHC concurs with the preliminary APE corresponding with the 65 DNL contour with the understanding it may changeFebruary 17, 2005April 25, 2005December 20, 2005May 9, 2006May 17, 2006June 15, 2006May 18, 2007June 12, 2007July 16, 2007November 16, 2007May 23, 2008July 17, 2008November 21, 2008January 15, 2009January 30, 2009March 6, 2009March 18, 2009March 25, 2009April 3, 2009April 15, 2009April 27, 2009July 27, 2009November 4, 2010December 28, 2010January 6, 2011May 5, 2011June 3, 2011RIHPHC indicates that increase noise levels outside of the APE (the 65 DNL contour) have the potential to affectsignificant historical resourcesRIHPHC scoping comment letter indicates that the agency will review the APE (the 65 DNL contour)Meeting with the NITHPO to discuss cultural resources, specifically archaeological investigationsMeeting with the RIHPHC and the NITHPO to discuss the archaeological Phase 1c investigationsField Visit with the RIHPHC and the NITHPO to review the proposed archaeological Phase 1c testing locationsMeeting with RIHPHC to review historical plans in relation to the long-term parking facilityPhase I(c) Archaeological and Historic Architectural Assessment Survey transmitted to RIHPHC and NITHPO for reviewand commentRIHPHC requests Determination of National Register eligibility for Hangars No. 1 and 2, and RI Army National GuardBuildingMeeting with the NITHPO and USACE to review the results of the Phase 1c subsurface testingRIHPHC concurs RI Army National Guard Building not eligible for National RegisterNRHP registration forms for Hangar No. 1 and No. 2 forwarded to RIHPHC for review and commentRIHPHC concurred that Hanger No. 1 and No. 2 are eligible for listing on the National RegisterFAA requests reconsideration of boundary of National Register-listed Rhode Island <strong>Airport</strong> Terminal BuildingMeeting with RIHPHC to review project changes and mitigationRIHPHC determines current boundary of Terminal Building is valid and determines that the Terminal Building,Hangars No. 1 and No. 2, and portion of airfield warrant consideration as a historic districtRIHPHC determined that the Striped Feather archaeological site is not eligible for listing on the National Register, anddetermined further investigations of the Double L archaeological site is necessaryFAA letter to RIHPHC committing to additional Phase II site examination of Double L site should preferred alternativeimpact siteMeeting with the NITHPO to discuss impacts to cemeteries and the Phase II archaeological investigationsFAA transmits Determination of Eligibility documentation for the eligible airport historic district to RIHPHC for review andcommentMeeting with the NITHPO to review the recently held Coordination Group MeetingRIHPHC determined that Hangars No.1 and No.2 and the Rhode Island State Terminal Building are an eligible historic districtMeeting with the NITHPO to brief new representativeMeeting with NITHPO to provide an update on the EIS and archaeological resource investigationsRIHPHC determined that the Preferred Alternative would have an adverse effect on historical resourcesMeeting with RIHPHC to provide an update on the EIS, the Phase 1c Survey, the cemetery delineations, and mitigationMemorandum of Agreement between FAA, RIHPHC, and RIAC is signedMeeting with the NITHPO to review results of the ground penetrating radar survey at three historical cemeteriesChapter 8 - Coordination and Consultation 8-10 July 2011\\Mawatr\ev\09228.00\reports\<strong>FEIS</strong>_Final_July_2011\<strong>PVD</strong>_CH08_Consultation_JUL_2011.doc
T.F. <strong>Green</strong> <strong>Airport</strong> <strong>Improvement</strong> <strong>Program</strong>Environmental Impact Statement and Final Section 4(f) Evaluation8.5 Section 4(f) and Section 6(f) Consultation among the FAA, the Rhode IslandState Historic Preservation Office, the Rhode Island Department ofEnvironmental Management, and the City of WarwickSection 4(f) of the U.S. Department of Transportation Act states, “the Secretary of Transportation will notapprove any program or project that requires the use of any publicly-owned land from a public park, recreationarea, or wildlife and waterfowl refuge of national, state, or local significance or land from an historical site ofnational, state, or local significance as determined by the officials having jurisdiction thereof, unless there is nofeasible and prudent alternative to the use of such land and such program, and the project includes all possibleplanning to minimize harm resulting from the use.” 521 If a prudent and feasible alternative exists that avoidsSection 4(f) resources and it would meet the project purpose and need, the FAA may not select the alternativethat uses a Section 4(f) resource. 522Section 6(f) of the Land and Water Conservation Fund Act (L&WCFA) of 1965, codified at Title 16 U.S. Code,section 4601-8(f)(3) (Section 6[f]) 523 , prohibits the conversion to non-recreational use property acquired ordeveloped with grants from the L&WCFA without approval of the Department of Interior’s (DOI) NationalPark Service (NPS). Section 6(f) lands can be converted only if the conversion is in accordance with thecomprehensive statewide outdoor recreation plan in effect at that time and if there is a substitution of otherrecreation properties of at least equal fair market value and of reasonably equivalent usefulness and location.8.5.1 Section 4(f) ConsultationFAA conducted preliminary coordination with the agencies having jurisdiction over Section 4(f) propertieswithin the Study Area for the T.F. <strong>Green</strong> <strong>Airport</strong> <strong>Improvement</strong> <strong>Program</strong> to identify the presence of suchproperties and to determine the primary use of subject properties.The RIHPHC, acting as the RISHPO, has been consulted in the evaluation of Section 4(f) historical properties inthe Project Area, the determination of adverse effect to the eligible airport historic district, to provide adequateconsideration of measures to avoid or minimize impacts and to discuss possible measures to minimize harm.The finding of adverse effect has been made, and the RIHPHC has already concurred. As described inSection 8.4, Section 106 Consultation between the FAA, the RISHPO, and the NITHPO, a MOA has been executedthat includes stipulations to mitigate the adverse effect of the project. The executed MOA is provided inAppendix I, Historic, Architectural, Archaeological, and Cultural Resources, and mitigation related to Section 4(f)resources is described in Chapter 6, Mitigation, Section 6.8, Section 4(f) Resources.The NITHPO was consulted during the preparation of this <strong>FEIS</strong>. This coordination will continue through theconstruction process as necessary to avoid disturbance of archaeological sites.521 United States Department of Transportation Act of 1966, Section 4(f), 49 USC, section 303(c).522 Chapter 7, Section 4(f) Resources in Federal Aviation Administration Environmental Desk Reference for <strong>Airport</strong> Actions, U.S. Department of Transportation,October 5, 2007, page 11.523 Section 6(f) of the Land and Water Conservation Fund Act of 1965, codified at Title 16 U.S.C., section 4601-8(f)(3) (Section 6[f]).Chapter 8 - Coordination and Consultation 8-11 July 2011\\Mawatr\ev\09228.00\reports\<strong>FEIS</strong>_Final_July_2011\<strong>PVD</strong>_CH08_Consultation_JUL_2011.doc
T.F. <strong>Green</strong> <strong>Airport</strong> <strong>Improvement</strong> <strong>Program</strong>Environmental Impact Statement and Final Section 4(f) EvaluationCoordination with the City of Warwick included determinations regarding the primary use and functions ofSection 4(f) properties. FAA and RIAC continue to coordinate with the City of Warwick to assess ways tominimize or mitigate impacts to recreational resources and coordinate plans for relocating the Winslow Parkfacilities. RIAC consulted with the City of Warwick to develop an agreement regarding non-impacted facilitiesbut no agreement was reached as documented in Chapter 7, Final Section 4(f)/Section 6(f) Evaluation.8.5.2 Section 6(f) ConsultationA portion of Winslow Park and associated facilities was funded through Section 6(f) funds. FAA and RIAC havecoordinated with the National Park Service (NPS), its state liaison, RIDEM, which also dispenses Section 6(f)funds on behalf of the NPS, and the City of Warwick, which received the Section 6(f) funds. Coordination isongoing to ensure that the mitigation required under the L&WCFA meet the criteria for replacement ofimpacted Section 6(f) lands.8.6 City and Local CoordinationIn addition to FAA coordination with the public and agencies, there has been ongoing coordination between theFAA and the City of Warwick, and other local organizations and individuals, which was initiated in 2005(Table 8-4). A MOA was drafted and signed by both the FAA and the Mayor of Warwick in November 2005.The purpose of the MOA was to determine a framework for coordination, responsibilities, and proceduresrelating to the EIS. As agreed upon in the MOA, the FAA and City (Mayor and/or planning department staff)met regularly to review the status of the NEPA process. Eighteen meetings were held with local representatives.The Warwick City Council was briefed at various times. RIAC is also a member of the City of WarwickComprehensive Plan Committee and has also continued to coordinate with the City of Warwick throughout theNEPA process. The RIAC Board has a voting representative from the City of Warwick.Chapter 8 - Coordination and Consultation 8-12 July 2011\\Mawatr\ev\09228.00\reports\<strong>FEIS</strong>_Final_July_2011\<strong>PVD</strong>_CH08_Consultation_JUL_2011.doc
T.F. <strong>Green</strong> <strong>Airport</strong> <strong>Improvement</strong> <strong>Program</strong>Environmental Impact Statement and Final Section 4(f) EvaluationTable 8-4Local Coordination MeetingsDateJune 29, 2005June 29, 2005July 8, 2005July 18, 2005July 15, 2005July 19, 2005Topics and Issues RaisedMeeting with City of Warwick Planning – Project introductionMeeting with Cranston City Planner – Project introductionMeeting with Abbott Realty to obtain baseline commercial land use real estate market informationMeeting with City of Warwick Planning Office and City of Warwick Office of Housing and Community Developmentregarding affordable housing.Meeting with RI Department of Economic CorporationMeeting with Warwick Affordable Housing Task Force ChairSeptember 1, 2005 Meeting with Central Rhode Island Chamber of Commerce Director regarding study area businessSeptember 19, 2005 Teleconference with Warwick Housing Authority Director to discuss affordable housingMarch 14, 2006Meeting with City of Warwick representatives to discuss Draft Alternatives Analysis ChapterApril 6, 2006Meeting with Warwick planners to discuss roadways and alternativesApril 6, 2006Meeting with Warwick Council Chair, Donald TorresMarch 6, 2007Meeting with Mayor AvedisianApril 6, 2007Meeting with City of Warwick to discuss Environmental ConsequencesJune 2007Meeting with RIAC and Mayor Avedisian to discuss alternativesJuly 9, 2007Meeting with City to discuss communications, review of the additional alternatives, and next stepsSeptember 12, 2007 Meeting with the City to discuss <strong>Airport</strong> Road Relocation optionsOctober 31, 2007Meeting with City Planners and RIDOT to discuss <strong>Airport</strong> Road Relocation optionsMay 21, 2009Meeting with the City, RIAC, and FAA to provide a status update on the DEISJanuary 20, 2011Meeting with City Planners, RIAC, and FAA to discuss Section 4(f) and 6(f) ResourcesSource: VHB, Inc.Note: RIAC has also coordinated with the City of Warwick throughout the NEPA process.8.7 Required Permits, Approvals, and ActionsThis <strong>FEIS</strong> is required because the sponsor (RIAC) is seeking FAA approval of the <strong>Airport</strong> Layout Plan (ALP),which includes the T.F. <strong>Green</strong> <strong>Airport</strong> <strong>Improvement</strong> <strong>Program</strong> elements. This is a federal action that requiresreview pursuant to NEPA, as described in FAA Order 5050.4B. Three alternatives are discussed in this <strong>FEIS</strong> indetail. These alternatives include: the No-Action Alternative, Alternatives B2, and the Preferred Alternative(Alternative B4). The Preferred Alternative would likely require permits as listed in Table 8-5.Chapter 8 - Coordination and Consultation 8-13 July 2011\\Mawatr\ev\09228.00\reports\<strong>FEIS</strong>_Final_July_2011\<strong>PVD</strong>_CH08_Consultation_JUL_2011.doc
T.F. <strong>Green</strong> <strong>Airport</strong> <strong>Improvement</strong> <strong>Program</strong>Environmental Impact Statement and Final Section 4(f) EvaluationFAA directives require that this EIS include evidence and required consultation to support any determinationsapplicable to the approval of the ALP and the potential of federal funding. 524 FAA determinations that may berequired for the proposed Project include:• Consistency with existing plans for development of the area;• Finding of conformity with respect to the Clean Air Act (CAA) and the State Implementation Plan (SIP);• Determination of effects upon safe and efficient utilization of airspace;• Determination under U.S. Department of Transportation Section 4(f) policy on lands, wildlife andwaterfowl refuges, and historical sites;• Consistency with the approved state Coastal Zone Management <strong>Program</strong> (CZMP); and• ALP approval (FAA’s approval of the ALP will incorporate all the physical elements associated with theselected alternative).Table 8-5 T.F. <strong>Green</strong> <strong>Airport</strong> <strong>Improvement</strong> <strong>Program</strong> Possible Permits and Approvals 1AgencyFederalArmy Corps of EngineersEnvironmental Protection AgencyNational Park Servi ceTribeNarragansett TribeStateRI Coastal Resources Management CouncilRI Department of Environmental ManagementRI Department of TransportationRI Historic Preservation and Heritage Commissi onPermit or ApprovalCWA Section 404 Individual PermitSafe Drinki ng Water Act ComplianceSection 6(f) Conversi on Approval 2NHPA Section 106 CoordinationFederal Consistency ReviewFreshwater Wetlands Alteration Permi tRhode Island Pollution Discharge Eliminati on System (RIPDES) - Stormwater Design andConstructionCWA Water Quality Section 401 Certificati onPreliminary Determination Applicati onAir Polluti on Control Permits – Minor Source Permits 2Above Ground Storage Tank Application (Fuel Farm)Underground Injecti on Control PermitSection 6(f) Conversion ApprovalPhysical Alteration PermitsCategory A/B AssentNHPA Section 106 ConcurrenceMunicipalCity of Warwi ckHistorical Cemetery Commission ApprovalSource: VHB, Inc.1 Consistency or concurrence from agencies not listed above may be required during the permit applicati on process.2 The City of Warwick will be coordinating with the Nati onal Park Service and RIDEM regarding the Section 6(f) conversion approval .3 A modified permit is required for steam boilers and emergency generators and a new permit i s required for new fuel storage tanks.524 FAA Order 1050.1E, Environmental Impacts: Policies and Procedures, FAA, United States Department of Transportation, March 20, 2006.Chapter 8 - Coordination and Consultation 8-14 July 2011\\Mawatr\ev\09228.00\reports\<strong>FEIS</strong>_Final_July_2011\<strong>PVD</strong>_CH08_Consultation_JUL_2011.doc
T.F. <strong>Green</strong> <strong>Airport</strong> <strong>Improvement</strong> <strong>Program</strong>Environmental Impact Statement and Final Section 4(f) EvaluationSection 404 of the Clean Water Act, as implemented by 40 CFR Part 230, requires the USACE to identify the leastenvironmentally damaging practicable alternative (LEDPA) following submission of the Clean Water ActSection 404 permit application. No discharge of dredged or fill material is permitted if there is a practicablealternative to the proposed discharge which would have less adverse impact on the aquatic ecosystem, so longas the alternative does not have other significant adverse environmental consequences.8.8 EIS Notifications and DistributionFollowing the publication of the T.F. <strong>Green</strong> <strong>Airport</strong> <strong>Improvement</strong> <strong>Program</strong> DEIS in the Federal Register onJuly 16, 2010, a 45-day review period began. Upon request from the City of Warwick, the comment period wasextended another 16 days to a total of 61 days. Notification of the publication was announced in the CranstonHerald, Warwick Beacon, and Providence Journal. The notification included information on how to obtaincopies of the DEIS, and when and where public hearings were held. Distribution of the DEIS began a weekbefore the publication. Copies of the DEIS were available for review at the libraries listed in Table 8-6.The publication of this <strong>FEIS</strong> was announced in the Cranston Herald, Warwick Beacon, and Providence Journal.The notification included information on how to obtain copies of the <strong>FEIS</strong>. Copies of the <strong>FEIS</strong> are available forreview at the libraries listed in Table 8-6.Copies of the Executive Summary and <strong>FEIS</strong> have been placed at the locations listed in Table 8-6, and areavailable on the web at www.vhb.com/pvd/eis. A Notice of Availability for the <strong>FEIS</strong> has been posted atwww.vhb.com/pvd/eis . The notice includes instructions on how to obtain a copy of the <strong>FEIS</strong> on DVD and howto download a copy from the website. CDs are available on request.Table 8-6Locations for Public Review of the EISLocationWarwick Public LibrariesWarwick Public LibraryPontiac Free LibraryApponaug BranchCranston Central LibraryProvidence Central Public LibrarySource: VHB, Inc.Address600 Sandy Lane, Warwick, RI 02889101 <strong>Green</strong>wich Avenue, Warwick, RI 028863267 Post Road, Warwick, RI 02886140 Sockanosset Crossroads, Cranston, RI 02920150 Empire Street, Providence, RI 029038.9 Public Comments on the EISThe public comment process is central to the environmental review process. The FAA made the DEIS availableto the public for review and comment. In fulfillment of the FAA’s NEPA requirements, a DEIS public hearingwas held on Tuesday, August 17, 2010 at 6:00 PM at the Community College of Rhode Island – Knight Campusin Warwick, Rhode Island. The public hearing provided an opportunity for the community to providecomments on the DEIS. All oral comments presented in person at the Public Hearing were recorded by aChapter 8 - Coordination and Consultation 8-15 July 2011\\Mawatr\ev\09228.00\reports\<strong>FEIS</strong>_Final_July_2011\<strong>PVD</strong>_CH08_Consultation_JUL_2011.doc
T.F. <strong>Green</strong> <strong>Airport</strong> <strong>Improvement</strong> <strong>Program</strong>Environmental Impact Statement and Final Section 4(f) Evaluationstenographer and a transcript of comments was prepared. This public hearing also was a joint hearing of theFAA and the USACE in fulfillment of the USACE’s requirements under Section 10 of the Rivers and HarborsAct of 1899 and Section 404 of the Clean Water Act.The FAA accepted written comments on the DEIS by letters, comment cards, and email. As required by FAAguidance, all comments received from the public within the 61-day public comment period were considered inpreparing the <strong>FEIS</strong>. Appendix A, Responses to Comments, provides a written response to each comment receivedduring the DEIS comment period. A total of 160 comment documents were submitted during the commentperiod including letters, emails, and individual testimonies in the form of a transcript from the August 17, 2010public hearing. Approximately 2,000 individual comments were identified in the comment letters, emails andtestimony by agencies, organizations, and individuals. Comments were focused on a variety of topics, with alarge number focused on Purpose and Need, Socioeconomic Impacts, Noise, and Wetlands.NEPA does not require, and the FAA usually does not provide, a formal comment period on the <strong>FEIS</strong>. For moreinformation, email tfgreen@vhb.com or contact Mr. Richard Doucette at 781-238-7613 or write to:Richard DoucetteEnvironmental <strong>Program</strong> ManagerFederal Aviation Administration12 New England Executive ParkBurlington, MA 01803Chapter 8 - Coordination and Consultation 8-16 July 2011\\Mawatr\ev\09228.00\reports\<strong>FEIS</strong>_Final_July_2011\<strong>PVD</strong>_CH08_Consultation_JUL_2011.doc
T.F. <strong>Green</strong> <strong>Airport</strong> <strong>Improvement</strong> <strong>Program</strong>Environmental Impact Statement and Final Section 4(f) Evaluation9List of Preparers9.1 IntroductionThe T.F. <strong>Green</strong> <strong>Airport</strong> <strong>Improvement</strong> <strong>Program</strong> <strong>FEIS</strong> was prepared by the FAA in coordination with RIAC.Technical analyses and documents were prepared by a team of technical consultants. The entities involved, aswell as the personnel and their individual areas of responsibility, are listed below. The years of experience foreach individual are listed in parentheses.9.2 Federal Aviation Administration, New England Region• Richard Doucette – EIS Project Manager, FAA New England Region <strong>Airport</strong>s Division Environmental<strong>Program</strong> Manager (28)• Bryon Rakoff – Branch Manager, Planning and <strong>Program</strong>ming, FAA New England Region<strong>Airport</strong>s Division (29)9.3 Vanasse Hangen Brustlin, Inc.Agency Coordination, Purpose and Need, Alternatives Analysis, Biological Resources, Coastal ZoneManagement, Compatible Land Use, Document Production, Energy and Natural Resources, EnvironmentalJustice/Children’s Health and Safety, Farmlands, Hazardous Materials and Solid Waste, ProjectManagement, Public Outreach, Socioeconomic, Section 4(f), Surface Transportation, Water Quality,Wetlands and Waterways, and Visual.• Laura Castelli – Transportation Engineer (11), Surface Transportation• Lauren DeVoe, LEED AP – Planner (7), Land Use, Farmlands• Carol Lurie, LEED AP, AICP – Consultant Project Manager (31)• Susan Moberg – Manager, Environmental Sciences (17), Hazardous Materials, Wetlands, Permitting• Susan Nichols, LEED AP (11) – Senior Environmental Planner (9), Alternatives Analysis, EnvironmentalJustice, Agency Coordination, and Public OutreachChapter 9 - List of Preparers 9-1 July 2011\\Mawatr\ev\09228.00\reports\<strong>FEIS</strong>_Final_July_2011\<strong>PVD</strong>_CH09_Preparers_JUL_2011.doc
T.F. <strong>Green</strong> <strong>Airport</strong> <strong>Improvement</strong> <strong>Program</strong>Environmental Impact Statement and Final Section 4(f) Evaluation• Jeffrey Peterson – Senior Soil Scientist (33), Wetlands, Biological Resources, Floodplains, Threatened andEndangered Species• Alyssa Sandoval, M.S. – Planner (6), Section 4(f) and Section 6(f), Light Emissions, Farmlands, Visual• Jonathan Stabach, P.E., LEED AP (17), – Engineer (4), Water Quality• Benjamin Siwinski, C.M. – Senior <strong>Airport</strong> Planner/Project Manager (17), Purpose and Need• Lisa A. Standley, PhD – Chief Environmental Specialist (35), Natural Resources and Permitting• Janet Thomas – Senior GIS Analyst (9), GIS Specialist/Cartographer, Mapping and Graphics• Autumn Young – <strong>Airport</strong> Planner (8), Purpose and Need• Jason Zogg, LEED AP – Planner (3), Energy and Natural Resources9.4 Economic Development Research Group, Inc.Socioeconomic, Land Use• Steven Landau – Director of Strategy Planning (26)• Brett Piercy – Senior Planning Analyst (8)9.5 Harris Miller Miller & Hanson, Inc.Noise• Mary Ellen Eagan – President (26)• Robert Mentzer – Senior Scientist (22)• Sean Doyle – Noise Consultant (4)9.6 I 2 Community Development Consulting, Inc.Affordable Housing• Eric Hangen– President/Housing Affordability Consultant (16)9.7 Intervistas, Inc.Forecasting• Douglas Wilson – Forecasting Consultant (33)Chapter 9 - List of Preparers 9-2 July 2011\\Mawatr\ev\09228.00\reports\<strong>FEIS</strong>_Final_July_2011\<strong>PVD</strong>_CH09_Preparers_JUL_2011.doc
T.F. <strong>Green</strong> <strong>Airport</strong> <strong>Improvement</strong> <strong>Program</strong>Environmental Impact Statement and Final Section 4(f) Evaluation9.8 Jacobs Engineering, Inc.<strong>Airport</strong> Engineering and Planning• Derek Amorelli, PE – Project Engineer (18)• Richard Lasdin, PE – Senior Project Manager (26)• William Richardson – Senior Aviation Planner (36)9.9 KB Environmental Sciences, Inc.Air Quality• Michael Kenney, QMP – Senior Air Quality Scientist (31)• Michael Ratte – Air Quality Scientist/Meteorologist (23)• Wayne Arner – Air Quality Specialist (9)9.10 KM Chng Environmental, Inc.Air Quality• David Ernst – Senior Air Quality Consultant (27)9.11 O.R. Colan AssociatesLand Acquisition• Steven Cleary – Relocation Specialist/Regional Manager (23)• Derrick Roma – Acquisition and Relocation Assistant (4)9.12 Public Archaeology LaboratoryHistorical, Archaeological, and Cultural Resources• Alan Leveille – Senior Archaeologist (33)• Peter Mair – Project Manager/Senior Archaeologist (33)• Steven Olausen –Senior Architectural Historian (23)• Matt Kierstead – Senior Industrial Historian (16)9.13 RKG Associates, Inc.Social and Socioeconomic• Darren Mochrie – Senior Project Manager (11)• Craig Seymour – Principal (26)Chapter 9 - List of Preparers 9-3 July 2011\\Mawatr\ev\09228.00\reports\<strong>FEIS</strong>_Final_July_2011\<strong>PVD</strong>_CH09_Preparers_JUL_2011.doc
T.F. <strong>Green</strong> <strong>Airport</strong> <strong>Improvement</strong> <strong>Program</strong>Environmental Impact Statement and Final Section 4(f) EvaluationThis Page Intentionally Left BlankChapter 9 - List of Preparers 9-4 July 2011\\Mawatr\ev\09228.00\reports\<strong>FEIS</strong>_Final_July_2011\<strong>PVD</strong>_CH09_Preparers_JUL_2011.doc
T.F. <strong>Green</strong> <strong>Airport</strong> <strong>Improvement</strong> <strong>Program</strong>Environmental Impact Statement and Final Section 4(f) Evaluation10Distribution ListThis T.F. <strong>Green</strong> <strong>Airport</strong> <strong>Improvement</strong> <strong>Program</strong> <strong>FEIS</strong> is being distributed to federal, state, and city agencies and to theinterested parties listed below. This list includes those entities that the FAA Order 1050.1E and FAA Order 5050.4Brequire as part of the review of the document, including representatives of government agencies and communitygroups concerned with this project. Individuals that attended public meetings, attended the public hearing, orsubmitted comments on the DEIS are included in Section 10.9, Interested Parties. Full copies of this report are availableat the libraries listed on the following pages on the web at www.vhb.com/pvd/eis. For more information regardingthis document or for additional copies of this report please email tfgreen@vhb.com or contact:Richard DoucetteEnvironmental <strong>Program</strong> ManagerFAA New England Region, <strong>Airport</strong>s DivisionFederal Aviation AdministrationNew England Regional Office12 New England Executive ParkBurlington, MA 01803781-238-761310.1 Indian Tribes of the United StatesJohn BrownTribal Historic Preservation OfficerAnemone MarsSenior Deputy Tribal Historic Preservation Officer10.2 Federally Elected OfficialsU.S. SenateU.S. Senator Jack ReedU.S. Senator Sheldon WhitehouseU.S. House of RepresentativesU.S. Representative David CicillineU.S. Representative Jim LangevinChapter 10 – Distribution List 10-1 July 2011\\Mawatr\ev\09228.00\reports\<strong>FEIS</strong>_Final_July_2011\<strong>PVD</strong>_CH10_Distribution_List_JUL_2011.doc
T.F. <strong>Green</strong> <strong>Airport</strong> <strong>Improvement</strong> <strong>Program</strong>Environmental Impact Statement and Final Section 4(f) Evaluation10.3 Federal AgenciesFederal Highway AdministrationLucy GarliauskusDivision AdministratorMichael ButlerEnvironmental CoordinatorFederal Transit AuthorityPeter ButlerDirector of Planning and <strong>Program</strong> DevelopmentTransportation Systems CenterCorey BobbaSenior EngineerRalph RizzoTransportation PlannerWilliam GordonPlannerTransportation Systems CenterNOAA -National Marine FisheriesPatricia KurkulRegional AdministratorU.S. Army Corps of EngineersChristine GodfreyChief of Regulatory DivisionRuth LaddNew England RegionProject ManagerRobert DeSistaNew England RegionChief of Permits and Enforcement SectionMichael ElliottNew England RegionProject ManagerU.S. Department of CommerceGary LockeSecretaryU.S. Department of Housing and Urban DevelopmentNancy Smith GreerRegional Office DirectorNoah DoriusOperations SpecialistU.S. Department of the InteriorWilliam R. TaylorDirector Office of Environmental Policy and ComplianceU.S. Environmental Protection AgencyElizabeth Higgins CongranDirector, Office of Environmental ReviewTimothy Timmermann Environmental Scientist,NEPA ReviewerMatt SchweisbergRegion 1, Wetlands Protection UnitCurtis SpauldingEPA Office of Federal Activities EIS Filing SectionChapter 10 – Distribution List 10-2 July 2011\\Mawatr\ev\09228.00\reports\<strong>FEIS</strong>_Final_July_2011\<strong>PVD</strong>_CH10_Distribution_List_JUL_2011.doc
T.F. <strong>Green</strong> <strong>Airport</strong> <strong>Improvement</strong> <strong>Program</strong>Environmental Impact Statement and Final Section 4(f) EvaluationU.S. Fish and Wildlife ServiceMichael BartlettN.E. Field Office SupervisorMaria TurNew England Region Environmental Reviewer10.4 Rhode Island State Elected OfficialsState SenatorsSenator Michael J. McCaffreySenator William A. WalaskaSenator Erin P. LynchSenator Dawson HodgsonSenate PresidentTeresa Paiva-WeedState RepresentativesRepresentative Frank FerriRepresentative Robert FlahertyRepresentative Eileen NaughtonRepresentative Joseph McNamaraRepresentative Joseph TrilloSpeaker of the House Gordon FoxGovernor of Rhode IslandGovernor Lincoln D. ChafeeLieutenant Governor of Rhode IslandLt. Governor Elizabeth RobertsRhode Island Secretary of StateA. Ralph MollisState of Rhode Island General TreasurerGina M. RaimondoState of Rhode Island Attorney GeneralPeter F. Kilmartin10.5 State AgenciesRhode Island <strong>Airport</strong> CorporationKevin DillonChief Executive OfficerBrenda EnosVice President of Environmental ManagementAnn L. ClarkeSenior Vice President Planning, Engineering andEnvironmentRhode Island Coastal Resource Management CouncilGrover FugateExecutive DirectorRhode Island Department of Environmental ManagementJanet CoitDirectorTerrance GrayDirector's OfficeJames BoydCoastal Policy AnalystRonald GagnonOffice of Technical and Customer AssistanceJoseph DiasChief, Division of Planning and DevelopmentChapter 10 – Distribution List 10-3 July 2011\\Mawatr\ev\09228.00\reports\<strong>FEIS</strong>_Final_July_2011\<strong>PVD</strong>_CH10_Distribution_List_JUL_2011.doc
T.F. <strong>Green</strong> <strong>Airport</strong> <strong>Improvement</strong> <strong>Program</strong>Environmental Impact Statement and Final Section 4(f) EvaluationRhode Island Department of HealthJohn FultonAssociate DirectorRhode Island Department of TransportationMichael P. Lewis Robert Smith Michael GannonDirector Review Coordinator Design SectionDesign SectionRhode Island Historic Preservation and Heritage CommissionEdward SandersonJeffrey EmidyExecutive DirectorProject Review CoordinatorRhode Island Statewide PlanningJarred RhodesChiefRhode Island Rivers CouncilGuy LefebvreChairman10.6 MunicipalitiesWarwickWarwick Planning DepartmentMayor Scott Avedisian Councilman Steve Merolla William DePasquale, DirectorCouncilman Steven Colantuono Council President Bruce PlaceWarwick Historic DistrictCouncilman John DelGiudice Councilman Joseph J. Solomon CommissionCouncilman Charles J. Donovan, Jr. Councilwoman Camille Vella-Robert KunzCouncilman Raymond E. GallucciWilkinsonWarwick Historical CemeteryCouncilwoman Donna Travis CommissionMargaret MalcolmCranstonMayor Allan FungCranston Planning DepartmentPeter LapollaChapter 10 – Distribution List 10-4 July 2011\\Mawatr\ev\09228.00\reports\<strong>FEIS</strong>_Final_July_2011\<strong>PVD</strong>_CH10_Distribution_List_JUL_2011.doc
T.F. <strong>Green</strong> <strong>Airport</strong> <strong>Improvement</strong> <strong>Program</strong>Environmental Impact Statement and Final Section 4(f) Evaluation10.7 Public LibrariesWarwickWarwick Public Library Warwick Public Library CranstonSandy Lane Conimicut Branch Cranston Public LibraryCentral LibraryWarwick Public LibraryWarwick Public LibraryPontiac Free Library Norwood Branch ProvidenceCentral Public LibraryWarwick Public LibraryApponaug Branch10.8 Non-Governmental OrganizationsAmerican Lung Association Environment Council of Ocean State ActionRhode IslandBrown UniversityProvidence ChamberPatti Canton The Episcopal Diocese of Rhode Laurie WhiteIsland Diocesan HouseBuckeye Brook CoalitionRemodel Wrights of RI Inc.Friends of India PointButtonwoods Community CenterRhode Island Earth Day CommitteeMichael RooneyLynne Harrington GB WatershedGroupThe Rhode Island RuralBryant UniversityDevelopment CouncilRonald MachtleyHispanic American Chamber ofCommerceRhode Island Tree CouncilClean Water Action RIJuana HortonSheila DormodyRhode Island Chamber of CommerceJohnson and Wales University Janet RaymondConservation Law Foundation David VaroneJerry Elmer and Jill GrochmalRose Lighthouse FoundationLincoln ParkCoventry Conservation Commission Neighborhood Assn. Save the Bay CenterNicole Wilkinson Scott Goodinson Jonathan StoneThe Dunn Foundation Lincoln Land Trust The Nature ConservancyTown of Lincoln, RIEast Coast <strong>Green</strong>wayThe Westerly Land TrustEcology Action for RIMill Cove ConservancyBill DerrigThe Providence FoundationDaniel BaudouinChapter 10 – Distribution List 10-5 July 2011\\Mawatr\ev\09228.00\reports\<strong>FEIS</strong>_Final_July_2011\<strong>PVD</strong>_CH10_Distribution_List_JUL_2011.doc
T.F. <strong>Green</strong> <strong>Airport</strong> <strong>Improvement</strong> <strong>Program</strong>Environmental Impact Statement and Final Section 4(f) Evaluation10.9 Interested PartiesWarwick Ann and John Barth Mary and Wilson Brown Mathew CartyDavid and ShirleyDolores Bartoszewicz Michelle Bruning James CaruoloAbrahamsonFaith Bates Alice Bryant John CaruthersGeorge and Mary Amadio Joe Baxter James Bryant Christopher CavanaughRalph AccinnoThomas Beagan Tammy and William Buccella Barbara CesarioHank AdamsGeraldine Beaudoin Brian Bucci Marcus ChannenMary Lou AdamsBarbara Beaudry Guy Donna Buco Thomas ChestnaSusan AdamsLeo Beliveau Alice Burratti Brian ChiancaRoss AdrainEleanor Bellandese Robert Buratti Tom ChoiniereDonald AdessiWalter Belmore David and Doreen Burdick Susan ChuPat AdoptanteCarl Bender Pamela Burdon Allen ClarkDennis AllenDavid Bennett Peter and Terri Burke Debbie ClarkThomas and Elaine Allen Glen Bennett Michelle Burnett Sharon ClarkMichael AlmeidaChristine Benson Brian Burns Paige and Sarah Clausius-ParksWalter and Margaret Amoroso Lisa Benson Joan Butler Carol ClaytonDerek AndersenGeorge Bentley Lorraine Butler George and Judith CohenRobin AndersenDotty Benton Glenda Butter Martin CohenCarole AndersonBenny Bergantino Doyle Byrd Barbara ColeElizabeth AndersonGail Bergantino Maureen Byrne Evelyn CollinsStephen AndolfoJery Bernardini Kevin Cabral Richard and Nancy CollinsTinamarie AndrewRobert Bernier Robin Cahoon Sean CollinsRobert AndrewsDavid Berry Jeffrey Caldwell Mark ConklinGail AndrewsRobert and Chery Berube Anthony Caliri Edna ConleyAnn and Tom Saccoccio Andrea Biagi S. Callahan Lynn ContiRobert and Deborah Arabian Victor Bianchelle Judith and William Cameron Thaddeus CoonsSalvatore ArliaGreg Birmingham Marybeth Camirand Gerald CooperKeith ArmstrongPhyllis Blanchette Christine Camoureux Jim CoppolaMike AshworthMichael Blanchette Steve Campanelli Ralph CoppolaAdele and Alfred Arsenault Raymond Blanchette Cheryl Camparoni Anthony CorsiStephen and Doris Arthur Greg Blanchotte Bob Canavan Mary CorrenteEdward AsprinieCatherine Blinkhorn Gina Canepa Celica CostantinoMark and Steven Asprinio Rhoderick Blue Linda Capobianco Damian CostantinoEdward AsprinroHarry Bogosian Henry Capotosto Roy CostaHelen AvizinisSteven Bonn Michael Capuano David and Stacey CoutuLinda AyersErnest and Carol Botelho Amy and Patrick Carbary Dick CoutuDenise AyotteAndrea Bourque Nancy and Robert Carberry Clifford CoutcherEdward AzeredoNancy Bourque Tony and Kathleen Carcino Richard CouthAnn and Barbara Babin Brian Boutin Dianne Card Ian CresswellSallie BacklundEd and Liz Boynton Michael Cardillo Pentair Electronic PackagingGreg BagianRalph Bozzi Marc Cardin Michael and Gail CrokeRuth BaileyDavid Bradley Vickie Cariglio Deborah CroneMarilyn BakerMary Brady Lee Carling Seth CrosbyNancy BakerAlan Brindamour Anthony Carlino Frederick CrossmanSue BakerDebra Brissette-Fortune Edward Carlson Ryan CrowleyWalter BalekConstance Brodeur Vicki Carlson-Clark Henry and Marth CruceaniBruce BalemianMike Bronswood Joanne and Francis Carmichael John CruzRita BaptierCarol and William Brothers Irma Carolan Laurinda CruzDaniel BarbarisiMark Broussard Carmine Carpentier Russell CucinoElizabeth BarbourDonna Brown Cindy and Richard Carrara Richard CullinsPalph BarksHerbert Brown Dawn Casey Row Robert and Maria CullinsEric BarrLeslie Brown Greg and Tracy Carson Frank CurtisChapter 10 – Distribution List 10-6 July 2011\\Mawatr\ev\09228.00\reports\<strong>FEIS</strong>_Final_July_2011\<strong>PVD</strong>_CH10_Distribution_List_JUL_2011.doc
T.F. <strong>Green</strong> <strong>Airport</strong> <strong>Improvement</strong> <strong>Program</strong>Environmental Impact Statement and Final Section 4(f) EvaluationRobert CushmanPeter CusickBruce CyganoskiRobin D'AgostinoLillian and Mark D'AielloStephen and AnnDaigneaultKristine DamonNovella DanielsRichard and KathyDavenportRobert and Rose DavenportJohn and Marion DavisKathleen DavisRoselyn Neri and Candace DayKerri DayMichael DayEileen DeanTimothy DeanJune DeBlasioJudith DeBloisCathleen DeCourcyFrances DeFranceRobert DegregorioPete and Tammy DelfinoWalter DelfinoMary DeLongchampsTony DePaulRichard and Eunice DemingRoy DempseyJohn DeneauJohn and Pat DeNuccioJim and Jayme DerderianPhilip D’ErcoleCheryl DeRobbioAnthony DeSefanisTracie DesjeanConsumer Lending ServicesJenny DesmarasCarol DesrosiersRosetta DesrosiersJames DevanneyCatherine DexterBrenda DibiaseTammie DickermanPamela DillonBertha DiPanniChristopher and Nellie DisanoHazel DoesschateJohn DolanMaureen DolanLouise DonaldsonEd DonnellyCharlie DonovanDavid DonthChris DoppkeDale DouthitLiliana D'OvidioJason DowdingAndrea DoyleMichael DoyleErnest DraperIan DrewPaul DriscollJo-Ann DrummAnthony DuboisGeorge and Gloria DugganAl DuhaineSusan DunnDawn DupuisJohn and Nancy D'UrsoEdward DutraPat DutsonFay DyerLori EarnshawPaul EarnshawRobert EaganEdgar EdwardsPatricia ElderkinPhil EldridgeLena ElliotTodd EmondCheryl EriksonPeter ErklanerPeter EthierAnthony and Geri EvangelistaJohn FaraoneJanet FarrellCindy FenchelCarol FerdinandJim FerraraPaul FerraraVeronica FerraroJ. FerreiraGeorge FidalgoMaryann Finamore-AllmarkMildred FinelliRoberta FittonMatthew FitzgeraldRachel FlaksmanMichael and Barbara FlanaganJames FlanaganSandra FletcherJames FochlerArthur FontaineWilliam FooksDonald ForsterJoe FournierStephen FourwierAnita FoyeEdward and Kathleen FracassaCheryl FrancesPeggy FrenzeJoan FullerPeter FullerLaurie FurneyNancy GagnePatrick GallagherRichard GalloneFran GallucciElizabeth GardnerJackie GaskellDale and Albert GaudetArnold GellerAl GemmaConnie GiansantiJohn GiarrussoMichael GilheanyDonna GillCarmine GinolfiJoan GoddardDorothy GodsoeJeff GoftenAndrew and Shiela GoldRobert GonzalesIrene and Sidney GoodmanDavid GoucherEdwin and Lawrence GouldEileen GouveiaJim GraceCarol GradyJoseph GrandeGeraldine GravinaPhilip and Anita <strong>Green</strong>bergEdward and Angela <strong>Green</strong>eRaymond and Marie <strong>Green</strong>eMyra <strong>Green</strong>eWilliam <strong>Green</strong>woodEd GreerPatricia GuadagniMikael GustafsonFrank and Jeanne HacketSteve HademStephen HadersJames HaganJane HakansonAida HallKeith and Tracy HallMary Ellen HallMichael and Kathy HallDennis and CecileHalvorsenTeresa HamelJudith HandyCatherine HanleyPaul HarlowRosemary and Richard HarrisonThomas HarrisonVirginia HarveyCharles HawkinsDorothy HaydenMelissa HaywoodCatherine HealeyCharles HenleyWilliam HeowDavid FieldMaryann HeywoodCharles and Sandy HicksDonna HicksKathryn HicksWilliam L. Hickey Jr.Rose HigginsThomas HigginsMaureen HobinKarl HoffmanDonna HoganFrank and Jullie HoganKenneth HoganMichael HogrundBill HooperLeo HortonAlice HourihanTimothy HoweDeb HowardKristen HowardRaymond HowardLincoln and Eleanor HubbardPaul HulingMarc HutchisonRussell HyllestedThomas IadevaiaJackie and Leslie IngallsBrian JacksonShirely JacksonMary JacobsRaleigh JenkinsBryan and Pam JenningsRober JensenJonathan and Judy JohnsonCharles and Janet JonesRichard JubinvilleKaren KalunianHarold KareliussenChristine KellyJessie KellyLoni KellyChapter 10 – Distribution List 10-7 July 2011\\Mawatr\ev\09228.00\reports\<strong>FEIS</strong>_Final_July_2011\<strong>PVD</strong>_CH10_Distribution_List_JUL_2011.doc
T.F. <strong>Green</strong> <strong>Airport</strong> <strong>Improvement</strong> <strong>Program</strong>Environmental Impact Statement and Final Section 4(f) EvaluationSheila KellyRobin KempAnn KenneySincla and Elaine KenneyAnn KenweyWilliam KenyonRobert KieronskiKaren KinderArlene KingmaJack KirbyRoger KlammerJohn KnightJohn KokotSam KoldykDonald KolyMichelle KomarLinda KrasnerNancy KrauseRichard KuehlViolet La FauciDonna LacourseWilliam LacrossMargie La GrantNorman LaliberteJohn LamantiaChristine LamoureuxHelen LamphereMary LanglaisRichard and Jo-Ann LangsethRichard LaniganDeborah LarsenFarrell and Donna LaydenMargaret LeardJill and Robert LeichtiJohn LenardSuzanne LerasseurAssunta LescourbeauKimberly LescourbeauPaul LetellierSuzanne & David LevasseurPaul LevesqueDon LewisMichael LillMaria LimaStephen LockeRobbin LombardoAnthony LongoLaurie LovgrenTerri LowreyRobert and Karin LucierConnie LukeArmand LusiJoan LutrarioJennifer LynchLinda LynchPeter MackayPatricia MahonPeter MahoneyCharles MahoneyPamela MajorNorma MalachowskiMatthew and Rebecca MalletteDorathy ManchesterColleen ManciniRobert ManciniEverett MarabianDeborah MaraoErnest and Diane MartinEdward MartinAngelo MarottiDaniel MarsoHarry MasseyD. MartinGina MartinJohn and Ethel MartinKern MartinLisa MartinPaula and Stephen MartiniRaymond MartinAnn MasseJenifer MasseVincent MatteraRalph and Lorie MattesonNancy and Robert MayerDonald Mc. KenzieMary McCabeMichael McCabeEugene McCaffreyWilliam McCaffreyDorothy McCallMargaret McCannRichard and Carol McCaskillRobin McCaugheyJerry McCroneBill McDonaldKevin McDonnellDavid McIntyreKevin McGovernJoan McGrawMark McKenneyDonald McKenzieJanice McLaughlinW. M. McLaughlinR. McNeillPeter MelimDeborah and Gerald MelloSusan and Myron MelloWilliam MeloneBenjamin MeltonNicholas MelucciThomas MercurioElaine and Evangelin MerollaAndrew MeschisenRoberta MeserveyWayne MichaelsPeter and WandaMichaelsonRobert MiduraJohn MihalosAmanda MilkovitsAlfred MillardMark and Wendy MillerDave MillsJames MinadeoGeorge and Jim MitchellScott MitchellMichael and Eleanor MoaklerDeborah MongeauGeraldine MonizDeborah MontanaroJames MontiMiles MooreDon MorashStephen and Rosemarie MorettiBeth MorettiDebra MorrisCarol MozzoriSue MulveyCarol MuratoreJ. MuratoreGerome and Christina MurielDan MurphyEdward MurphyH. MurphyJohn MurphyNed MurthaJoan MurtoughJill and Anthony MuscoJoanne and Terrance NadeauLinda NadeauBarbara NappaKlaus-D. and Michelle NaumannChristopher NealChris NealeJohn NegriHarold NelsonScott NerneyJudy NewtonRosalind NewtonDarcy NottellNancy and David NyeSheri OatesJohn O’BrienShawn O'BrienJames O'ConnellRaymond O'ConnellJohn O'ConnorEdward and Nellie O'LearyRichard O’LearyJames and Jeannette OlsonBob O'NeillJohn O’NeillNick OneppoJoseph O'RourkeRandy and Jeanne OrrCindy OrulianisHarold OstrowskyJoan O'SullivanMarge OvallesKerri PachecoMichael PalgliariniBarbara PalumboDean and Sam PalumboBarbara PannoneAnthony PaolinoHenry PaolinoGerald PaquettePaul ParentJoseph and Debora ParenteauJoan PariseaultTheresa ParkerMary PatalanoDenise PatnoreElaine PearsonRobert PeasleyRichard & Annn PeloskyJudith PenaMarcia PenaBrian and Diane PendergastChristine Penkala-BerryDavid and Jennifer PenneyBruce PerreaultRobert PetersonSal PetrilliJames PettisAline PhelpsDavid PhelpsRichard PhillipsSteven PieroniMichelle PikeEsther and Pauline PintoGreg PizarroBruce PlaceJoyce PlebiscitoCatny PoirierTracy PoissonChapter 10 – Distribution List 10-8 July 2011\\Mawatr\ev\09228.00\reports\<strong>FEIS</strong>_Final_July_2011\<strong>PVD</strong>_CH10_Distribution_List_JUL_2011.doc
T.F. <strong>Green</strong> <strong>Airport</strong> <strong>Improvement</strong> <strong>Program</strong>Environmental Impact Statement and Final Section 4(f) EvaluationHenry PoitrasBarbara PollardBarbara and Kenneth PollockPatricia PollockCarolyn PooleCharles and Julia PorcaroLauren PorterRobert PowersRobert PowersTimothy and Lisa PowersHelen PrevityMarie PriscoCharlene & Julio PruencaAlbert and Deborah PuglieseDonna QuinlanJames QuinnDonna Quinn-BonisWilliam QuirkRaymond RaicheEverett RandallMelissa RayAngelo RazzinoKevin RedmondCarol ReidJosie ReidMaria RestrepoClaudette & Bob Rou-FishRichard and Patricia MungerM. RichardsMarilyn and WalterRichardsonTonya RickettsDoug RiggsWilliam RiggsJohn and Gail RigneyCorinne RileySteven-Christian RileyKaren RitchieKim RobertsonAlfred RobidaTherese RochonNoel RodriguezDonna RogersJohn RogowskiRick and Barbara RolandDaniel RosenbaumMichael RosenthalGlenn RossRonald RotondoJoyce RowanRichard and Henriette RoyRaymond and Christine RoyalAlyce RusiloskiWilliam RussoChristine Ryczek-MusitanoRobert SadlierCorey SaillantLisa SammartinoAnthony SantopietroDan SarroEd and Sue SavitskyStanley and BarbaraSchafferMary SchaffnerNicholas and Donna SchmaderChristopher and Erin SchmitzGeorge SchobelPaul and JoanSchoonmakerDonna SchultzRosemary SchultzClifford SchuntzCarolyn ScottFlorence ScottWalter and Thelma ScottJonathan and Susan SeamansRobert SebastianRobin ShackletonRandy ShatzAndrew SholesGeorge ShusterSusan SilvaMarlene SimesTom and Marie SimoneBruce SimpsonAlex and Joyce SinapiMike SistoAlexis SmithBob and Beth SmithChristine SmithCynthia SmithDonna SmithJames SmithJoan SmithJoseph SmithMark SmithRaymond SmithRichard & Janet SmithRichard SmithRoberta SmithLisa SoderlundR. SofiyaStephen SpatcherJames SpinaleBette SpinaleCarolyn and Richard SpinneyBette SpwaleMichael SquizzeroSuzanne St. JeanDiane St. PierreIrene StaffordKevin StaffordDavid SteinbrickCarolyn SternJerry and Carol SternKristen StewartChristine StinsonWilliam StockJohn StoneLorraine StoneJeffrey and Gail StrokerRonald StrunzCharlie and Judy SuarseDan SullivanJudith SunderlandBarbara SwannCarla SwansonChris SwansonRon SwansonChris and Donna SweetJudith SwiftRobert SwilbondBetty TannerKerri TavarozziAngela and Cornelius TaylorErin TaylorHelen TaylorKaren TaylorKim TaylorPeter and Marguerite TeheaultBetty TejadaKenneth TellaRay and Amy TellieraPeter TerreriLaura and Thomas ThacherJennifer ThayerReal Estate One LtdSuzzane ThibeadeauMichelle ThibeaultMichael and Janet ThomasDavid ThompsonHeidi and James ThompsonWill ThompsonRachelle TiceDonald TorresGeorge TownsendHolly TrahanLinda TraversieDonna TravisJanice TuckerTammy Turcotte-RaposoRobert andVivian TweedyPaul and Marcy TyrrellAlma UglialoroJohn UhochJeanne UnicentSusan UrsilloDomenic VaccaTroy VaccaSulma ValentineWilliam & Mary VallettaRobert VarinDavid and Joan VelanderCassandra VenusSheena Vidler-GivenEdward VientDerek VieraKim VigeantJohn VigliottiNicholas VillellaBarbara VotolatoJohn and Margaret WaddingtonLori WagnerPrecious Years Nursery School, Inc.Laura WahlRiley WaidJudith WallaceJeannine WarrenerEdward and Shirlay WashburnLynn WashingtonRichard Weedon Sr.Carol WeldonPaul WellsDeric WertzBrian WestJoseph WhalleyNicole WhalenLuke WhetstineJack WhiteMadeline WhiteMichael and Helen WilkickiHeon WilliamRobert WilliamChris and Linda WilliamsMary WilliamsRobert WilliamsThomas WilsonJean WittigIrvin WolfeDebra WoodworthKaileen and Melton WrathArthur YatskoBill YoungRobin YoungKaren YoungAnthony ZainyehChapter 10 – Distribution List 10-9 July 2011\\Mawatr\ev\09228.00\reports\<strong>FEIS</strong>_Final_July_2011\<strong>PVD</strong>_CH10_Distribution_List_JUL_2011.doc
T.F. <strong>Green</strong> <strong>Airport</strong> <strong>Improvement</strong> <strong>Program</strong>Environmental Impact Statement and Final Section 4(f) EvaluationHeidi and Joe ZalobowskiMark ZappeMichael ZarumNancy ZoglioMarianna ZotosPat ZotosFrank and Linda GrossiEric BanvilleJohn and Helen MadoianCranstonDavid AndewNeil AmperDavid BarsamianMichael BehmJohn BelloCarolyn BibeaultDick CaseyRev. Duane ClinkerPiers CurryJohn DeGenovaNathaniel DempseyRenee DesanlriersJim DoorleyMolly ElliotJoe FiliponeGerald FlynnJason FowlerPaul GibbsJohn GunsonVicky HollmannKaren JanickiMike KennedyIngrid KnappPaul LibbMike LittleJanice MathewsKen and Susan McDanielPaula McFarlandRaymond MountainFred ParsonsMia PatriarcaLouise PfanstiehzHope PilkingtonElizabeth RockBarbara RubinePeter ScottiDavid SteinbrickJonathon StevensSteven StycosFrancis TetreaultMick WingertThomas WojickOtherBill and Betty ArcherGerard BeauchameCaptain BreenNathan BrownTim ByrneVic CalabrettaMike CarreiroMarc ChampignySam ChasePaul ChoquetteKelly CoatesElaine ColarussoGeoff CookJohn CorriganKaren CrossJay CummingSeth DaleyRichard DelcarpiniGrant DulgariahCarol DutraBrian and Laura ElsonL. FariusPaul FournierAlisa GalloDavid GildenRobert GoffRobert HannonSteve HebdaTom HewesHD HooperMichael HubbardW. KellyColleen Kennedy-DanielsMarie KesselRobert LafondAlbert LeeBrian LemusLeigh LesleyTheodore LussierJim MacWilliamSusan MahlkeMina MakariousKathryn MandelDebra MannJoseph MardoFred MarxsonBeatrice McGeochValerie McKayF. McMackinValquiris MendoncaSteve MollicaVicki MorinColin O'SullivanJohn PartridgePreston PelkeyDavid PhelpsRichard PlotkinLynn PohlLeo RaptakisRonald & MaureenRicapitoMichael RogersonGail RubensteinJames RughJames SarafianLinda SchlossbergSherry SeniorVacha ShahBrian ShippeeJames SkeffingtonDouglas SmithAmanda SoaresSean SolleyJodie SutphenJ. William TouretNick UcciRobert VariNeil WalshWilliam WarburtonMike WatkinsChristopher WhirlowMichael WhiteTara WoodsNewspapersThe Block Island TimesEast Bay NewspapersThe CallThe Chariho TimesCranston HeraldJamestown PressKent County Daily TimesNewport Daily NewsNorth East IndependentPawtucket TimesThe East <strong>Green</strong>wichPendulumProvidence PhoenixProvidence Business NewsThe Providence JournalProvidence MonthlyThe ResidentRhode Island CatholicSakonnet TimesSouth County IndependentThe Standard TimesThe Valley BreezeWarwick BeaconSun PublishingChapter 10 – Distribution List 10-10 July 2011\\Mawatr\ev\09228.00\reports\<strong>FEIS</strong>_Final_July_2011\<strong>PVD</strong>_CH10_Distribution_List_JUL_2011.doc
T.F. <strong>Green</strong> <strong>Airport</strong> <strong>Improvement</strong> <strong>Program</strong>Environmental Impact Statement and Final Section 4(f) Evaluation11References2000 United States Census data, (www.census.gov/main/www/cen2000.html), 2000.2007-2008 Annual Deicing Management Plan for T.F. <strong>Green</strong> <strong>Airport</strong>, National Environmental Policy Act Regulations,Rhode Island <strong>Airport</strong> Corporation, October 2007.737 Airplane Characteristics for <strong>Airport</strong> Planning, D6-58325-6, Boeing Commercial Airplanes, October 2005.757-200/300 Airplane Characteristics for <strong>Airport</strong> Planning, D6-58327, Boeing Commercial Airplanes,August 2002.Airline Deregulation Act of 1978, October 24, 1978.Airline Origin and Destination Survey (DB1B): Market, Bureau of Transportation Statistics, 2010 and 2011.<strong>Airport</strong> Noise Compatibility Planning, 14 CFR Part 150, Final Rule, September 24, 2004.Air Quality Monitoring Work Plan for T.F. <strong>Green</strong> <strong>Airport</strong>, Prepared in Support of the State of Rhode Island Permanent Air Quality Monitoring Act, Rhode Island <strong>Airport</strong> Corporation, October 29, 2007.Air Quality Procedures for Civilian <strong>Airport</strong>s & Air Force Bases, AEE-120. U.S. Department of Transportation,Federal Aviation Administration, Office of Environment and Energy. Report Number FAA-AEE-97-03.Washington, DC. April 1997.<strong>Airport</strong> Development Reference Manual, 9 th Edition, IATA, Montreal, Canada, January 2004.<strong>Airport</strong> Streamlining Approval Process Act of 2002, The U.S. House Committee on Transportation andInfrastructure, May 17, 2002.Apponaug Village Master Plan, Apponaug Area <strong>Improvement</strong> Association and the City of Warwick, prepared by The Cecil Group, Inc. and Edwards and Kelcey, October 2004.Appropriate Use of Mitigation and Monitoring and Clarifying the Appropriate Use of Mitigated Findings of NoSignificant Impact, Council on Environmental Quality, January 14, 2011.Chapter 11 - References 11-1 July 2011\\mawatr\ev\09228.00\reports\<strong>FEIS</strong>_Final_July_2011\<strong>PVD</strong>_CH11_References_JUL_2011.doc
T.F. <strong>Green</strong> <strong>Airport</strong> <strong>Improvement</strong> <strong>Program</strong>Environmental Impact Statement and Final Section 4(f) EvaluationAsbestos Hazard Emergency Response Act of 1986, U.S. Department of Labor, Occupational Safety & HealthAdministration.ASTM E 1527 Standard Practice for Environmental Site Assessments, American Society for Testing and Materials,July 2000.Aviation’s Effects on the Global Atmosphere Are Potentially Significant and Expected to Grow, IPCC Report asreferenced in U.S. General Accounting Office (GAO) Environment: GAO/RCED-00-57, February 2000.Buckeye Brook Biodiversity Impairment Data Report 2008, Rhode Island Department of EnvironmentalManagement, April 2009.Buckeye Brook Habitat <strong>Improvement</strong>/Restoration <strong>Program</strong>, Natural Resource Services, Inc., December 3, 2004.City of Cranston Rhode Island Comprehensive Plan, Cranston Planning Department, February 1992, last amendedin September 7, 2005.Clean Air Act Amendments of 1990.Community Involvement Policy Statement, FAA, April 17, 1995.Comprehensive Plan of the City of Warwick, Historic Element, City of Warwick, 2002, from the City of Warwick website, accessed January 30, 2006.Definition of Waters of the United States, 33 CFR Part 328, U.S. Corps of Engineers, November 13, 1986.Demographic Detail Summary Report for the Year 2004, DemographicsNow.com, 2005.Documentation for Aircraft, Commercial Marine Vessel, Locomotive, and other Non-road Components of the NationalEmissions Inventory, U.S. Environmental Protection Agency, November 2002.Draft NEPA Guidance on Consideration of the Effects of Climate Change and <strong>Green</strong>house Gas Emissions, Council on Environmental Quality, February 18, 2010.Draft Request for Aeronautical Study for T.F. <strong>Green</strong> <strong>Airport</strong>, Edwards and Kelcey, August 15, 2005.Drainage Master Plan for T.F. <strong>Green</strong> <strong>Airport</strong>, Gresham Smith and Partners in Association with Vanasse Hangen Brustlin, Inc., August 2008.EDR DataMap Area Study, T.F. <strong>Green</strong> <strong>Airport</strong>, Warwick, RI. Environmental Data Resources, Inc., July 26, 2005.Emergency Response Activities. BETA Consulting Engineers, Scientists and Planners, December 2001.Emissions and Dispersion Modeling System User’s Manual with Supplements, Federal Aviation Administration,EDMS Version 5.1.2, September 2009.Endangered Species Act of 1973, U.S. Fish and Wildlife Service, Section 7.Chapter 11 - References 11-2 July 2011\\mawatr\ev\09228.00\reports\<strong>FEIS</strong>_Final_July_2011\<strong>PVD</strong>_CH11_References_JUL_2011.doc
T.F. <strong>Green</strong> <strong>Airport</strong> <strong>Improvement</strong> <strong>Program</strong>Environmental Impact Statement and Final Section 4(f) EvaluationEnergy Efficiency and Renewable Energy: State Activities and Partnerships: Rhode Island. U.S. Department of Energy.Final Environmental Assessment for the Warwick Intermodal Station at T.F. <strong>Green</strong> <strong>Airport</strong>, Rhode IslandDepartment of Transportation May 1999.Environmental Criteria and Standards of the Department of Housing and Urban Development, U.S. Department ofHousing and Urban Development, 24 CFR Part 51; 44 Federal Register 40861, Washington, DC, July 12, 1979.Environmental Desk Reference for <strong>Airport</strong> Actions, U.S. Department of Transportation, Federal AviationAdministration, October 5, 2007.Environmental Justice: Guidance under the National Environmental Policy Act, Council on Environmental Quality,December 10, 1997.European Civil Aviation Conference (ECAC) Document 29, 3rd Edition, July 2005.Executive Order 11988, Floodplain Management, Federal Register, May 24, 1977.Executive Order 11990, Protection of Wetlands, 42 Federal Register 26961, May 24, 1977.Executive Order 12372, Intergovernmental Review of Federal <strong>Program</strong>s, Federal Register, July 14, 1982.Executive Order 12898, Federal Actions To Address Environmental Justice in Minority Populations and Low-IncomePopulations, Federal Register, February 16, 1994.Executive Order 13123, <strong>Green</strong>ing the Government through Efficient Energy Management, Federal Register, June 8, 1999.Federal Agency Review of Selected <strong>Airport</strong> Noise Analysis Issues, Federal Interagency Committee on Noise, Washington, DC, August 1992.Federal Aviation Regulations Part 150 Noise Compatibility Study Update, Landrum & Brown, Inc., August 1999.Federal Aviation Regulations Part 150 Noise Exposure Map Update, T.F. <strong>Green</strong> <strong>Airport</strong>, Harris Miller Miller &Hanson, Inc., July 2010.Federal Aviation Administration Advisory Circular 150/5070-6B, <strong>Airport</strong> Master Plans, Change 1, U.S. Departmentof Transportation, Federal Aviation Administration, May 1, 2007.Federal Aviation Administration Advisory Circular 150/5200-33a, Hazardous Wildlife Attractants on or Near<strong>Airport</strong>s, U.S. Department of Transportation, Federal Aviation Administration, August 28, 2007.Federal Aviation Administration Advisory Circular 150/5300-13, Change 15, <strong>Airport</strong> Design, U.S. Department ofTransportation, Federal Aviation Administration, September 29, 2006.Federal Aviation Administration Advisory Circular 150/5325-4B, Runway Length Requirements for <strong>Airport</strong> Design,U.S. Department of Transportation, Federal Aviation Administration, July 1, 2005.Chapter 11 - References 11-3 July 2011\\mawatr\ev\09228.00\reports\<strong>FEIS</strong>_Final_July_2011\<strong>PVD</strong>_CH11_References_JUL_2011.doc
T.F. <strong>Green</strong> <strong>Airport</strong> <strong>Improvement</strong> <strong>Program</strong>Environmental Impact Statement and Final Section 4(f) EvaluationFederal Aviation Administration Advisory Circular 150/5370-10, Standards for Specifying Construction of <strong>Airport</strong>s,U.S. Department of Transportation, Federal Aviation Administration, September 30, 2009.Federal Aviation Administration Aerospace Forecast: Fiscal Years 2010-2030, U.S. Department of Transportation,Federal Aviation Administration, Aviation Policy and Plans, 2010.Federal Aviation Administration Order 1050.1E, Change 1, Environmental Impacts: Policies and Procedures, U.S.Department of Transportation, March 20, 2006.Federal Aviation Administration Order 5050.4B, National Environmental Policy Act (NEPA) ImplementingInstructions for <strong>Airport</strong> Actions, U.S. Department of Transportation, April 28, 2006.Federal Aviation Administration Order 5200.8, Runway Safety Area <strong>Program</strong>, U.S. Department of Transportation, October 1, 1999.Federal Aviation Administration Order 6850.2, Visual Guidance Lighting Systems, page 8.FAA Order JO 7210.3V Change 3 effective Facility Operation and Administration, Chapter 12, section 12-1-5, Categories of Operations, and Appendix 3, August 27, 2009.Fish and Wildlife Coordination Act, 16 USC sections 661-666e, July 9, 1965.Flood Insurance Rate Map, City of Warwick, Rhode Island, Community Panel Number 445409 0006 E, Federal Emergency Management Agency, Revised June 16, 1992.Floodplain Impacts: Regulatory Provisions Pertaining to Floodplains and Floodways, Rhode Island Department ofEnvironmental Management Office of Water Resources. November 16, 2007.Grasslands of Northeastern North America: Ecology and Conservation of Native and Agricultural Landscapes. Vickery, Peter D. and Dunwiddie, Peter W. Massachusetts Audubon Society, Lincoln, MA. 1997.<strong>Green</strong>wich Bay Special Area Management Plan, Rhode Island Coastal Resources Management Council,www.crmc.state.ri.us/regulations/SAMP_<strong>Green</strong>wichBay.pdf, May 10, 2005.A Guide to Cycling in the Ocean State, Rhode Island Department of Transportation, 2009-2010.Guidebook on Preparing <strong>Airport</strong> <strong>Green</strong>house Gas Emissions Inventories, Transportation Research Board, <strong>Airport</strong>Cooperative Research Panel, ACRP Report 11. 2009.Guidelines for Evaluating and Documenting Historic Aviation Properties, Federal Highway AdministrationMemorandum, Cynthia J. Burbank. December 13, 2005.Habitat Suitability of Buckeye Brook for River Herring at T. F. <strong>Green</strong> <strong>Airport</strong>, Warwick, Rhode Island, NaturalResource Services, Inc., February 9, 2006.Highway Methodology Workbook Supplement, U.S. Army Corps of Engineers, New England District.September 1999.Chapter 11 - References 11-4 July 2011\\mawatr\ev\09228.00\reports\<strong>FEIS</strong>_Final_July_2011\<strong>PVD</strong>_CH11_References_JUL_2011.doc
T.F. <strong>Green</strong> <strong>Airport</strong> <strong>Improvement</strong> <strong>Program</strong>Environmental Impact Statement and Final Section 4(f) EvaluationIncorporating Biodiversity Considerations into Environmental Impact Analysis under the National Environmental PolicyAct. Washington, DC: U.S. Council on Environmental Quality, TIC: 241456, 1993.Land Use 2025: Rhode Island State Land Use Policies and Plan, State Guide Plan Element 121, Report Number109, Rhode Island Department of Administration Division of Planning Statewide Planning <strong>Program</strong>,April 2006.Living in the Shadow of Logan, Boston Globe, Johnston Chase, Katie, March 21, 2010.Logan International <strong>Airport</strong> Airside <strong>Improvement</strong>s Planning Project EIS, Boston, Massachusetts, U.S. Department ofTransportation, Federal Aviation Administration, New England Region, 2002.Management of Acquired Noise Land: Inventory – Reuse – Disposal, U.S. Department of Transportation, FederalAviation Administration, Federal Guidance Letter, 08-02, February 1, 2008 (Updated 3/26/2009).Manual on Uniform Traffic Control Devices, U.S. Department of Transportation, 2009 Edition.Map of the Prudence Island Complex Unit D02B, U.S. Fish and Wildlife Service, October 24, 1990, revised July 12, 1996.National Environmental Policy Act of 1969, as amended.The National Biennial RCRA Hazardous Waste Report, EPA.National Historic Preservation Act of 1966, Section 106. 36 CFR 800.16(l).Natural Heritage <strong>Program</strong>, Rhode Island Department of Environmental Management,(www.dem.ri.gov/programs/bpoladm/plandev/heritage/).New England Wildlife: Habitat, Natural History, and Distribution, DeGraff, Richard M. and Rudis, Deborah. Gen. Tech. Rep. NE-108. Broomall, PA: USDA, Forest Service, Northeast Forest Experiment Station; 1986.Part 139, Certification of <strong>Airport</strong>s, 14 CFR, Federal Aviation Administration, June 9, 2004.Passenger Air Service Development Techniques, <strong>Airport</strong> Cooperative Research <strong>Program</strong>, Report 18,Transportation Research Board, 2009.Procedures for Registration and Protection of Historic Properties, State of Rhode Island Historical Preservation andHeritage Commission, Rhode Island Historic Resource Archive. January 9, 2002.Questions and Answers About the NEPA Regulations, 48 CFR. 18026, March 23, 1981, as amended, 51 Fed Register15618, April 25, 1986.Record of Decision: Airside <strong>Improvement</strong>s Planning Project, Logan International <strong>Airport</strong>, Boston, Massachusetts;U.S. Department of Transportation, Federal Aviation Administration, New England Region, August 2, 2002.Regulations for Implementing the Provisions of the NEPA, 40 CFR parts 1500-1508, Council on EnvironmentalQuality.Chapter 11 - References 11-5 July 2011\\mawatr\ev\09228.00\reports\<strong>FEIS</strong>_Final_July_2011\<strong>PVD</strong>_CH11_References_JUL_2011.doc
T.F. <strong>Green</strong> <strong>Airport</strong> <strong>Improvement</strong> <strong>Program</strong>Environmental Impact Statement and Final Section 4(f) EvaluationRegulations Governing the Administration and Enforcement of the Freshwater Wetlands Act, Rhode IslandDepartment of Environmental Management, 2010)Revision to Guidance on Review and Approval of Aviation Forecasts, memorandum from the U.S. Department ofTransportation, Federal Aviation Administration, Director, <strong>Airport</strong> Planning and <strong>Program</strong>ming,December 23, 2004.Report to Congress, National Plan of Integrated <strong>Airport</strong> Systems (NPIAS) 2009-2013, U.S. Department ofTransportation, Federal Aviation Administration, September 30, 2008.Rhode Island <strong>Airport</strong> Economic Impact Study Update 2006, Rhode Island <strong>Airport</strong> Corporation, 2006.Rhode Island Department of Transportation Design Manual, Rhode Island Department of Transportation TrafficDesign Section, October 2004.Rhode Island Five Year Strategic Housing Plan: 2006-2010. Report Number 110, State Guide Plan Element 423, RhodeIsland Division of Planning. June 2006.Rhode Island General Laws 23-18-1 et. seq. (Rhode Island Burial Act).Rhode Island General Laws 42-45-1 et seq. (Rhode Island Historic Preservation Act).Rhode Island Stormwater Design & Installation Standards Manual, Rhode Island Department of EnvironmentalManagement, December 2010.Rhode Island’s Comprehensive Wildlife Conservation Strategy. Rhode Island Department of EnvironmentalManagement, Division of Fish and Wildlife, September 2005.Rhode Island Statewide Planning <strong>Program</strong> Press Release titled “$1 Million in Funding Awarded for Regional and LocalPlanning Initiatives”, 2009 (accessed at http://www.planning.ri.gov/misc/pcgawards.pdf on February 17, 2011).Rhode Island Water Quality Regulations, Rhode Island Department of Environmental Management. July 2006,Amended December 2010.Rules and Regulations Governing the Protection and Management of Freshwater Wetlands in the Vicinity of the Coast,Rhode Island Coastal Resources Management Council. Effective date January 28, 2011.Rules and Regulations Governing the Administration and Enforcement of the Freshwater Wetlands Act, Rhode IslandDepartment of Environmental Management, December 2010.SAE-AIR-5662, Method for Predicting Lateral Attenuation of Airplane Noise, 2006.Safe, Efficient Use, and Preservation of the Navigable Airspace, 14 CFR Part 77, July 21, 2010.Second Major <strong>Airport</strong> Study, Massachusetts Aeronautics Commission, 1990.Chapter 11 - References 11-6 July 2011\\mawatr\ev\09228.00\reports\<strong>FEIS</strong>_Final_July_2011\<strong>PVD</strong>_CH11_References_JUL_2011.doc
T.F. <strong>Green</strong> <strong>Airport</strong> <strong>Improvement</strong> <strong>Program</strong>Environmental Impact Statement and Final Section 4(f) EvaluationSection 6(f) of the Land and Water Conservation Fund Act of 1965, codified at 16 USC. Section 4601-8(f)(3)(Section 6[f]).Site Investigation Report, Former Truk-Away Landfill, Warwick Industrial Drive, Warwick, Rhode Island, EAEngineering, Science, and Technology, Inc., September 2008.Soil Survey of Rhode Island, Rector, Dean, U.S. Department of Agriculture, Natural Resource ConservationService, 1981.Spill Prevention, Control, and Countermeasure Plan for T.F. <strong>Green</strong> <strong>Airport</strong>, Fuss & O’Neill, Inc., Revision 3.0, Fuss& O’Neill, Inc., April 2004.Standards and Guidelines for Archaeology and Historic Preservation, National Park Service, 1983.State Guide Plan Guide: How to Prepare and Maintain A State Guide Plan Element, Rhode Island StatewidePlanning <strong>Program</strong>, September 2003.State of Rhode Island and Providence Plantations Transportation <strong>Improvement</strong> <strong>Program</strong> 2003-2004, Rhode IslandStatewide Planning <strong>Program</strong>, adopted August 8, 2002.State of Rhode Island Statewide Bicycle System 2010,www.dot.state.ri.us/img/content/bikeri/bikeplanfebruary2010.pdf.Statewide Historical Preservation Report, Rhode Island Historical Preservation and Heritage Commission,Report K-W-1, 1981.Transportation, Treasury, Housing and Urban Development, the Judiciary, the District of Columbia, and IndependentAgencies Appropriations Act, Public Law 109-155, November 30, 2005.Terminal Area Forecasts, U.S. Department of Transportation, Federal Aviation Administration, 2008, 2009, and 2010.T.F. <strong>Green</strong> <strong>Airport</strong> Area Economic Redevelopment Plan, Sasaki Associates, October 1996.T.F. <strong>Green</strong> <strong>Airport</strong> – Long Term Deicing Management and Treatment Plan, Gresham, Smith and Partners,August 2009.T.F. <strong>Green</strong> <strong>Airport</strong> – Monthly <strong>Airport</strong> Passenger Activity Summary, Rhode Island <strong>Airport</strong> Corporation,December 2004, December 2008, and December 2010.T.F. <strong>Green</strong> <strong>Airport</strong> Master Plan Update, Landrum & Brown, Inc., 2002.T.F. <strong>Green</strong> <strong>Airport</strong> Master Plan Supplement, Landrum & Brown, Inc., 2004The New England Regional <strong>Airport</strong> System Plan, (NERASP) New England <strong>Airport</strong> Coalition, Fall 2006.Chapter 11 - References 11-7 July 2011\\mawatr\ev\09228.00\reports\<strong>FEIS</strong>_Final_July_2011\<strong>PVD</strong>_CH11_References_JUL_2011.doc
T.F. <strong>Green</strong> <strong>Airport</strong> <strong>Improvement</strong> <strong>Program</strong>Environmental Impact Statement and Final Section 4(f) EvaluationToxicity Test Results from Buckeye Brook Study Summer 2008, Memorandum, U.S. Environmental ProtectionAgency, October 2008.Understanding and Using Forecasts, forward to Passenger Forecasts for Logan International <strong>Airport</strong>, Richard deNeufville, April 20, 1991.Uniform Relocation Assistance and Real Property Acquisition Policies Act of 1970, 42 USC 4601 et seq.U.S. Department of Transportation Act of 1966, Section 4(f), 49 U.S.C., section 303(c).U.S. Department of Transportation, Federal Highway Administration, FHWA Section 4(f) Policy Paper,March 1, 2005.User’s Guide to MOBILE6.1 and MOBILE6.2, Mobile Source Emission Factor Model, Environmental Protection Agency, August 2003.Vegetation Management <strong>Program</strong>, Rhode Island <strong>Airport</strong> Corporation, Warwick, Rhode Island, Revised August 2004.Warwick Station Redevelopment District Master Plan, City of Warwick Planning Department and City of Warwick Department of Economic Development, July 1998.Wild and Scenic Rivers Act of 1968, 16 U.S.C. section 1271 et seq.Wildlife Hazard Management Plan, Rhode Island <strong>Airport</strong> Corporation. Revised April 27, 2009.Wildlife Strikes to Civilian Aircraft in the U.S., 1990-2007, Federal Aviation Administration, National WildlifeStrike Database, Serial Report Number 14, June 2008.Work Zone Safety and Mobility Plan, Rhode Island Department of Transportation, December 2008.Chapter 11 - References 11-8 July 2011\\mawatr\ev\09228.00\reports\<strong>FEIS</strong>_Final_July_2011\<strong>PVD</strong>_CH11_References_JUL_2011.doc
T.F. <strong>Green</strong> <strong>Airport</strong> <strong>Improvement</strong> <strong>Program</strong>Environmental Impact Statement and Final Section 4(f) EvaluationIndexAffordable housing ........................ 4-19, 4-24, 5-115Agency consultation (See Inter-Agency)Alewife ................................................................ 5-230Alternative B1 (defined) ..................................... 3-23Alternative B2 (defined) ........................... 3-18, 3-38Alternative B3 (defined) ..................................... 3-19Alternative B4 (defined) ........................... 3-23, 3-38Aircraft fleet mix ........................................ 2-25, 4-35Aircraft operations ..................... 1-2, 2-5, 2-23, 3-36,3-41, 3-48, 4-6, 4-35, 5-5, 5-88, 5-95Air Emissions Inventory4-37, 5-153Air quality .............................. 4-30, 5-148, 6-20, 6-47<strong>Airport</strong> <strong>Improvement</strong> <strong>Program</strong> ........................... 1-1<strong>Airport</strong> Road ........................... 3-11, 3-14, 3-32, 3-39,4-28, 4-85, 6-15, 7-13<strong>Airport</strong> Plaza ......................... 3-23, 3-43, 5-90, 5-205,5-239, 5-250Alternatives analysis ............................ 1-9, 3-1, 7-12Archaeological resources .............. 4-43, 5-171, 6-20,6-47, 8-9Area of Potential Effect .................... 4-43, 5-171, 8-9Best Management Practices ................. 5-202, 5-253,5-276, 6-33Bicycle transportation ...................................... 5-121Biodiversity ..................................... 4-61, 5-226, 6-37Birds ...................................... 4-54, 4-62, 5-203, 5-229Boston-Logan International <strong>Airport</strong> (Logan<strong>Airport</strong> ................................................... 2-1, 7-17Buckeye Brook (and watershed) ... 3-14, 3-18, 3-28,3-33, 4-53, 4-56, 5-194, 5-244, 6-28Bus, Intercity ........................................................ 4-30Bus, Regional and Local .......................... 4-30, 5-127Cargo ......................................... 2-31, 2-38, 3-21, 7-15Cargo noise ......................... 4-4, 4-10, 5-20, 5-45, 6-7Children’s Environmental Health and SafetyRisk ..................................... 4-17, 5-74, 6-18, 6-46Clean Air Act and Amendments of 1990 ....... 4-31,5-148, 8-13Clean Water Act, Section 404 .......... 5-190, 8-4, 8-14Climate change/<strong>Green</strong>house gases ....... 4-33, 5-150Coastal Zone Management ..................... 4-70, 5-251Coordination Group ............................. 4-44, 8-1, 8-5Confreda Farm ..................... 4-72, 5-175, 5-257, 6-52Construction costs ................... 3-22, 3-27, 3-34, 3-46Construction impacts – Air Quality .. 5-152, 5-157,5-163, 5-170Construction impacts – Businesses displaced 5-91,5-97Construction impacts – CompatibleLand Use .............................................. 5-49, 5-67Construction impacts – Coastal Resources.... 5-254Construction impacts - Energy Supply, NaturalResources, and Sustainable Design ......... 5-280Index I-1 July 2011\\mawatr\ev\09228.00\reports\<strong>FEIS</strong>_Final_July_2011\<strong>PVD</strong>_Index_JUL_2011.doc
T.F. <strong>Green</strong> <strong>Airport</strong> <strong>Improvement</strong> <strong>Program</strong>Environmental Impact Statement and Final Section 4(f) EvaluationConstruction impacts – Farmlands ................. 5-254Construction impacts – Fish, Wildlifeand Plants .................................. 5-234Construction impacts – Floodplains ............... 5-248Construction impacts – Hazardous Materials,Pollution Prevention, and Solid Waste ... 5-267Construction impacts – Historic, Architectural,Archaeological, and Cultural Resources . 5-179Construction impacts – Jobs displaced ... 5-91, 5-97Construction impacts – Jobs gained ................ 5-104Construction impacts – Light Emissions andVisual Impacts ............................................ 5-275Construction impacts – Noise ............................ 5-38Construction impacts – Other taxes ........ 5-91, 5-97Construction impacts – Property taxes ... 5-92, 5-98Construction impacts – Social and Socioeconomic,and Environmental Justice Populations andChildren’s Environmental Health and SafetyRisk ............................... 5-82, 5-102, 5-113, 5-116Construction impacts – Surface Transportation5-141Construction impacts – Water Quality .......... 5-211,5-220Construction impacts – Wetlands and Waterways5-193, 5-202 ...........................................................Construction phasing ........................................ 5-284Cranston................... 4-10, 4-17, 5-16, 6-49, 8-3, 8-13Cumulative impacts – Air Quality ...... 5-152, 5-167Cumulative impacts – Coastal Resources ...... 5-254Cumulative impacts – Compatible Land Use . 5-51,5-68Cumulative impacts - Energy Supply, NaturalResources, and Sustainable Design .......... 5-280Cumulative impacts – Farmlands .................. 5-256Cumulative impacts – Fish, Wildlife and Plants5-227, 5-235Cumulative impacts – Floodplains ..... 5-246, 5-248Cumulative impacts – Hazardous Materials,Pollution Prevention, and Solid Waste .. 5-263,5-267Cumulative impacts – Historic, Architectural,Archaeological, and Cultural Resources 5-179Cumulative impacts – Light Emissions and VisualImpacts ........................................................ 5-275Cumulative impacts – Noise ............................. 5-40Cumulative impacts – Social and Socioeconomic,and Environmental Justice Populations andChildren’s Environmental Health and SafetyRisk .............................................................. 5-102Cumulative impacts – Surface Transportation5-142Cumulative impacts – Threatened andEndangered Species .................................. 5-242Cumulative impacts – Water Quality . 5-211, 5-221Cumulative impacts – Wetlandsand Waterways .............................. 5-193, 5-202Deicer Management System ................ 5-213, 5-215,5-219, 5-222, 6-33Dispersion Modeling Analysis ............. 5-149, 5-152Economic benefits .................. 3-43, 5-76, 5-85, 5-106Economic impacts ...................3-33, 3-43, 5-76, 5-80,5-102, 5-107Emissions and Dispersion Modeling System . 3-36,4-35, 5-5, 5-151Eligible airport historic district ...... 3-45, 4-45, 4-49,5-174, 5-184, 6-21, 6-24, 6-47, 7-1, 7-3, 7-7, 7-12,7-15, 7-18, 8-10Engineered Materials Arresting System ......... 2-21,3-11, 3-24, 3-31, 3-38, 5-205, 5-239, 5-250Energy supply .......................................... 4-86, 5-276Environmental justice.. 4-17, 5-74, 5-109, 6-18, 6-46Environmentally Preferable Alternative .......... 3-2,3-38, 3-50Index I-2 July 2011\\mawatr\ev\09228.00\reports\<strong>FEIS</strong>_Final_July_2011\<strong>PVD</strong>_Index_JUL_2011.doc
T.F. <strong>Green</strong> <strong>Airport</strong> <strong>Improvement</strong> <strong>Program</strong>Environmental Impact Statement and Final Section 4(f) EvaluationErosion and sedimentation control ...... 5-202, 6-33,6-40Farmland Protection Policy Act ............. 4-71, 5-254Farmland soil ......................... 3-43, 4-71, 5-254, 6-38Federal Endangered Species ......... 4-67, 5-241, 6-37Fish ............ 3-33, 4-60, 5-225, 5-237, 6-26, 6-37, 6-51Flight tracks ......................................... 4-3, 5-15, 5-24Floodplain ........................................ 3-45, 4-67, 5-243Flood Insurance Rate Map ..................... 4-67, 5-243Forecast aviation activity ...................................... 2-4Fuel farm .......................................... 2-32, 2-38, 5-212General Conformity (Air Quality) ........ 4-34, 5-149,5-163, 5-165, 6-47Groundwater ................ 4-53, 4-57, 4-73, 4-78, 5-194,5-200, 5-210, 5-220, 5-244, 5-261Hangar No. 1 ........................... 1-5, 2-22, 4-45, 5-174,5-180, 6-23, 7-4, 7-8Hangar No. 2 ....................... 4-45, 4-83, 5-174, 5-184,6-47, 7-5, 7-8Hazardous air pollutants (HAPs) 4-33, 4-37, 5-170Hazardous material ............... 4-73, 5-259, 6-38, 6-52Health and safety .............................. 4-17, 5-74, 6-18Hispanic populations ..................... 4-18, 5-84, 5-109Historical properties ...... 4-43, 5-171, 6-22, 7-7, 7-12Historical resources ............... 3-45, 4-49, 5-171, 6-21Hydrology ...................................... 4-52, 5-191, 6-33Integrated Noise Model ......................... 1-7, 4-3, 6-6Inter-Agency/Tribal Coordination Group. 8-1, 8-5InterLink (Warwick Intermodal Station) ........... 1-3,2-7, 5-2, 5-120Invasive species ..................................... 5-198, 5-225Lakeshore Drive (flooding) .................. 4-69, 5-198,5-202, 5-249, 6-38, 6-51Land use compatibility ... 4-13, 5-46, 5-53, 6-6, 6-16Land acquisition ................................... 5-6, 5-51, 6-8Least Environmentally Damaging PracticableAlternative ........................................... 3-34, 8-15Level of Service (LOS).................... 4-28, 5-119, 6-19Light emissions ............................... 4-83, 5-269, 6-39Low-income populations ........ 4-25, 5-75, 6-18, 6-46Main Avenue ................ 3-12, 4-28, 5-118, 6-14, 6-19Memorandum of Agreement .............. 5-172, 5-209,7-18, 8-9Minority populations ............................... 4-18, 5-75Mitigation, Air quality .............................. 6-20, 6-47Mitigation, Compatible land use ...... 6-6, 6-16, 6-45Mitigation, Construction period .............. 6-39, 6-53Mitigation, Fish, Wildlife, and Plants ..... 6-37, 6-51Mitigation, Floodplains ............................. 6-37, 6-51Mitigation, Historic, Architectural, Archaelogical,and Cultural Resources ...................... 6-20, 6-47Mitigation, Noise ......................................... 6-5, 6-44Mitigation, Section 4(f) Resources .. 6-24, 6-47, 7-18Mitigation, Social and Socioeconomic, andEnvironmental Justice and Children’s Healthand Safety Risks ................................. 6-18, 6-46Mitigation, Surface Transportation ......... 6-19, 6-46Mitigation, Threatened and Endangered Species6-37, 6-51Mitigation, Water Quality ........................ 6-32, 6-50Mitigation, Wetlands and Waterways .... 6-25, 6-47Narragansett Indian Tribe ............ 3-46, 4-44, 5-172,7-18, 8-9National Ambient Air Quality Standards ...... 4-30,5-148Index I-3 July 2011\\mawatr\ev\09228.00\reports\<strong>FEIS</strong>_Final_July_2011\<strong>PVD</strong>_Index_JUL_2011.doc
T.F. <strong>Green</strong> <strong>Airport</strong> <strong>Improvement</strong> <strong>Program</strong>Environmental Impact Statement and Final Section 4(f) EvaluationNational Pollutant DischargeElimination System ................................... 5-208No-Action Alternative (defined) ............... 3-40, 5-2Noise ............................................. 4-2, 5-13, 6-5, 6-14Noise contours, No-Action Alternative 5-16, 5-52,5-65 ........................................................................Noise contours, Alternative B2 ...... 5-24, 5-46, 5-65,5-186 ......................................................................Noise contours, Alternative B4 ...... 5-30, 5-46, 5-66,5-188 ......................................................................Noise-sensitive receptors ............................ 4-3, 5-18Noise land reuse ................................. 5-9, 5-51, 6-17Noise Modeling .......................................... 4-3, 5-13Operations (See aircraft operations)Parking ........... 2-35, 4-30, 5-121, 5-124, 5-126, 5-132Part 150 Voluntary Land Acquisition<strong>Program</strong> ............................1-6, 4-5, 5-7, 6-8, 6-12Passengers ...................................... 1-2, 2-4 ,3-25, 6-7Permits .......................................... 5-118, 5-209, 8-13Population and housing counts ........ 4-7, 5-16, 5-84Post Road ................................ 3-11, 5-118, 6-19, 6-49Preferred Alternative ........................ 3-2, 3-38, 3-49Proposed Action .......................................... 3-2, 3-49Providence .................................................... 1-2, 4-27Public hearing ................................ 1-5, 5-63, 8-1, 8-3Property tax impacts ...... 5-76, 5-80, 5-85, 5-91, 5-98Public Involvement ............................................... 8-2Purpose and need ........................................ 2-1, 2-37Quonset ................................................................... 3-6Recreation areas and parks .......... 4-48, 4-50, 5-184,5-186, 5-189, 7-1Rhode Island Pollutant Discharge EliminationSystem .... 5-209, 5-213, 5-220, 5-260, 6-33, 8-14Runway length ................ 2-23, 2-38, 3-8, 3-11, 3-16,3-19, 3-30Rhode Island State <strong>Airport</strong> Terminal ............. 3-45,4-45, 4-49, 5-174, 5-176, 5-190, 6-24, 6-47, 7-4,7-8Runway 5-23 ....................... 3-11, 3-18, 5-206, 5-228,5-232, 5-240, 7-13Runway 16-34 ................. 5-205, 5-228, 5-231, 5-240,5-250, 7-13Runway 16-34 Runway Safety Area ....... 2-21, 2-37,3-11Safe Drinking Water Act .................................... 8-14Schools ..................... 4-8, 4-16, 4-26, 5-19, 5-80, 5-93,5-99, 6-10Scoping ........................... 1-5, 3-3, 4-4, 5-15, 5-41, 8-2Section 106 .... 3-46, 4-44, 5-171, 5-181, 6-21, 8-1, 8-9Section 4(f) ......................................... 4-48, 5-183, 7-1Section 6(f) ...................... 4-48, 4-51, 5-183, 7-1, 7-24Significant impacts .......................................... 5-282Social impacts ............................................. 5-78, 5-83Solid waste .................... 4-73, 4-82, 5-259, 6-38, 6-52Special Area Management Plan ............ 4-70, 5-209,5-251, 6-38Spill prevention control .......................... 4-82, 5-212Spring <strong>Green</strong> Pond and Inlet ........ 4-53, 4-62, 5-175,5-195, 5-202, 5-230, 6-30, 6-50State Implementation Plan ......... 4-36, 5-148, 5-153,5-165, 8-14Stormwater .............. 4-58, 4-83, 5-193, 5-198, 5-209,5-253, 6-32Stormwater Pollution Prevention Plan ......... 5-210,5-222, 5-253Supplemental noise metrics ..................... 4-12, 5-41Surface transportation ............................. 4-27, 5-118Surface water ............................................ 4-56, 5-208Sustainability ....................................................... 4-87Index I-4 July 2011\\mawatr\ev\09228.00\reports\<strong>FEIS</strong>_Final_July_2011\<strong>PVD</strong>_Index_JUL_2011.doc
T.F. <strong>Green</strong> <strong>Airport</strong> <strong>Improvement</strong> <strong>Program</strong>Environmental Impact Statement and Final Section 4(f) EvaluationTaxiway C ................................................... 2-22, 2-37Terminal ...................................................... 2-27, 2-37Terminal Area Forecast ........................ 1-7, 2-5, 5-5,Threatened species ....................... 4-61, 5-225, 5-241Traffic noise (vehicular) ................. 4-11, 5-20, 5-28,5-32, 5-36, 5-45 ......................................................Transportation Conformity (Air Quality) ..... 5-165,5-167Truk Away Landfill ............. 4-78, 5-264, 5-266, 6-32Warwick Historical Cemeteries ............ 4-46, 5-172,5-175, 5-178, 5-182, 6-24Water quality ............................................ 4-56, 5-208Waterways ................................................ 4-51, 5-190West Coast service ....................... 2-2, 2-8, 2-24, 3-7,3-21, 3-25, 3-29Wetlands ................................................... 4-51, 5-190Wild and Scenic River .......................................... 4-2Wildlife ...................... 4-54, 4-60, 5-194, 5-202, 5-225Warwick Station Redevelopment District ...... 5-52Winslow Park ................ 3-29, 4-51, 5-183, 6-2, 6-17,6-24, 6-47, 7-2, 7-6, 7-10, 7-17, 7-19, 7-26Index I-5 July 2011\\mawatr\ev\09228.00\reports\<strong>FEIS</strong>_Final_July_2011\<strong>PVD</strong>_Index_JUL_2011.doc
T.F. <strong>Green</strong> <strong>Airport</strong> <strong>Improvement</strong> <strong>Program</strong>Environmental Impact Statement and Final Section 4(f) EvaluationThis Page Intentionally Left BlankIndex I-6 July 2011\\mawatr\ev\09228.00\reports\<strong>FEIS</strong>_Final_July_2011\<strong>PVD</strong>_Index_JUL_2011.doc
This Page Intentionally Left Blank