USAA 2008 Report to Members: Stronger Together
USAA 2008 Report to Members: Stronger Together
USAA 2008 Report to Members: Stronger Together
- No tags were found...

You also want an ePaper? Increase the reach of your titles
YUMPU automatically turns print PDFs into web optimized ePapers that Google loves.
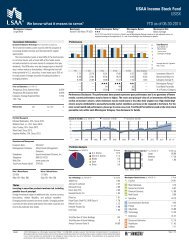
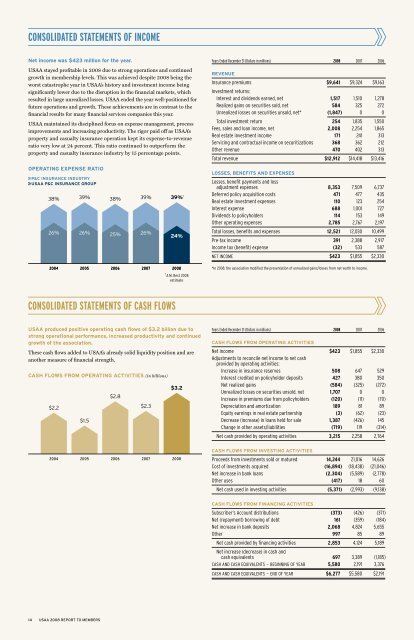
CONSOLIDATED STATEMENTS OF INCOMENet income was $423 million for the year.<strong>USAA</strong> stayed profitable in <strong>2008</strong> due <strong>to</strong> strong operations and continuedgrowth in membership levels. This was achieved despite <strong>2008</strong> being theworst catastrophe year in <strong>USAA</strong>’s his<strong>to</strong>ry and investment income beingsignificantly lower due <strong>to</strong> the disruption in the financial markets, whichresulted in large unrealized losses. <strong>USAA</strong> ended the year well-positioned forfuture operations and growth. These achievements are in contrast <strong>to</strong> thefinancial results for many financial services companies this year.<strong>USAA</strong> maintained its disciplined focus on expense management, processimprovements and increasing productivity. The rigor paid off as <strong>USAA</strong>’sproperty and casualty insurance operation kept its expense-<strong>to</strong>-revenueratio very low at 24 percent. This ratio continued <strong>to</strong> outperform theproperty and casualty insurance industry by 15 percentage points.Years Ended December 31 (Dollars in millions) <strong>2008</strong> 2007 2006RevenueInsurance premiums $9,641 $9,324 $9,163Investment returns:Interest and dividends earned, net 1,517 1,510 1,278Realized gains on securities sold, net 584 325 272Unrealized losses on securities unsold, net* (1,847) 0 0Total investment return 254 1,835 1,550Fees, sales and loan income, net 2,008 2,254 1,865Real estate investment income 171 241 313Servicing and contractual income on securitizations 368 362 212Other revenue 470 402 313Total revenue $12,912 $14,418 $13,416Operating expense ratioP&C insurance industry<strong>USAA</strong> P&C insurance group38%39%38%39%39% †Losses, Benefits and ExpensesLosses, benefit payments and lossadjustment expenses 8,353 7,509 6,737Deferred policy acquisition costs 471 477 435Real estate investment expenses 110 123 254Interest expense 688 1,001 727Dividends <strong>to</strong> policyholders 114 153 149Other operating expenses 2,785 2,767 2,19726%26%25%26%24%Total losses, benefits and expenses 12,521 12,030 10,499Pre-tax income 391 2,388 2,917Income tax (benefit) expense (32) 533 587Net income $423 $1,855 $2,3302004200520062007<strong>2008</strong>*In <strong>2008</strong>, the association modified the presentation of unrealized gains/losses from net worth <strong>to</strong> income.† A.M. Best <strong>2008</strong>estimateCONSOLIDATED STATEMENTS OF CASH FLOWS<strong>USAA</strong> produced positive operating cash flows of $3.2 billion due <strong>to</strong>strong operational performance, increased productivity and continuedgrowth of the association.These cash flows added <strong>to</strong> <strong>USAA</strong>’s already solid liquidity position and areanother measure of financial strength.Cash flows from operating activities (in billions)$2.2$1.5$2.8$2.3$3.2Years Ended December 31 (Dollars in millions) <strong>2008</strong> 2007 2006Cash Flows from Operating ActivitiesNet income $423 $1,855 $2,330Adjustments <strong>to</strong> reconcile net income <strong>to</strong> net cashprovided by operating activities:Increase in insurance reserves 508 647 529Interest credited on policyholder deposits 427 380 350Net realized gains (584) (325) (272)Unrealized losses on securities unsold, net 1,707 0 0Increase in premiums due from policyholders (120) (11) (70)Depreciation and amortization 189 81 89Equity earnings in real estate partnership (3) (62) (23)Decrease (increase) in loans held for sale 1,387 (426) 145Change in other assets/liabilities (719) 119 (314)Net cash provided by operating activities 3,215 2,258 2,764Cash Flows from Investing Activities2004200520062007<strong>2008</strong>Proceeds from investments sold or matured 14,244 21,016 14,626Cost of investments acquired (16,894) (18,438) (21,046)Net increase in bank loans (2,304) (5,589) (2,778)Other uses (417) 18 60Net cash used in investing activities (5,371) (2,993) (9,138)Cash Flows from Financing ActivitiesSubscriber’s Account distributions (373) (426) (371)Net (repayment) borrowing of debt 161 (359) (184)Net increase in bank deposits 2,068 4,824 5,655Other 997 85 89Net cash provided by financing activities 2,853 4,124 5,189Net increase (decrease) in cash andcash equivalents 697 3,389 (1,185)Cash and cash equivalents — Beginning of YEAR 5,580 2,191 3,376Cash and cash equivalents — End of YEAR $6,277 $5,580 $2,19114 <strong>USAA</strong> <strong>2008</strong> REPORT TO MEMBERS