- Page 2:
Managing Credit Risk inCorporate Bo
- Page 5 and 6:
THE FRANK J. FABOZZI SERIESFixed In
- Page 7 and 8:
Copyright © 2004 by Srichander Ram
- Page 9 and 10:
viCONTENTSPortfolio Management Styl
- Page 11 and 12:
viiiCONTENTSCHAPTER 9Risk Reporting
- Page 14 and 15:
ForewordSome of the greatest advanc
- Page 16 and 17:
PrefaceCurrently, credit risk is a
- Page 18 and 19:
CHAPTER 1IntroductionMOTIVATIONMost
- Page 20 and 21:
Introduction 3Chapter 3 provides a
- Page 22 and 23:
CHAPTER 2Mathematical Preliminaries
- Page 24 and 25:
Mathematical Preliminaries 7the dis
- Page 26 and 27:
Mathematical Preliminaries 9the sca
- Page 28 and 29:
Mathematical Preliminaries 11defaul
- Page 30 and 31:
Mathematical Preliminaries 13To pro
- Page 32 and 33:
Mathematical Preliminaries 15denote
- Page 34 and 35:
Mathematical Preliminaries 17The el
- Page 36 and 37:
Mathematical Preliminaries 19The ma
- Page 38 and 39:
Mathematical Preliminaries 21It imm
- Page 40 and 41:
CHAPTER 3The Corporate Bond MarketI
- Page 42 and 43:
The Corporate Bond Market 25of a ne
- Page 44 and 45:
The Corporate Bond Market 27longer
- Page 46 and 47:
The Corporate Bond Market 29that il
- Page 48 and 49:
The Corporate Bond Market 31regard
- Page 50 and 51:
The Corporate Bond Market 33policy
- Page 52 and 53:
The Corporate Bond Market 35Despite
- Page 54 and 55:
The Corporate Bond Market 37U.S. do
- Page 56 and 57:
The Corporate Bond Market 39EXHIBIT
- Page 58 and 59:
The Corporate Bond Market 41of dema
- Page 60 and 61:
The Corporate Bond Market 43specula
- Page 62 and 63:
The Corporate Bond Market 45The com
- Page 64 and 65:
The Corporate Bond Market 47The his
- Page 66 and 67:
The Corporate Bond Market 49Implica
- Page 68 and 69:
CHAPTER 4Modeling Market RiskIn bro
- Page 70 and 71:
Modeling Market Risk 53ConvexityFor
- Page 72 and 73:
Modeling Market Risk 55Risk measure
- Page 74 and 75:
Modeling Market Risk 57convexity ar
- Page 76 and 77:
Modeling Market Risk 59EXHIBIT 4.1P
- Page 78 and 79:
Modeling Market Risk 61OTHER SOURCE
- Page 80 and 81:
Modeling Market Risk 63The next tas
- Page 82 and 83:
Modeling Market Risk 65Note that fo
- Page 84 and 85:
CHAPTER 5Modeling Credit RiskCredit
- Page 86 and 87:
Modeling Credit Risk 69is intended
- Page 88 and 89:
Modeling Credit Risk 71I mentioned
- Page 90 and 91:
Modeling Credit Risk 73deviate from
- Page 92 and 93:
Modeling Credit Risk 75Captive Fina
- Page 94 and 95:
Modeling Credit Risk 77EXHIBIT 5.2
- Page 96 and 97:
79Aaa Aa1 Aa2 Aa3 A1 A2 A3 Baa1 Baa
- Page 98 and 99:
Modeling Credit Risk 81EXHIBIT 5.4N
- Page 100 and 101:
Modeling Credit Risk 83EXHIBIT 5.6T
- Page 102 and 103:
Modeling Credit Risk 85Taking expec
- Page 104 and 105:
Modeling Credit Risk 87Taking expec
- Page 106 and 107:
Modeling Credit Risk 89fall under c
- Page 108 and 109:
Modeling Credit Risk 91Deriving Exp
- Page 110 and 111:
Modeling Credit Risk 93corresponds
- Page 112 and 113:
CHAPTER 6Portfolio Credit RiskThe f
- Page 114 and 115: Portfolio Credit Risk 97given byUL
- Page 116 and 117: Portfolio Credit Risk 99Because the
- Page 118 and 119: Portfolio Credit Risk 101of their j
- Page 120 and 121: Portfolio Credit Risk 103EXHIBIT 6.
- Page 122 and 123: Portfolio Credit Risk 105Because th
- Page 124 and 125: Portfolio Credit Risk 107because hi
- Page 126 and 127: Portfolio Credit Risk 109model, ind
- Page 128 and 129: Portfolio Credit Risk 111Financial
- Page 130 and 131: 113Aaa Aa1 Aa2 Aa3 A1 A2 A3 Baa1 Ba
- Page 132 and 133: Portfolio Credit Risk 115equal to l
- Page 134 and 135: Aaa Aa1 Aa2 Aa3 A1 A2 A3 Baa1 Baa2
- Page 136 and 137: 119Issuer Nominal Dirty KMV’sS. N
- Page 138 and 139: Portfolio Credit Risk 121EXHIBIT 6.
- Page 140 and 141: CHAPTER 7Simulating the Loss Distri
- Page 142 and 143: Simulating the Loss Distribution 12
- Page 144 and 145: Simulating the Loss Distribution 12
- Page 146 and 147: Simulating the Loss Distribution 12
- Page 148 and 149: Simulating the Loss Distribution 13
- Page 150 and 151: Simulating the Loss Distribution 13
- Page 152 and 153: Simulating the Loss Distribution 13
- Page 154 and 155: Simulating the Loss Distribution 13
- Page 156 and 157: CHAPTER 8Relaxing the NormalDistrib
- Page 158 and 159: Relaxing the Normal Distribution As
- Page 160 and 161: Relaxing the Normal Distribution As
- Page 162 and 163: Relaxing the Normal Distribution As
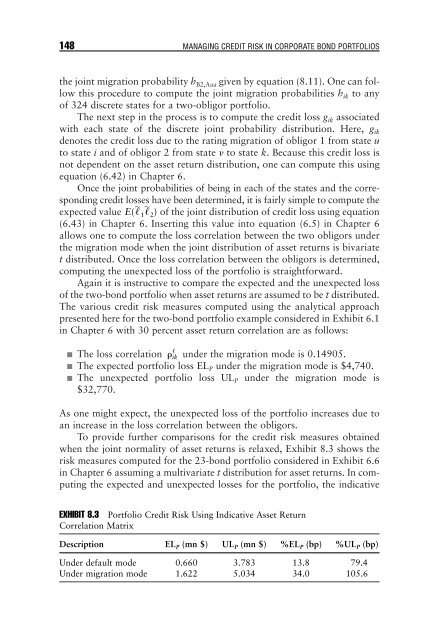
- Page 166 and 167: Relaxing the Normal Distribution As
- Page 168 and 169: Relaxing the Normal Distribution As
- Page 170 and 171: Relaxing the Normal Distribution As
- Page 172 and 173: CHAPTER 9Risk Reporting andPerforma
- Page 174 and 175: Risk Reporting and Performance Attr
- Page 176 and 177: Risk Reporting and Performance Attr
- Page 178 and 179: Risk Reporting and Performance Attr
- Page 180 and 181: Risk Reporting and Performance Attr
- Page 182 and 183: Risk Reporting and Performance Attr
- Page 184 and 185: Risk Reporting and Performance Attr
- Page 186 and 187: Risk Reporting and Performance Attr
- Page 188 and 189: Risk Reporting and Performance Attr
- Page 190 and 191: Risk Reporting and Performance Attr
- Page 192 and 193: Risk Reporting and Performance Attr
- Page 194 and 195: CHAPTER 10Portfolio OptimizationSo
- Page 196 and 197: Portfolio Optimization 179only the
- Page 198 and 199: Portfolio Optimization 181weights o
- Page 200 and 201: Portfolio Optimization 183has to re
- Page 202 and 203: Portfolio Optimization 185one wishe
- Page 204 and 205: Portfolio Optimization 187Finally,
- Page 206 and 207: Portfolio Optimization 189to each b
- Page 208 and 209: Portfolio Optimization 191the bench
- Page 210 and 211: Portfolio Optimization 193w i,Pw i,
- Page 212 and 213: Portfolio Optimization 195recommend
- Page 214 and 215:
Portfolio Optimization 197If corpor
- Page 216 and 217:
Portfolio Optimization 199DEVIL IN
- Page 218 and 219:
Portfolio Optimization 201EXHIBIT 1
- Page 220 and 221:
Portfolio Optimization 203rate vola
- Page 222 and 223:
Portfolio Optimization 205duration
- Page 224 and 225:
Structured Credit Products 207the e
- Page 226 and 227:
Structured Credit Products 209manag
- Page 228 and 229:
Structured Credit Products 211equit
- Page 230 and 231:
Structured Credit Products 213EXHIB
- Page 232 and 233:
Structured Credit Products 215EXHIB
- Page 234 and 235:
Structured Credit Products 217a giv
- Page 236 and 237:
Structured Credit Products 219fixed
- Page 238 and 239:
Structured Credit Products 221RATIN
- Page 240 and 241:
Structured Credit Products 223EXHIB
- Page 242 and 243:
Structured Credit Products 225CDO i
- Page 244 and 245:
Structured Credit Products 227the c
- Page 246 and 247:
Structured Credit Products 229and t
- Page 248 and 249:
Structured Credit Products 231Main
- Page 250 and 251:
Structured Credit Products 233Becau
- Page 252 and 253:
Structured Credit Products 235arriv
- Page 254 and 255:
Solutions to End-of-ChapterQuestion
- Page 256 and 257:
Solutions to End-of-Chapter Questio
- Page 258 and 259:
Solutions to End-of-Chapter Questio
- Page 260 and 261:
Solutions to End-of-Chapter Questio
- Page 262 and 263:
Solutions to End-of-Chapter Questio
- Page 264 and 265:
Solutions to End-of-Chapter Questio
- Page 266 and 267:
Solutions to End-of-Chapter Questio
- Page 268 and 269:
Solutions to End-of-Chapter Questio
- Page 270 and 271:
Solutions to End-of-Chapter Questio
- Page 272 and 273:
Solutions to End-of-Chapter Questio
- Page 274 and 275:
NotesCHAPTER 31. Euro-denominated c
- Page 276 and 277:
Notes 2592. For details, see Willia
- Page 278 and 279:
Notes 2617. For details, see Sten B
- Page 280 and 281:
Index 263Bid-ask spread, 27, 50decr
- Page 282 and 283:
Index 265contribution. See Marginal
- Page 284 and 285:
Index 267Funding requirements, 41Fu
- Page 286 and 287:
Index 269notation, 195product, 14-1
- Page 288 and 289:
Index 271quantification, 95-98quant
- Page 290 and 291:
Index 273Short-dated financial inst