1.0 - SATA-IO
1.0 - SATA-IO
1.0 - SATA-IO
- No tags were found...

You also want an ePaper? Increase the reach of your titles
YUMPU automatically turns print PDFs into web optimized ePapers that Google loves.
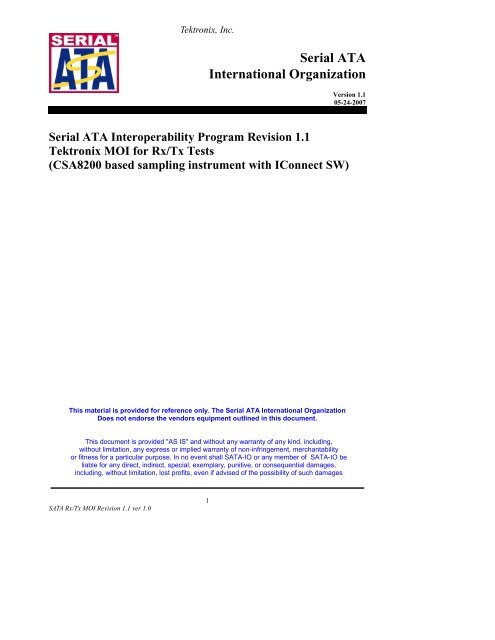
Tektronix, Inc.ACKNOWLEDGMENTSThe <strong>SATA</strong>-<strong>IO</strong> would like to acknowledge the efforts of the following individuals in the development of thistest suite.University of New Hampshire InterOperability Laboratory (UNH-<strong>IO</strong>L) – Creation of MOI templateAndy BaldmanDave WoolfTektronix, Inc. – Creation of this documentJohn CalvinMike MartinKees PropstraEugene Mayevskiy<strong>SATA</strong> Rx/Tx MOI Revision 1.1 ver <strong>1.0</strong>5
Tektronix, Inc.INTRODUCT<strong>IO</strong>NThe tests contained in this document are organized in order to simplify the identificationof information related to a test, and to facilitate in the actual testing process. Tests are separatedinto groups, primarily in order to reduce setup time in the lab environment, however the differentgroups typically also tend to focus on specific aspects of device functionality.The test definitions themselves are intended to provide a high-level description of themotivation, resources, procedures, and methodologies specific to each test. Formally, each testdescription contains the following sections:PurposeThis document outlines precise and specific procedures required to conduct <strong>SATA</strong> IW1.1 tests. This document covers the following tests which are all Tektronix CSA8200based.PHY TRANSMIT CHANNEL REQUIREMENTS (TX: 1-6)PHY RECIEVE CHANNEL REQUIREMENTS (RX: 1-6)Notes:Peeling Algorithm developed by Prof. Tripathi at Oregon State University which unlayers thevarious reflections in the TDR waveform and therefore shows the true values at each pointwithout the distortions caused by the reflections.Rx/Tx measurements for both Devices and Hosts will benefit from the accuracy introduced byobserving Peeling on the raw TDR response. For this reason this methodology will be applied toall Impedance related measurements in this MOI.<strong>SATA</strong> Rx/Tx MOI Revision 1.1 ver <strong>1.0</strong>6
Tektronix, Inc.Initial Measurement SetupBefore connecting the measurement cables and adaptors perform instrument’s warm-up and compensation accordingthe user manual.Connect four high quality (rated up to 18GHz) SMA cables to the four channels of 80E04 modules and performdeskew procedure for acquisition channels and TDR steps according to procedure described in Appendix B. Notethat TX measurements require the attenuators connected between the TDR heads of Ch3 and Ch3, and SMA cables.Connect appropriate <strong>SATA</strong> adaptor to the SMA channels The pair should match within 2ps.Connect the PUT according to the Figure 1.1. Ch1 and Ch2 are connected to the RX, while Ch3 and Ch4 areconnected to the TX pair. Set 4000 acquisition points in the “Horizontal” menu of the oscilloscope and 300 averagesin Acquisition menu.Ch1 Ch2 Ch3 Ch4<strong>SATA</strong> ProductUnder TestFigure 1.1. <strong>SATA</strong> product under test measurement setup. The drive under test (PUT) has to be powered up.The dashed line shows reference plane for the measurements.<strong>SATA</strong> Rx/Tx MOI Revision 1.1 ver <strong>1.0</strong>7
Tektronix, Inc.Test TX-01 - Pair Differential ImpedancePurpose: To verify that the Pair Differential Impedance of the PUT’s transmitter is within the conformance limits 1 .References:[1] <strong>SATA</strong> Standard, 7.2.1, Table 21 – Transmitter Specifications[2] Ibid, 7.2.2.2.1 – TX Pair Differential Impedance (Gen1i)[3] Ibid, 7.4.22 – TDR Differential Impedance (Gen1i)[4] <strong>SATA</strong> unified test document, 2.11.1Resource Requirements:See Appendix A.Last Template Modification: April 10, 2006 (Version <strong>1.0</strong>)Discussion:Reference [1] specifies the Transmitter Specification conformance limits for <strong>SATA</strong> devices. Thisspecification includes conformance limits for the Pair Differential Impedance. Reference [2] provides the definitionof this term for the purposes of <strong>SATA</strong> testing. Reference [3] defines the measurement requirements for this test.Test Setup:1. Matched length SMA cables have to be connected to the TDS/CSA8200 sampling oscilloscope; eachpair of the transmitter and receiver to one sampling module. The TDR signal amplitude should be lessthan 139mV peak-to-peak this can be achieved by introducing 6dB attenuators in the measurementpath, this will provide approximately 125mV peak-to-peak (single ended) TDR signal amplitude(delivered to PUT). In cases when the PUT does not support “disconnect” operation, the measurementsetup described in appendix D can be used.2. Each sampling module of the oscilloscope needs to be deskewed for acquisition using external sourcebefore connecting the fixtures. There is no need to deskew between the modules since themeasurements are done for the pairs within the modules. The sources deskew has to be performed inodd mode (source steps are of opposite polarity). The step signals should arrive at the PUT at the sametime. Both, acquisition and TDR deskew are to be performed at the SMA reference plane.3. Set 4000 acquisition points and 1ns/div in “Horizontal” menu and 300 averages in the “Acquisition”menu of TDS8200. Set math to a difference for TDR signals for each module, and filter this waveformto 40ps (10-90%) rise time.4. Power up the product under test (PUT), complete a full OOB sequence and broadcast a MFTP pattern.Test Procedure:1. This procedure should be applied to the worst case port (in a multi-port system/host) as determinedthrough the worst case port identification MOI.2. Acquire the differential open reference using IConnect “Acquisition” tool.3. Connect the fixtures with the PUT and acquire TDRdd.4. Filter open reference and TDRdd waveforms to 135ps (10-90%) rise time.1 The amplitude of external excitation applied shall not exceed -13.2dBm 50 ohms (139mVpp) singleended on each differential port of the transmitter. This number is derived from the maximum reflectedsignal that can be present at a transmitter.<strong>SATA</strong> Rx/Tx MOI Revision 1.1 ver <strong>1.0</strong>8
Tektronix, Inc.5. Use Z-line tool of IConnect to compute impedance profile. Set Zo equal to 100 Ohm and press the“Compute” Button. The resulting waveform will be displayed in the time domain viewer window.6. Enable IConnect’s cursors by right-clicking the computed Z-waveforms and selecting “CursorReadout” option. Using the cursors measure the impedance value at a point 2 ns past the bottom of thelast major capacitive excursion (i.e. dip) that is known to be inside the ASIC device (Figure 2.1).7. Record the results.Figure 2.1 Pair differential impedance measurements for transmitter (TX01). The impedance valuemeasured by the blue cursor is 87 Ohm.Observable Results:The Pair Differential Impedance minimum and maximum for the PUT TX port shall be between 85 and 115Ohms for Gen1i, products.The impedance measured at the time value of 2nSec past the bottom of the last major capacitive excursion(i.e. dip) that is known to be inside the ASIC device constitutes an informative result. See figure 2.1.Possible Problems:<strong>SATA</strong> Rx/Tx MOI Revision 1.1 ver <strong>1.0</strong>9
Tektronix, Inc.1. Data noise may cause impedance waveform to oscillate. This is resolved by selecting a higher“Threshold” number for Z-line computations.2. First incident step needs to be windowed out in the instrument’s window; otherwise the measurementwill not be accurate. The correct acquisition window settings are shown in Figure 2.2.3. When the transmitter does not support “disconnect” operation the test setup described in the AppendixD can be used.4. Some PUTs showed significant oscillations at the termination level of the TDR response due tointeractions with Tx pattern, they can be reduced by changing the internal clock of the TDR from 200kHzto 100kHz.Incorrect windowCorrect windowFigure 2.2 Correct acquisition window settings used in IConnect software to compute impedance profile andS-parameters. Left figure shows incorrect acquisition window; the first incident step is not windowed out,and the window itself is longer than required. The figure on the right shows the correct settings; firstincident step is windowed out, and all reflections are settled to a steady DC level.<strong>SATA</strong> Rx/Tx MOI Revision 1.1 ver <strong>1.0</strong>10
Tektronix, Inc.Figure 2.3. Single-ended impedance measurements using Z-line tool of IConnect (TX-02). Minimumimpedance for positive line is 49 Ohm, while for negative line the value is 42.4 Ohm.Observable Results:The Single-Ended Impedance for the PUT TX port shall be at least 40 ohms for Gen1i and Gen1m devicesrunning at 1.5Gb/s.Possible Problems:1. Data noise may cause impedance waveform to oscillate. This is resolved by selecting a higher“Threshold” number for Z-line computations.2. First incident step needs to be windowed out; otherwise the measurement will not be accurate. Thecorrect acquisition window settings are shown in Figure 2.2.3. When the transmitter does not support “disconnect” operation the test setup described in the AppendixD can be used.4. Some PUTs showed significant oscillations at the termination level of the TDR response due tointeractions with Tx pattern, they can be reduced by changing the internal clock of the TDR from200kHz to 100kHz.<strong>SATA</strong> Rx/Tx MOI Revision 1.1 ver <strong>1.0</strong>12
Tektronix, Inc.<strong>SATA</strong> Rx/Tx MOI Revision 1.1 ver <strong>1.0</strong>13
Tektronix, Inc.Test TX-03 - Differential Mode Return LossPurpose: To verify that the Differential Mode Return Loss of the PUT’s transmitter is within the conformancelimits.References:[1] <strong>SATA</strong> Standard, 7.2.1, Table 21 – Transmitter Specifications[2] Ibid, 7.2.2.2.3 – TX Differential Mode Return Loss (Gen2i)[3] Ibid, 7.4.10 – Return Loss and Impedance Balance[4] <strong>SATA</strong> unified test document, 2.11.3Resource Requirements:See Appendix A.Last Template Modification: April 10, 2006 (Version <strong>1.0</strong>)Discussion:Reference [1] specifies the Transmitter Specification conformance limits for <strong>SATA</strong> devices. Thisspecification includes conformance limits for the Differential Mode Return Loss. Reference [2] provides thedefinition of this term for the purposes of <strong>SATA</strong> testing. Reference [3] defines the measurement requirements forthis test.Test Setup:1. Matched length SMA cables have to be connected to the TDS/CSA8200 sampling oscilloscope; eachpair of the transmitter and receiver to one sampling module. The TDR single-ended signal amplitudeshould be less than 139mV peak-to-peak this can be achieved by introducing 6dB attenuators in themeasurement path, this will provide approximately 125mV peak-to-peak TDR signal amplitude. Incases when the PUT does not support “disconnect” operation, the measurement setup described inappendix D can be used.2. Each sampling module of the oscilloscope needs to be deskewed for acquisition using external sourcebefore connecting the fixtures. There is no need to deskew between the modules since themeasurements are done for the pairs within the modules. The sources deskew has to be performed inodd mode (source steps are of opposite polarity). The step signals should arrive at the PUT at the sametime. Both, acquisition and TDR deskew are to be performed at the SMA reference plane.3. Set 4000 acquisition points and 1ns/div in “Horizontal” menu and 300 averages in the “Acquisition”menu of TDS8200. Set math to a difference for TDR signals for each module. The instrument’s setupfrom TX-01 test can be reused (the waveforms were filtered to 40ps (10-90%) rise time).4. Power up the product under test (PUT), complete a full OOB sequence and broadcast a MFTP pattern.Test Procedure:1. This procedure should be applied to the worst case port (in a multi-port system/host) as determinedthrough the worst case port identification MOI.2. Acquire the differential open reference using IConnect “Acquisition” tool.3. Connect the PUT and acquire TDRdd waveform.4. Use S-parameter tool of IConnect to compute differential return loss (Sdd11) of the transmitter. Theresulting waveform will be displayed in the frequency domain viewer.5. Using cursors measure the maximum values for each frequency range given in reference [1].Differential return loss measurements are shown in Figure 2.4.6. Record the results.<strong>SATA</strong> Rx/Tx MOI Revision 1.1 ver <strong>1.0</strong>14
Tektronix, Inc.Figure 2.4. Differential return loss measurements for TX-03. Cursor 1 reads -7.42dB at 2.37GHz, and cursor2 reads -6.72dB at 3.97GHz.Observable Results:The TX Differential Mode Return Loss shall be above the minimum limits specified in reference [1] for Gen2iproducts. For convenience, the values are reproduced below.Frequency RangeLower Rloss Limit (Gen2i)150-300 MHz 14 dB300-600 MHz 8dB600-1200 MHz 6 dB1200-2400 MHz 6 dB2400-3000 MHz 3 dB3000-5000 MHz 1 dBPossible Problems:1. Inclusion of the first incident step in the measurement will results in erroneous S-parameters. The windowneeds to be adjusted according the Figure 2.2.<strong>SATA</strong> Rx/Tx MOI Revision 1.1 ver <strong>1.0</strong>15
Tektronix, Inc.Test TX-04 - Common Mode Return LossPurpose: To verify that the Common Mode Return Loss of the PUT’s transmitter is within the conformance limits.References:[1] <strong>SATA</strong> Standard, 7.2.1, Table 21 – Transmitter Specifications[2] Ibid, 7.2.2.2.4 – TX Common Mode Return Loss (Gen2i)[3] Ibid, 7.4.10 – Return Loss and Impedance Balance[4] <strong>SATA</strong> unified test document, 2.11.4Resource Requirements:See Appendix A.Last Template Modification: April 10, 2006 (Version <strong>1.0</strong>)Discussion:Reference [1] specifies the Transmitter Specification conformance limits for <strong>SATA</strong> devices. Thisspecification includes conformance limits for the Common Mode Return Loss. Reference [2] provides the definitionof this term for the purposes of <strong>SATA</strong> testing. Reference [3] defines the measurement requirements for this test.Test Setup:1. Matched length SMA cables have to be connected to the TDS/CSA8200 sampling oscilloscope; eachpair of the transmitter and receiver is connected to one sampling module. The TDR single ended signalamplitude should be less than 139mV peak-to-peak this can be achieved by introducing 6dBattenuators in the measurement path, this will provide approximately 125mV peak-to-peak TDR signalamplitude. In cases when the PUT does not support “disconnect” operation, the measurement setupdescribed in appendix D can be used.2. Each sampling module of the oscilloscope needs to be deskewed for acquisition using external sourcebefore connecting the fixtures. There is no need to deskew between the modules since themeasurements are done for the pairs within the modules. The sources deskew has to be performed ineven mode (source steps are of the same polarity). The step signals should arrive at the PUT at thesame time. Both, acquisition and TDR deskew are to be performed at the SMA reference plane.3. Set 4000 acquisition points and 1ns/div in “Horizontal” menu and 300 averages in the “Acquisition”menu of TDS8200. Set math function of the oscilloscope to the summation of signal sources and filterthe response to 40ps (10-90%) rise time.4. Power up the product under test (PUT), complete a full OOB sequence and broadcast a MFTP pattern.Test Procedure:1. This procedure should be applied to the worst case port (in a multi-port system/host) as determinedthrough the worst case port identification MOI.2. Acquire the open references for each TDR channel using IConnect “Acquisition” tool.3. Connect the PUT and acquire TDR waveform in even mode using IConnect “Acquisition” tool.4. Use S-parameter tool of IConnect to compute common mode S-parameters of the PUT (Scc11). Theresulting waveform will be displayed in the frequency domain viewer.5. Using cursors measure the maximum values for each frequency range given in reference [1].Differential return loss measurements are shown in Figure 2.5.6. Record the results.<strong>SATA</strong> Rx/Tx MOI Revision 1.1 ver <strong>1.0</strong>17
Tektronix, Inc.Figure 2.5. Common mode return loss measurements for TX-04. Cursor 1 reads –3.4dB at 1.18GHzMHz, andcursor 2 reads -1.49dB at 3.08GHz.Observable Results:The TX Common Mode Return Loss shall be above the minimum limits specified in reference [1] forGen2i products. For convenience, the values are reproduced below.Frequency RangeLower Rloss Limit (Gen2i)150-300 MHz 8 dB300-600 MHz 5dB600-1200 MHz 2 dB1200-2400 MHz 1 dB2400-3000 MHz 1 dB<strong>SATA</strong> Rx/Tx MOI Revision 1.1 ver <strong>1.0</strong>18
Tektronix, Inc.3000-5000 MHz 1 dBPossible Problems:1. First incident step needs to be windowed out, otherwise the measurement will not be accurate. Thecorrect acquisition window settings are shown in Figure 2.2.2. When the transmitter does not support “disconnect” operation the test setup described in the AppendixD can be used.3. Some PUTs showed significant oscillations at the termination level of the TDR response due tointeractions with Tx pattern, they can be reduced by changing the internal clock of the TDR from200kHz to 100kHz.<strong>SATA</strong> Rx/Tx MOI Revision 1.1 ver <strong>1.0</strong>19
Tektronix, Inc.Test TX-05 - Impedance BalancePurpose: To verify that the Impedance Balance of the PUT’s transmitter is within the conformance limits.References:[1] <strong>SATA</strong> Standard, 7.2.1, Table 21 – Transmitter Specifications[2] Ibid, 7.2.2.2.5 – TX Impedance Balance (Gen2i)[3] Ibid, 7.4.10 – Return Loss and Impedance Balance[4] <strong>SATA</strong> unified test document, 2.11.5Resource Requirements:See Appendix A.Last Template Modification: April 10, 2006 (Version <strong>1.0</strong>)Discussion:Reference [1] specifies the Transmitter Specification conformance limits for <strong>SATA</strong> devices. Thisspecification includes conformance limits for the TX Impedance Balance. Reference [2] provides the definition ofthis term for the purposes of <strong>SATA</strong> testing. Reference [3] defines the measurement requirements for this test.Test Setup:1. Matched length SMA cables have to be connected to the TDS/CSA8200 sampling oscilloscope; eachpair of the transmitter and receiver is connected to one sampling module The TDR single ended signalamplitude should be less than 139mV peak-to-peak. This can be achieved by introducing 6dBattenuators in the measurement path, this will provide approximately 125mV peak-to-peak TDR signalamplitude. In cases when the PUT does not support “disconnect” operation, the measurement setupdescribed in appendix D can be used.2. Each sampling module of the oscilloscope needs to be deskewed for acquisition external signal sourcebefore connecting the fixtures. There is no need to deskew between the modules since themeasurements are done for the pairs within the modules. The deskew is to be performed in even mode:both sources are positive, and the step signals should arrive at the PUT and the same time. Theinstrument’s setup can be saved to a file.3. Set 4000 acquisition points and 1ns/div in “Horizontal” menu and 300 averages in the “Acquisition”menu of TDS8200. Set math 1 function to the sum of the acquired TDR channels, and acquire openreference waveform at the SMA interface. Set math 2 function the difference of the acquired TDRchannels and filter the response to 40ps (10-90%) rise time.4. Power up the product under test (PUT), complete a full OOB sequence and broadcast a MFTP pattern.Test Procedure:1. This procedure should be applied to the worst case port (in a multi-port system/host) as determinedthrough the worst case port identification MOI.2. Load the open reference for even mode (math 1 function) using IConnect “Acquisition” tool.3. Connect the fixtures and the PUT then acquire math 2 waveform (difference of the acquired TDRsignals) using IConnect “Acquisition” tool.4. Use S-parameter tool of IConnect to compute differential-to-common conversion (Sdc11) of the PUT.The resulting waveform will be displayed in the frequency domain viewer.5. Using cursors measure the maximum values for each frequency range given in reference [1].Impedance balance measurements are shown in Figure 2.6.6. Record the results.<strong>SATA</strong> Rx/Tx MOI Revision 1.1 ver <strong>1.0</strong>20
Tektronix, Inc.Figure 2.6. Impedance balance loss measurements for TX-05. Cursor 1 reads –20.4dB at 798MHz, and cursor2 reads -21.2dB at 4.28GHz.Observable Results:The TX Impedance Balance shall be above the minimum limits specified in reference [1] for Gen2iproducts. For convenience, the values are reproduced below.Frequency RangeLower Rloss Limit (Gen2i)150-300 MHz 30 dB300-600 MHz 20dB600-1200 MHz 10 dB1200-2400 MHz 10 dB2400-3000 MHz 4 dB3000-5000 MHz 4 dBPossible Problems:1. First incident step needs to be windowed out, otherwise the measurement will not be accurate. Thecorrect acquisition window settings are shown in Figure 2.22. When the transmitter does not support “disconnect” operation the test setup described in the AppendixD can be used.<strong>SATA</strong> Rx/Tx MOI Revision 1.1 ver <strong>1.0</strong>21
Tektronix, Inc.3. Some PUTs showed significant oscillations at the termination level of the TDR response due tointeractions with Tx pattern, they can be reduced by changing the internal clock of the TDR from200kHz to 100kHz.<strong>SATA</strong> Rx/Tx MOI Revision 1.1 ver <strong>1.0</strong>22
Tektronix, Inc.Test TX-06 - Gen-1 Differential Mode Return LossPurpose: To verify that the Differential Mode Return Loss of the PUT’s transmitter is within the conformancelimits.References:[1] <strong>SATA</strong> Standard, 7.2.1, Table 21 – Transmitter Specifications[2] Ibid, 7.2.2.2.3 – TX Differential Mode Return Loss (Gen2i)[3] Ibid, 7.4.10 – Return Loss and Impedance Balance[4] <strong>SATA</strong> unified test document, 2.11.3[5] <strong>SATA</strong> ECN_21/22 – TX Differential Mode Return Loss (Gen1i)Resource Requirements:See Appendix A.Last Template Modification: April 10, 2006 (Version <strong>1.0</strong>)Discussion:Reference [1] specifies the Transmitter Specification conformance limits for <strong>SATA</strong> devices. Thisspecification includes conformance limits for the Differential Mode Return Loss. Reference [2] provides thedefinition of this term for the purposes of <strong>SATA</strong> testing. Reference [3] defines the measurement requirements forthis test.Test Setup:1. Matched length SMA cables have to be connected to the TDS/CSA8200 sampling oscilloscope; eachpair of the transmitter and receiver to one sampling module. The TDR single-ened signal amplitudeshould be less than 139mV peak-to-peak this can be achieved by introducing 6dB attenuators in themeasurement path, this will provide approximately 125mV peak-to-peak TDR signal amplitude. Incases when the PUT does not support “disconnect” operation, the measurement setup described inappendix D can be used.2. Each sampling module of the oscilloscope needs to be deskewed for acquisition using external sourcebefore connecting the fixtures. There is no need to deskew between the modules since themeasurements are done for the pairs within the modules. The sources deskew has to be performed inodd mode (source steps are of the opposite polarity). The step signals should arrive at the PUT at thesame time. Both, acquisition and TDR deskew are to be performed at the SMA reference plane3. Set 4000 acquisition points and 1ns/div in “Horizontal” menu and 300 averages in the “Acquisition”menu of TDS8200. Set math to a difference for TDR signals for each module. The instrument’s setupfrom TX-01 test can be reused (the rise time is filtered to 40ps (10-90%) rise time).4. Power up the product under test (PUT), complete a full OOB sequence and broadcast a MFTP pattern.Test Procedure:1. This procedure should be applied to the worst case port (in a multi-port system/host) as determinedthrough the worst case port identification MOI.2. Acquire the differential open reference using IConnect “Acquisition” tool.3. Connect the PUT and acquire TDRdd waveform.4. Use S-parameter tool of IConnect to compute differential return loss (Sdd11) of the transmitter. Theresulting waveform will be displayed in the frequency domain viewer.5. Using cursors measure the maximum values for each frequency range given in reference [1].Differential return loss measurements are shown in Figure 2.4.6. Record the results.<strong>SATA</strong> Rx/Tx MOI Revision 1.1 ver <strong>1.0</strong>23
Tektronix, Inc.Figure 2.7 Differential return loss measurements for TX-06.Observable Results:The TX Differential Mode Return Loss shall be above the minimum limits specified in reference [5,9] for Gen1iproducts.Frequency Range Lower Rloss Limit(Gen1i)75-150MHz14 dB150-300 MHz 8dB300-600 MHz 6 dB600-1200 MHz 6 dB1200-2400 MHz 3 dB2400-3000 MHz 1 dBPossible Problems:1. Inclusion of the first incident step in the measurement will results in erroneous S-parameters. The windowneeds to be adjusted according the Figure 2.2.<strong>SATA</strong> Rx/Tx MOI Revision 1.1 ver <strong>1.0</strong>24
Tektronix, Inc.2. When the transmitter does not support “disconnect” operation the test setup described in the Appendix D canbe used.3. Some PUTs showed significant oscillations at the termination level of the TDR response due to interactionswith Tx pattern, they can be reduced by changing the internal clock of the TDR from 200kHz to 100kHz.<strong>SATA</strong> Rx/Tx MOI Revision 1.1 ver <strong>1.0</strong>25
Tektronix, Inc.PHY RECIEVE CHANNEL REQUIREMENTS (RX: 1-6)Overview:This group of tests verifies the Phy Receiver Requirements, as defined in Section 2.15 ofthe <strong>SATA</strong> Interoperability Unified Test Document, v1.1 (which references the <strong>SATA</strong> Standard,v2.5).<strong>SATA</strong> Rx/Tx MOI Revision 1.1 ver <strong>1.0</strong>26
Tektronix, Inc.Test RX-01 - Pair Differential ImpedancePurpose: To verify that the Pair Differential Impedance of the PUT’s receiver is within the conformance limits.References:[1] <strong>SATA</strong> Standard, 7.2.1, Table 23 – Receiver Specifications[2] Ibid, 7.2.2.4.1[3] Ibid, 7.4.22[4] <strong>SATA</strong> unified test document, 2.13.1Resource Requirements:See Appendix A.See Appendix C for measurement accuracy specifications.Last Template Modification: April 10, 2006 (Version <strong>1.0</strong>)Discussion:Reference [1] specifies the Transmitted Signal conformance limits for <strong>SATA</strong> devices. This specificationincludes conformance limits for the RX Pair Differential Impedance. Reference [2] provides the definition of thisterm for the purposes of <strong>SATA</strong> testing. Reference [3] defines the measurement requirements for this test.Test Setup:1. Matched length SMA cables have to be connected to the TDS/CSA8200 sampling oscilloscope; eachpair of the transmitter and receiver to one sampling module.2. The TDR signal amplitude should be less than 300mV peak-to-peak. This can be achieved byintroducing 6dB attenuators in the measurement path, this will provide approximately 125mV peak-topeak(single ended) TDR signal amplitude3. Each sampling module of the oscilloscope needs to be deskewed for acquisition using external sourcebefore connecting the fixtures. There is no need to deskew between the modules since themeasurements are done for the pairs within the modules. The sources deskew has to be performed inodd mode (source steps are of opposite polarity). The step signals should arrive at the PUT at the sametime. Both, acquisition and TDR deskew are to be performed at the SMA reference plane.4. Set 4000 acquisition points and 1ns/div in “Horizontal” menu and 300 averages in the “Acquisition”menu of TDS8200. Set math to a difference for TDR signals for each module, and filter this waveformto 40ps (10-90%) rise time.5. Power up the product under test (PUT) and complete a full OOB sequence.Comment: Is this a requirement? Justdo not recall this number. True for all Rxtests.Test Procedure:1. This procedure should be applied to the worst case port (in a multi-port system/host) as determinedthrough the worst case port identification MOI.2. Acquire the differential open reference using IConnect “Acquisition” tool.3. Connect the PUT and acquire TDRdd.4. Filter open reference and TDRdd waveforms to 135ps (10-90%) rise time.5. Use Z-line tool of IConnect to compute impedance profile. Set Zo equal to 100 Ohm and press on“Compute.” The resulting waveform will be displayed in the time domain viewer.6. Enable IConnect’s cursors by right-clicking the computed Z-waveforms and selecting “CursorReadout” option. Using the cursors measure the impedance value at a point 2 ns past the bottom of thelast major capacitive excursion (i.e. dip) that is known to be inside the ASIC device (Figure 4.1).7. Record the results.<strong>SATA</strong> Rx/Tx MOI Revision 1.1 ver <strong>1.0</strong>27
Tektronix, Inc.Figure 4.1 Pair differential impedance measurements for receiver (RX-01). Min impedance is 80.9 Ohm at1.14ns, and the impedance value 2ns away from the min is 99.5 Ohm.Observable Results:The RX Pair Differential Impedance shall be between 85 and 115 Ohms for 1.5Gb/s devices.Possible Problems:1. Data noise may cause impedance waveform to oscillate. This is resolved by selecting a higher“Threshold” number for Z-line computations.2. First incident step needs to be windowed out, otherwise the measurement will not be accurate. Thecorrect acquisition window settings are shown in Figure 2.2<strong>SATA</strong> Rx/Tx MOI Revision 1.1 ver <strong>1.0</strong>28
Tektronix, Inc.Test RX-02 - Single-Ended ImpedancePurpose: To verify that the Single-Ended Impedance of the PUT’s receiver is within the conformance limits.References:[1] <strong>SATA</strong> Standard, 7.2.1, Table 23 – Receiver Specifications[2] Ibid, 7.2.2.4.2[3] Ibid, 7.4.23[4] <strong>SATA</strong> unified test document, 2.13.2Resource Requirements:See Appendix A.See Appendix C for measurement accuracy specifications.Last Template Modification: April 10, 2006 (Version <strong>1.0</strong>)Discussion:Reference [1] specifies the Transmitted Signal conformance limits for <strong>SATA</strong> devices. This specificationincludes conformance limits for the RX Single-Ended Impedance. Reference [2] provides the definition of this termfor the purposes of <strong>SATA</strong> testing. Reference [3] defines the measurement requirements for this test.Test Setup:1. Matched length SMA cables have to be connected to the TDS/CSA8200 sampling oscilloscope; eachpair of the transmitter and receiver to one sampling module.2. The TDR signal amplitude should be less than 300mV peak-to-peak this can be achieved byintroducing 6dB attenuators in the measurement path. This will provide approximately 125mV peakto-peak(single ended) TDR signal amplitude.3. Each sampling module of the oscilloscope needs to be deskewed for acquisition using external sourcebefore connecting the fixtures. There is no need to deskew between the modules since themeasurements are done for the pairs within the modules. The sources deskew has to be performed ineven mode (source steps are of the same polarity). The step signals should arrive at the PUT at thesame time. Both, acquisition and TDR deskew are to be performed at the SMA reference plane.4. Set 4000 acquisition points and 1ns/div in “Horizontal” menu and 300 averages in the “Acquisition”menu of TDS8200. Filter the TDR waveforms to 40ps (10-90%) rise time. The instrument’s setup canbe saved to a file.5. Power up the product under test (PUT) and complete a full OOB sequence.Test Procedure:1. This procedure should be applied to the worst case port (in a multi-port system/host) as determinedthrough the worst case port identification MOI.2. Acquire the open references for each TDR channel using IConnect “Acquisition” tool.3. Connect the PUT and acquire TDR waveforms for each channel using IConnect “Acquisition” tool.4. Filter open reference and TDR waveforms to 135ps (10-90%) rise time.5. Use Z-line tool of IConnect to compute impedance profile for each line of the PUT. Set Zo equal to 50Ohm and press on “Compute.” The resulting waveform will be displayed in the time domain viewer.6. Using cursors measure the minimum impedance value for each line (Figure 4.2).7. Record the results.<strong>SATA</strong> Rx/Tx MOI Revision 1.1 ver <strong>1.0</strong>29
Tektronix, Inc.Figure 4.2. Single-ended impedance measurements using Z-line tool of IConnect (RX-02). Minimumimpedance for positive line is 49 Ohm, while for the negative line the value is 42 Ohm.Observable Results:The RX Single-Ended Impedance shall be at least 40 Ohms for 1.5Gb/s devices.Possible Problems:1. Data noise may cause impedance waveform to oscillate. This is resolved by selecting a higher“Threshold” number for Z-line computations.2. First incident step needs to be windowed out, otherwise the measurement will not be accurate. Thecorrect acquisition window settings are shown in Figure 2.2<strong>SATA</strong> Rx/Tx MOI Revision 1.1 ver <strong>1.0</strong>30
Tektronix, Inc.Test RX-03 – Differential Mode Return LossPurpose: To verify that the Differential Mode Return Loss of the PUT’s receiver is within the conformance limits.References:[1] <strong>SATA</strong> Standard, 7.2.1, Table 23 – Receiver Specifications[2] Ibid, 7.2.2.4.3[3] Ibid, 7.4.10[4] <strong>SATA</strong> unified test document, 2.13.3Resource Requirements:See Appendix A.Last Template Modification: April 10 2006 (Version <strong>1.0</strong>)Discussion:Reference [1] specifies the Transmitted Signal conformance limits for <strong>SATA</strong> devices. This specificationincludes conformance limits for the RX Differential Mode Return Loss. Reference [2] provides the definition of thisterm for the purposes of <strong>SATA</strong> testing. Reference [3] defines the measurement requirements for this test.Test Setup:1. Matched length SMA cables have to be connected to the TDS/CSA8200 sampling oscilloscope; eachpair of the transmitter and receiver to one sampling module.2. The TDR signal amplitude should be less than 300mV peak-to-peak this can be achieved byintroducing 6dB attenuators in the measurement path. This will provide approximately 125mV peakto-peak(single ended) TDR signal amplitude3. Each sampling module of the oscilloscope needs to be deskewed for acquisition using external sourcebefore connecting the fixtures. There is no need to deskew between the modules since themeasurements are done for the pairs within the modules. The sources deskew has to be performed inodd mode (source steps are of opposite polarity). The step signals should arrive at the PUT at the sametime. Both, acquisition and TDR deskew are to be performed at the SMA reference plane4. Set 4000 acquisition points and 1ns/div in “Horizontal” menu and 300 averages in the “Acquisition”menu of TDS8200. Set math to a difference for TDR signals for each module. The instrument’s setupfrom RX-01 test can be reused (the response is filtered to 40ps (10-90%) rise time.5. Power up the product under test (PUT) and complete a full OOB sequence.Test Procedure:1. This procedure should be applied to the worst case port (in a multi-port system/host) as determinedthrough the worst case port identification MOI.2. Acquire the differential open reference using IConnect “Acquisition” tool.3. Connect the PUT and acquire TDRdd.4. Use S-parameter tool of IConnect to compute differential return loss (Sdd11) of the receiver. Theresulting waveform will be displayed in the frequency domain viewer.5. Using cursors measure the maximum values for each frequency range given in reference [1].Differential return loss measurements are shown in Figure 4.3.6. Record the results.<strong>SATA</strong> Rx/Tx MOI Revision 1.1 ver <strong>1.0</strong>31
Tektronix, Inc.Figure 4.3. Differential return loss measurements for RX-03. Cursor 1 reads -9.1dB at 2.34GHz, and cursor 2reads -8.97dB and 4.1GHz.Observable Results:The RX Differential Mode Return Loss shall be above the minimum limits specified in reference [1] forGen2i products. For convenience, the values are reproduced below.Frequency RangeLower Rloss Limit (Gen2i)150-300 MHz 18 dB300-600 MHz 14dB600-1200 MHz 10 dB1200-2400 MHz 8 dB2400-3000 MHz 3 dB3000-5000 MHz 1 dB<strong>SATA</strong> Rx/Tx MOI Revision 1.1 ver <strong>1.0</strong>32
Tektronix, Inc.Possible Problems:1. First incident step needs to be windowed out, otherwise the measurement will not be accurate. Thecorrect acquisition window settings are shown in Figure 2.2<strong>SATA</strong> Rx/Tx MOI Revision 1.1 ver <strong>1.0</strong>33
Tektronix, Inc.Test RX-04 – Common Mode Return LossPurpose: To verify that the Common Mode Return Loss of the PUT’s receiver is within the conformance limits.References:[1] <strong>SATA</strong> Standard, 7.2.1, Table 23 – Receiver Specifications[2] Ibid, 7.2.2.4.4[3] Ibid, 7.4.10[4] <strong>SATA</strong> unified test document, 2.13.4Resource Requirements:See Appendix A.Last Template Modification: April 10, 2006 (Version <strong>1.0</strong>)Discussion:Reference [1] specifies the Transmitted Signal conformance limits for <strong>SATA</strong> devices. This specificationincludes conformance limits for the RX Common Mode Return Loss. Reference [2] provides the definition of thisterm for the purposes of <strong>SATA</strong> testing. Reference [3] defines the measurement requirements for this test.Test Setup:1. Matched length SMA cables have to be connected to the TDS/CSA8200 sampling oscilloscope; eachpair of the transmitter and receiver is connected to one sampling module.2. The TDR signal amplitude should be less than 300mV peak-to-peak. This can be achieved byintroducing 6dB attenuators in the measurement path, this will provide approximately 125mV peak-topeak(single ended) TDR signal amplitude3. Each sampling module of the oscilloscope needs to be deskewed for acquisition using external sourcebefore connecting the fixtures. There is no need to deskew between the modules since themeasurements are done for the pairs within the modules. The sources deskew has to be performed ineven mode (source steps are of the same polarity). The step signals should arrive at the PUT at thesame time. Both, acquisition and TDR deskew are to be performed at the SMA reference plane.4. Set 4000 acquisition points and 1ns/div in “Horizontal” menu and 300 averages in the “Acquisition”menu of TDS8200. Set math to the summation of signal sources and filter response to 40ps (10-90%)rise time.5. Power up the product under test (PUT) and complete a full OOB sequence.Test Procedure:1. This procedure should be applied to the worst case port (in a multi-port system/host) as determinedthrough the worst case port identification MOI.2. Acquire the open references for each TDR channel using IConnect “Acquisition” tool.3. Connect the PUT and acquire TDR waveform in even mode using IConnect “Acquisition” tool.4. Use S-parameter tool of IConnect to compute common mode S-parameters of the PUT (Scc11). Theresulting waveform will be displayed in the frequency domain viewer.5. Using cursors measure the maximum values for each frequency range given in reference [1].Differential return loss measurements are shown in Figure 4.4.6. Record the results.<strong>SATA</strong> Rx/Tx MOI Revision 1.1 ver <strong>1.0</strong>34
Tektronix, Inc.Figure 4.4. Common mode return loss measurements for RX-04. Cursor 1 reads –4.45dB at <strong>1.0</strong>1GHz, andcursor 2 reads -5.49dB at 3.07GHz.Observable Results:The RX Common Mode Return Loss shall be above the minimum limits specified in reference [1] forGen2i products. For convenience, the values are reproduced below.Frequency RangeLower Rloss Limit (Gen2i)150-300 MHz 5 dB300-600 MHz 5dB600-1200 MHz 2 dB1200-2400 MHz 1 dB2400-3000 MHz 1 dB3000-5000 MHz 1 dB<strong>SATA</strong> Rx/Tx MOI Revision 1.1 ver <strong>1.0</strong>35
Tektronix, Inc.Possible Problems:1. First incident step needs to be windowed out, otherwise the measurement will not be accurate. Thecorrect acquisition window settings are shown in Figure 2.2<strong>SATA</strong> Rx/Tx MOI Revision 1.1 ver <strong>1.0</strong>36
Tektronix, Inc.Test RX-05 – Impedance BalancePurpose: To verify that the Impedance Balance of the PUT’s receiver is within the conformance limits.References:[1] <strong>SATA</strong> Standard, 7.2.1, Table 23 – Receiver Specifications[2] Ibid, 7.2.2.4.5[3] Ibid, 7.4.10[4] <strong>SATA</strong> unified test document, 2.13.5Resource Requirements:See Appendix A.Last Template Modification: April 10, 2006 (Version <strong>1.0</strong>)Discussion:Reference [1] specifies the Transmitted Signal conformance limits for <strong>SATA</strong> devices. This specificationincludes conformance limits for the RX Impedance Balance. Reference [2] provides the definition of this term forthe purposes of <strong>SATA</strong> testing. Reference [3] defines the measurement requirements for this test.Test Setup:1. Matched length SMA cables have to be connected to the TDS/CSA8200 sampling oscilloscope; eachpair of the transmitter and receiver is connected to one sampling module.2. The TDR signal amplitude should be less than 300mV peak-to-peak. This can be achieved byintroducing 6dB attenuators in the measurement path, this will provide approximately 125mV peak-topeak(single ended) TDR signal amplitude3. Each sampling module of the oscilloscope needs to be deskewed for acquisition external signal sourcebefore connecting the fixtures. There is no need to deskew between the modules since themeasurements are done for the pairs within the modules. The deskew is to be performed in even mode:both sources are positive, and the step signals should arrive at the PUT and the same time. Theinstrument’s setup needs to be saved to a file.4. Set 4000 acquisition points and 1ns/div in “Horizontal” menu and 300 averages in the “Acquisition”menu of TDS8200. Set math 1 function to the sum of the acquired TDR channels, and acquire openreference waveform at the SMA interface. Set math 2 function the difference of the acquired TDRchannels and filter the response to 40ps (10-90%) rise time.5. Power up the product under test (PUT) and complete a full OOB sequence..Test Procedure:1. This procedure should be applied to the worst case port (in a multi-port system/host) as determinedthrough the worst case port identification MOI.2. Load the open reference for even mode (math 1 function) using IConnect “Acquisition” tool.3. Connect the fixtures and the PUT then acquire math 2 waveform (difference of the acquired TDRsignals) using IConnect “Acquisition” tool.4. Use S-parameter tool of IConnect to compute differential-to-common conversion (Sdc11) of the PUT.The resulting waveform will be displayed in the frequency domain viewer.5. Using cursors measure the maximum values for each frequency range given in reference [1].Impedance balance measurements are shown in Figure 4.5.6. Record the results.<strong>SATA</strong> Rx/Tx MOI Revision 1.1 ver <strong>1.0</strong>37
Tektronix, Inc.Figure 4.5. Impedance balance loss measurements for RX-05. Cursor 1 reads –19.4dB at 4.07GHz, and cursor2 reads -21.2dB at 2.61GHz.Observable Results:The RX Impedance Balance shall be above the minimum limits specified in reference [1] for Gen2iproducts. For convenience, the values are reproduced below.Frequency RangeLower Rloss Limit (Gen2i)150-300 MHz 30 dB300-600 MHz 30 dB600-1200 MHz 20 dB1200-2400 MHz 10 dB2400-3000 MHz 4 dB3000-5000 MHz 4 dB<strong>SATA</strong> Rx/Tx MOI Revision 1.1 ver <strong>1.0</strong>38
Tektronix, Inc.Possible Problems:1. First incident step needs to be windowed out, otherwise the measurement will not be accurate. Thecorrect acquisition window settings are shown in Figure 2.2<strong>SATA</strong> Rx/Tx MOI Revision 1.1 ver <strong>1.0</strong>39
Tektronix, Inc.Test RX-06 – Gen-1 Differential Mode Return LossPurpose: To verify that the Differential Mode Return Loss of the PUT’s receiver is within the conformance limits.References:[1] <strong>SATA</strong> Standard, 7.2.1, Table 23 – Receiver Specifications[2] Ibid, 7.2.2.4.3[3] Ibid, 7.4.10[4] <strong>SATA</strong> unified test document, 2.13.3Resource Requirements:See Appendix A.Last Template Modification: April 10 2006 (Version <strong>1.0</strong>)Discussion:Reference [1] specifies the Transmitted Signal conformance limits for <strong>SATA</strong> devices. This specificationincludes conformance limits for the RX Differential Mode Return Loss. Reference [2] provides the definition of thisterm for the purposes of <strong>SATA</strong> testing. Reference [3] defines the measurement requirements for this test.Test Setup:1. Matched length SMA cables have to be connected to the TDS/CSA8200 sampling oscilloscope; eachpair of the transmitter and receiver to one sampling module.2. The TDR signal amplitude should be less than 300mV peak-to-peak. This can be achieved byintroducing 6dB attenuators in the measurement path, this will provide approximately 125mV peak-topeak(single ended) TDR signal amplitude3. Each sampling module of the oscilloscope needs to be deskewed for acquisition using external sourcebefore connecting the fixtures. There is no need to deskew between the modules since themeasurements are done for the pairs within the modules. The sources deskew has to be performed ineven mode (source steps are of the same polarity). The step signals should arrive at the PUT at thesame time. Both, acquisition and TDR deskew are to be performed at the SMA reference plane.4. Set 4000 acquisition points and 1ns/div in “Horizontal” menu and 300 averages in the “Acquisition”menu of TDS8200. Set math to a difference for TDR signals for each module. The instrument’s setupfrom RX-01 test can be reused (the response is filtered to 40ps (10-90%) rise time).5. Power up the product under test (PUT) and complete a full OOB sequence.Test Procedure:1. This procedure should be applied to the worst case port (in a multi-port system/host) as determinedthrough the worst case port identification MOI.2. Acquire the differential open reference using IConnect “Acquisition” tool.3. Connect the PUT and acquire TDRdd.4. Use S-parameter tool of IConnect to compute differential return loss (Sdd11) of the receiver. Theresulting waveform will be displayed in the frequency domain viewer.5. Using cursors measure the maximum values for each frequency range given in reference [1].Differential return loss measurements are shown in Figure 4.3.6. Record the results.<strong>SATA</strong> Rx/Tx MOI Revision 1.1 ver <strong>1.0</strong>40
Tektronix, Inc.Figure 4.6. (requires a true Gen-1 screen shot) Differential return loss measurements for RX-03. Cursor 1reads -9.1dB at 2.34GHz, and cursor 2 reads -8.97dB and 4.1GHz.Observable Results:The RX Differential Mode Return Loss shall be above the minimum limits specified in reference [1] forGen1i products. For convenience, the values are reproduced below.Frequency Range Lower RlossLimit (Gen1i)75-150 MHz 18 dB150-300 MHz 14dB300-600 MHz 10 dB600-1200 MHz 8 dB1200-2400 MHz 3 dB2400-3000 MHz 1 dB<strong>SATA</strong> Rx/Tx MOI Revision 1.1 ver <strong>1.0</strong>41
Tektronix, Inc.Possible Problems:2. First incident step needs to be windowed out, otherwise the measurement will not be accurate. Thecorrect acquisition window settings are shown in Figure 2.2<strong>SATA</strong> Rx/Tx MOI Revision 1.1 ver <strong>1.0</strong>42
Tektronix, Inc.Appendix A – Resource RequirementsThe resource requirements include two separate sets of equipment. The equipment required for TX and RX tests isshown in section A.2, and the equipment required for OOB tests is shown in section A.3.A.1 Equipment for PHY and TSG tests1. Real-time Digital OscilloscopeTDS6154C, TDS612C, or TDS6804B (gen1 only!)2. Test FixtureCrescent Heart Software Fixture TF-<strong>SATA</strong>-NE/XP, TF-<strong>SATA</strong>-FE/XPOr equivalent3. Cables179-4944-00 or equivalent4. <strong>SATA</strong> host system for Drive initializationAny system capable of controlling Gen1 and Gen2 devices, and capable of running UlinkDriveMaster or Intel BISTFIS utility to set BIST pattern transmission in device.5. SoftwareBISTFIS Utility or Ulink DriveMasterTektronix TDSJIT3v2Tektronix TDSRT-Eye (RTeye version 2.0.3 or later, SST version 1.1.2 or later)A.2 Equipment for TX and RX tests1. Equivalent-time Sampling OscilloscopeTDS/CSA8200 with 2 ea 80E04 sampling head2. Test FixtureCrescent Heart Software Fixture TF-<strong>SATA</strong>-NE/XP, TF-<strong>SATA</strong>-FE/XP (< 36dB of NEXT requiredin fixtures in addition to satisfying the required Serial ATA lab load requirements)Or equivalent4. Cables and other accessories4 ea. Matched SMA cables 179-4944-00 or equivalent2 ea 6dB SMA attenuators required for Tx tests, 6dB matched power splitters can be used as well.5. Software1. IConnect software (80SICON), Tektronix, Inc. or equivalent2. <strong>SATA</strong> host system for Drive initializationAny system capable of controlling Gen1 and Gen2 devices, and capable of running UlinkDriveMaster or Intel BISTFIS utility or equivalent system to ensure device has properlynegotiated a full Com-Init / Reset cycle (required before any testing can be conducted onan active device ).A.3 Equipment for OOB tests1. Real-time Digital OscilloscopeTDS6154C, TDS612C, or TDS6804B (gen1 only!)<strong>SATA</strong> Rx/Tx MOI Revision 1.1 ver <strong>1.0</strong>43
Tektronix, Inc.2. Signal GeneratorAWG710B, AWG710, AWG610, or AWG6153. Test FixtureCrescent Heart Software Fixture TF-<strong>SATA</strong>-NE/XP, TF-<strong>SATA</strong>-FE/XPOr equivalent4. Cables179-4944-00 or equivalent5. <strong>SATA</strong> host system for Drive initializationAny system capable of controlling Gen1 and Gen2 devices, and capable of running UlinkDriveMaster or Intel BISTFIS utility to set BIST pattern transmission in device.6. SoftwareBISTFIS Utility or Ulink DriveMasterTektronix TDSJIT3v2Tektronix TDSRT-Eye (RTeye version 2.0.3 or later, SST version 1.1.2 or later)<strong>SATA</strong> Rx/Tx MOI Revision 1.1 ver <strong>1.0</strong>44
Tektronix, Inc.Appendix B – TDR Alignment and Acquisition SetupIntroductionThis deskew procedure utilizes an independent acquisition source and assumes availability of two TDR samplingmodules (80E04, 80E08, or 80E10). It can also be used with one TDR (80E04, 80E08, or 80E10), and one dualsampling module (80E03 or 80E09). It aligns both samplers and TDR steps allowing measuring mixed mode S-parameters. The procedure starts with the alignment of the samplers and concludes with alignment of the acquisitionchannels.Match samplers to the ends of the cablesThe purpose of this step is to set the samplers on each channel so that an input into the open end of each cablearrives at the sample gate at precisely the same time. This step compensates for cable and sampler differences. Firststage is alignment of the channels 1-3 using the channel 4 as an independent TDR source, and then aligningacquisition of the channel 4 with respect to already aligned channel 3 using channel one as another independentsource. 2 The deskew procedure is to be performed in rho mode.1. Connect SMA cables to the sampling modules of the oscilloscope. For the best results, it is desired that theSMA cables used in the measurements have approximately the same quality and length (matched within 20ps).2. Connect channel 1 and channel 4 with SMA barrel, activate TDR step on channel 4 and acquisition on channel1 (see Figure 2).Figure 2 C1 is connected to C4 with SMA barrel. The TDR step is generated on C4 and acquiredusing C1.3. Adjust the horizontal position and scale to get the rising edge on screen with good resolution (20ps/div). Recordlength should have the maximum number of 4000 points.4. Save channel one (C1) waveform as a reference trace. Channel 2 and 3 will be aligned with respect to it.5. Connect channel two (C2) to the channel four (C4) using SMA barrel, and display C2 on the screen.6. Turn on the delay measurement to measure the time difference between the rising edge on the reference traceand the rising edge of C2 as shown in Figure 3.2 When only one TDR and one sampling modules are available another TDR channel can be used as an independentTDR source.<strong>SATA</strong> Rx/Tx MOI Revision 1.1 ver <strong>1.0</strong>45
Tektronix, Inc.Figure 3 Delay measurements between the reference (R1) acquired from the channel one and thechannel two (C2). It has to be the minimum for the best deskew value.7. Adjust the channel deskew value in the Vertical menu of the Setups dialog until a delay value within 1ps isachieved as show8. Repeat steps 5-7 for the C3.9. Now, when the acquisition of C1 through C3 is aligned, the same approach can be used to align C4. For thispurpose generate a new reference by using the step of C1 and acquiring it on C3. C3 has to be connected to C1with the SMA barrel.10. Repeat steps 5-7 for the C4 using acquired reference from C3.Now, all four acquisition channels have been deskewed within 1ps.Match the TDR pulses to the ends of the cablesThe purpose of this step is to adjust the TDR pulses so they arrive at the ends of the cables at precisely the sametime. The deskew has to be performed separately for odd and even TDR steps when 80E04 modules are used 3 . Thissection describes only odd mode TDR step deskew. The deskew procedure has to be performed in rho mode.1. Disconnect the SMA barrel and turn on TDR pulses of the appropriate polarity for each channel (C1 and C2).Use the differential TDR preset selection to activate odd mode.2. Adjust the horizontal position and scale so that the pulses as they arrive at the ends of the cables are visible onscreen with good resolution. (Use Average mode and vectored display, a set time scale to 20ps/div).3. Turn on the delay measurement to measure the time difference between the two pulse edges.4. Adjust the Step Deskew in TDR menu to minimize the time difference between the C1 and C2 pulses. Youmight want to activate Fine button to reduce the increment of deskew as shown in Figure 4.3 Odd mode (differential) is generated when TDR steps set to opposite polarity, and even mode (common) isgenerated when both steps are of the same polarity.<strong>SATA</strong> Rx/Tx MOI Revision 1.1 ver <strong>1.0</strong>46
Tektronix, Inc.Figure 4 Differential TDR step deskew. The channels C1 and C2 are aligned within ~300fs.5. Repeat steps 1-4 for C3 and C4, and save the instrument setup.6. Repeat steps 1-5 in even mode if desired.The instrument should now be set up to accurately make differential or common mode TDR measurements.Correct Acquisition Window Settings for S-parameter Calculations with IConnectThe acquisition of S-parameters with TDR/T instrument requires that the PUT’s reflections settle to their steady DClevel. The approximate rule of thumb for the acquisition window width is four or five times time delay of the PUT.This is shown in the Figure B.2.1.Figure B.2.1. Correct acquisition window settings used in IConnect software to compute S-parameters. Firstincident step is windowed out, and all reflections settled to a steady DC level.<strong>SATA</strong> Rx/Tx MOI Revision 1.1 ver <strong>1.0</strong>47
Tektronix, Inc.Appendix C - TDNA Measurement System AccuracyTable C.1 summarizes characteristics of the TDNA system used for RX/TX and SI test. The system is based on astandard 80E04 module that allows to perform both return and insertion loss measurements from time domain data.Table C.1 TDR System Characteristics with a standard 80E04 moduleCharacteristicsInput ImpedanceTDR Step AmplitudeTDR System Reflected Rise Time (10% to 90%)TDR System Incident Rise Time (10% to 90%)TDR Step Maximum Repetition RateDC Vertical Range Accuracy within 2°C of CompensatedTemperatureRMS Noise (typical/maximum)BandwidthDynamic RangeValue50 ±0.5Ω250 mV≤35 ps≤28 ps (typical)200 kHz±[ 2 mV + 0.007 (Offset) + 0.02 (Vertical Value-Offset)]600 μV/≤1.2 mV20GHz50-60dB<strong>SATA</strong> Rx/Tx MOI Revision 1.1 ver <strong>1.0</strong>48
Tektronix, Inc.<strong>SATA</strong> Rx/Tx MOI Revision 1.1 ver <strong>1.0</strong>49
Tektronix, Inc.Appendix D - Measurements of the Active <strong>SATA</strong> TransmitterMeasurement setupThe BIST-L method of the host transmitter testing requires a transmitter to transmit aspecific pattern. This pattern can be initiated using a host controller which can be a hard driveemulator or AWG. The problem with this approach is that many hosts do support “disconnect”operation; this means that as soon as the drive is disconnected from the host, the host’stransmitter stops transmitting the data. Thus TX testing of such hosts requires a constantconnection with the host controller. This can be accomplished by using power splitters andconnecting both, the TDR instrument and the host controller, to the measured host in the samemeasurement setup.The diagram of such measurement is shown in Figure D.1. The measurement setupconsists of a set of matched length SMA cables connected between the host under test and powersplitters that are attached to the sampling module using SMA male-to-male adaptors. To controlthe host longer SMA sables are connected between the other ports of the splitter and the receiverports of the host controller. Note that the power splitters can be also connected directly to thesampling heads before the SMA cables, however, in this the longer cables to the BIST initiatormight be required in order to set the time window propely. The transmitter port of the hostcontroller is connected to the receiver of the host thus providing the initiation of the requiredpattern. If the regular 6dB matched power splitter is used, the resulting differential TDR voltageamplitude will be ~125mV, which is sufficient to make measurements and not to loose much ofthe dynamic range at the same time.<strong>SATA</strong>BISTInitiatorTxRxCh1 Ch2t 2t 0RxTxt 1<strong>SATA</strong>Host Under TestFigure D1. Measurement setup that can be used to perform TDR measurement of theactively transmitting host (HUT).<strong>SATA</strong> Rx/Tx MOI Revision 1.1 ver <strong>1.0</strong>50
Tektronix, Inc.Note: BIST initiator may be required to operate outside of its nominal operating conditions due to typical lossesassociated with 3dB power splitters and interconnect cable length.It is important to select the right cable length to provide sufficient TDR acquisitionwindow. The general principal of the acquisition window setup is illustrated in the Figure D2.The cable length between the host under test and the host controller (t 0 and t 2 ) should provideenough time for the host response to settle to a steady DC level and for the host controller not toshow up the TDR acquisition window. This is effectively an accurate and direct time domaingating of the host under test response, which represents a unique TDR instrument capabilitybecause Inverse Fast Fourier Transformation (IFFT) response from the frequency domaininstrument will include the effects of the host controller.TDR MeasurementWindowt 0t 1 t 2timeFigure D2. Time domain measurement window: t 0 –time at 6dB splitter, t 1 -reference planefor <strong>SATA</strong> measurements, t 2 - time position of the host controller.Validation ResultsFigure D3 shows the original time domain impedance profile for the <strong>SATA</strong> host acquiredwhen BIST initiated MFTP pattern was applied. Two measurements were performed: one withthe splitter and one without. The obtained TDR impedance profile shows that terminationimpedance of the reduced TDR amplitude has higher value which is an indicator of thedependency of the transmitter’s impedance on the applied TDR step voltage. A possible reasonof this difference is that the original TDR voltage was too high putting the transmitter into anonlinear region of operation.<strong>SATA</strong> Rx/Tx MOI Revision 1.1 ver <strong>1.0</strong>51
Tektronix, Inc.Figure D3. The original time domain impedance profile for the <strong>SATA</strong> host acquired whenBIST initiated MFTP pattern was applied. The transmitter’s termination impedance hasdifferent values.<strong>SATA</strong> Rx/Tx MOI Revision 1.1 ver <strong>1.0</strong>52
Tektronix, Inc.Figure D4. Impedance profile of the same HUD measured from TDR with different stepsignal amplitudes. The difference between 6dB and 14dB impedance is small indicatingthat an accurate measurement of the active transmitter has to be done with an amplitudethat allows the transmitter operate in the linear region.<strong>SATA</strong> Rx/Tx MOI Revision 1.1 ver <strong>1.0</strong>53
Tektronix, Inc.Figure D5. Differential return loss obtained with TDNA of different amplitudes of the stepvoltages. The comparison of the results for 0dB and 6dB attenuation levels shows the effectof the termination impedance change at low frequencies, whereas 14dB attenuation showsthat the data repeats a general trend but have an excessive noise due to very small TDRstep amplitude (~20mV).ConclusionThe presented results demonstrate that TDR measurements can be successfully performed onactively transmitting host that can be controlled from the host controller at the same time. Specialcare should be taken when selecting the right TDR signal levels: the signal should be smallenough to keep the transmitter operating in a linear region, and large enough to provide asufficient dynamic range for S-parameter acquisition. The attenuation level of 6dB seems toprovide a reasonable solution for the active <strong>SATA</strong> transmitter measurements.<strong>SATA</strong> Rx/Tx MOI Revision 1.1 ver <strong>1.0</strong>54
Tektronix, Inc.Appendix E Verification of the mated Test Fixture and setupPurpose: To provide a methodology for the quick verification of the calibration and test fixtures prior performingRx/Tx test measurementsReferences:[1] <strong>SATA</strong> Standard, 7.2.2,5 Lab Load DetailsResource Requirements:See Appendix A.Last Template Modification: April 10, 2006 (Version <strong>1.0</strong>)Discussion:Reference [1] specifies the lab load requirements for <strong>SATA</strong> Test fixture. Assuming the fixture meets theserequirements, the following method described in this appendix is used to quickly check the performance of the testfixtures used for Rx/Tx tests. The measurement is performed the same way as it is done for Rx/Tx tests for Gen IIPUTs with the PUT replaced by the same test fixture with the opposite gender having its SMA connectorsterminated with 50 Ohm terminations.The Crescent Heart test fixture is used in the measurements.Test Setup:1. Matched length SMA cables have to be connected to the TDS/CSA8200 sampling oscilloscope; eachpair of the transmitter and receiver is connected to one sampling module.2. Each sampling module of the oscilloscope needs to be deskewed for acquisition external signal sourcebefore connecting the fixtures. There is no need to deskew between the modules since themeasurements are done for the pairs within the modules. The deskew is to be performed in odd andeven modes. The step signals should arrive at the PUT and the same time.3. It is recommended to save the test setups to the instrument after each, even and odd deskew operations.Test Procedure:1. Apply the same procedure that was used for Rx/Tx01-05 tests.Figure E.1 Crescent Heart fixtures configured for the verification tests.Measurement Results:<strong>SATA</strong> Rx/Tx MOI Revision 1.1 ver <strong>1.0</strong>55
Tektronix, Inc.The following figures illustrate the results of the verification tests. Time domain tests are informative only.Red line in the frequency domain test results shows required test compliance limits defined for Rx/Tx tests.Figure E.2 Rx-01 Test results for Crescent Heart Mated Pair.Figure E.3 Rx-02 Test results for Crescent Heart Mated Pair.<strong>SATA</strong> Rx/Tx MOI Revision 1.1 ver <strong>1.0</strong>56
Tektronix, Inc.Figure E.4 Rx-03 Test results for Crescent Heart Mated Pair.Figure E.5 Rx-04 Test results for Crescent Heart Mated Pair.<strong>SATA</strong> Rx/Tx MOI Revision 1.1 ver <strong>1.0</strong>57
Tektronix, Inc.Figure E.6 Rx-05 Test results for Crescent Heart Mated Pair.Figure E.7 Tx-01 Test results for Crescent Heart Mated Pair.<strong>SATA</strong> Rx/Tx MOI Revision 1.1 ver <strong>1.0</strong>58
Tektronix, Inc.Figure E.8 Tx-02 Test results for Crescent Heart Mated Pair.Figure E.9 Tx-03 Test results for Crescent Heart Mated Pair.<strong>SATA</strong> Rx/Tx MOI Revision 1.1 ver <strong>1.0</strong>59
Tektronix, Inc.Figure E.10 Tx-04 Test results for Crescent Heart Mated Pair.Figure E.11 Tx-05 Test results for Crescent Heart Mated Pair.<strong>SATA</strong> Rx/Tx MOI Revision 1.1 ver <strong>1.0</strong>60