1.0 - SATA-IO
1.0 - SATA-IO
1.0 - SATA-IO

You also want an ePaper? Increase the reach of your titles
YUMPU automatically turns print PDFs into web optimized ePapers that Google loves.
SyntheSys Research, Inc.<br />
Serial ATA<br />
International Organization<br />
Version <strong>1.0</strong><br />
June 3, 2010<br />
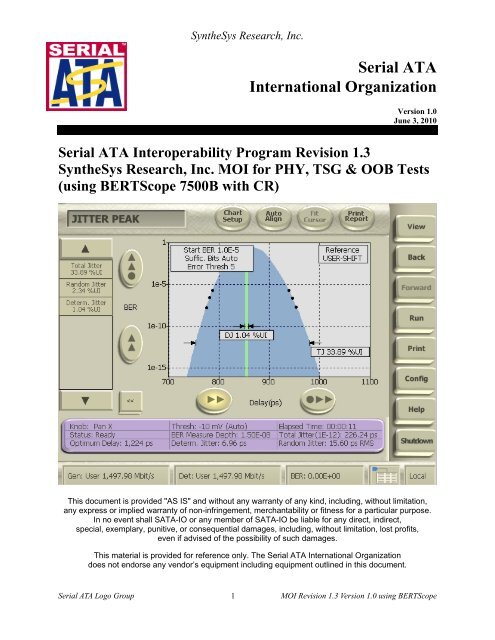
Serial ATA Interoperability Program Revision 1.3<br />
SyntheSys Research, Inc. MOI for PHY, TSG & OOB Tests<br />
(using BERTScope 7500B with CR)<br />
This document is provided "AS IS" and without any warranty of any kind, including, without limitation,<br />
any express or implied warranty of non-infringement, merchantability or fitness for a particular purpose.<br />
In no event shall <strong>SATA</strong>-<strong>IO</strong> or any member of <strong>SATA</strong>-<strong>IO</strong> be liable for any direct, indirect,<br />
special, exemplary, punitive, or consequential damages, including, without limitation, lost profits,<br />
even if advised of the possibility of such damages.<br />
This material is provided for reference only. The Serial ATA International Organization<br />
does not endorse any vendor’s equipment including equipment outlined in this document.<br />
Serial ATA Logo Group 1 MOI Revision 1.3 Version <strong>1.0</strong> using BERTScope
SyntheSys Research, Inc.<br />
TABLE OF CONTENTS<br />
MODIFICAT<strong>IO</strong>N RECORD ..................................................................................3<br />
INTRODUCT<strong>IO</strong>N....................................................................................................4<br />
REFERENCES.........................................................................................................4<br />
ACKNOWLEDGEMENTS ....................................................................................4<br />
TEST TITLE: HOST WORST PORT IDENTIFICAT<strong>IO</strong>N ........................................................................ 5<br />
TEST TITLE: SERIAL ATA INTEROP TEST SUITE AUTOMAT<strong>IO</strong>N...................................................... 6<br />
TEST TITLE: PHY-01 : UNIT INTERVAL......................................................................................... 8<br />
TEST TITLE: PHY-02 : FREQUENCY LONG TERM STABILITY ...................................................... 10<br />
TEST TITLE: PHY-03 : SPREAD-SPECTRUM MODULAT<strong>IO</strong>N FREQUENCY..................................... 10<br />
TEST TITLE: PHY-04 : SPREAD-SPECTRUM MODULAT<strong>IO</strong>N DEVIAT<strong>IO</strong>N....................................... 10<br />
TEST TITLE: TSG-01 : DIFFERENTIAL OUTPUT VOLTAGE........................................................... 12<br />
TEST TITLE: TSG-02 : RISE/FALL TIME...................................................................................... 12<br />
TEST TITLE: TSG-03 : DIFFERENTIAL SKEW.............................................................................. 15<br />
TEST TITLE: TSG-04: AC COMMON MODE VOLTAGE................................................................ 17<br />
TEST TITLE: TSG-05 : RISE/FALL TIME IMBALANCE.................................................................. 19<br />
TEST TITLE: TSG-06 : AMPLITUDE IMBALANCE ........................................................................ 19<br />
TEST TITLE: TSG-09: TJ AT CONNECTOR, DATA, F BAUD /500...................................................... 22<br />
TEST TITLE: TSG-10: DJ AT CONNECTOR, DATA, F BAUD /500 ..................................................... 22<br />
TEST TITLE: TSG-11: TJ AT CONNECTOR, CLOCK, 500 .............................................................. 25<br />
TEST TITLE: TSG-12: DJ AT CONNECTOR, CLOCK, 500 ............................................................. 25<br />
TEST TITLE: OOB-01: OOB SIGNAL DETECT<strong>IO</strong>N THRESHOLD .................................................. 28<br />
TEST TITLE: OOB-02: UI DURING OOB SIGNALING ................................................................. 30<br />
TEST TITLE: OOB-03: COMINIT/COMRESET AND COMWAKE TRANSMIT BURST LENGTH 30<br />
TEST TITLE: OOB-04: COMINIT/COMRESET TRANSMIT GAP LENGTH ................................ 32<br />
TEST TITLE: OOB-05: COMWAKE TRANSMIT GAP LENGTH ................................................... 32<br />
TEST TITLE: OOB-06: COMWAKE GAP DETECT<strong>IO</strong>N WINDOWS .............................................. 33<br />
TEST TITLE: OOB-07: COMINIT GAP DETECT<strong>IO</strong>N WINDOWS.................................................. 34<br />
APPENDIX A: INITIAT<strong>IO</strong>N OF PUT USING BIST MODES............................................................... 35<br />
APPENDIX B1: CALIBRAT<strong>IO</strong>N OF TEST SETUP DIFFERENTIAL SKEW. .......................................... 37<br />
APPENDIX B2: CALIBRAT<strong>IO</strong>N OF TEST SETUP AC COMMON MODE............................................ 38<br />
APPENDIX B3: CALIBRAT<strong>IO</strong>N OF TEST SETUP DE-EMBEDDING. .................................................. 38<br />
APPENDIX B4: CALIBRAT<strong>IO</strong>N OF TEST SETUP OOB AMPLITUDE. ............................................... 41<br />
APPENDIX C: JITTER TRANSFER FUNCT<strong>IO</strong>N (JTF) CALIBRAT<strong>IO</strong>N:............................................... 42<br />
APPENDIX D: VALIDAT<strong>IO</strong>N OF LAB LOAD RETURN LOSS............................................................ 44<br />
APPENDIX E: SERIAL ATA INTEROPERABILITY PROGRAM TEST SETUP USING BERTSCOPE...... 46<br />
Serial ATA Logo Group 2 MOI Revision 1.3 Version <strong>1.0</strong> using BERTScope
MODIFICAT<strong>IO</strong>N RECORD<br />
First draft, January 25, 2006<br />
Version 0.8, February 6, 2006<br />
Version 0.93RC, March 14, 2006<br />
Version 0.94RC, March 22, 2006: “using either the BIST T,S,A mode or other suitable method” inserted in the<br />
initiating step in PHY-01 through TSG-12. TSG01 section inserted. “Possible Issues” inserted in TSG-02. TSG04<br />
removed one cable to improve the setup and corrected labels in step 4. TSG05 and TSG06 corrected to: “at least<br />
10,000 samples” and “mean” Amplitude Imbalance. Inserted: “When initiating via BIST; there is 50% “in Possible<br />
Issues in TSG-09 through TSG-12. “This test requirement is only applicable to components claiming to be capable<br />
of running at 3Gb/s” inserted in TSG-11 and TSG-12. Appendix C step-by-step bullets filled in.<br />
Version 0.96RC, March 23, 2006: Completed step 4 through 9 and observable results paragraphs of TSG01 and<br />
added “When calibrating the BERTScope clock need to be used. By clicking on “Synthesizer” the Clock frequency<br />
is set to either 1.5 Gbps or 3.0 Gbps. Clock and Data Outputs are enabled by clicking on the “Outputs On/Off”<br />
button. “to TSG-02.<br />
Version 0.97RC, April 19, 2006: “<strong>SATA</strong>I (3.0)” corrected to “<strong>SATA</strong>I (6.0) in PHY-01 through TSG-02 and in TSG-<br />
09 and TSG-10. TSG-01 changed to minimum and maximum measured using the same method and TSG-02 merely<br />
using HFTP as described in Serial ATA Interoperability Program Unified Test Document,<br />
LogoTF_ILunified_v1_0RC2f.doc.<br />
Version 0.98RC, June, 2006: Changed from “(6.0)” to “(1.98)” settings on the CR 12500A in PHY-01 through<br />
PHY-04. Updated TSG-01 and Appendix E. Updated PHY-01, PHY-04 and TSG-01 through TSG-03 with explicit<br />
requirements to save calibration screen shots. Updated TSG-09 and TSG-10 with TIE based methodology<br />
requirements of Unified Test Document, LogoTF_ILunified_v1_0RC2i.doc.<br />
Version 0.99RC, June 7, 2006: Updated index to show TSG-01. Added reference to Comax H303000204 or<br />
equivalent in all sections. Detailed the scope measurements in PHY-03 and PHY-04.<br />
Version <strong>1.0</strong>RC, June 19, 2006: Modified SSC equations in PHY-04 to record SSC relative to f nominal .<br />
Version <strong>1.0</strong>5RC, September 14, 2006: Modified PHY-02 and PHY-04 to in clued the words “average over” ten<br />
SSC cycles for the measurement of frequency deviation. Added the Host Worst Case Port Identification test.<br />
Changed “device” to “product” and “DUT” to “PUT”. Inserted note of LBP pattern being per ECN 018 and<br />
therefore disparity agnostic. Removed disparity verification of the LBP pattern from TSG-01 and TSG-09 through<br />
TSG-12. Allowing multiple choices of Stimulus Tools in Appendix A for initiation of the product and generation of<br />
BIST Active.<br />
Version <strong>1.0</strong>7RC, September 20, 2006: Added calibration procedure to TSG-04.<br />
Revision 1.1 Version 0.90, October 30, 2006: Revised title, revision and version according to new workgroup<br />
naming conventions. Updated the TJ and DJ limits for Gen1 1.5 Gb/s to follow the limits for other clock to data<br />
jitter measurements, namely 0.37 and 0.19 UI respectively.<br />
Revision 1.1 Version 0.91, November 6, 2006 and Revision 1.1 Version <strong>1.0</strong>RC, November 16, 2006: Changed<br />
“Revision 0.90” to “Version 0.91” and moved “Revision 1.1” on cover page, Merged PHY-02, PHY-03 and PHY-04<br />
to share one diagram and simplify the formula for conversion from measured value to ppm. Merge TSG-09 and<br />
TSG-10 as well as TSG-11 and TSG-12 in pairs to share procedure and images.<br />
Revision 1.1 Version <strong>1.0</strong>1RC, July 26, 2007: Added setup return loss measurement data.<br />
Revision 1.3 Version 0.91 January 5, 2009: Added Appendix C with JTF calibration.<br />
Added references to Jitter Transfer Function (JTF) in TSG-09 through TSG-12<br />
Added note in OOB-02 through OOB-05 regarding +/-100 mV measurement offset.<br />
Added calibration of signal amplitude for OOB-01 test to Appendix B<br />
Modified PHY-02 and PHY-04 to reflect proper limits of +350, -5350 ppm<br />
TSG-05 – corrected final formula to show two result values (per IW scorecard) rather than single value “Max” result<br />
Moved common resource requirements and setup to Appendix E<br />
Corrected references to <strong>SATA</strong> 2.6 Spec, and reference tables<br />
Revision 1.3 Version 0.8 October 14, 2009: Updated Figures and down shifted revision to 0.8.<br />
Revision 1.3 Version 0.92 March 29, 2010: Completed all Appendices and updated to 0.9 after workgroup<br />
approval.<br />
Revision <strong>1.0</strong>RC April 8, 2010. Moved to <strong>1.0</strong>RC after workgroup approval.<br />
Revision <strong>1.0</strong> June 3, 2010. Removed “RC” after end of 30 days review.<br />
Serial ATA Logo Group 3 MOI Revision 1.3 Version <strong>1.0</strong> using BERTScope
INTRODUCT<strong>IO</strong>N<br />
These Methods of Implementations describe the step by step procedures to perform the<br />
required:<br />
- PHY-01 through PHY-04<br />
- TSG-01 through TSG-12 (except TSG-07 and TSG-08, which are obsolete)<br />
- OOB-01 through OOB-07<br />
tests of the Serial ATA Interoperability Program using the BERTScope by SyntheSys Research,<br />
Inc. in order to qualify a product for listing on the <strong>SATA</strong> Integrators List.<br />
You will find that this MOI is a lot simpler and a lot shorter than the previous versions although<br />
it includes 7 additional OOB tests. This is due to the leverage of the new PatternVu software<br />
option which improves accuracy of amplitude, rise time and skew measurements and the<br />
inclusion of functions integrated in the latest BERTScope software.<br />
The test setup is illustrated in Appendix E, including a simplified version of this setup for OOB<br />
tests.<br />
The tests may be performed in sequence using automated using software shown in Test Title:<br />
Serial ATA Interop Test Suite. Please contact SyntheSys Research, Inc. at +1 (650) 364-1853 or<br />
info@bertscope.com for the availability of software and accessories.<br />
REFERENCES<br />
The following document is referenced in this text:<br />
[1] Serial ATA Rersion 2.6,<br />
[2] Serial ATA Interoperability Program Unified Test Document Revision 1_3_<br />
[3] Serial ATA Interoperability Program Policy Document Revision 1_3_<br />
[4] <strong>SATA</strong>_PHY_MOI_BERTScope_RSG_r13_v<strong>1.0</strong><br />
ACKNOWLEDGEMENTS<br />
SyntheSys Research, Inc. would like to acknowledge the following reviewers of the earlier<br />
versions of this document:<br />
[1] Harvey Newman, while at Infineon<br />
[2] Jeff Choun, Marvell<br />
[3] Jeff Wolford, HP<br />
[4] John C. Calvin, Tektronix<br />
[5] Mark Marlett, LSI Logic<br />
[6] Pao-Ching Tseng, MediaTek<br />
[7] Paschal Egan, Philips Semiconductor<br />
[8] Serge Bedwani, Intel<br />
[9] Steven Wong, Comax Technology<br />
Serial ATA Logo Group 4 MOI Revision 1.3 Version <strong>1.0</strong> using BERTScope
Test Title: Host Worst Port Identification<br />
Purpose: Prior to execution of any testing on a host, a “worst port” must be identified.<br />
Last Modification: January 5, 2009<br />
Discussion: The intent of identifying a worst port is not to validate each port to the specification, but to simply<br />
identify the worst port based on a single relative measurement across all ports within a host. The Interoperability<br />
Tests must then be executed on the worst port identified per the procedure below.<br />
Resource Requirements and Test Setup as shown in Appendix E<br />
Test Procedure:<br />
1. Power-on host and ensure test ports are enabled & functional. Run the following on each individual<br />
port.<br />
2. Initiate the OOB-06b sequence from the BERTScope.<br />
3. Connect the host to the <strong>SATA</strong> receptacle<br />
4. Execute TSG-09 while the host is in NRZ idle following OOB and record results for the Total Jitter<br />
(TJ) for each port<br />
Observable Results:<br />
• The “worse port” is identified as that which has the highest TJ value recorded on the measurement above<br />
Serial ATA Logo Group 5 MOI Revision 1.3 Version <strong>1.0</strong> using BERTScope
Test Title: Serial ATA Interop Test Suite Automation<br />
Purpose: The Revision 1.3 Unified Listing tests for PHY and TSG have been automated to provide a repetitive and<br />
fast execution, namely less than 15 minutes for the Serial ATA Interop Test Suite.<br />
Last Modification: January 5, 2009<br />
Discussion: Automation speeds up the measurements and assures repeatability by elimination human interactions.<br />
The tests are executed by use of the PC controller as they are individually described in the following Test Titles. All<br />
tests may therefore be executed manually in absence of a suitable controller. Although BIST “L” loop back is the<br />
preferred mode for the automated Test Suite, the Test Suite does allow for BIST “T,A,S” mode testing as well, The<br />
BERTScope <strong>SATA</strong> Tee Test Fixture additionally allows for testing of PUTs that do not support disconnect.<br />
Resource Requirements and Test Setup as shown in Appendix E: Connect the CR 12500A sub-rate clock output<br />
to the BERTScope clock input using the short SMA Male to SMA Male Cable. Connect the Data Output + and -<br />
ports of the CR 12500A to the Keithley switch ports RA1 and RA4 respectively and the Keithley switch ports R5-<br />
Common and R6 Common respectively to Data Input + and – ports of the BERTScope using the matched pair of 1<br />
meter cables as per the following Figure. Connect both of the B+ and B- ports of i<strong>SATA</strong> receptacle, these are the<br />
pins marked 6 and 5 respectively, to SMA Adapter via the short matched pair of SMA Male to Male Cables to the<br />
respective CR 12500A Data Input + and - ports. Connect the USB cable between the CR12500A and the<br />
BERTScope and connect the controller PC to the BERTScope via the Ethernet connection. Connect the Keithley<br />
switches to each other and to the power combiner, terminations and filter using the 7 six inch cables as per the<br />
following Figure. The Keithley switch is further connected to the controller PC via the Ethernet to GBIP converter.<br />
Test Procedure:<br />
1. Connect controller to the set-up and follow the Serial ATA Interop Test Suite on-screen instructions.<br />
Serial ATA Logo Group 6 MOI Revision 1.3 Version <strong>1.0</strong> using BERTScope
Observable Results:<br />
• The observable results are recorded in an Interop spread sheet compatible format and compared against<br />
Interop test limits for pass/fail indication.<br />
Serial ATA Logo Group 7 MOI Revision 1.3 Version <strong>1.0</strong> using BERTScope
Test Title: PHY-01: Unit Interval<br />
Purpose: Verify that the Product Under Test, PUT, meets the Unit Interval specification of section 7.2.2.1.3 of<br />
Serial ATA revision 2.6 at both 1.5 Gb/s and 3 Gb/s if the PUT claims to support both rates.<br />
Last Modification: January 5, 2009<br />
Discussion: For components which claim to support 3Gb/s, this requirement must be tested at both interface rates<br />
(1.5Gb/s and 3Gb/s). The BERTScope automatically perform the Unit Interval measurement according to section<br />
7.2.2.1.3 of the Serial ATA revision 2.6 based on more than 100,000 UIs.<br />
Resource Requirements and Test Setup as shown in Appendix E.<br />
Test Procedure:<br />
2. Initiate the PUT transmitting the HFTP pattern (D10.2) using either the BIST T,S,A mode or other<br />
suitable method as described in Appendix A.<br />
3. Connect the PUT to the <strong>SATA</strong> receptacle<br />
4. On CR 12500A, choose the appropriate pre-stored selection: “<strong>SATA</strong>1 (1.98)” for 1.5 Gb/s or “<strong>SATA</strong>2<br />
(1.98)” for 3 Gb/s; by pressing “Enter”, scroll to the desired setting and press “Enter” again. On the<br />
CR 12500A also set the sub-rate clock divider to 1 by scrolling to “SubDiv: 4” press “Enter” select “1”<br />
and press “Enter” again.<br />
5. On the BERTScope, Select “View” then “Detector” and click on “Auto Align”.<br />
A pop-up window will appear with the Unit Interval measurement result.<br />
6. Record the measured Unit Interval.<br />
7. If the PUT claim to be capable of running at 3 Gb/s then repeat 1 through 5 of above to get both 1.5<br />
Gb/s and 3 Gb/s measurements.<br />
Observable Results: The pass/fail criteria are:<br />
Serial ATA Logo Group 8 MOI Revision 1.3 Version <strong>1.0</strong> using BERTScope
• PHY-01a: Mean Unit Interval measured shall be between 666.4333ps (min) and 670.2333ps (max) (for<br />
components when running at 1.5Gb/s)<br />
• PHY01b: Mean Unit Interval measured shall be between 333.2167ps (min) and 335.1167ps (max) (for<br />
components claiming to be capable of running at 3Gb/s)<br />
Serial ATA Logo Group 9 MOI Revision 1.3 Version <strong>1.0</strong> using BERTScope
Test Title: PHY-02: Frequency Long Term Stability<br />
Test Title: PHY-03: Spread-Spectrum Modulation Frequency<br />
Test Title: PHY-04: Spread-Spectrum Modulation Deviation<br />
Purpose: Verify that the Product Under Test, PUT, meets the Frequency Long Term Stability specification of<br />
section 7.2.2.1.4; the Spread-Spectrum Modulation Frequency specification of section 7.2.2.1.5; and the Spread-<br />
Spectrum Modulation Deviation specification of section 7.2.2.1.6 and 7.3.3 of Serial ATA revision 2.6.<br />
Last Modification: January 5, 2009<br />
Discussion: These tests are only run once at the maximum interface rate claimed by the component (1.5Gb/s or<br />
3Gb/s). PHY-02 is not applicable to PUTs that support SSC, whereas PHY-03 and PHY-04 are only run on PUTs<br />
claiming support of SSC. The BERTScope CR12500A has a built-in frequency counter that automatically performs<br />
the frequency measurement according to section 7.4.6 of the Serial ATA revision 2.6. The BERTScope CR 12500A<br />
further automatically demodulates the incoming data signal and displays the spread-spectrum modulation waveform<br />
and measures the Spread-Spectrum Repetition and Modulation Frequency over at least 10 cycles using the internal<br />
precision frequency counter according to section 7.4.11 of the Serial ATA revision 2.6.<br />
Resource Requirements and Test Setup as shown in Appendix E.<br />
Test Procedure:<br />
1. Initiate the PUT transmitting the HFTP pattern (D10.2) at the highest of the 1.5 Gb/s or 3 Gb/s that the<br />
PUT claims to capable of using either the BIST T,S,A mode or other suitable method as described in<br />
Appendix A.<br />
2. Connect the PUT to the <strong>SATA</strong> receptacle<br />
3. On CR 12500A, choose the appropriate pre-stored selection: “<strong>SATA</strong>1 (1.98)” for 1.5 Gb/s or “<strong>SATA</strong>2<br />
(1.98)” for 3 Gb/s; by pressing Enter, scroll to the desired setting and press “Enter” again.<br />
4. If the PUT does not claim to support SSC then record the measured CR 12500A frequency counter<br />
measurement to ppm using the following formula: ppm counter = (f counter – f nominal )/f nominal. f nominal is 1.5<br />
GHz for PUTs running at 1.5 Gb/s and 3 GHz for PUTs claiming to be capable of running at 3 Gb/s.<br />
Record ppm counter as the measured Frequency Long Term Stability for PHY-02. If the PUT claims to<br />
support SSC then skip to step 5.<br />
5. This step provides the PHY-03 and PHY-04 measurements which are only run on PUTs claiming<br />
support of SSC. On the BERTScope select “View”, “Physical Layer Tests” then “SSC Waveform”.<br />
Click “run” and wait until the “Average Count” has reached 10. Enable the left side measurement<br />
sidebar by clicks on the “
6. Record Max. Deviation (in ppm) as the measured Frequency Long Term Stability for PHY-02 and Min<br />
Deviation (in ppm) as the measured Spread Spectrum Modulation Deviation for PHY-04 if the PUT is<br />
claimed to be SSC capable.<br />
Observable Results: The pass/fail criteria are:<br />
• PHY-02: The measured Frequency Long Term Stability, ppm counter for PUT claiming not to support SSC<br />
shall be between -350 ppm and 350 ppm.<br />
• PHY-03: The measured Spread-Spectrum Modulation Frequency shall be between 30 kHz and 33 kHz.<br />
• PHY-04a: The measured Maximum Spread-Spectrum Modulation Deviation, Max. Deviation in ppm shall<br />
be less than +350 ppm.<br />
• PHY-04b: The measured Minimum Spread-Spectrum Modulation Deviation, Min. Deviation in ppm shall<br />
be greater than -5350 ppm.<br />
Serial ATA Logo Group 11 MOI Revision 1.3 Version <strong>1.0</strong> using BERTScope
Test Title: TSG-01: Differential Output Voltage<br />
Test Title: TSG-02: Rise/Fall Time<br />
Purpose: Verify that the Product Under Test, PUT, meets the Rise and Fall Time specification of section 7.2.2.3.3<br />
of Serial ATA revision 2.6 while transmitting the HFTP (D10.2) pattern and meets the Differential Output Voltage<br />
specification of section 7.2.2.3.3 of Serial ATA revision 2.6 while transmitting specified patterns, namely HFTP,<br />
MFTP and LBP at both 1.5 Gb/s and 3 Gb/s if the PUT claims to support both rates.<br />
Last Modification: January 5, 2009<br />
Discussion: For components which claim to support 3Gb/s, this requirement must be tested at both interface rates<br />
(1.5Gb/s and 3Gb/s). The BERTScope simultaneously captures the amplitudes for various bits in described set-up<br />
according to section 7.4.2 of the Serial ATA revision 2.6.<br />
Resource Requirements and Test Setup as shown in Appendix E.<br />
Test Procedure:<br />
1. On CR 12500A, choose the appropriate pre-stored selection, which must first have been calibrated to<br />
provide the specified JTF function as per Appendix B: “JTF-<strong>SATA</strong>1” for 1.5 Gb/s or “JTF-<strong>SATA</strong>2”<br />
for 3 Gb/s; by pressing “Enter”, scroll to the desired setting and press “Enter” again.<br />
2. Initiate the PUT transmitting the HFTP pattern using either the BIST L (preferred) or T,S,A mode or<br />
other suitable method as described in Appendix A and Connect the PUT to the <strong>SATA</strong> receptacle<br />
3. On the BERTScope, select “View” then “Physical Layer Test” and “Eye Diagram” and click on “Auto<br />
Center”. Click “Yes” to perform delay line calibrations if prompted by a pop-up window.<br />
1. Click on “Eye Setup” and select “CleanEye” as the “Eye Operating Mode”. Set the pattern length to<br />
“manual” and the value to “80”. Enable the FIR filter as calibrated in Appendix B for the selected<br />
interface rate by clicking on “Eye Setup” then “Enable FIR”; “Configure FIR” and “Load Filter” also<br />
click “Eye Setup” “Configure Measurement” and add “Eye Height” to the measurement list by<br />
highlighting “Eye Height” then click on “>>” and “OK”<br />
.<br />
Serial ATA Logo Group 12 MOI Revision 1.3 Version <strong>1.0</strong> using BERTScope
4. Click on “Run” on the right side bar to start the measurement. Enable the left side measurement<br />
sidebar by clicks on the “
9. On the CR12500A scroll down to “SubDiv; 2”, press “Enter” and scroll to select “1” and click<br />
“Enter”.<br />
10. Repeat 2 through 4 with the PUT initiated transmitting the LBP pattern this time measuring the “Eye<br />
Height” which is the amplitude of the lone bit. Record the measured eye height for the LBP pattern as<br />
VTestLBP.<br />
11. Record the smallest value of DH, DM and VTestLBP as the minimum differential voltage,<br />
VdiffTX(Min) and the largest value of DH, DM and VTestLBP as the maximum voltage,<br />
VdiffTX(Max).<br />
12. If the PUT claims to be capable of running at 3 Gb/s then repeat 1 through 11 of above to get both 1.5<br />
Gb/s and 3 Gb/s measurements.<br />
Observable Results: The pass/fail criteria are:<br />
• The measured minimum differential voltages, VdiffTX(Min), shall both be larger than 400 mV (TSG-01a<br />
at 1.5 Gb/s as well as TSG-01g at 3.0 Gb/s for components claiming to be capable of running at 3Gb/s)<br />
• Each of the measured maximum differential voltages, VdiffTX(Max) are recorded at 1.5 Gb/s as well as at<br />
3.0 Gb/s for components claiming to be capable of running at 3Gb/s, but there is not any pass/fail limit.<br />
• Each of the measured Rise, TSG-02a, and Fall, TSG-02b, Time values shall be less than 273 ps (0.41 UI)<br />
when running at 1.5Gb/s.<br />
• The Rise, TSG-02c, and Fall, TSG-02d, Time values measured at 3 Gb/s (for components claiming to be<br />
capable of running at 3Gb/s) shall be less than 136 ps (0.41 UI)<br />
Serial ATA Logo Group 14 MOI Revision 1.3 Version <strong>1.0</strong> using BERTScope
Test Title: TSG-03: Differential Skew<br />
Purpose: Verify that the Product Under Test, PUT, meets the Differential Skew specification of section 7.2.2.3.4 of<br />
Serial ATA revision 2.6 while transmitting various specified patterns, namely HFTP (D10.2) and MFTP.<br />
Last Modification: January 5, 2009<br />
Discussion: This test is only run once at the maximum interface rate claimed by the component (1.5Gb/s or 3Gb/s).<br />
Differential skew is measured as the difference between the mean of the rising edge in a single-ended eye diagrams<br />
of TX+ and the mean of the falling edge in a single-ended eye diagram of TX–, repeat the measurement this time<br />
measuring the difference between the mean of the rising edge in a single-ended eye diagrams of TX- and the mean<br />
of the falling edge in a single-ended eye diagram of TX+, finally compute the Differential Skew = average of the<br />
magnitude (absolute value) of the two mean skews. This removes the effect of rise-fall imbalance from the skew<br />
measurement in accordance with section 7.4.12 of the Serial ATA revision 2.6.<br />
Resource Requirements and Test Setup as shown in Appendix E: Except connect only the Data Output + port of<br />
the CR 12500A to the Data Input + port of the BERTScope using one of the matched pair of cables. Remember to<br />
terminate the other CR 12500A Data Output port and the unused BERTScope Data Input port with the 50 ohms<br />
Terminations.<br />
Test Procedure:<br />
1. On CR 12500A, choose the pre-stored selection: “JTF-<strong>SATA</strong>1” or “JTF-<strong>SATA</strong>2” corresponding to the<br />
highest data rate supported by the PUT; by pressing “Enter”, scroll to the desired setting and press<br />
“Enter” again. On the CR 12500A also set the sub-rate clock divider to 1 by scrolling to “SubDiv: 4”<br />
press “Enter” select “1” and press “Enter” again.<br />
2. Initiate the PUT transmitting the HFTP pattern (D10.2) at the highest of the 1.5 Gb/s or 3 Gb/s that the<br />
PUT claims to be capable of using either the BIST L (preferred) or T,S,A mode or other suitable<br />
method as described in Appendix A.<br />
3. Connect the PUT to the <strong>SATA</strong> receptacle.<br />
4. On the BERTScope, select “View” then “Physical Layer Test” and “Jitter Peak” and click on the large<br />
purple bar under the image and set the “Operating Mode” to “Single Bit”. Run the jitter measurement<br />
and record the average of the right side and left side mean values. This is the average crossing time of<br />
the rising edge of bit #0.<br />
5. Click on the large purple bar to select “Bit Position (1)” and run the jitter measurement on bit position<br />
#1. Go to the “Show Raw Results” table and record the average of the right side and left side mean<br />
values. This is the average crossing time of the falling edge of bit #0 Click “No” to perform delay line<br />
calibrations if prompted by a pop-up window.<br />
6. Move the cable from the CR 12500A Data Output + port to the CR 12500A Data Output - port.<br />
Remember to terminate the Data Output + port with the 50 ohms Termination.<br />
7. Record the rising edge crossing and falling edge crossing times of the Data Output – port in ps by<br />
repeating steps 4 and 5 above.<br />
Serial ATA Logo Group 15 MOI Revision 1.3 Version <strong>1.0</strong> using BERTScope
8. The absolute difference between the falling level crossing of the Data Output + port and rising level<br />
crossing of the Data Output - port is the mean skew between the falling edge of Data + and the rising<br />
edge of Data -.<br />
9. The absolute difference between the rising level crossing of the Data Output + port and falling level<br />
crossing of the Data Output - port is the mean skew between the rising edge of Data + to the falling<br />
edge of Data -.<br />
10. Compute the Differential Skew = average of the magnitude (absolute value) of the two mean skews.<br />
11. The skew of the matched pair of short SMA Male to SMA Male cables combined with the CR 12500A<br />
Data Input to Data Output paths can be calibrated in any of two simple ways: One way is to switch the<br />
connections to the pins marked 6 and 5 of the <strong>SATA</strong> receptacle and repeat above measurements 5<br />
through 9, the calibrated value is then the average of the two computed differential skews; the other<br />
method is to calibrate per procedure in Appendix B and subtract the calibrated setup skew from the<br />
measured differential skew. All calibration screen shots need to be saved. This is done by clicking on<br />
“Print” and select “Print to file” then create a unique file name for each calibration data including the<br />
serial number of the equipment. Additionally the skew of the <strong>SATA</strong> receptacle to SMA Female<br />
adapter, which is stated on the calibration sheet that comes with the adapter, should also be subtracted.<br />
12. Repeat 2 through 11 with the PUT initiated transmitting the MFTP pattern on bit positions #0 and #2<br />
(there are no transitions on bit # 1 in the MFTP pattern). Return the “Operating Mode’ to “All Bits”<br />
when finished.<br />
Observable Results: The pass/fail criterion is:<br />
• t skewTX measured shall be less than 20 ps for both HFTP, TSG-03a or b, and MFTP, TSG-03c or d,<br />
measurements.<br />
Serial ATA Logo Group 16 MOI Revision 1.3 Version <strong>1.0</strong> using BERTScope
Test Title: TSG-04: AC Common Mode Voltage<br />
Purpose: Verify that the Product Under Test, PUT, meets the AC Common Mode Voltage specification of section<br />
7.2.2.3.5 of Serial ATA revision 2.6 while transmitting a specified patterns, namely MFTP.<br />
Last Modification: January 5, 2009<br />
Discussion: This test requirement is only applicable to components claiming to be capable of running at 3Gb/s. The<br />
AC Common Mode Voltage is a measure of common mode noise other than the CM spikes during transitions due to<br />
TX+/TX- mismatch and skews which are limited by the rise/fall mismatch and other requirements. Separate<br />
channels are used for TX+ and TX- through the CR 12500A where after they are terminated in a power combiner<br />
generating common mode (TX+ + TX-) / 2. This raw common mode shall be filtered with a first order filter having a<br />
cutoff equal to the bitrate / 2 to remove the noise contribution from the edge mismatches. The peak-to-peak voltage<br />
of the filter output is the AC Common Mode Voltage and shall remain below the specified limit in accordance with<br />
section 7.4.17 of the Serial ATA revision 2.6.<br />
Resource Requirements and Test Setup as shown in Appendix E: Except connect the Data Output + and - ports<br />
of the CR 12500A to the symmetrical input ports of the power combiner using the matched pair of cables. Connect<br />
the output of the power combiner to the low pass filter and connect the other end of the low pass filter to the Data<br />
Input + port on the BERTScope. Terminate the Data Input – port on the BERTScope with the 50 ohms termination.<br />
Test Procedure:<br />
1. On CR 12500A, choose the pre-stored selection: “JTF-<strong>SATA</strong>2”; by pressing “Enter”, scroll to the<br />
desired setting and press “Enter” again. On the CR 12500A also set the sub-rate clock divider to 1 by<br />
scrolling to “SubDiv: 4” press “Enter” select “1” and press “Enter” again.<br />
2. Initiate the PUT transmitting the MFTP pattern at 3 Gb/s using either the BIST L (preferred) or T,S,A<br />
mode or other suitable method as described in Appendix A.<br />
3. Connect the PUT to the <strong>SATA</strong> receptacle.<br />
4. On the BERTScope, select “View” then “Physical Layer Test” and “Eye Diagram”. Select “Eye Setup”<br />
then “Configure Measurement” and add “Vpp” to the list by highlighting “Vpp” then click on “>>”<br />
and “OK”<br />
5. On the BERTScope, select “View” then “Physical Layer Test” and “Eye Diagram”. Select “Vpp” and<br />
“Detailed View”. Record the peak-to-peak voltage.<br />
Serial ATA Logo Group 17 MOI Revision 1.3 Version <strong>1.0</strong> using BERTScope
6. Multiply the peak-to-peak voltage with the calibration factor from Appendix B2. The result is the AC<br />
Common Mode Voltage.<br />
Observable Results: The pass/fail criterion is:<br />
• TSG-04: The measured AC Common Mode Voltage shall be less than 50 mVp-p.<br />
Serial ATA Logo Group 18 MOI Revision 1.3 Version <strong>1.0</strong> using BERTScope
Test Title: TSG-05: Rise/Fall Time Imbalance<br />
Test Title: TSG-06: Amplitude Imbalance<br />
Purpose: Verify that the Product Under Test, PUT, meets the Amplitude Imbalance specification of section<br />
7.2.2.3.10 and the Rise/Fall Imbalance specification of section 7.2.2.3.9 of Serial ATA revision 2.6 while<br />
transmitting various specified patterns, namely HFTP (D10.2) and MFTP.<br />
Last Modification: January 5, 2009<br />
Discussion: This test requirement is only applicable to components claiming to be capable of running at 3Gb/s. In<br />
order to determine the imbalance, the single ended amplitudes and, the single ended 20-80% rise and fall times of<br />
both TX+ and TX- shall be determined for a given pattern. The amplitude imbalance value for that pattern is then<br />
calculated by the equation:<br />
absolute value (TX+amplitude – TX-amplitude)/average, where average is (TX+amplitude + TX-amplitude)/2<br />
where all amplitudes are determined according to section 7.4.15 of the Serial ATA revision 2.6.<br />
Two rise/fall time imbalance values for that pattern are then determined by the two equations:<br />
absolute value(TX+,rise – TX-,fall)/average, where average is (TX+,rise + TX-,fall)/2<br />
absolute value(TX+,fall – TX-,rise)/average, where average is (TX+,fall + TX-,rise)/2<br />
according to section 7.4.16 of the Serial ATA revision 2.6.<br />
Resource Requirements and Test Setup as shown in Appendix E: Except connect only the Data Output + port of<br />
the CR 12500A to the Data Input + port of the BERTScope using one of the matched pair of cables. Remember to<br />
terminate the other CR 12500A Data Output port with the 50 ohms Termination.<br />
Test Procedure:<br />
1. On CR 12500A, choose the pre-stored selection: “JTF-<strong>SATA</strong>2”; by pressing “Enter”, scroll to the<br />
desired setting and press “Enter” again. On the CR 12500A also set the sub-rate clock divider to 1 by<br />
scrolling to “SubDiv: 4” press “Enter” select “1” and press “Enter” again.<br />
2. Initiate the PUT in BIST L (preferred) or T,S,A mode transmitting the HFTP pattern (D10.2) at 3 Gb/s<br />
using either the BIST T,S,A mode or other suitable method as described in Appendix A.<br />
3. Connect the PUT to the <strong>SATA</strong> receptacle.<br />
4. On the BERTScope, select “View” then “Physical Layer Test” and “Eye Diagram” and select<br />
“CleanEye” as the “Eye Operating Mode”. Set the pattern length to “manual” and the value to “80”.<br />
Enable the FIR filter as calibrated in Appendix B for the selected interface rate by clicking on “Eye<br />
Setup” then “Enable FIR”; “Configure FIR” and “Load Filter”.<br />
Serial ATA Logo Group 19 MOI Revision 1.3 Version <strong>1.0</strong> using BERTScope
5. Click on “Auto Center”. Click “Yes” to perform delay line calibrations if prompted by a pop-up<br />
window. Right click on the “Amplitude” measurement field on the left side bar and select “Detailed<br />
View”. CleanEye automatically averages more than 10,000 samples. Record the mode amplitude and<br />
the rise and fall time values of TX+.<br />
Serial ATA Logo Group 20 MOI Revision 1.3 Version <strong>1.0</strong> using BERTScope
6. Move the cable from the CR 12500A Data Output + port to the CR 12500A Data Output - port.<br />
Remember to terminate the Data Output + port with the 50 ohms Termination.<br />
7. Repeat 4 through 5.measuring the Amplitude of TX–.<br />
8. Compute the imbalance value for the pattern determined by the equation: absolute value of<br />
(TX+amplitude – TX-amplitude)/average, where average is (TX+amplitude + TX-amplitude)/2<br />
9. Compute the two imbalance values for the pattern determined by the two equations:<br />
absolute value(TX+,rise – TX-,fall)/average, where average is (TX+,rise + TX-,fall)/2<br />
absolute value(TX+,fall – TX-,rise)/average, where average is (TX+,fall + TX-,rise)/2.<br />
10. Repeat 2 through 8 with the PUT initiated transmitting the MFTP pattern.<br />
Observable Results: The pass/fail criterion is:<br />
• The mean Amplitude Imbalances measured shall be less than 10% for both HFTP, TSG-05a and b, and<br />
MFTP, TSG-05c and d, measurements.<br />
• Each pair of the two Rise/Fall Time Imbalances measured shall be less than 20% for both HFTP, TSG-06a,<br />
and MFTP, TSG-06b, measurements.<br />
Serial ATA Logo Group 21 MOI Revision 1.3 Version <strong>1.0</strong> using BERTScope
Test Title: TSG-09: TJ at Connector, Data, f BAUD /500<br />
Test Title: TSG-10: DJ at Connector, Data, f BAUD /500<br />
Purpose: Verify that the Product Under Test, PUT, meets the TJ specification of section 7.2.2.3.11 and 7.3 of Serial<br />
ATA revision 2.6 while transmitting various specified patterns, namely HFTP (D10.2), LBP and optionally if test<br />
time permits SSOP at 1.5 Gb/s.<br />
Last Modification: January 5, 2009<br />
Discussion: For components which claim to support 3 Gb/s, this requirement must be tested at 1.5 Gb/s. The<br />
BERTScope simultaneously measures the TJ and DJ for TSG-09 and TSG-10 using the BERT method according to<br />
section 7.4.8 of the Serial ATA revision 2.6 using the methodology required by the following text of the Serial ATA<br />
Interoperability Program Unified Test Document: “For this test, the methodology of obtaining the results must<br />
follow a filtered TIE based method, similar to that for obtaining results for TSG-11 and TSG-12. In the past, an N-<br />
cycle method was used but is no longer preferred for the use of the interoperability testing.”<br />
Resource Requirements and Test Setup as shown in Appendix E.<br />
Test Procedure:<br />
1. On CR 12500A, choose the pre-stored selection: “JTF-<strong>SATA</strong>1”; by pressing “Enter”, scroll to the<br />
desired setting and press “Enter” again. On the CR 12500A also set the sub-rate clock divider to 1 by<br />
scrolling to “SubDiv: 4” press “Enter” select “1” and press “Enter” again.<br />
2. On the BERTScope, select “View” then “Detector”. Click on “Error Detector”, deselect “Auto<br />
Pattern”. Click on “Error Detector” again, select “Pattern” and click on “User Pattern”.<br />
3. Click on “Error Detector” a third time, select “User Pattern Mode” and click on “Shift”. Click a fourth<br />
time on “Error Detector”, select “Load User Pattern” and select the HFTP pattern.<br />
Serial ATA Logo Group 22 MOI Revision 1.3 Version <strong>1.0</strong> using BERTScope
4. Initiate the PUT transmitting the HFTP pattern using either the BIST L (preferred) or T,S,A mode or<br />
other suitable method as described in Appendix A.<br />
5. Connect the PUT to the <strong>SATA</strong> receptacle<br />
6. On the BERTScope, select “View” then “Physical Layer Test” and “Eye Diagram”, select “CleanEye”<br />
and click on “Auto Align” Click “Yes” to perform delay line calibrations if prompted by a pop-up<br />
window. Set the pattern length to “manual” and the value to “80”, Click run and record the jitter value,<br />
this is Data Dependent Jitter. Make a measurement with the FIR off. Select and turn-on the FIR filter<br />
as calibrated in Appendix B for the selected interface rate by clicking on “Eye Setup” then “Enable<br />
FIR”; “Configure FIR” and “Load Filter”. Calculate the difference between the Jitter measured with<br />
FIR off and FIR on. The difference is the de-embedded jitter caused by cables etc. to be de-embedded<br />
from other jitter measurements.<br />
7. On the BERTScope, select “View” then “Physical Layer Test” and “Jitter Peak” and click on “Auto<br />
Align”. Click the “
The measurement units can be altered from pico seconds to UI by right click on “Total Jitter” on the<br />
left side bar; then click on “Configure”, select “Percentage Unit Interval”, click “OK”.<br />
9. Repeat 4 through 6 with the LBP pattern loaded in the detector and the PUT initiated transmitting the<br />
LBP pattern.<br />
10. Optionally repeat 4 through 6 with the PUT initiated transmitting the SSOP pattern.<br />
Observable Results: The pass/fail criteria are:<br />
• TSG-09a and b: TJ measured must be less than 0.37 UI at 1.5 Gb/s for each of the test patterns.<br />
• TSG-10a and b: DJ measured must be less than 0.19 UI at 1.5 Gb/s for each of the test patterns.<br />
Serial ATA Logo Group 24 MOI Revision 1.3 Version <strong>1.0</strong> using BERTScope
Test Title: TSG-11: TJ at Connector, Clock, 500<br />
Test Title: TSG-12: DJ at Connector, Clock, 500<br />
Purpose: Verify that the Product Under Test, PUT, meets the TJ specification of section 7.2.2.3.12 and 7.3 of Serial<br />
ATA revision 2.6 while transmitting various specified patterns, namely HFTP (D10.2), LBP and optionally if test<br />
time permits SSOP at 3 Gb/s.<br />
Last Modification: January 5, 2009<br />
Discussion: This test requirement is only applicable to components claiming to be capable of running at 3Gb/s. The<br />
BERTScope simultaneously measures the TJ and DJ for TSG-11 and TSG-12 using the BERT method according to<br />
sections 7.4.6 and 7.4.8 of the Serial ATA revision 2.6.<br />
Resource Requirements and Test Setup as shown in Appendix E.<br />
Test Procedure:<br />
1. On CR 12500A, choose the pre-stored selection: “JTF-<strong>SATA</strong>2”; by pressing “Enter”, scroll to the<br />
desired setting and press “Enter” again. On the CR 12500A also set the sub-rate clock divider to 1 by<br />
scrolling to “SubDiv: 4” press “Enter” select “1” and press “Enter” again.<br />
2. On the BERTScope, select “View” then “Detector”. Click on “Error Detector”, deselect “Auto<br />
Pattern”. Click on “Error Detector” again, select “Pattern” and click on “User Pattern”.<br />
3. Click on “Error Detector” a third time, select “User Pattern Mode” and click on “Shift”. Click a fourth<br />
time on “Error Detector”, select “Load User Pattern” and select the HFTP pattern.<br />
Serial ATA Logo Group 25 MOI Revision 1.3 Version <strong>1.0</strong> using BERTScope
4. Initiate the PUT transmitting the HFTP pattern at 3 Gb/s using either the BIST L (preferred) or T,S,A<br />
mode or other suitable method as described in Appendix A.<br />
5. Connect the PUT to the <strong>SATA</strong> receptacle<br />
6. On the BERTScope, select “View” then “Physical Layer Test” and “Eye Diagram”, select “CleanEye”<br />
and click on “Auto Align” Click “Yes” to perform delay line calibrations if prompted by a pop-up<br />
window. Set the pattern length to “manual” and the value to “80”, Turn-on the Jitter measurement and<br />
record the jitter value, this is Data Dependent Jitter. Make a measurement with the FIR off. Select and<br />
turn-on the FIR filter as calibrated in Appendix B for the selected interface rate by clicking on “Eye<br />
Setup” then “Enable FIR”; “Configure FIR” and “Load Filter”. Calculate the difference between the<br />
Jitter measured with FIR off and FIR on. The difference is the de-embedded jitter caused by cables etc.<br />
to be de-embedded from other jitter measurements.<br />
7. On the BERTScope, select “View” then “Physical Layer Test” and “Jitter Peak” and click on “Auto<br />
Align”. Click the “
The measurement units can be altered from pico seconds to UI by right click on “Total Jitter” on the<br />
left side bar; then click on “Configure”, select “Percentage Unit Interval”, click “OK”.<br />
9. Repeat 4 through 6 with the LBP pattern loaded in the detector and the PUT initiated transmitting the<br />
LBP pattern.<br />
10. Optionally repeat 4 through 6 with the PUT initiated transmitting the SSOP pattern.<br />
Observable Results: The pass/fail criteria are:<br />
• TSG-11a and b: TJ measured must be less than 0.37 UI at 3 Gb/s for each of the test patterns.<br />
• TSG-12a and b: DJ measured must be less than 0.19 UI at 3 Gb/s for each of the test patterns.<br />
Serial ATA Logo Group 27 MOI Revision 1.3 Version <strong>1.0</strong> using BERTScope
Test Title: OOB-01: OOB Signal Detection Threshold<br />
Purpose: Verify that the Product Under Test, PUT, meets the OOB Signal Detection Threshold specification of<br />
section 7.2.2.7.1 and 7.4.20 of Serial ATA revision 2.6.<br />
Last Modification: October 30, 2008<br />
Discussion: This test requirement must be tested at both data rates 1.5 Gb/s and 3.0 Gb/s for PUTs claiming to be<br />
capable of running at 3Gb/s. The BERTScope transmits the COMRESET/COMINT sequence of 6<br />
COMRESET/COMINIT bursts with 480 UI gaps followed by a 45,000 UI gap and captures the 2 ms response for<br />
analysis according to sections 7.4.20 and 7.4.8 of the Serial ATA revision 2.6.<br />
The amplitude of the COMRESET/COMINIT burst is set for 210 mV and respectively 40 mV for 1.5 Gb/s and 60<br />
mV for PUTs claiming to support 3 Gb/s. The PUT is expected to respond to the 210 mV burst and not respond to<br />
respectively the 40 mV or the 60 mV bursts.<br />
Resource requirements and setup for OOB are shown in Appendix E.<br />
Test Procedure:<br />
1. On BERTScope select “View” then “Generator” set the “Synthesizer” to 1.5 GHz and click on the<br />
“Clock Output” icon to enable these at full rate (divide by 1),<br />
2. Click on “Pattern”, deselect “Track Detector Pattern” and click on “User Pattern” to select user pattern.<br />
Then click on “Pattern” and “Load User Pattern” to select the OOB-01_COMRESET pattern from the<br />
<strong>SATA</strong> library.<br />
3. Connect the PUT to the <strong>SATA</strong> receptacle<br />
4. Initially enable the Data Output + (unlink and disable the Data Output – port) at V low equal 0 V and<br />
V high equal 1.4 V which will provide approximately 210 mV at the PUT. The amplitude must be<br />
verified during initial calibration by connecting to the BERTScope data input port.<br />
5. On the BERTScope, select “View” then “Editor” and “File” and click on “Capture by Length”. Enter<br />
the length equivalent to 5 times the OOB-01_COMRESET pattern, i.e. enter 30,525 words, which<br />
correspond to longer than 2 ms when prompted. Wait until data has been collected. Scroll down to see<br />
if the PUT repeatable responded with a correct COMINIT device or COMWAKE (host) each of which<br />
are 6 bursts of 160 UI of either 1010 or Align with respectively 480 UI or 160 UI of gaps.<br />
Serial ATA Logo Group 28 MOI Revision 1.3 Version <strong>1.0</strong> using BERTScope
6. Repeat step 6 above with the Data Outputs set at the desired amplitudes which provide respectively 40<br />
mV and 60 mV (if the PUT claims to support 3 Gb/s) at the PUT. The PUT is not expected to respond<br />
to the test with low amplitudes. In case the PUT supports asynchronous signal recovery (ASR), it is<br />
possible that the PUT may transmit COMINIT pro-actively and not in direct response to COMRESET.<br />
Therefore if a response is recorded in step 7 then repeat step 6 at both high and low amplitudes to<br />
determine that the COMINIT is in response to the COMRESET sent by the BERTScope.<br />
Observable Results: The pass/fail criteria are:<br />
• For products running at 1.5Gb/s:<br />
o OOB-01a - Verification of no product COMINIT/COMRESET detection at 40mV<br />
o OOB-01b - Verification of product COMINIT/COMRESET detection at 210mV<br />
o If any of the above cases fails, this is considered a failure by the product.<br />
• For products running at 3Gb/s:<br />
o OOB-01c - Verification of no product COMINIT/COMRESET detection at 60mV<br />
o OOB-01d - Verification of product COMINIT/COMRESET detection at 210mV<br />
o If any of the above cases fails, this is considered a failure by the product.<br />
Serial ATA Logo Group 29 MOI Revision 1.3 Version <strong>1.0</strong> using BERTScope
Test Title: OOB-02: UI During OOB Signaling<br />
Test Title: OOB-03: COMINIT/COMRESET and COMWAKE Transmit Burst Length<br />
Purpose: Measure the UI during OOB Signaling and verify that the Product Under Test, PUT, return<br />
COMINIT/COMRESET and COMWAKE with correct transmit burst length during OOB Signaling specification of<br />
section 7.2.2.7.2, 7.2.2.7.3 and 7.4.21 of Serial ATA revision 2.6.<br />
Last Modification: October 30, 2008<br />
Discussion: This test requirement is only tested at the maximum data rates 1.5 Gb/s and 3.0 Gb/s for PUTs claiming<br />
to be capable of running. The BERTScope transmits the COMRESET/COMINT sequence of 6<br />
COMRESET/COMINIT 160 UI bursts with 480 UI gaps followed by a 45,000 UI gap and captures the 2 ms<br />
response for analysis according to sections 7.4.11 and 7.4.21 of the Serial ATA revision 2.6.<br />
The COMINIT/COMRESET and COMVAKE transmit burst length are measured at +100 mV and -100 mV offsets.<br />
There are four different patterns allowed for OOB signaling; namely Align with positive or negative disparity and<br />
D24.3 with positive or negative disparity.<br />
Resource requirements and setup for OOB are shown in Appendix E.<br />
Test Procedure:<br />
1. On BERTScope select “View” then “Generator” set the “Synthesizer” to 1.5 GHz and click on the<br />
“Clock Output” icon to enable these at full rate (divide by 1),<br />
2. Click on “Pattern”, deselect “Track Detector Pattern” and click on “User Pattern” to select user pattern.<br />
Then click on “Pattern” and “Load User Pattern” to select the OOB-01_COMRESET pattern from the<br />
<strong>SATA</strong> library.<br />
3. Connect the PUT to the <strong>SATA</strong> receptacle<br />
4. Enable the Data Output + (unlink and disable the Data Output – port) at V low equal 0 V and V high equal<br />
2 V which will provide approximately 300 mV at the PUT.<br />
5. On the BERTScope, select “View” then “Detector”. Click on “Error Detector”, click on “Pattern<br />
(User)” and select and select the “All_Zeros” pattern. . Click “Yes” to perform delay line calibrations<br />
if prompted by a pop-up window.<br />
6. Select the “Eye Diagram” view. Click on “Configure” and choose “Cursors” Select the “Single<br />
Cursor” and set it at 100 mV in the center of the eye. Stop the Eye Diagram from running. Click on<br />
“Configure” and “Cursors” again and choose the cursor to be the “Sampling Point”<br />
7. Switch to “View” “Error Location Analysis” and select “BER” Set the “Burst Error Free Threshold to<br />
32. Then proceed to run “Burst Error Length” view. Stop the run when the resulting histogram shows<br />
the distribution of at least 10 (minimum 5 COMINIT/COMRESET and 5 COMVAKE) OOB-03 burst<br />
lengths relative to the 666.666 ps Unit Interval (UI) at the nominal 1.5 Gb/s rate.<br />
Serial ATA Logo Group 30 MOI Revision 1.3 Version <strong>1.0</strong> using BERTScope
8. Use the “Bit Cursors” from “Chart Setup” to record the number of hits per burst length. Calculate the<br />
mean of the burst length (in UI).<br />
9. Repeat steps 6 through 8 above but with the threshold set to -100 mV and the detector pattern inverted<br />
so that it becomes “all ones”.<br />
10. Calculate the average of the burst lengths measured at +100 mV and -100 mV and multiply with the<br />
normalized UI namely 0.675106 ns (which takes into account that the average of the burst lengths<br />
measured at +100 mV and -100 mV is 158 UI) to get the burst length of the PUT in ns for the OOB-03<br />
measurement.<br />
11. Divide the burst length obtained in step 10 by 160 to get the Unit Interval during OOB for the OOB-02<br />
measurement.<br />
12. Hosts respond to the COMINIT plus COMVAKE test pattern by returning only a COMVAKE. It is<br />
therefore necessary to make one more measurement for hosts. Most hosts asynchronously send the<br />
COMRESET bursts for these it is easy to merely repeat steps 6 through 8 above but without sending<br />
the OOB test pattern to the host. All hosts send the COMRESET when the hosts first boots. The<br />
technique in OOB-01 can therefore be used for all other hosts to capture the COMRESET from the<br />
hosts and count the average burst length.<br />
Observable Results: The pass/fail criteria are:<br />
OOB-02:<br />
o Mean UI OOB measured to be between 646.67 ps and 686.67 ps over entire OOB burst<br />
OOB-03:<br />
o Burst Length measured to be between 103.5 ns and 109.9 ns<br />
Serial ATA Logo Group 31 MOI Revision 1.3 Version <strong>1.0</strong> using BERTScope
Test Title: OOB-04: COMINIT/COMRESET Transmit Gap Length<br />
Test Title: OOB-05: COMWAKE Transmit Gap Length<br />
Purpose: Verify that the Product Under Test, PUT, return COMINIT/COMREST and COMWAKE with correct gap<br />
length during OOB Signaling specification of section 7.2.2.7.4, 7.2.2.7.5 and 7.4.21 of Serial ATA revision 2.6.<br />
Last Modification: March 9, 2009<br />
Discussion: This test requirement is only tested at the maximum data rates 1.5 Gb/s and 3.0 Gb/s for PUTs claiming<br />
to be capable of running. The BERTScope transmits the COMRESET/COMINT sequence of 6<br />
COMRESET/COMINIT 160 UI bursts with 480 UI gaps followed by a 45,000 UI gap and captures the 2 ms<br />
response for analysis according to sections 7.4.2.1 of the Serial ATA revision 2.6.<br />
The COMINIT/COMRESET and COMVAKE transmit gap length are measured at +100 mV and -100 mV offsets.<br />
Resource requirements and setup for OOB are shown in Appendix E.<br />
Test Procedure:<br />
1. On BERTScope select “View” then “Generator” set the “Synthesizer” to 1.5 GHz and click on the<br />
“Clock Output” icon to enable these at full rate (divide by 1),<br />
2. Click on “Pattern”, deselect “Track Detector Pattern” and click on “User Pattern” to select user pattern.<br />
Then click on “Pattern” and “Load User Pattern” to select the OOB-01_COMRESET pattern from the<br />
<strong>SATA</strong> library.<br />
3. Connect the PUT to the <strong>SATA</strong> receptacle<br />
4. Enable the Data Output + (unlink and disable the Data Output – port) at V low equal 0 V and V high equal<br />
2 V which will provide approximately 300 mV at the PUT.<br />
5. On the BERTScope select the “Eye Diagram” view. Click on “Configure” and choose “Cursors” Select<br />
the “Single Cursor” and set it at 100 mV in the center of the eye. Stop the Eye Diagram from running.<br />
Click on “Configure” and “Cursors” again and choose the cursor to be the “Sampling Point”<br />
6. Select “View” then “Editor” and “File” and click on “Capture by Length”. Enter the capture length<br />
“11,255” words when prompted. Wait until data has been collected. Scroll down to see the<br />
COMINIT/COMRESET and COMWAKE burst of the PUT response. Count the average number of<br />
UIs of respectively the COMINIT/COMRESET and the COMVAKE gaps. The BERTScope Editor<br />
conveniently groups the data into 32 bits. 5 groups therefore correspond to 160 UI and 15 groups<br />
correspond to 480 UI. It is easiest to view the additional number of UIs when using binary<br />
representation, which can be selected in the “Edit” menu.<br />
7. Repeat steps 6 through 8 above but with the threshold set to -100 mV.<br />
8. Calculate the average of the gap lengths measured at +100 mV and -100 mV and multiply with the<br />
normalized UI namely 0.675106 ns (which takes into account that the average of the burst lengths<br />
measured at +100 mV and -100 mV is 158 UI) to get the gap lengths of the PUT in ns for the OOB-04<br />
and OOB-05 measurements<br />
Observable Results: The pass/fail criteria are:<br />
OOB-04:<br />
o COMINIT/COMRESET Transmit Gap Length measured to be between 310.4 ns and 329.6 ns<br />
OOB-05:<br />
o COMVAKE Transmit Gap Length measured to be between 103.5 ns and 109.9 ns<br />
Serial ATA Logo Group 32 MOI Revision 1.3 Version <strong>1.0</strong> using BERTScope
Test Title: OOB-06: COMWAKE Gap Detection Windows<br />
Purpose: Verify that the Product Under Test, PUT, consistently enter speed negotiation for COMWAKE gap values<br />
between 155 UI and 165 UI and does not enter speed negotiation for COMWAKE gap values of 45 and 266 UI<br />
during OOB signaling per section 7.2.2.7.6 and 7.2.21 of Serial ATA revision 2.6.<br />
Last Modification: March 9, 2009<br />
Discussion: This test requirement is only tested at the maximum data rates 1.5 Gb/s and 3.0 Gb/s for PUTs claiming<br />
to be capable of running. The BERTScope transmits the COMRESET/COMINT sequence of 6<br />
COMRESET/COMINIT 160 UI bursts with 480 UI gaps followed by a 45,000 UI gap plus a sequence of 6<br />
COMWAKE 160 UI bursts with 160 UI gaps followed by a 130,000 UI gap and captures the 2 ms response for<br />
analysis according to sections 7.4.11 of the Serial ATA revision 2.6.<br />
Resource requirements and setup for OOB are shown in Appendix E.<br />
Test Procedure:<br />
1. On BERTScope select “View” then “Generator” set the “Synthesizer” to 1.5 GHz and click on the<br />
“Clock Output” icon to enable these at full rate (divide by 1),<br />
2. Click on “Pattern”, deselect “Track Detector Pattern” and click on “User Pattern” to select user pattern.<br />
Then click on “Pattern” and “Load User Pattern” to select the OOB-06_45Gap_COMVAKE pattern<br />
from the <strong>SATA</strong> library.<br />
3. Connect the PUT to the <strong>SATA</strong> receptacle<br />
4. Enable the Data Output + (unlink and disable the Data Output – port) at V low equal 0 V and V high equal<br />
2 V which will provide approximately 300 mV at the PUT.<br />
5. On the BERTScope, select “View” then “Editor” and “File” and click on “Capture by Length”. Enter<br />
the capture length “11,255” words when prompted. Wait until data has been collected. Scroll down to<br />
see if the PUT entered speed negotiation. Speed negotiation comes after the returned COMVAKE<br />
signaling and looks like a series of ALIGN symbols starting at the highest supported speed and shifting<br />
down every 54.6 us until the lowest speed is reaches if the PUT is a device. The hex representation of<br />
the repeated ALIGN symbols in the capture will be one of the following eight depending on the bit<br />
offset (1 out of 4 possible) and the disparity (1 out of 2 possible): 3E9555549C, 7D2AAAA938,<br />
FA55555270, 1F4AAAAA4E, C155555763, 82AAAAAEC7, 0555555D8F or E0AAAAABB1.<br />
Speed negotiation from a host comes after the returned COMVAKE signaling and looks like a series of<br />
D10.2 (0101010101 in binary or aaaaa or 5555 in hex) at the lowest speed if the PUT is a host.<br />
6. Repeat above using each of the following pattern and associated capture length<br />
Pattern<br />
OOB06_45Gap_COMVAKE<br />
OOB06_155Gap_COMVAKE<br />
OOB06_165Gap_COMVAKE<br />
OOB06_266Gap_COMVAKE<br />
Capture Length<br />
11,255 words<br />
45,185 words<br />
2,825 words<br />
22,585 words<br />
Observable Results: The pass/fail criteria are:<br />
OOB-06a:<br />
o The PUT did not enter speed negotiation in response to the OOB06a_COMVAKE_45 pattern<br />
which has a COMVAKE gap of 45 UI.<br />
OOB-06b:<br />
o The PUT did enter speed negotiation in response to the OOB06a_COMVAKE_155 pattern which<br />
has a COMVAKE gap of 155 UI.<br />
OOB-06c:<br />
o The PUT did enter speed negotiation in response to the OOB06a_COMVAKE_165 pattern which<br />
has a COMVAKE gap of 165 UI.<br />
OOB-06d:<br />
o The PUT did not enter speed negotiation in response to the OOB06a_COMVAKE_266 pattern<br />
which has a COMVAKE gap of 266 UI.<br />
Serial ATA Logo Group 33 MOI Revision 1.3 Version <strong>1.0</strong> using BERTScope
Test Title: OOB-07: COMINIT Gap Detection Windows<br />
Purpose: Verify that the Product Under Test, PUT consistently responds to each COMINIT/COMRESET having<br />
gap windows between 459 UI and 501 UI and does not respond to COMINIT/COMRESET having gap windows of<br />
259 UI and 791 UI during OOB signaling per section 7.2.2.7.7 and 7.2.21 of Serial ATA revision 2.6.<br />
Last Modification: March 9, 2009<br />
Discussion: This test requirement is only tested at the maximum data rates 1.5 Gb/s and 3.0 Gb/s for PUTs claiming<br />
to be capable of running. The BERTScope transmits the COMRESET/COMINT sequence of 6<br />
COMRESET/COMINIT 160 UI bursts with 480 UI gaps followed by a 45,000 UI gap and captures the 2 ms<br />
response for analysis according to sections 7.4.11 of the Serial ATA revision 2.6.<br />
Resource requirements and setup for OOB are shown in Appendix E.<br />
Test Procedure:<br />
1. On BERTScope select “View” then “Generator” set the “Synthesizer” to 1.5 GHz and click on the<br />
“Clock Output” icon to enable these at full rate (divide by 1),<br />
2. Click on “Pattern”, deselect “Track Detector Pattern” and click on “User Pattern”. Then click on<br />
“Pattern” and “Load User Pattern” to select the OOB-07_259Gap_COMRESET_COMINIT pattern<br />
from the <strong>SATA</strong> library.<br />
3. Connect the PUT to the <strong>SATA</strong> receptacle<br />
4. Enable the Data Output + (unlink and disable the Data Output – port) at V low equal 0 V and V high equal<br />
2 V which will provide approximately 300 mV at the PUT.<br />
5. On the BERTScope, select “View” then “Editor” and “File” and click on “Capture by Length”. Enter<br />
the capture length “47,255” words when prompted. Wait until data has been collected. Scroll down to<br />
see if the PUT repeatable responded with a correct COMINIT (if the PUT is a device) or COMWAKE<br />
(if the PUT is a host). COMINIT is a sequence of six 160 bit bursts with five 480 UI gaps.<br />
COMWAKE is a sequence of six 160 bit bursts with five 160 UI gaps.<br />
6. Repeat above using each of the following pattern and associated capture length<br />
Pattern<br />
OOB07_259Gap_COMRESET_COMINIT<br />
OOB07_459Gap_COMRESET_COMINIT<br />
OOB07_501Gap_COMRESET_COMINIT<br />
OOB07_791Gap_COMRESET_COMINIT<br />
Capture Length<br />
47,255 words<br />
48,255 words<br />
48,465 words<br />
49,915 words<br />
Observable Results: The pass/fail criteria are:<br />
OOB-07a:<br />
o The PUT did not respond to each COMINIT/COMRESET in the OOB07a_COMINIT_259 pattern<br />
which has a COMINIT/COMRESET gap of 259 UI.<br />
OOB-07b:<br />
o The PUT did respond to each COMINIT/COMRESET in the OOB07b_COMINIT_459 pattern<br />
which has a COMINIT/COMRESET gap of 459 UI.<br />
OOB-07c:<br />
o The PUT did respond to each COMINIT/COMRESET in the OOB07c_COMINIT_501 pattern<br />
which has a COMINIT/COMRESET gap of 501 UI.<br />
OOB-07d:<br />
o The PUT did not respond to each COMINIT/COMRESET in the OOB07d_COMINIT_791 pattern<br />
which has a COMINIT/COMRESET gap of 791 UI.<br />
Serial ATA Logo Group 34 MOI Revision 1.3 Version <strong>1.0</strong> using BERTScope
Appendix A: Initiation of PUT using BIST modes.<br />
Purpose: The PUT is placed in one of two BIST modes, namely T+S+A or L and programmed with the<br />
desired test pattern as an initiation before the BERTScope measurements.<br />
References:<br />
1. Serial ATA Revision_2.6, section 10.3.9 BIST Active<br />
2. U-Link Operating Help Files<br />
Resource Requirements:<br />
• Stimulus Tool: Any device or system capable of :<br />
i. Generating <strong>SATA</strong> OOB, negotiate speed and bringing the PUT to a state where it can<br />
receive a BIST Activate FIS.<br />
ii. Generating the required BIST Activate FIS, T,S,A or L respectively.<br />
Examples of Stimulus Tools:<br />
• BERTScope 7500B<br />
• Intel ICH7 based computer with U-Link DriveMaster 2006 software version 3.0.198e or later.<br />
• SCT-BIST Drive<br />
• Serial ATA Protocol Generator/Analyzer<br />
a. JDSU Xgig<br />
Last Modification: October 30, 2008<br />
Discussion: The BERTScope acts as a monitoring tool fully capable of verifying the patterns transmitted<br />
by the PUT and can also generate <strong>SATA</strong> OOB, negotiate speed and bring the PUT to a state where it can<br />
register and receive a BIST Activate FIS in according to section 10.3.9 of the Serial ATA revision 2.5.<br />
When the BERTScope is used then there is no need for the <strong>SATA</strong> Tee as there will not be any disconnects.<br />
The advantage of using a ULink BIST Initiation tool is that the combination of BERTScope and ULink<br />
provides a complete Digital and PHY/TSG/OOB and RSG test solution.<br />
Test Setup: Stimulus Tool with an i<strong>SATA</strong> cable.<br />
Test Procedure:<br />
1. Connect PUT to the Stimulus Tool using the <strong>SATA</strong> cable.<br />
2. Make sure that the Stimulus Tool is turned on and ready.<br />
3. Allow the PUT to power up and go through OOB.<br />
4. Initiate speed negotiation using the Stimulus Tool if change of speed is required.<br />
5. Generate a BIST Active FIS with the appropriate bits set for either BIST T, A, S, including<br />
the pattern words or BIST L (preferred) as required using the Stimulus Tool.<br />
Serial ATA Logo Group 35 MOI Revision 1.3 Version <strong>1.0</strong> using BERTScope
Example Using the U-Link Stimulus Tool:<br />
1. Start the U-Link program<br />
2. Click “Power Up” and observe the power supply spin up. Leave it on.<br />
3. Click “Ctl<strong>SATA</strong>”<br />
4. Click COMRESET and observe that COMRESET was received on the log on the right side of<br />
the DriveMaster window.<br />
5. Select the appropriate data rate “1” or “2” and observe that the “RDSTATUS” displays<br />
“00000113” or “00000123” for 1.5 Gb/s and 3 Gb/s respectively.<br />
6. Select the appropriate “BIST mode T, S, A” for PHY and TSG Testing or “BIST mode L” for<br />
RTL Testing<br />
7. When initiating PHY or TSG tests; select the desired pattern from the list.<br />
8. Click “BIST” and observe that “BIST FIS SUCEEDED” is displayed in the lower left corner<br />
of the <strong>SATA</strong> Control Panel.<br />
9. PUT should now be ready for test.<br />
Possible Issues: Some PUTs may require sequences of ALIGN words before the desired pattern. This can<br />
be accomplished by using the pattern sequencing on the BERTScope having the B pattern be ALIGNs,<br />
which is then run once by a click on “Page Switch” followed by the A pattern, i.e. the desirable test pattern.<br />
AB patterns are pre-stored on the BERTScope for this purpose.<br />
If the PUT lacks support of physical disconnect then a pair of couplers or power dividers<br />
are needed to be able to communicate with the PUT using the U-Link software on the computer and the<br />
BERTScope without physical disconnect.<br />
Serial ATA Logo Group 36 MOI Revision 1.3 Version <strong>1.0</strong> using BERTScope
Appendix B1: Calibration of Test Setup Differential Skew.<br />
Purpose: Calibration of the skew between the Data + and Data - paths can improve the accuracy of the<br />
differential skew test in TSG-03.<br />
Last Modification: January 5, 2009<br />
Discussion: The skew between the Data + and Data - matched pair of short SMA Male to SMA Male<br />
cables combined with the CR 12500A Data Input to Data Output paths can directly increase or decrease the<br />
measured differential skew of the PUT. This calibration removes the effect of these skews from the test.<br />
The calibration reference plane is the SMA interface where the <strong>SATA</strong> receptacle connects to the test setup.<br />
Resource Requirements and Calibration Setup as shown in Appendix E: Except the BERTScope clock<br />
output is connected to the BERTScope clock input using the short SMA Male to SMA Male Cable.<br />
Initially connect the BERTScope Data Output + port via the short matched pair of SMA Male to Male<br />
Cables to the DUT Input + side of the <strong>SATA</strong> Tee in place of the <strong>SATA</strong> receptacle (connect to the short<br />
matched cables that connect to the CR 12500A Data Input + port if the <strong>SATA</strong> Tee is not used). Terminate<br />
the <strong>SATA</strong> Tee (or CR 12500A) Data Input - port with a 50 ohms termination. Disconnect the long matched<br />
cable that connects to the CR 12500A Data Output – and BERTScope Data Input – ports and terminate the<br />
CR 12500A Data Output - and the BERTScope Data Input - ports with the 50 ohms terminations. The<br />
BERTScope Data Output + port is now single ended connected via all the plus side cables and CR to the<br />
BERTScope Data Input + port.<br />
Calibration Procedure:<br />
1. Use the MFTP pattern, but generated by the pattern generator of the BERTScope Data Output<br />
+ port. The MFTP pattern is pre-loaded on the BERTScope in “View”, then “Generator”,<br />
click on “Pattern”, “User Pattern”, “Load User File” then “<strong>SATA</strong> II” to select a pattern then<br />
click “Enable Outputs”.<br />
2. On the BERTScope, select “View” then “Physical Layer Test” and “Eye Diagram” choose<br />
“CleanEye” from the “Eye Setup” menu and click on “Auto Center”. Click “Yes” to perform<br />
delay line calibrations if prompted by a pop-up window. Zoom in on the right most crossing<br />
by clicking on it and dragging it to the center of the display.<br />
3. Click on “Eye Setup” on the BERTScope then “Cursors” and select “Time Cursors”. Place<br />
one cursor at the mid point of the rising edge. Place the second cursor near by and zoom in on<br />
the mid point by changing the time and/or voltage scale. It is desirable to allow the time scale<br />
to show a full 20 ps to either side of the mid point cursor.<br />
4. Move the cable from the BERTScope Data Output + port to the DUT Input – side of the<br />
<strong>SATA</strong> Tee (or if no <strong>SATA</strong> Tee is used; connect to the short matched of SMA Male to Male<br />
Cables that is associated with and connects to the CR 12500A Data Input – port). Terminate<br />
the <strong>SATA</strong> Tee (or CR 12500A) Data Input + port with the 50 ohms termination. Disconnect<br />
the long matched cable at the CR 12500A Data Output + port and connect this cable to the CR<br />
12500A Data Output – port. Terminate the CR 12500A Data Output + port with 50 ohms.<br />
Leave the BERTScope Data Input - port terminated with 50 ohms. The BERTScope Data<br />
Output + port is now single ended connected via all the minus side short matched cable and<br />
CR to the BERTScope Data Input + port using the long matched cable associated with the<br />
BERTScope Data Input + port. This eliminates all generator, long matched cable and detector<br />
elements from the calibration as they are used for both measurements.<br />
5. Place the second cursor at the mid point of the rising edge. The delta between the first and<br />
second cursor is the skew between the Data + and Data - matched pair of short SMA Male to<br />
SMA Male cables combined with the CR 12500A Data Input to Data Output paths. All<br />
calibration screen shots need to be saved by clicking on “Print” and select “Print to file” then<br />
create a unique file name for each calibration data including the equipment serial number.<br />
Observable Results: Record the calibrated differential skew for this value and the skew of the <strong>SATA</strong><br />
receptacle test report to be subtracted from the measured differential skew in TSG-03.<br />
Serial ATA Logo Group 37 MOI Revision 1.3 Version <strong>1.0</strong> using BERTScope
Appendix B2: Calibration of Test Setup AC Common Mode.<br />
Purpose: Calibration of the AC Common Mode insertion loss for TSG-04 measurements.<br />
Last Modification: October 14, 2009<br />
Discussion: The ratio of a 100 mV reference to the measured signal on the BERTScope is the inverse of<br />
the insertion loss. The measured data are then scaled with this factor to obtain the actual values. This<br />
calibration removes the effect of AC common mode insertion loss from the test. The reference plane for the<br />
calibrations is the SMA interface where the <strong>SATA</strong> receptacle connects to the test setup.<br />
Resource Requirements and Calibration Setup as shown in Appendix E: Except the BERTScope clock<br />
output is connected to the BERTScope clock input using the short SMA Male to SMA Male Cable.<br />
Connect the BERTScope Data Output + and Data Output - ports to the DUT Input ports of the <strong>SATA</strong> Tee<br />
(or to the short matched pair of SMA Male to Male Cables that connects to the CR 12500A Data Input<br />
ports if the <strong>SATA</strong> Tee is not used). Connect the Data Output + and - ports of the CR 12500A to the<br />
symmetrical input ports of the power combiner using the matched pair of cables. Connect the output of the<br />
power combiner to the low pass filter and connect the other end of the low pass filter to the Data Input +<br />
port on the BERTScope. Terminate the Data Input – port on the BERTScope with the 50 ohms termination.<br />
Calibration Procedure:<br />
1. The common mode insertion loss can be calibrated by simply applying a MFTP pattern from<br />
the BERTScope Data Outputs with 100 mV of common mode sinusoidal interference turned<br />
on to test setup; namely through the matched pair of short SMA Male to SMA Male cables<br />
combined with the CR 12500A Data Input to Data Output paths ways, power combiner and<br />
low pass filter. The ratio of the 100 mV to the measured calibration signal on the BERTScope<br />
is the inverse of the insertion loss. The measured data are then scaled with this factor to obtain<br />
the actual values. All calibration screen shots need to be saved. This is done by clicking on<br />
“Print” and select “Print to file” then create a unique file name for each calibration data<br />
including the serial number of the equipment.<br />
Observable Results: Record the ratio of the 100 mV reference to the measured signal. Measured data are<br />
then scaled with this factor to obtain the actual values in TSG-04.<br />
Appendix B3: Calibration of Test Setup De-embedding.<br />
Purpose: Measurement of the test setup insertion loss for de-embedding to the reference plane at the SMA<br />
side of the <strong>SATA</strong> receptacle. This applies to all TSG measurements except TSG-04 which is a common<br />
mode test.<br />
Last Modification: Mach 29, 2010<br />
Discussion: The BERTScope is used to generate and capture the step response of the path through cables<br />
and other components to the BERTScope detector input. Fast Fourier Transformation (FFT) is applied to<br />
the step response, which is then subtracted from the FFT of a reference step response to get the insertion<br />
loss of the path. The BERTScope FIR Explorer software then calculates an FIR filter then compensates for<br />
the insertion loss. The reference plane for the calibrations is the SMA interface where the <strong>SATA</strong> receptacle<br />
connects to the test setup. This FIR filter is applied during TSG measurements, except TSG04, which is a<br />
common mode test.<br />
Resource Requirements and Calibration Setup as shown in Appendix E: Except the BERTScope clock<br />
output is connected to the BERTScope clock input using the short SMA Male to SMA Male Cable.<br />
Initially connect the BERTScope Data Outputs to the Data Inputs of the entire test setup; namely through<br />
the matched pair of short SMA Male to SMA Male cables connected via a pair of 50 ohms SMA female-tofemale<br />
adapters to the reference plane where the <strong>SATA</strong> receptacle connects. Later the short matched pair of<br />
Data Output cables will be connected directly to the BERTScope Data Inputs for a reference measurement.<br />
Serial ATA Logo Group 38 MOI Revision 1.3 Version <strong>1.0</strong> using BERTScope
Calibration Procedure:<br />
1. Set the data rate to 1.5 Gb/s by clicking on “Synthesizer” and set the Clock frequency to 1.5<br />
Gbps.<br />
2. Load the 32-zeros-64ones-32-zeros pattern in the generator and detector pattern memories.<br />
The patterns are pre-loaded on the BERTScope in “View”, then “Generator”, click on<br />
“Pattern”, “User Pattern”, “Load User File” then “<strong>SATA</strong> II” to select a pattern.<br />
3. Enable the clock and data outputs by clicking on “Enable Outputs”.<br />
4. Click on “Eye Setup” and select “CleanEye” as the “Eye Operating Mode”. Capture and save<br />
the Single-Value Waveform by stopping the “Run”, clicking on “ Eye Setup” and “Save to<br />
CSV” then select “Single-Value Waveform” with the following parameters; Pattern Length =<br />
128 bits, number of samples per bit = 40, Y-axis.<br />
Serial ATA Logo Group 39 MOI Revision 1.3 Version <strong>1.0</strong> using BERTScope
5. Repeat Step 4 with the short pair of matched cables connected directly from the BERTScope<br />
Data Outputs to the BERTScope Data Input ports (no <strong>SATA</strong> Tee or Clock Recovery). This<br />
will be the reference single-value waveform. Remember to choose a file name different from<br />
the file name of the measurement waveform.<br />
6. Open the “Insertion Loss Calculator.mcd” script in MatCad and insert the names of the<br />
reference (before) and measurement (after) waveform files using the 1 Gb/s measurement rate<br />
and 40 samples per UI.<br />
7. Save the MatCad output file and open it as the reference file in BERTScope Explorer. Set the<br />
start and stop frequencies in BERTScope Explorer to respectively 20 MHz and 2.5 times the<br />
desired <strong>SATA</strong> data rate, i.e. 15 GHz for 6 Gb/s. Select “Inverted”, 32 taps with 4 taps per UI<br />
and run the BERTScope Explorer application. Save the screen shot and the file using a unique<br />
file name for each calibration data including the data rate, date and serial number of the<br />
equipment.<br />
8. Go to “Eye Setup”, “FIR”, “Configure” and enter the 32 tap values. Save as the insertion loss<br />
calibration FIR for the respective data rate.<br />
9. Repeat Steps 7 and 8 for the other data rates.<br />
Serial ATA Logo Group 40 MOI Revision 1.3 Version <strong>1.0</strong> using BERTScope
Observable Results: The calibration and correction of test setup insertion loss is automatically applied<br />
when the appropriate data rare FIR filter is applied during the <strong>SATA</strong> tests. Correct filter can be<br />
selected for each data rate.<br />
Appendix B4: Calibration of Test Setup OOB Amplitude.<br />
Purpose: Calibration of the amplitudes used for OOB-01 tests.<br />
Last Modification: March 29, 2010<br />
Discussion: The amplitude of the OOB signal is measured and the best settings to achieve respectively 40<br />
m V, 60 mV and 200 mV are found. The reference plane for the calibrations is the SMA interface where<br />
the <strong>SATA</strong> receptacle connects to the test setup.<br />
Resource Requirements and Calibration Setup as shown in Appendix E: Except connect the<br />
BERTScope clock output to the BERTScope clock input using the short SMA Male to SMA Male Cable.<br />
Connect the BERTScope Data Outputs to the Data Inputs of the test setup; namely through the matched<br />
pair of short SMA Male to SMA Male cables connected via a pair of 50 ohms SMA female-to-female<br />
adapters to the reference plane where the <strong>SATA</strong> receptacle connects.<br />
Calibration Procedure:<br />
1. The OOB amplitude can be calibrated by simply applying the Align pattern from the<br />
BERTScope Data Outputs to the Data Inputs of the test setup; namely through the matched<br />
pair of short SMA Male to SMA Male cables connected via a pair of 50 ohms SMA femaleto-female<br />
adapters to the reference plane where the <strong>SATA</strong> receptacle connects or to the DUT<br />
input side of the <strong>SATA</strong> Tee if a <strong>SATA</strong> Tee is used. Click on “Eye Setup” and select<br />
“CleanEye” as the “Eye Operating Mode”. Set the pattern length to “manual” and the value to<br />
“80”. Enable the FIR filter as calibrated in Appendix B3 for 1.5 Gb/s interface rate by<br />
clicking on “Eye Setup” then “Enable FIR”; “Configure FIR” and “Load Filter”. Measure and<br />
record the “Amplitude” All calibration screen shots need to be saved. This is done by clicking<br />
on “Print” and select “Print to file” then create a unique file name for each calibration data<br />
including the serial number of the equipment.<br />
Observable Results: Record the setting needed to achieve the 40 mV, 60 mV and 250 mV OOB<br />
amplitudes needed for OOB-01 testing.<br />
Serial ATA Logo Group 41 MOI Revision 1.3 Version <strong>1.0</strong> using BERTScope
Appendix C: Jitter Transfer Function (JTF) calibration:<br />
Description: The full JTF calibration require the injection of a reference signal, a MFTP pattern with jitter<br />
modulation from the BERTScope, and measurement of the jitter using the test setup detector, in this case<br />
the BERTScope detector with Clock Recovery (CR).<br />
1. Set the CR to 2.09 dB peaking, this is the 0.707 damping factor required in Serial ATA.<br />
2. Set the pattern generator to the MFTP pattern at 1 V amplitude. In “Generator” view turn on<br />
the SCC source, “Set it to Sinusoidal, Center Spread at 30 kHz and 3926 ppm.<br />
3. Measure the ppm deviation, which is the difference between maximum deviation and<br />
minimum deviation in ppm of the SSC Waveform in the “SSC Waveform” view. Record this<br />
number as the reference ppm level.<br />
4. Measure the received BUJ on the JitterMap View (or the DJ on the JitterPeak View if<br />
JitterMap is not available). .Adjust the CR 12500A closed loop bandwidth setting until the<br />
measured BUJ (or DJ) is between 4.9 ps and 5.5 ps (5.2 ps nominal). This provides the 72 dB<br />
+/-0.5 dB rejection at 30 kHz which is the most important parameter for the Jitter Transfer<br />
Function. (Approximate closed loop bandwidth setting for the CR is just below 6 MHz at 50%<br />
nominal edge density). The exact formula is as follows:<br />
Rejection (dB) = 10 LOG[(reference ppm level * 20.8 ns)/(3926 ppm * measured BUJ)]<br />
The 72 dB at 30 kHz sets a point on the steep slope of the JTF curve. The slope of the curve<br />
generally matches the roll-off of the spread spectrum clock spectrum and the reference clock<br />
phase noise. The combination of JTF and phase noise or SSC spectral density therefore<br />
approaches a constant value of measured jitter directly proportional to the location and<br />
accuracy of the 72 dB, 30 kHz point. That’s a reason why this point is very important and set<br />
first.<br />
5. Inject 50% UI (200 ps at 1.5 Gb/s, 100ps at 3 Gb/s) of sinusoidal jitter (SJ) at 50 MHz and<br />
measure the received BUJ on the JitterMap View (or the DJ on the JitterPeak View if<br />
JitterMap is not available). This BUJ (or DJ) value is the reference jitter level. It should be<br />
approximately equal to the injected SJ level.<br />
6. Adjust the SJ frequency until 0.707 times the BUJ (or DJ) of the reference jitter level is<br />
achieved. Record the frequency as the 3 dB JTF bandwidth. This bandwidth is less critical,<br />
but must be within 2.1 MHz +/- 1 MHz.<br />
7. Verify that the 3 dB JTF bandwidth is within 2.1 MHz +/-1 MHz.<br />
8. Adjust the SJ frequency again to find the frequency, which yields the largest BUJ. This<br />
frequency will usually be above the 3 dB JTF bandwidth value and near the closed loop<br />
bandwidth value. Record the value of the largest measured BUJ as well as the associated SJ<br />
frequency.<br />
9. Calculate the JTF Peaking as follows:<br />
10. All digital edge based devices and ICs have peaking in the JTF response due to the delay in<br />
the digital circuitry, i.e. there is no phase information between edges in the data pattern, the<br />
pattern edge density and the fact that many phase detectors only detect on positive going<br />
edges. It is desirable to have as little peaking as possible and there are clock recovery options<br />
available to minimize the integrated area of peaking. Verify that the peaking is less than 3.5<br />
dB.<br />
11. Save the settings that meet above JTF as clock recovery standards “JTF-<strong>SATA</strong>1” and “JTF-<br />
<strong>SATA</strong>2” respectively for the 1.5 Gb/s and the 3.0 Gb/s calibrations. This is done by clicking<br />
on “View”, “CR Control”, “Standards” and “Create Standard”<br />
Above full calibration should be done on the complete assembled <strong>SATA</strong> setup. A simpler measurement can be run<br />
more frequently on the CR itself. The CR12500A has a built in calibration and verification circuitry called “CR<br />
Trace”, which can be activated from the BERTScope (or from a PC). Below please find an example of the CR Trace<br />
verification plot.<br />
Serial ATA Logo Group 42 MOI Revision 1.3 Version <strong>1.0</strong> using BERTScope
Serial ATA Logo Group 43 MOI Revision 1.3 Version <strong>1.0</strong> using BERTScope
Appendix D: Validation of Lab Load Return Loss<br />
Purpose: Prior to use of the BERTScope test setup, the Lab Load, for PHY and TSG compliance testing, the return<br />
loss must be verified to be better than required by the Serial ATA Revision 2.6 section 7.2.2.5.<br />
References:<br />
1. Serial ATA Revision 2.6<br />
Resource Requirements:<br />
• Appendix E plus the following:<br />
• Two short SMA Male to SMA Male Cable less than or equal to 12” length, Sucoflex 104 or equivalent<br />
• Two SMA Male to SMA Male Adapters, SUHNER 32SMA-50-0-1 or equivalent<br />
• Two power combiners, Weinschel 1515 or equivalent<br />
• Two 50 ohm terminations, SUHNER or equivalent<br />
• Two short circuits, SUHNER or equivalent<br />
Or<br />
• A 8 GHz Vector Network Analyzer, R&S or equivalent with calibration kit<br />
Last Modification: June 6, 2009<br />
Test Setup: Connect the power combiner, SMA adapter and cable pairs to the BERTScope Clock Outputs and Data<br />
Input as shown in the photo.<br />
Test Procedure:<br />
1. Power-on the <strong>SATA</strong> Tee and the Keithley switch of the BERTScope Serial ATA setup to be tested.<br />
2. Send the 34-zeros-64-ones-34-zeros step response pattern at 1.5 Gb/s with Clock Outputs set to divideby-32<br />
and at 1 Volt nominal amplitude towards respectively the termination, short circuit and the port<br />
to be tested (obviously the one not used by the return loss power combiner circuitry) and capture the<br />
128 bit long response in the “Eye Diagram” view using the “Clean Eye” export to csv in y-axis format<br />
at least 40 samples per bit resolution.<br />
3. Open the MatCad script as per Appendix B4 to run the FFT on the captured data using the responses<br />
from the 50 ohm terminations and the short circuits to provide the 50 ohm and zero time reference<br />
points.<br />
4. Repeat steps 1 through 3 with the BERTScope Data Input Port terminated in 50 ohms for single port<br />
measurements as needed.<br />
Observable Results: The pass/fail criteria are:<br />
• The Return loss of each port must be better than specified in Serial ATA Revision 2.6 section 4.2.2.5<br />
Laboratory Load; namely: The inputs of the Laboratory Load (from the back of the mated <strong>SATA</strong><br />
Serial ATA Logo Group 44 MOI Revision 1.3 Version <strong>1.0</strong> using BERTScope
connector to the 50 ohm load within the HBWS) shall have an individual return loss greater than 20 dB<br />
over a bandwidth of 100 MHz to 5.0 GHz, and greater than 10 dB from 5 GHz to 8 GHz.<br />
Serial ATA Logo Group 45 MOI Revision 1.3 Version <strong>1.0</strong> using BERTScope
Appendix E: Serial ATA Interoperability Program Test Setup using BERTScope 1 .<br />
1 Setup including cables and adaptors to have return loss per <strong>SATA</strong> specifications and be deskewed to within 1 ps.<br />
Serial ATA Logo Group 46 MOI Revision 1.3 Version <strong>1.0</strong> using BERTScope
Last Modification: January 5, 2009<br />
Resource Requirements Summary for all PHY and TSG and OOB tests as covered by this MOI:<br />
• One BERTScope ”B” or “C” with software version 10.5 or later<br />
• One BERTScope PatternVu software option<br />
• One clock recovery instrument BERTScope CR 12500A with software version SW 0.9.6 FPGA<br />
2.8 or later<br />
• One i<strong>SATA</strong> receptacle to SMA Female Adapter, Wilder <strong>SATA</strong>-TPA-R 600-1014-000 or ICT<br />
Solutions TF-1R21 or equivalent<br />
• One BERTScope CR cables set, CR 12500ACBL, consisting of:<br />
i. One short SMA Male to SMA Male Cable less than or equal to 8” length, must be phase/<br />
delay matched to the BERTScope setup and the 2 meter cable pair.<br />
ii. A pair of matched length short SMA Male to SMA Male Cables of about 1 meter length<br />
iii. A pair of matched length low loss SMA Male to SMA Male Cables of 2 meters length<br />
• A second pair of matched length short SMA Male to SMA Male Cables of approximately 1 meter<br />
length, Suhner Sucoflex 104 or equivalent<br />
• Three 50 ohms terminations, SUHNER 65SMA-50-0-1 or equivalent<br />
• One pair of 10 dB SMA Male to SMA Female Attenuators, SUHNER 6810.19A or equivalent<br />
• One pair of 6 dB SMA Male to SMA Female Attenuators for OOB tests, SUHNER 6806.19A or<br />
equivalent unless the A BERTScope <strong>SATA</strong> Tee and SMA Adapters are used.<br />
• One passive power combiner, Weinschel 1515 or equivalent<br />
• One first order low pass filter having a cutoff equal to the bitrate/2, namely 1.5 GHz, Pico Seconds<br />
Pulse Lab, 5915-110-1.5GHz or equivalent.<br />
• One BIST initiation tool as per Appendix A such as above BERTScope “B” or “C”<br />
To support non-disconnect PUTs the following is useful:<br />
• BERTScope <strong>SATA</strong> Tee Test Fixture if needed for support of non-disconnect PUTs.<br />
For Automation you may further want to have:<br />
• Switch, Keithley S46TX0000000TTTTA<br />
• Ethernet to GPIB interface for Keithley switch<br />
• 7 Cables 6” each for switch: Astro lab Mini-bends 32081-2-29094C-6 or equivalent<br />
• BERTScope Serial ATA Interop Test Suite software, revision 1.1<br />
The calibrations of Skew, FIR, JTF and verification of return loss in Appendix B through D must be done<br />
after assembling the setup and before starting the testing.<br />
PHY/TSG/OOB Test Setup as shown: Connect the CR 12500A sub-rate clock output to the BERTScope<br />
clock input using the short SMA Male to SMA Male Cable. Connect a second cable from the CR 12500A<br />
clock output to the BERTScope Ext. Clock input to support the proprietary synchronized loopback mode.<br />
Connect the Data Output + and - ports of the CR 12500A to the Data Input + and – ports of the<br />
BERTScope using the matched pair of low loss cables. Connect both of the B+ and B- ports of <strong>SATA</strong><br />
receptacle, these are the pins marked 6 and 5 respectively (via the SMA adapters and the <strong>SATA</strong> Tee if<br />
used) and the short matched pair of SMA Male to Male Cables to the respective CR 12500A Data Input +<br />
and - ports. Connect both of the A+ and A- ports of <strong>SATA</strong> receptacle, these are the pins marked 2 and 3<br />
respectively (via the SMA adapters and the <strong>SATA</strong> Tee if used) 10 dB attenuators (and 6 dB attenuators if<br />
OOB testing without a <strong>SATA</strong> Tee) and the short matched pair of SMA Male to Male Cables to the<br />
respective BERTScope Data Output + and - ports. Above connections are for Device testing. For host<br />
testing simply rotate the <strong>SATA</strong> Receptacle 180 degrees thereby switching pin 2 with 6 and pin 3 with 5.<br />
OOB Test Setup as shown: Except connect the BERTScope clock output to the BERTScope clock input using the<br />
short SMA Male to SMA Male Cable. One could connect B+ and B- ports of <strong>SATA</strong> receptacle directly to the<br />
BERTScope Data Inputs without the CR for the OOB tests, however for similarity to the other PHY and TSG tests<br />
connection via the CR is described. Above connections are for Device testing. For host testing simply rotate the<br />
<strong>SATA</strong> Receptacle 180 degrees thereby switching pin 2 with 6 and pin 3 with 5.<br />
Serial ATA Logo Group 47 MOI Revision 1.3 Version <strong>1.0</strong> using BERTScope