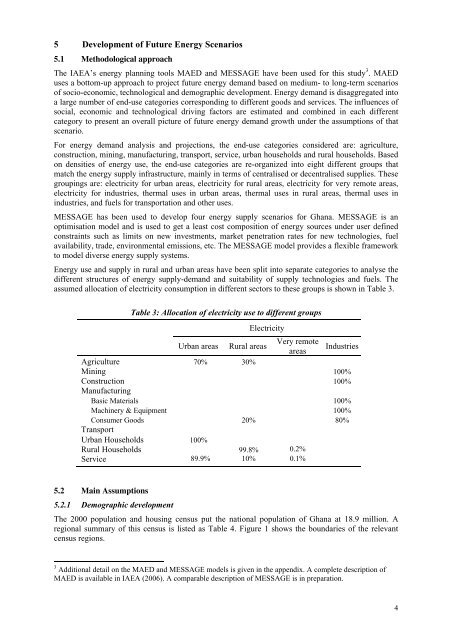
5 Development of Future Energy Scenarios5.1 Methodological approachThe IAEA’s energy planning tools MAED and MESSAGE have been used for this study 3 . MAEDuses a bottom-up approach to project future energy demand based on medium- to long-term scenariosof socio-economic, technological and demographic development. Energy demand is disaggregated intoa large number of end-use categories corresponding to different goods and services. The influences ofsocial, economic and technological driving factors are estimated and combined in each differentcategory to present an overall picture of future energy demand growth under the assumptions of thatscenario.For energy demand analysis and projections, the end-use categories considered are: agriculture,construction, mining, manufacturing, transport, service, urban households and rural households. Basedon densities of energy use, the end-use categories are re-organized into eight different groups thatmatch the energy supply infrastructure, mainly in terms of centralised or decentralised supplies. Thesegroupings are: electricity for urban areas, electricity for rural areas, electricity for very remote areas,electricity for industries, thermal uses in urban areas, thermal uses in rural areas, thermal uses inindustries, and fuels for transportation and other uses.MESSAGE has been used to develop four energy supply scenarios for <strong>Ghana</strong>. MESSAGE is anoptimisation model and is used to get a least cost composition of energy sources under user definedconstraints such as limits on new investments, market penetration rates for new technologies, fuelavailability, trade, environmental emissions, etc. The MESSAGE model provides a flexible frameworkto model diverse energy supply systems.Energy use and supply in rural and urban areas have been split into separate categories to analyse thedifferent structures of energy supply-demand and suitability of supply technologies and fuels. Theassumed allocation of electricity consumption in different sectors to these groups is shown in Table 3.Table 3: Allocation of electricity use to different groupsElectricityUrban areas Rural areasVery remoteareasIndustriesAgriculture 70% 30%Mining 100%Construction 100%ManufacturingBasic Materials 100%Machinery & Equipment 100%Consumer Goods 20% 80%TransportUrban Households 100%Rural Households 99.8% 0.2%Service 89.9% 10% 0.1%5.2 Main Assumptions5.2.1 Demographic developmentThe 2000 population and housing census put the national population of <strong>Ghana</strong> at 18.9 million. Aregional summary of this census is listed as Table 4. Figure 1 shows the boundaries of the relevantcensus regions.3 Additional detail on the MAED and MESSAGE models is given in the appendix. A complete description ofMAED is available in IAEA (2006). A comparable description of MESSAGE is in preparation.4
The World Bank estimates that by 2000 the population of <strong>Ghana</strong> had increased to 20.4 million (WorldBank, 2005b). Considering the rural-urban split in the year 2000 and inter-census growth of urban andrural areas, the estimated urban and rural populations in 2003 were 9.4 million and 11.0 million,respectively.RegionTable 4. Rural and urban a population in 2000, by region bTotal Population(in thousands)Population density(people per squarekilometre)Rural(%)Urban(%)All regions 18,912 79 56.2 43.81.Western 1,924 80 63.7 36.32. Central 1,594 162 62.5 37.53. Accra 2,906 895 12.3 87.74. Volta 1,635 80 73.0 27.05. Eastern 2,107 109 65.4 34.66. Ashanti 3,613 148 48.7 51.37. Brong-1,815 46 62.6 37.4Ahafo8. Northern 1,821 26 73.4 26.69. Upper east 920 104 84.3 15.710. Upper west 577 31 82.5 17.5a Towns with populations of 5,000 and more.b The regions are shown in Figure 1.Source: GSS, 2001.The population growth rate is slowing in <strong>Ghana</strong>. From an annual average of 2.7% during the period1984-2000 (GSS, 2001), the present population growth rate has fallen slightly to 2.6% and is expectedto drop to about 2.2% by 2030. This decline reflects the government’s strategies to manage populationgrowth at a level consonant with economic growth and social development targets.As in most developing countries, the degree of urbanisation is expected to increase – from 46.3% in2003 to 58.0% by 2030. Figure 2 shows the projected future urban and rural populations of <strong>Ghana</strong>.5.2.2 Economic growth targetsThe structure of the economy has undergone significant changes during the last 20 years. Figure 3shows the historical and projected sectoral shares of GDP. The share of agriculture in GDP hasdeclined from 49.2% in 1984 to 35.2% in 2003. In the same period, the share of the industrial 4 sectorhas increased from 10.6% to 24.7%. It has been assumed that this trend will continue in the future.According to this assumption, the share of agriculture will fall to 19.0% in 2030, and the share of theindustrial sector will increase to 35.0%, while the share of the service sector 5 will grow to 46.0% in2030 from a present 40.1%.The World Bank projects 6.0% annual growth for <strong>Ghana</strong> during the period 2004-2008 (World Bank,2005a). The government of <strong>Ghana</strong> is planning to stimulate rapid socio-economic development andaims to raise the annual economic growth rate from 6% to 8%, in order to achieve middle incomecountry status by the year 2015 (NDPC, 2005). In the short to medium term the government’semphasis is on an agriculture-led economic growth strategy. Modernizing the agricultural sector is oneof the main priorities established in the Growth and Poverty Reduction Strategy (GPRS II) beingpursued in <strong>Ghana</strong>. However, the Government of <strong>Ghana</strong> believes that the road to economic growth liesultimately in diversifying away from its coca-gold-timber base and adding an element ofindustrialization, technology development and higher productivity to the economy of <strong>Ghana</strong> (NDPC,2005).4 The industrial sector includes manufacturing, mining and construction. During 1984-2003, the share of themanufacturing sector in total GDP increased from 6.4% to 8.5%.5 The service sector includes transport, storage, communication, wholesale and retail trade, restaurants andhotels, finance, insurance, real estate, business services, government services and community services.5


