Ghana - UNEP
Ghana - UNEP
Ghana - UNEP
- No tags were found...
You also want an ePaper? Increase the reach of your titles
YUMPU automatically turns print PDFs into web optimized ePapers that Google loves.
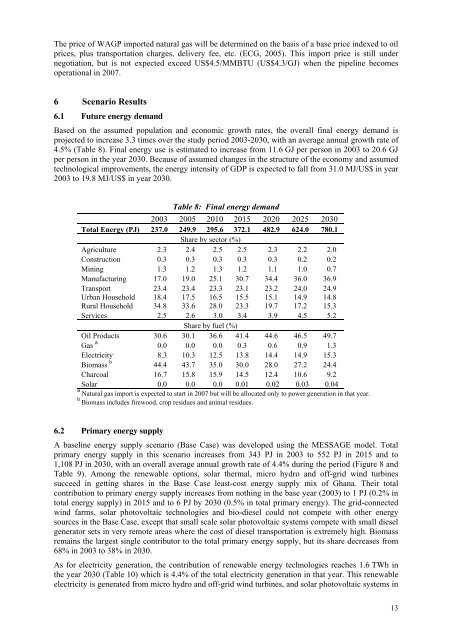
The price of WAGP imported natural gas will be determined on the basis of a base price indexed to oilprices, plus transportation charges, delivery fee, etc. (ECG, 2005). This import price is still undernegotiation, but is not expected exceed US$4.5/MMBTU (US$4.3/GJ) when the pipeline becomesoperational in 2007.6 Scenario Results6.1 Future energy demandBased on the assumed population and economic growth rates, the overall final energy demand isprojected to increase 3.3 times over the study period 2003-2030, with an average annual growth rate of4.5% (Table 8). Final energy use is estimated to increase from 11.6 GJ per person in 2003 to 20.6 GJper person in the year 2030. Because of assumed changes in the structure of the economy and assumedtechnological improvements, the energy intensity of GDP is expected to fall from 31.0 MJ/US$ in year2003 to 19.8 MJ/US$ in year 2030.Table 8: Final energy demand2003 2005 2010 2015 2020 2025 2030Total Energy (PJ) 237.0 249.9 295.6 372.1 482.9 624.0 780.1Share by sector (%)Agriculture 2.3 2.4 2.5 2.5 2.3 2.2 2.0Construction 0.3 0.3 0.3 0.3 0.3 0.2 0.2Mining 1.3 1.2 1.3 1.2 1.1 1.0 0.7Manufacturing 17.0 19.0 25.1 30.7 34.4 36.0 36.9Transport 23.4 23.4 23.3 23.1 23.2 24.0 24.9Urban HouseholdRural Household18.434.817.533.616.528.015.523.315.119.714.917.214.815.3Services 2.5 2.6 3.0 3.4 3.9 4.5 5.2Share by fuel (%)Oil Products 30.6 30.1 36.6 41.4 44.6 46.5 49.7Gas a 0.0 0.0 0.0 0.3 0.6 0.9 1.3Electricity 8.3 10.3 12.5 13.8 14.4 14.9 15.3Biomass b 44.4 43.7 35.0 30.0 28.0 27.2 24.4Charcoal 16.7 15.8 15.9 14.5 12.4 10.6 9.2Solar 0.0 0.0 0.0 0.01 0.02 0.03 0.04a Natural gas import is expected to start in 2007 but will be allocated only to power generation in that year.b Biomass includes firewood, crop residues and animal residues.6.2 Primary energy supplyA baseline energy supply scenario (Base Case) was developed using the MESSAGE model. Totalprimary energy supply in this scenario increases from 343 PJ in 2003 to 552 PJ in 2015 and to1,108 PJ in 2030, with an overall average annual growth rate of 4.4% during the period (Figure 8 andTable 9). Among the renewable options, solar thermal, micro hydro and off-grid wind turbinessucceed in getting shares in the Base Case least-cost energy supply mix of <strong>Ghana</strong>. Their totalcontribution to primary energy supply increases from nothing in the base year (2003) to 1 PJ (0.2% intotal energy supply) in 2015 and to 6 PJ by 2030 (0.5% in total primary energy). The grid-connectedwind farms, solar photovoltaic technologies and bio-diesel could not compete with other energysources in the Base Case, except that small scale solar photovoltaic systems compete with small dieselgenerator sets in very remote areas where the cost of diesel transportation is extremely high. Biomassremains the largest single contributor to the total primary energy supply, but its share decreases from68% in 2003 to 38% in 2030.As for electricity generation, the contribution of renewable energy technologies reaches 1.6 TWh inthe year 2030 (Table 10) which is 4.4% of the total electricity generation in that year. This renewableelectricity is generated from micro hydro and off-grid wind turbines, and solar photovoltaic systems in13


