Ghana - UNEP
Ghana - UNEP
Ghana - UNEP
- No tags were found...

You also want an ePaper? Increase the reach of your titles
YUMPU automatically turns print PDFs into web optimized ePapers that Google loves.
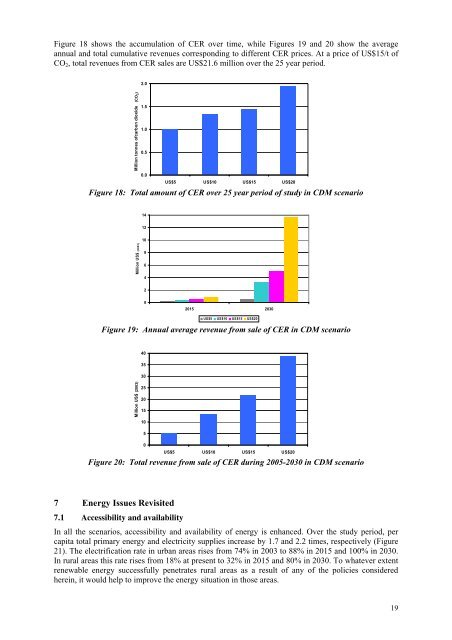
Figure 18 shows the accumulation of CER over time, while Figures 19 and 20 show the averageannual and total cumulative revenues corresponding to different CER prices. At a price of US$15/t ofCO 2 , total revenues from CER sales are US$21.6 million over the 25 year period.Million tonnes ofcarbon dioxide (CO 2 )2)2.01.51.00.50.0US$5 US$10 US$15 US$20Figure 18: Total amount of CER over 25 year period of study in CDM scenario141210Million US$ (2003)864202015 2030US$5 US$10 US$15 US$20Figure 19: Annual average revenue from sale of CER in CDM scenario403530Million US$ (2003)2520151050US$5 US$10 US$15 US$20Figure 20: Total revenue from sale of CER during 2005-2030 in CDM scenario7 Energy Issues Revisited7.1 Accessibility and availabilityIn all the scenarios, accessibility and availability of energy is enhanced. Over the study period, percapita total primary energy and electricity supplies increase by 1.7 and 2.2 times, respectively (Figure21). The electrification rate in urban areas rises from 74% in 2003 to 88% in 2015 and 100% in 2030.In rural areas this rate rises from 18% at present to 32% in 2015 and 80% in 2030. To whatever extentrenewable energy successfully penetrates rural areas as a result of any of the policies consideredherein, it would help to improve the energy situation in those areas.19