Ghana - UNEP
Ghana - UNEP
Ghana - UNEP
- No tags were found...

You also want an ePaper? Increase the reach of your titles
YUMPU automatically turns print PDFs into web optimized ePapers that Google loves.
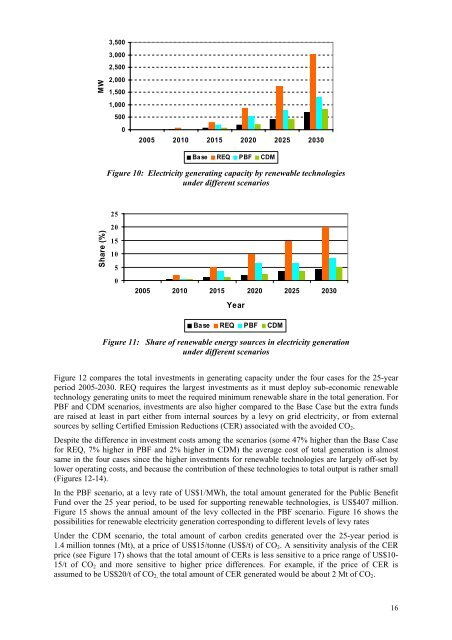
3,500MW3,0002,5002,0001,5001,00050002005 2010 2015 2020 2025 2030Base REQ PBF CDMFigure 10: Electricity generating capacity by renewable technologiesunder different scenarios25Share (%)201510502005 2010 2015 2020 2025 2030YearBase REQ PBF CDMFigure 11: Share of renewable energy sources in electricity generationunder different scenariosFigure 12 compares the total investments in generating capacity under the four cases for the 25-yearperiod 2005-2030. REQ requires the largest investments as it must deploy sub-economic renewabletechnology generating units to meet the required minimum renewable share in the total generation. ForPBF and CDM scenarios, investments are also higher compared to the Base Case but the extra fundsare raised at least in part either from internal sources by a levy on grid electricity, or from externalsources by selling Certified Emission Reductions (CER) associated with the avoided CO 2 .Despite the difference in investment costs among the scenarios (some 47% higher than the Base Casefor REQ, 7% higher in PBF and 2% higher in CDM) the average cost of total generation is almostsame in the four cases since the higher investments for renewable technologies are largely off-set bylower operating costs, and because the contribution of these technologies to total output is rather small(Figures 12-14).In the PBF scenario, at a levy rate of US$1/MWh, the total amount generated for the Public BenefitFund over the 25 year period, to be used for supporting renewable technologies, is US$407 million.Figure 15 shows the annual amount of the levy collected in the PBF scenario. Figure 16 shows thepossibilities for renewable electricity generation corresponding to different levels of levy ratesUnder the CDM scenario, the total amount of carbon credits generated over the 25-year period is1.4 million tonnes (Mt), at a price of US$15/tonne (US$/t) of CO 2 . A sensitivity analysis of the CERprice (see Figure 17) shows that the total amount of CERs is less sensitive to a price range of US$10-15/t of CO 2 and more sensitive to higher price differences. For example, if the price of CER isassumed to be US$20/t of CO 2, the total amount of CER generated would be about 2 Mt of CO 2 .16