

Final Report - Strategic Environmental Research and Development ...
Final Report - Strategic Environmental Research and Development ...
Final Report - Strategic Environmental Research and Development ...

Create successful ePaper yourself
Turn your PDF publications into a flip-book with our unique Google optimized e-Paper software.
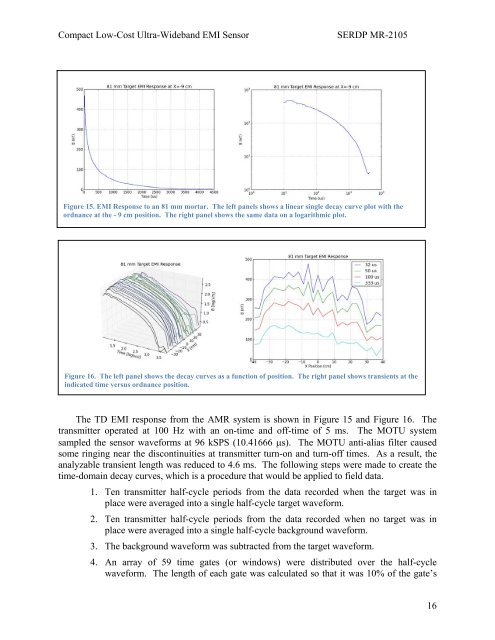
Compact Low-Cost Ultra-Wideb<strong>and</strong> EMI SensorSERDP MR-2105Figure 15. EMI Response to an 81 mm mortar. The left panels shows a linear single decay curve plot with theordnance at the - 9 cm position. The right panel shows the same data on a logarithmic plot.Figure 16. The left panel shows the decay curves as a function of position. The right panel shows transients at theindicated time versus ordnance position.The TD EMI response from the AMR system is shown in Figure 15 <strong>and</strong> Figure 16. Thetransmitter operated at 100 Hz with an on-time <strong>and</strong> off-time of 5 ms. The MOTU systemsampled the sensor waveforms at 96 kSPS (10.41666 s). The MOTU anti-alias filter causedsome ringing near the discontinuities at transmitter turn-on <strong>and</strong> turn-off times. As a result, theanalyzable transient length was reduced to 4.6 ms. The following steps were made to create thetime-domain decay curves, which is a procedure that would be applied to field data.1. Ten transmitter half-cycle periods from the data recorded when the target was inplace were averaged into a single half-cycle target waveform.2. Ten transmitter half-cycle periods from the data recorded when no target was inplace were averaged into a single half-cycle background waveform.3. The background waveform was subtracted from the target waveform.4. An array of 59 time gates (or windows) were distributed over the half-cyclewaveform. The length of each gate was calculated so that it was 10% of the gate’s16


