- Page 1 and 2: SOUBORNÉ INFORMACECOMPREHENSIVE IN
- Page 3 and 4: PŘEDMLUVAJiž třetím rokem jsou
- Page 6 and 7: Publishing extracts from this book
- Page 9 and 10: 9-35. Držitelé průkazů zdravotn
- Page 11 and 12: 6- 6. Size structure of agricultura
- Page 13 and 14: SEZNAM KARTOGRAMŮList of maps1. Ge
- Page 15 and 16: CHARAKTERISTIKA KRAJEOlomoucký kra
- Page 17 and 18: vcelé ČR (0,70 km/km 2 )asilničn
- Page 19 and 20: unemployment rates place the Olomou
- Page 21 and 22: 1. ZÁKLADNÍ CHARAKTERISTIKA, MAKR
- Page 23 and 24: 1. BASIC CHARACTERISTIC, MACROECONO
- Page 25 and 26: ZÁKLADNÍ CHARAKTERISTIKABASIC CHA
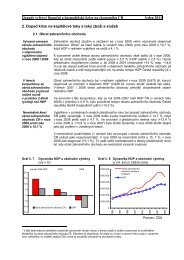
- Page 27: Porovnání vybraných ukazatelů v
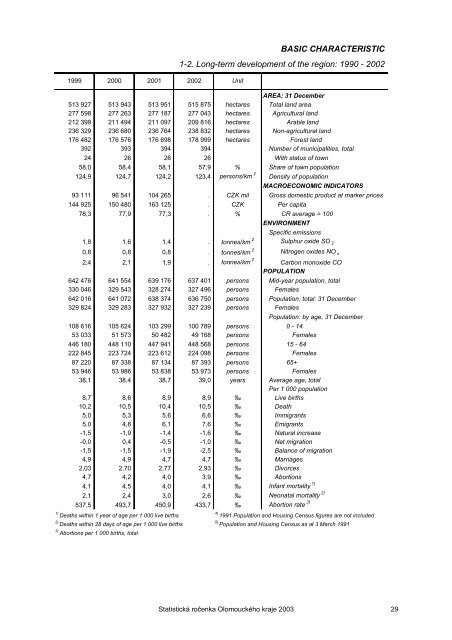
- Page 31 and 32: BASIC CHARACTERISTIC1-2. Long-term
- Page 33 and 34: BASIC CHARACTERISTIC1-2. Long-term
- Page 35 and 36: BASIC CHARACTERISTIC1-2. Long-term
- Page 37 and 38: MAKROEKONOMICKÉ UKAZATELEMACROECON
- Page 39 and 40: OKRESY1-7. Vybrané ukazatele za ok
- Page 41 and 42: OKRESY1-9. Vybrané ukazatele za ok
- Page 43 and 44: OKRESY1-11. Vybrané ukazatele za o
- Page 45 and 46: Měrné emise jsou emise znečišť
- Page 47 and 48: Specific emissions are emissions of
- Page 49 and 50: ÚZEMÍ2-1. Rozloha území ČR pod
- Page 51 and 52: ÚZEMÍAREA2-3. Velikostní skupiny
- Page 53 and 54: PODNEBÍCLIMATE2-5. Srovnání klim
- Page 55 and 56: ŽIVOTNÍ PROSTŘEDÍCHRÁNĚNÁ Ú
- Page 57 and 58: ŽIVOTNÍ PROSTŘEDÍINVESTICE2-11.
- Page 59 and 60: ŽIVOTNÍ PROSTŘEDÍEMISEENVIRONME
- Page 61 and 62: ŽIVOTNÍ PROSTŘEDÍENVIRONMENTEMI
- Page 63 and 64: ŽIVOTNÍ PROSTŘEDÍEMISEENVIRONME
- Page 65 and 66: ŽIVOTNÍ PROSTŘEDÍODPADYENVIRONM
- Page 67 and 68: ŽIVOTNÍ PROSTŘEDÍODPADYENVIRONM
- Page 69 and 70: ŽIVOTNÍ PROSTŘEDÍODPADYENVIRONM
- Page 71 and 72: ŽIVOTNÍ PROSTŘEDÍVODOVODYENVIRO
- Page 73 and 74: ŽIVOTNÍ PROSTŘEDÍKANALIZACEENVI
- Page 75 and 76: ŽIVOTNÍ PROSTŘEDÍENVIRONMENT2-2
- Page 77 and 78: 3. OBYVATELSTVOZákladní údaje o
- Page 79 and 80:
OBYVATELSTVOPOPULATION3-1. Základn
- Page 81 and 82:
Věková struktura obyvatelstva Olo
- Page 83 and 84:
OBYVATELSTVOPOPULATION3-4. RozvodyD
- Page 85 and 86:
OBYVATELSTVOPOPULATION3-6. PotratyA
- Page 87 and 88:
OBYVATELSTVOPOPULATION3-8. Zemřel
- Page 89 and 90:
OBYVATELSTVOPOPULATION3-10. Přist
- Page 91 and 92:
OBYVATELSTVOPOPULATION3-11. Základ
- Page 93 and 94:
4. PRÁCEÚdajedotéto kapitoly byl
- Page 95 and 96:
4. LABOURThe data in this chapter a
- Page 97 and 98:
PRÁCELABOUR4-1. Ekonomická aktivi
- Page 99 and 100:
PRÁCELABOUR4-3. Věk populace dle
- Page 101 and 102:
PRÁCELABOUR4-5. Zaměstnaní vNHpo
- Page 103 and 104:
PRÁCELABOUR4-7. Nezaměstnaní v N
- Page 105 and 106:
PRÁCELABOUR4-9. Míra ekonomické
- Page 107 and 108:
PRÁCELABOUR4-11. Nezaměstnanost,
- Page 109 and 110:
PRÁCELABOUR4-13. Průměrné hrub
- Page 111 and 112:
PRÁCELABOUR4-15. Zaměstnanci a je
- Page 113 and 114:
PRÁCELABOUR4-17. Neumístění uch
- Page 115 and 116:
PRÁCELABOUR4-19. Míra registrovan
- Page 117 and 118:
PRÁCELABOUR4-20. Průměrné hrub
- Page 119 and 120:
5. ORGANIZATIONAL STRUCTURE OF THE
- Page 121 and 122:
ORGANIZAČNÍ STRUKTURANÁRODNÍHO
- Page 123 and 124:
ORGANIZAČNÍ STRUKTURANÁRODNÍHO
- Page 125 and 126:
ORGANIZAČNÍ STRUKTURANÁRODNÍHO
- Page 127 and 128:
ORGANIZAČNÍ STRUKTURANÁRODNÍHO
- Page 129 and 130:
ORGANIZAČNÍ STRUKTURANÁRODNÍHO
- Page 131 and 132:
ORGANIZAČNÍ STRUKTURANÁRODNÍHO
- Page 133 and 134:
ORGANIZAČNÍ STRUKTURANÁRODNÍHO
- Page 135 and 136:
LESNICTVÍDo odvětví lesnictví s
- Page 137 and 138:
FORESTRYForestry comprises all inco
- Page 139 and 140:
ZEMĚDĚLSTVÍAGRICULTURE6-2. Osevn
- Page 141 and 142:
ZEMĚDĚLSTVÍ6-3. Sklizeň zeměd
- Page 143 and 144:
ZEMĚDĚLSTVÍ6-4. Hektarové výno
- Page 145 and 146:
ZEMĚDĚLSTVÍAGRICULTURE6-5. Hospo
- Page 147 and 148:
ZEMĚDĚLSTVÍAGRICULTURE6-6. Velik
- Page 149 and 150:
ZEMĚDĚLSTVÍAGRICULTURE6-9. Skliz
- Page 151 and 152:
ZEMĚDĚLSTVÍAGRICULTURE6-11. Hosp
- Page 153 and 154:
ZEMĚDĚLSTVÍAGRICULTURE6-14. Výr
- Page 155 and 156:
LESNICTVÍFORESTRY6-17. Vybrané uk
- Page 157 and 158:
Stavební práce provedené podle d
- Page 159 and 160:
7. INDUSTRY, ENERGY, CONSTRUCTION A
- Page 161 and 162:
PRŮMYSLINDUSTRY7-1. Průměrný po
- Page 163 and 164:
PRŮMYSLINDUSTRY7-3. Průměrný ev
- Page 165 and 166:
PRŮMYSLINDUSTRY7-5. Základní uka
- Page 167 and 168:
ENERGETIKAENERGY7-6. Spotřeba pali
- Page 169 and 170:
STAVEBNICTVÍCONSTRUCTION7-8. Stave
- Page 171 and 172:
STAVEBNICTVÍCONSTRUCTION7-11. Stav
- Page 173 and 174:
STAVEBNICTVÍCONSTRUCTION7-13. Šet
- Page 175 and 176:
STAVEBNICTVÍCONSTRUCTION7-16. Roze
- Page 177 and 178:
STAVEBNICTVÍCONSTRUCTION7-19. Zah
- Page 179 and 180:
STAVEBNICTVÍCONSTRUCTION7-21. Doko
- Page 181 and 182:
STAVEBNICTVÍCONSTRUCTION7-24. Doko
- Page 183 and 184:
STAVEBNICTVÍCONSTRUCTION7-27. Pře
- Page 185 and 186:
INVESTICEFIXED ASSETS7-30. Poříze
- Page 187 and 188:
INVESTICEFIXED ASSETS7-32. Poříze
- Page 189 and 190:
VÝZKUM A VÝVOJRESEARCH AND DEVELO
- Page 191 and 192:
DOPRAVAÚdaje z dopravy byly získ
- Page 193 and 194:
TRANSPORTThe data on transport were
- Page 195 and 196:
CESTOVNÍ RUCH8-1. Regionální str
- Page 197 and 198:
CESTOVNÍ RUCHTOURISM8-3. Pohostins
- Page 199 and 200:
CESTOVNÍ RUCHTOURISM8-6. Hosté vh
- Page 201 and 202:
CESTOVNÍ RUCHTOURISM8-8. Hromadná
- Page 203 and 204:
CESTOVNÍ RUCH, DOPRAVATOURISM, TRA
- Page 205 and 206:
DOPRAVATRANSPORT8-12. Délka silnic
- Page 207 and 208:
9. ŠKOLSTVÍ, KULTURA A SPORT, ZDR
- Page 209 and 210:
amateřství. V plném rozsahu se t
- Page 211:
9. EDUCATION, CULTURE AND SPORTS, H
- Page 214 and 215:
ŠKOLSTVÍEDUCATION9-1. Školy podl
- Page 216 and 217:
ŠKOLSTVÍEDUCATION9-2. Školy podl
- Page 218 and 219:
ŠKOLSTVÍEDUCATION9-3. Školy podl
- Page 220 and 221:
KULTURA A SPORTCULTURE AND SPORTS9-
- Page 222 and 223:
KULTURA A SPORTCULTURE AND SPORTS9-
- Page 224 and 225:
ZDRAVOTNICTVÍHEALTH9-10. Pracovní
- Page 226 and 227:
ZDRAVOTNICTVÍHEALTH9-11. Pracovní
- Page 228 and 229:
ZDRAVOTNICTVÍHEALTH9-13. Pracovní
- Page 230 and 231:
ZDRAVOTNICTVÍHEALTH9-15. Pracovní
- Page 232 and 233:
SOCIÁLNÍ ZABEZPEČENÍSOCIAL SECU
- Page 234 and 235:
SOCIÁLNÍ ZABEZPEČENÍ9-20. Výda
- Page 236 and 237:
SOCIÁLNÍ ZABEZPEČENÍSOCIAL SECU
- Page 238 and 239:
SOCIÁLNÍ ZABEZPEČENÍSOCIAL SECU
- Page 240 and 241:
SOCIÁLNÍ ZABEZPEČENÍSOCIAL SECU
- Page 242 and 243:
SOCIÁLNÍ ZABEZPEČENÍSOCIAL SECU
- Page 244 and 245:
SOCIÁLNÍ ZABEZPEČENÍSOCIAL SECU
- Page 246 and 247:
SOCIÁLNÍ ZABEZPEČENÍSOCIAL SECU
- Page 248 and 249:
SOCIÁLNÍ ZABEZPEČENÍSOCIAL SECU
- Page 250 and 251:
SOCIÁLNÍ ZABEZPEČENÍSOCIAL SECU
- Page 252 and 253:
10. CRIME, TRAFFIC ACCIDENTS, FIRES
- Page 254 and 255:
KRIMINALITACRIME10-3. Zjištěné t
- Page 256 and 257:
DOPRAVNÍ NEHODYTRAFFIC ACCIDENTS10
- Page 258 and 259:
POŽÁRYFIRES10-10. Požáry v čle
- Page 260 and 261:
POŽÁRYFIRES10-12. Požáry podle
- Page 262 and 263:
11. VOLBY A REFERENDUMVe dnech 1. a
- Page 264 and 265:
VOLBYELECTIONS11-1. Volby do zastup
- Page 266 and 267:
VOLBYELECTIONS11-4. Volby do zastup
- Page 268 and 269:
VOLBYELECTIONS11-6. Volby do zastup
- Page 270 and 271:
REFERENDUMREFERENDUM11-8. Referendu
- Page 272 and 273:
Rozlišují se čtyři základní t
- Page 274 and 275:
12. POPULATION AND HOUSING CENSUS 2
- Page 276 and 277:
Unoccupied dwelling is a dwelling,
- Page 278 and 279:
SČÍTÁNÍ LIDU, DOMŮ ABYTŮPOPUL
- Page 280 and 281:
SČÍTÁNÍ LIDU, DOMŮ ABYTŮPOPUL
- Page 282 and 283:
SČÍTÁNÍ LIDU, DOMŮ ABYTŮPOPUL
- Page 284 and 285:
SČÍTÁNÍ LIDU, DOMŮ ABYTŮPOPUL
- Page 286 and 287:
SČÍTÁNÍ LIDU, DOMŮ ABYTŮPOPUL
- Page 288 and 289:
SČÍTÁNÍ LIDU, DOMŮ ABYTŮPOPUL
- Page 290 and 291:
13. MUNICIPALITIESAct No. 314/2002
- Page 292 and 293:
MĚSTA A OBCEMUNICIPALITIES13-2. Sl
- Page 294 and 295:
MĚSTAAOBCEMUNICIPALITIES13-4. Domy
- Page 296 and 297:
MĚSTAAOBCEMUNICIPALITIES13-6. Vyba
- Page 298 and 299:
MĚSTA A OBCEMUNICIPALITIES13-7. Ek
- Page 300 and 301:
MĚSTA A OBCEMUNICIPALITIES13-10. S
- Page 302 and 303:
MĚSTAAOBCEMUNICIPALITIES13-12. Dom
- Page 304 and 305:
MĚSTAAOBCEMUNICIPALITIES13-13. Vyb
- Page 306 and 307:
MĚSTA A OBCE13-15. Vybrané údaje
- Page 308 and 309:
MĚSTA A OBCESprávní obvody obcí
- Page 310 and 311:
MĚSTA A OBCESprávní obvody obcí
- Page 312 and 313:
MĚSTA A OBCESprávní obvody obcí
- Page 314 and 315:
14. ÚZEMNÍ SROVNÁNÍNa základě
- Page 316 and 317:
ÚZEMNÍ SROVNÁNÍ14-1. Vybrané u
- Page 318 and 319:
ÚZEMNÍ SROVNÁNÍ14-1. Vybrané u
- Page 320 and 321:
ÚZEMNÍ SROVNÁNÍ14-1. Vybrané u
- Page 322 and 323:
ÚZEMNÍ SROVNÁNÍ14-1. Vybrané u
- Page 324 and 325:
ÚZEMNÍ SROVNÁNÍ14-2. Vybrané u
- Page 326 and 327:
ÚZEMNÍ SROVNÁNÍ14-2. Vybrané u
- Page 328 and 329:
ÚZEMNÍ SROVNÁNÍ14-2. Vybrané u
- Page 330 and 331:
ÚZEMNÍ SROVNÁNÍ14-2. Vybrané u
- Page 332 and 333:
ÚZEMNÍ SROVNÁNÍ14-3. Vybrané u
- Page 334 and 335:
334Statistická ročenka Olomoucké
- Page 336 and 337:
VYBRANÉ UKAZATELE ČESKÉ REPUBLIK
- Page 338 and 339:
VYBRANÉ UKAZATELE ČESKÉ REPUBLIK
- Page 340 and 341:
VYBRANÉ UKAZATELE ČESKÉ REPUBLIK
- Page 342 and 343:
VYBRANÉ UKAZATELE ČESKÉ REPUBLIK
- Page 344 and 345:
VYBRANÉ UKAZATELE ČESKÉ REPUBLIK
- Page 346 and 347:
VYBRANÉ UKAZATELE ČESKÉ REPUBLIK
- Page 348 and 349:
VYBRANÉ UKAZATELE ČESKÉ REPUBLIK
- Page 350 and 351:
350Statistická ročenka Olomoucké
- Page 352 and 353:
352Statistická ročenka Olomoucké
- Page 354 and 355:
Správní rozdělení Olomouckého
- Page 356 and 357:
Přirozený přírůstek / úbytek
- Page 358 and 359:
Míra registrované nezaměstnanost
- Page 360 and 361:
Počet registrovaných subjektů se
- Page 362 and 363:
Dokončené byty na 10 000 obyvatel
- Page 364 and 365:
Žáci v základních školách na
- Page 366 and 367:
Místa v domovech důchodců a penz
- Page 368 and 369:
Podíl úplných rodin z celkového
- Page 370:
Míra nezaměstnanosti v obcích Ol