VYBRANÉ UKAZATELE ČESKÉ REPUBLIKYUkazatelZÁKLADNÍ CHARAKTERISTIKAMěřicíjednotka1990 1992 1993 1994 1995 1996Obyvatelstvo (stav k 1. 1.) osoby 10 362 102 10 312 548 10 325 697 10 334 013 10 333 161 10 321 344z toho ženy osoby 5 326 444 5 306 546 5 312 284 5 314 716 5 312 697 5 304 829Hustota obyvatelstva osoby/km 2 131 131 131 131 131 131Počet obcí k1.1. obce 4 104 6 097 6 196 6 230 6 232 6 233ŽIVOTNÍ PROSTŘEDÍMěrné emise základníchznečišťujících látek (REZZO 1-3)emise tuhé t/km 2 8,0 6,3 5,6 4,4 2,5 2,1oxid siřičitý (SO 2 ) t/km 2 23,8 19,5 18,0 16,1 13,7 11,9oxidy dusíku (NO x ) t/km 2 6,7 6,2 4,6 3,0 2,8 2,6oxid uhelnatý (CO) t/km 2 8,6 10,6 9,6 9,4 7,7 7,5uhlovodíky (C x H y ) t/km 2 1,9 1,7 1,7 1,6 1,2 1,2Pořízené investice na ochranuživotního prostředímil. Kčs/Kč 6 048 16 954 19 890 28 272 32 252 37 036Obyvatelé zásobovaní vodouzveřejných vodovodůtis. osob 8 624 8 713 8 751 8 831 8 860 8 868Obyvatelé bydlící v domechnapojených na veřejnoukanalizacitis. osob 7 523 7 501 7 521 7 542 7 559 7 566Podíl čištěných odpadních vod % 72,6 77,8 78,9 82,2 89,5 90,3OBYVATELSTVOObyvatelstvo (střední stav) tis. osob 10 363 10 318 10 331 10 336 10 331 10 315z toho ženy tis. osob 5 326 5 309 5 314 5 315 5 311 5 301vtomvevěku: 0 - 14 let tis. osob 2 223 2 092 2 037 1 979 1 921 1 86715 - 64 let tis. osob 6 844 6 903 6 957 7 006 7 044 7 06665avíce tis. osob 1 296 1 323 1 337 1 351 1 366 1 382Nadějě dožití: muži roky 67,6 68,4 69,2 69,5 70,0 70,4ženy roky 75,4 76,1 76,4 76,6 76,9 77,3Živě narození na 1 000 obyvatel ‰ 12,6 11,8 11,7 10,3 9,3 8,8Zemřelí na 1 000 obyvatel ‰ 12,5 11,7 11,4 11,4 11,4 10,9Přirozený přírůstek / úbytekna 1 000 obyvatel‰ 0,1 0,1 0,3 -1,0 -2,1 -2,2Sňatky na 1 000 obyvatel ‰ 8,8 7,2 6,4 5,7 5,3 5,2Rozvody na 100 sňatků % 35,2 38,6 45,8 52,9 56,7 61,4CENYMíra inflace 1) nárůst, % 9,7 11,1 20,8 10,0 9,1 8,8Indexy spotřebitelských cen(životních nákladů)za domácnosti:zaměstnanců % 100,0 170,3 205,7 227,1 247,5 269,0důchodců % 100,0 171,8 205,3 227,9 251,6 275,3Indexy cen výrobců:zemědělských výrobců % 100,0 105,1 114,1 120,1 129,1 139,9průmyslových výrobců % 100,0 187,4 204,7 215,6 231,9 243,0stavebních prací % 100,0 133,0 167,4 190,7 210,9 234,81) přírůstek průměrného ročního indexu spotřebitelských cen (předchozí rok = 100)336<strong>Statistická</strong> <strong>ročenka</strong> <strong>Olomouckého</strong> <strong>kraje</strong> <strong>2003</strong>
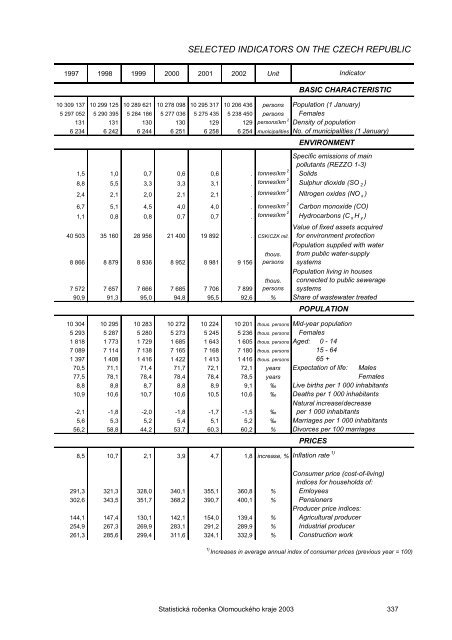
SELECTED INDICATORS ON THE CZECH REPUBLIC1997 1998 1999 2000 2001 2002 UnitIndicatorBASIC CHARACTERISTIC10 309 137 10 299 125 10 289 621 10 278 098 10 295 317 10 206 436 persons Population (1 January)5 297 052 5 290 395 5 284 186 5 277 036 5 275 435 5 238 450 persons Females131 131 130 130 129 129 persons/km 2 Density of population6234 6242 6244 6251 6258 6254 municipalities No. of municipalities (1 January)ENVIRONMENTSpecific emissions of mainpollutants (REZZO 1-3)1,5 1,0 0,7 0,6 0,6 . tonnes/km 2 Solids8,8 5,5 3,3 3,3 3,1 . tonnes/km 2 Sulphur dioxide (SO 2 )2,4 2,1 2,0 2,1 2,1 . tonnes/km 2 Nitrogen oxides (NO x )6,7 5,1 4,5 4,0 4,0 . tonnes/km 2 Carbon monoxide (CO)1,1 0,8 0,8 0,7 0,7 . tonnes/km 2 Hydrocarbons (C x H y )40 503 35 160 28 956 21 400 19 892 . CSK/CZK mil.8866 8879 8936 8952 8981 9156thous.personsPopulation living in houses7572 7657 7666 7685 7706 7899thous.personsconnected to public seweragesystems90,9 91,3 95,0 94,8 95,5 92,6 % Share of wastewater treatedPOPULATION10 304 10 295 10 283 10 272 10 224 10 201 thous. persons Mid-year population5293 5287 5280 5273 5245 5236 thous. persons Females1818 1773 1729 1685 1643 1605 thous. persons Aged: 0 - 147089 7114 7138 7165 7168 7180 thous. persons 15 - 641397 1408 1416 1422 1413 1416 thous. persons 65 +70,5 71,1 71,4 71,7 72,1 72,1 years Expectation of life: Males77,5 78,1 78,4 78,4 78,4 78,5 years Females8,8 8,8 8,7 8,8 8,9 9,1 ‰ Live births per 1 000 inhabitants10,9 10,6 10,7 10,6 10,5 10,6 ‰ Deaths per 1 000 inhabitantsNatural increase/decrease-2,1 -1,8 -2,0 -1,8 -1,7 -1,5 ‰ per 1 000 inhabitants5,6 5,3 5,2 5,4 5,1 5,2 ‰ Marriages per 1 000 inhabitants56,2 58,8 44,2 53,7 60,3 60,2 % Divorces per 100 marriagesPRICES8,5 10,7 2,1 3,9 4,7 1,8 increase, % Inflation rate 1)Value of fixed assets acquiredfor environment protectionPopulation supplied with waterfrom public water-supplysystemsConsumer price (cost-of-living)indices for households of:291,3 321,3 328,0 340,1 355,1 360,8 % Emloyees302,6 343,5 351,7 368,2 390,7 400,1 % PensionersProducer price indices:144,1 147,4 130,1 142,1 154,0 139,4 % Agricultural producer254,9 267,3 269,9 283,1 291,2 289,9 % Industrial producer261,3 285,6 299,4 311,6 324,1 332,9 % Construction work1) Increases in average annual index of consumer prices (previous year = 100)<strong>Statistická</strong> <strong>ročenka</strong> <strong>Olomouckého</strong> <strong>kraje</strong> <strong>2003</strong> 337
- Page 1 and 2:
SOUBORNÉ INFORMACECOMPREHENSIVE IN
- Page 3 and 4:
PŘEDMLUVAJiž třetím rokem jsou
- Page 6 and 7:
Publishing extracts from this book
- Page 9 and 10:
9-35. Držitelé průkazů zdravotn
- Page 11 and 12:
6- 6. Size structure of agricultura
- Page 13 and 14:
SEZNAM KARTOGRAMŮList of maps1. Ge
- Page 15 and 16:
CHARAKTERISTIKA KRAJEOlomoucký kra
- Page 17 and 18:
vcelé ČR (0,70 km/km 2 )asilničn
- Page 19 and 20:
unemployment rates place the Olomou
- Page 21 and 22:
1. ZÁKLADNÍ CHARAKTERISTIKA, MAKR
- Page 23 and 24:
1. BASIC CHARACTERISTIC, MACROECONO
- Page 25 and 26:
ZÁKLADNÍ CHARAKTERISTIKABASIC CHA
- Page 27 and 28:
Porovnání vybraných ukazatelů v
- Page 29 and 30:
BASIC CHARACTERISTIC1-2. Long-term
- Page 31 and 32:
BASIC CHARACTERISTIC1-2. Long-term
- Page 33 and 34:
BASIC CHARACTERISTIC1-2. Long-term
- Page 35 and 36:
BASIC CHARACTERISTIC1-2. Long-term
- Page 37 and 38:
MAKROEKONOMICKÉ UKAZATELEMACROECON
- Page 39 and 40:
OKRESY1-7. Vybrané ukazatele za ok
- Page 41 and 42:
OKRESY1-9. Vybrané ukazatele za ok
- Page 43 and 44:
OKRESY1-11. Vybrané ukazatele za o
- Page 45 and 46:
Měrné emise jsou emise znečišť
- Page 47 and 48:
Specific emissions are emissions of
- Page 49 and 50:
ÚZEMÍ2-1. Rozloha území ČR pod
- Page 51 and 52:
ÚZEMÍAREA2-3. Velikostní skupiny
- Page 53 and 54:
PODNEBÍCLIMATE2-5. Srovnání klim
- Page 55 and 56:
ŽIVOTNÍ PROSTŘEDÍCHRÁNĚNÁ Ú
- Page 57 and 58:
ŽIVOTNÍ PROSTŘEDÍINVESTICE2-11.
- Page 59 and 60:
ŽIVOTNÍ PROSTŘEDÍEMISEENVIRONME
- Page 61 and 62:
ŽIVOTNÍ PROSTŘEDÍENVIRONMENTEMI
- Page 63 and 64:
ŽIVOTNÍ PROSTŘEDÍEMISEENVIRONME
- Page 65 and 66:
ŽIVOTNÍ PROSTŘEDÍODPADYENVIRONM
- Page 67 and 68:
ŽIVOTNÍ PROSTŘEDÍODPADYENVIRONM
- Page 69 and 70:
ŽIVOTNÍ PROSTŘEDÍODPADYENVIRONM
- Page 71 and 72:
ŽIVOTNÍ PROSTŘEDÍVODOVODYENVIRO
- Page 73 and 74:
ŽIVOTNÍ PROSTŘEDÍKANALIZACEENVI
- Page 75 and 76:
ŽIVOTNÍ PROSTŘEDÍENVIRONMENT2-2
- Page 77 and 78:
3. OBYVATELSTVOZákladní údaje o
- Page 79 and 80:
OBYVATELSTVOPOPULATION3-1. Základn
- Page 81 and 82:
Věková struktura obyvatelstva Olo
- Page 83 and 84:
OBYVATELSTVOPOPULATION3-4. RozvodyD
- Page 85 and 86:
OBYVATELSTVOPOPULATION3-6. PotratyA
- Page 87 and 88:
OBYVATELSTVOPOPULATION3-8. Zemřel
- Page 89 and 90:
OBYVATELSTVOPOPULATION3-10. Přist
- Page 91 and 92:
OBYVATELSTVOPOPULATION3-11. Základ
- Page 93 and 94:
4. PRÁCEÚdajedotéto kapitoly byl
- Page 95 and 96:
4. LABOURThe data in this chapter a
- Page 97 and 98:
PRÁCELABOUR4-1. Ekonomická aktivi
- Page 99 and 100:
PRÁCELABOUR4-3. Věk populace dle
- Page 101 and 102:
PRÁCELABOUR4-5. Zaměstnaní vNHpo
- Page 103 and 104:
PRÁCELABOUR4-7. Nezaměstnaní v N
- Page 105 and 106:
PRÁCELABOUR4-9. Míra ekonomické
- Page 107 and 108:
PRÁCELABOUR4-11. Nezaměstnanost,
- Page 109 and 110:
PRÁCELABOUR4-13. Průměrné hrub
- Page 111 and 112:
PRÁCELABOUR4-15. Zaměstnanci a je
- Page 113 and 114:
PRÁCELABOUR4-17. Neumístění uch
- Page 115 and 116:
PRÁCELABOUR4-19. Míra registrovan
- Page 117 and 118:
PRÁCELABOUR4-20. Průměrné hrub
- Page 119 and 120:
5. ORGANIZATIONAL STRUCTURE OF THE
- Page 121 and 122:
ORGANIZAČNÍ STRUKTURANÁRODNÍHO
- Page 123 and 124:
ORGANIZAČNÍ STRUKTURANÁRODNÍHO
- Page 125 and 126:
ORGANIZAČNÍ STRUKTURANÁRODNÍHO
- Page 127 and 128:
ORGANIZAČNÍ STRUKTURANÁRODNÍHO
- Page 129 and 130:
ORGANIZAČNÍ STRUKTURANÁRODNÍHO
- Page 131 and 132:
ORGANIZAČNÍ STRUKTURANÁRODNÍHO
- Page 133 and 134:
ORGANIZAČNÍ STRUKTURANÁRODNÍHO
- Page 135 and 136:
LESNICTVÍDo odvětví lesnictví s
- Page 137 and 138:
FORESTRYForestry comprises all inco
- Page 139 and 140:
ZEMĚDĚLSTVÍAGRICULTURE6-2. Osevn
- Page 141 and 142:
ZEMĚDĚLSTVÍ6-3. Sklizeň zeměd
- Page 143 and 144:
ZEMĚDĚLSTVÍ6-4. Hektarové výno
- Page 145 and 146:
ZEMĚDĚLSTVÍAGRICULTURE6-5. Hospo
- Page 147 and 148:
ZEMĚDĚLSTVÍAGRICULTURE6-6. Velik
- Page 149 and 150:
ZEMĚDĚLSTVÍAGRICULTURE6-9. Skliz
- Page 151 and 152:
ZEMĚDĚLSTVÍAGRICULTURE6-11. Hosp
- Page 153 and 154:
ZEMĚDĚLSTVÍAGRICULTURE6-14. Výr
- Page 155 and 156:
LESNICTVÍFORESTRY6-17. Vybrané uk
- Page 157 and 158:
Stavební práce provedené podle d
- Page 159 and 160:
7. INDUSTRY, ENERGY, CONSTRUCTION A
- Page 161 and 162:
PRŮMYSLINDUSTRY7-1. Průměrný po
- Page 163 and 164:
PRŮMYSLINDUSTRY7-3. Průměrný ev
- Page 165 and 166:
PRŮMYSLINDUSTRY7-5. Základní uka
- Page 167 and 168:
ENERGETIKAENERGY7-6. Spotřeba pali
- Page 169 and 170:
STAVEBNICTVÍCONSTRUCTION7-8. Stave
- Page 171 and 172:
STAVEBNICTVÍCONSTRUCTION7-11. Stav
- Page 173 and 174:
STAVEBNICTVÍCONSTRUCTION7-13. Šet
- Page 175 and 176:
STAVEBNICTVÍCONSTRUCTION7-16. Roze
- Page 177 and 178:
STAVEBNICTVÍCONSTRUCTION7-19. Zah
- Page 179 and 180:
STAVEBNICTVÍCONSTRUCTION7-21. Doko
- Page 181 and 182:
STAVEBNICTVÍCONSTRUCTION7-24. Doko
- Page 183 and 184:
STAVEBNICTVÍCONSTRUCTION7-27. Pře
- Page 185 and 186:
INVESTICEFIXED ASSETS7-30. Poříze
- Page 187 and 188:
INVESTICEFIXED ASSETS7-32. Poříze
- Page 189 and 190:
VÝZKUM A VÝVOJRESEARCH AND DEVELO
- Page 191 and 192:
DOPRAVAÚdaje z dopravy byly získ
- Page 193 and 194:
TRANSPORTThe data on transport were
- Page 195 and 196:
CESTOVNÍ RUCH8-1. Regionální str
- Page 197 and 198:
CESTOVNÍ RUCHTOURISM8-3. Pohostins
- Page 199 and 200:
CESTOVNÍ RUCHTOURISM8-6. Hosté vh
- Page 201 and 202:
CESTOVNÍ RUCHTOURISM8-8. Hromadná
- Page 203 and 204:
CESTOVNÍ RUCH, DOPRAVATOURISM, TRA
- Page 205 and 206:
DOPRAVATRANSPORT8-12. Délka silnic
- Page 207 and 208:
9. ŠKOLSTVÍ, KULTURA A SPORT, ZDR
- Page 209 and 210:
amateřství. V plném rozsahu se t
- Page 211:
9. EDUCATION, CULTURE AND SPORTS, H
- Page 214 and 215:
ŠKOLSTVÍEDUCATION9-1. Školy podl
- Page 216 and 217:
ŠKOLSTVÍEDUCATION9-2. Školy podl
- Page 218 and 219:
ŠKOLSTVÍEDUCATION9-3. Školy podl
- Page 220 and 221:
KULTURA A SPORTCULTURE AND SPORTS9-
- Page 222 and 223:
KULTURA A SPORTCULTURE AND SPORTS9-
- Page 224 and 225:
ZDRAVOTNICTVÍHEALTH9-10. Pracovní
- Page 226 and 227:
ZDRAVOTNICTVÍHEALTH9-11. Pracovní
- Page 228 and 229:
ZDRAVOTNICTVÍHEALTH9-13. Pracovní
- Page 230 and 231:
ZDRAVOTNICTVÍHEALTH9-15. Pracovní
- Page 232 and 233:
SOCIÁLNÍ ZABEZPEČENÍSOCIAL SECU
- Page 234 and 235:
SOCIÁLNÍ ZABEZPEČENÍ9-20. Výda
- Page 236 and 237:
SOCIÁLNÍ ZABEZPEČENÍSOCIAL SECU
- Page 238 and 239:
SOCIÁLNÍ ZABEZPEČENÍSOCIAL SECU
- Page 240 and 241:
SOCIÁLNÍ ZABEZPEČENÍSOCIAL SECU
- Page 242 and 243:
SOCIÁLNÍ ZABEZPEČENÍSOCIAL SECU
- Page 244 and 245:
SOCIÁLNÍ ZABEZPEČENÍSOCIAL SECU
- Page 246 and 247:
SOCIÁLNÍ ZABEZPEČENÍSOCIAL SECU
- Page 248 and 249:
SOCIÁLNÍ ZABEZPEČENÍSOCIAL SECU
- Page 250 and 251:
SOCIÁLNÍ ZABEZPEČENÍSOCIAL SECU
- Page 252 and 253:
10. CRIME, TRAFFIC ACCIDENTS, FIRES
- Page 254 and 255:
KRIMINALITACRIME10-3. Zjištěné t
- Page 256 and 257:
DOPRAVNÍ NEHODYTRAFFIC ACCIDENTS10
- Page 258 and 259:
POŽÁRYFIRES10-10. Požáry v čle
- Page 260 and 261:
POŽÁRYFIRES10-12. Požáry podle
- Page 262 and 263:
11. VOLBY A REFERENDUMVe dnech 1. a
- Page 264 and 265:
VOLBYELECTIONS11-1. Volby do zastup
- Page 266 and 267:
VOLBYELECTIONS11-4. Volby do zastup
- Page 268 and 269:
VOLBYELECTIONS11-6. Volby do zastup
- Page 270 and 271:
REFERENDUMREFERENDUM11-8. Referendu
- Page 272 and 273:
Rozlišují se čtyři základní t
- Page 274 and 275:
12. POPULATION AND HOUSING CENSUS 2
- Page 276 and 277:
Unoccupied dwelling is a dwelling,
- Page 278 and 279:
SČÍTÁNÍ LIDU, DOMŮ ABYTŮPOPUL
- Page 280 and 281:
SČÍTÁNÍ LIDU, DOMŮ ABYTŮPOPUL
- Page 282 and 283:
SČÍTÁNÍ LIDU, DOMŮ ABYTŮPOPUL
- Page 284 and 285:
SČÍTÁNÍ LIDU, DOMŮ ABYTŮPOPUL
- Page 286 and 287: SČÍTÁNÍ LIDU, DOMŮ ABYTŮPOPUL
- Page 288 and 289: SČÍTÁNÍ LIDU, DOMŮ ABYTŮPOPUL
- Page 290 and 291: 13. MUNICIPALITIESAct No. 314/2002
- Page 292 and 293: MĚSTA A OBCEMUNICIPALITIES13-2. Sl
- Page 294 and 295: MĚSTAAOBCEMUNICIPALITIES13-4. Domy
- Page 296 and 297: MĚSTAAOBCEMUNICIPALITIES13-6. Vyba
- Page 298 and 299: MĚSTA A OBCEMUNICIPALITIES13-7. Ek
- Page 300 and 301: MĚSTA A OBCEMUNICIPALITIES13-10. S
- Page 302 and 303: MĚSTAAOBCEMUNICIPALITIES13-12. Dom
- Page 304 and 305: MĚSTAAOBCEMUNICIPALITIES13-13. Vyb
- Page 306 and 307: MĚSTA A OBCE13-15. Vybrané údaje
- Page 308 and 309: MĚSTA A OBCESprávní obvody obcí
- Page 310 and 311: MĚSTA A OBCESprávní obvody obcí
- Page 312 and 313: MĚSTA A OBCESprávní obvody obcí
- Page 314 and 315: 14. ÚZEMNÍ SROVNÁNÍNa základě
- Page 316 and 317: ÚZEMNÍ SROVNÁNÍ14-1. Vybrané u
- Page 318 and 319: ÚZEMNÍ SROVNÁNÍ14-1. Vybrané u
- Page 320 and 321: ÚZEMNÍ SROVNÁNÍ14-1. Vybrané u
- Page 322 and 323: ÚZEMNÍ SROVNÁNÍ14-1. Vybrané u
- Page 324 and 325: ÚZEMNÍ SROVNÁNÍ14-2. Vybrané u
- Page 326 and 327: ÚZEMNÍ SROVNÁNÍ14-2. Vybrané u
- Page 328 and 329: ÚZEMNÍ SROVNÁNÍ14-2. Vybrané u
- Page 330 and 331: ÚZEMNÍ SROVNÁNÍ14-2. Vybrané u
- Page 332 and 333: ÚZEMNÍ SROVNÁNÍ14-3. Vybrané u
- Page 334 and 335: 334Statistická ročenka Olomoucké
- Page 338 and 339: VYBRANÉ UKAZATELE ČESKÉ REPUBLIK
- Page 340 and 341: VYBRANÉ UKAZATELE ČESKÉ REPUBLIK
- Page 342 and 343: VYBRANÉ UKAZATELE ČESKÉ REPUBLIK
- Page 344 and 345: VYBRANÉ UKAZATELE ČESKÉ REPUBLIK
- Page 346 and 347: VYBRANÉ UKAZATELE ČESKÉ REPUBLIK
- Page 348 and 349: VYBRANÉ UKAZATELE ČESKÉ REPUBLIK
- Page 350 and 351: 350Statistická ročenka Olomoucké
- Page 352 and 353: 352Statistická ročenka Olomoucké
- Page 354 and 355: Správní rozdělení Olomouckého
- Page 356 and 357: Přirozený přírůstek / úbytek
- Page 358 and 359: Míra registrované nezaměstnanost
- Page 360 and 361: Počet registrovaných subjektů se
- Page 362 and 363: Dokončené byty na 10 000 obyvatel
- Page 364 and 365: Žáci v základních školách na
- Page 366 and 367: Místa v domovech důchodců a penz
- Page 368 and 369: Podíl úplných rodin z celkového
- Page 370: Míra nezaměstnanosti v obcích Ol