Annual Report
Annual Report
Annual Report

Create successful ePaper yourself
Turn your PDF publications into a flip-book with our unique Google optimized e-Paper software.
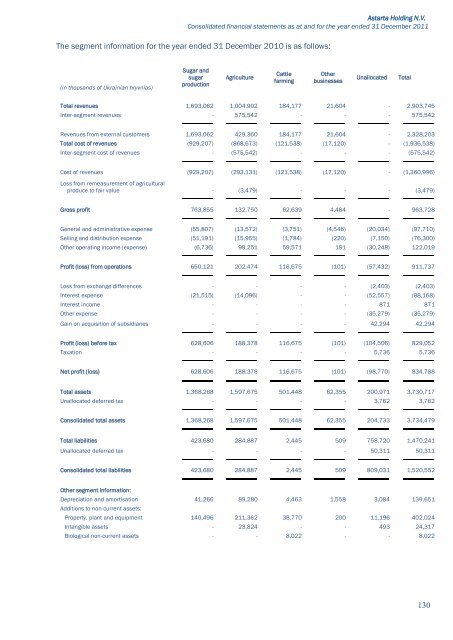
Astarta Holding N.V.Consolidated financial statements as at and for the year ended 31 December 2011The segment information for the year ended 31 December 2010 is as follows:(in thousands of Ukrainian hryvnias)Sugar andsugarproductionAgricultureCattlefarmingOtherbusinessesUnallocatedTotalTotal revenues 1,693,062 1,004,902 184,177 21,604 - 2,903,745Inter-segment revenues - 575,542 - - - 575,542Revenues from external customers 1,693,062 429,360 184,177 21,604 - 2,328,203Total cost of revenues (929,207) (868,673) (121,538) (17,120) - (1,936,538)Inter-segment cost of revenues - (575,542) - - - (575,542)Cost of revenues (929,207) (293,131) (121,538) (17,120) - (1,360,996)Loss from remeasurement of agriculturalproduce to fair value - (3,479) - - - (3,479)Gross profit 763,855 132,750 62,639 4,484 - 963,728General and administrative expense (55,807) (13,572) (3,751) (4,546) (20,034) (97,710)Selling and distribution expense (51,191) (15,955) (1,784) (220) (7,150) (76,300)Other operating income (expense) (6,736) 99,251 59,571 181 (30,248) 122,019Profit (loss) from operations 650,121 202,474 116,675 (101) (57,432) 911,737Loss from exchange differences - - - - (2,403) (2,403)Interest expense (21,515) (14,096) - - (52,557) (88,168)Interest income - - - - 871 871Other expense - - - - (35,279) (35,279)Gain on acquisition of subsidiaries - - - - 42,294 42,294Profit (loss) before tax 628,606 188,378 116,675 (101) (104,506) 829,052Taxation - - - - 5,736 5,736Net profit (loss) 628,606 188,378 116,675 (101) (98,770) 834,788Total assets 1,368,268 1,597,675 501,448 62,355 200,971 3,730,717Unallocated deferred tax - - - - 3,762 3,762Consolidated total assets 1,368,268 1,597,675 501,448 62,355 204,733 3,734,479Total liabilities 423,680 284,887 2,445 509 758,720 1,470,241Unallocated deferred tax - - - - 50,311 50,311Consolidated total liabilities 423,680 284,887 2,445 509 809,031 1,520,552Other segment information:Depreciation and amortisation 41,266 89,280 4,463 1,558 3,084 139,651Additions to non-current assets:Property, plant and equipment 140,496 211,362 38,770 200 11,196 402,024Intangible assets - 23,824 - - 493 24,317Biological non-current assets - - 8,022 - - 8,022130