Annual Report
Annual Report
Annual Report

Create successful ePaper yourself
Turn your PDF publications into a flip-book with our unique Google optimized e-Paper software.
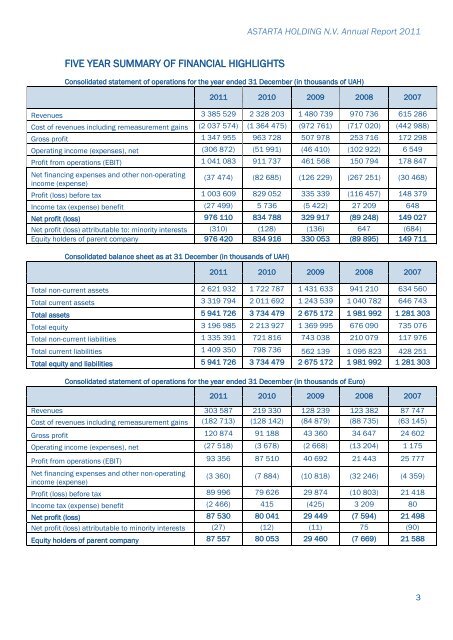
ASTARTA HOLDING N.V. <strong>Annual</strong> <strong>Report</strong> 2011FIVE YEAR SUMMARY OF FINANCIAL HIGHLIGHTSConsolidated statement of operations for the year ended 31 December (in thousands of UAH)2011 2010 2009 2008 2007Revenues 3 385 529 2 328 203 1 480 739 970 736 615 286Cost of revenues including remeasurement gains (2 037 574) (1 364 475) (972 761) (717 020) (442 988)Gross profit 1 347 955 963 728 507 978 253 716 172 298Operating income (expenses), net (306 872) (51 991) (46 410) (102 922) 6 549Profit from operations (EBIT) 1 041 083 911 737 461 568 150 794 178 847Net financing expenses and other non-operatingincome (expense)(37 474) (82 685) (126 229) (267 251) (30 468)Profit (loss) before tax 1 003 609 829 052 335 339 (116 457) 148 379Income tax (expense) benefit (27 499) 5 736 (5 422) 27 209 648Net profit (loss) 976 110 834 788 329 917 (89 248) 149 027Net profit (loss) attributable to: minority interests (310) (128) (136) 647 (684)Equity holders of parent company 976 420 834 916 330 053 (89 895) 149 711Consolidated balance sheet as at 31 December (in thousands of UAH)2011 2010 2009 2008 2007Total non-current assets 2 621 932 1 722 787 1 431 633 941 210 634 560Total current assets 3 319 794 2 011 692 1 243 539 1 040 782 646 743Total assets 5 941 726 3 734 479 2 675 172 1 981 992 1 281 303Total equity 3 196 985 2 213 927 1 369 995 676 090 735 076Total non-current liabilities 1 335 391 721 816 743 038 210 079 117 976Total current liabilities 1 409 350 798 736 562 139 1 095 823 428 251Total equity and liabilities 5 941 726 3 734 479 2 675 172 1 981 992 1 281 303Consolidated statement of operations for the year ended 31 December (in thousands of Euro)2011 2010 2009 2008 2007Revenues 303 587 219 330 128 239 123 382 87 747Cost of revenues including remeasurement gains (182 713) (128 142) (84 879) (88 735) (63 145)Gross profit 120 874 91 188 43 360 34 647 24 602Operating income (expenses), net (27 518) (3 678) (2 668) (13 204) 1 175Profit from operations (EBIT) 93 356 87 510 40 692 21 443 25 777Net financing expenses and other non-operatingincome (expense)(3 360) (7 884) (10 818) (32 246) (4 359)Profit (loss) before tax 89 996 79 626 29 874 (10 803) 21 418Income tax (expense) benefit (2 466) 415 (425) 3 209 80Net profit (loss) 87 530 80 041 29 449 (7 594) 21 498Net profit (loss) attributable to minority interests (27) (12) (11) 75 (90)Equity holders of parent company 87 557 80 053 29 460 (7 669) 21 5883