Biodiversity Guide - The Intertwine
Biodiversity Guide - The Intertwine
Biodiversity Guide - The Intertwine

Create successful ePaper yourself
Turn your PDF publications into a flip-book with our unique Google optimized e-Paper software.
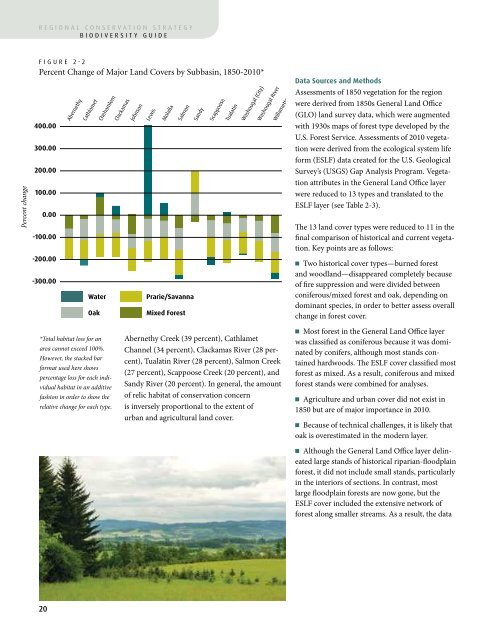
egional conservation strategybiodiversity guide-100Chapter 2 Biogeography of the Greater Portland-Vancouver RegionPercent changefigure 2-2Percent Change of Major Land Covers by Subbasin, 1850-2010*400.00300.00200.00100.000.00-100.00-200.00-300.00AbernethyCathlametWaterOakChehamlem*Total habitat loss for anarea cannot exceed 100%.However, the stacked barformat used here showspercentage loss for each individualhabitat in an additivefashion in order to show therelative change for each type.ClackamasJohnsonLewisMolallaSalmonPrarie/SavannaMixed ForestSandyScappooseTualatinWashougal (City)Washougal RiverAbernethy Creek (39 percent), CathlametChannel (34 percent), Clackamas River (28 percent),Tualatin River (28 percent), Salmon Creek(27 percent), Scappoose Creek (20 percent), andSandy River (20 percent). In general, the amountof relic habitat of conservation concernis inversely proportional to the extent ofurban and agricultural land cover.WillametteData Sources and MethodsAssessments of 1850 vegetation for the regionwere derived from 1850s General Land Office(GLO) land survey data, which were augmentedwith 1930s maps of forest type developed by theU.S. Forest Service. Assessments of 2010 vegetationwere derived from the ecological system lifeform (ESLF) data created for the U.S. GeologicalSurvey’s (USGS) Gap Analysis Program. Vegetationattributes in the General Land Office layerwere reduced to 13 types and translated to theESLF layer (see Table 2-3).<strong>The</strong> 13 land cover types were reduced to 11 in thefinal comparison of historical and current vegetation.Key points are as follows:n Two historical cover types—burned forestand woodland—disappeared completely becauseof fire suppression and were divided betweenconiferous/mixed forest and oak, depending ondominant species, in order to better assess overallchange in forest cover.n Most forest in the General Land Office layerwas classified as coniferous because it was dominatedby conifers, although most stands containedhardwoods. <strong>The</strong> ESLF cover classified mostforest as mixed. As a result, coniferous and mixedforest stands were combined for analyses.n Agriculture and urban cover did not exist in1850 but are of major importance in 2010.n Because of technical challenges, it is likely thatoak is overestimated in the modern layer.n Although the General Land Office layer delineatedlarge stands of historical riparian-floodplainforest, it did not include small stands, particularlyin the interiors of sections. In contrast, mostlarge floodplain forests are now gone, but theESLF cover included the extensive network offorest along smaller streams. As a result, the dataindicate an increase in riparian forest, when logicsuggests that it has actually declined.n Together, emergent wetland, scrub-shrubwetland, shrubland, and unvegetated land madeup only 0.87 percent of the landscape in 1850 and1.80 percent in 2010; these figures are suspectbecause of differences in scale and classificationin the underlying datasets.For More information<strong>The</strong> 1930s Survey of Forest Resources inWashington and OregonC.A. Harrington (compiler). 2003. USDAForest Service General Technical ReportPNW-GTR-584. 10 pp. + appendices and CD.Habitat Change in the Greater Portland-VancouverMetro Area, 1850-2010John A. Christy. 2011. Oregon <strong>Biodiversity</strong>Information Center, Portland State UniversityGLO Historical Vegetation of SouthwesternWashington, 1851-1910J.A. Christy. 2011. ArcMap shapefile, Version2011_05. Oregon <strong>Biodiversity</strong> InformationCenter, Portland State University. Scale 1:24,000.Available athttp://www.pdx.edu/pnwlamp/glo-historicalvegetation-maps-oregon-0GLO Historical Vegetation of the WillametteValley, Oregon, 1851-1910J.A., Christy, E.R. Alverson, M.P. Dougherty,S.C. Kolar, C.W. Alton, S.M. Hawes, L. Ashkenas& P. Minear. 2009. ArcMap shapefile, Version2009_07. Oregon Natural Heritage InformationCenter, Oregon State University. Scale 1:24,000.http://www.pdx.edu/pnwlamp/glo-historicalvegetation-maps-oregon-0Ecological system life form (ESLF) dataJ.S., Kagan, E. Nielsen, C. Tobalske, J. Ohmann, E.Grossmann, J. Bauer, M. Gregory, J. Hak, S. Hanser,S. Knick, Southwest Regional GAP Project RS/GIS Laboratory (Utah State University), Nature-Serve, USGS/EROS Data Center. 2010. Institutefor Natural Resources, Portland State University.Scale 1:100,000. Available at http://www.pdx.edu/pnwlamp/existing-vegetationHow the <strong>Biodiversity</strong> <strong>Guide</strong> Relates to OtherRegional Planning EffortsOver the past 20 years, several regional, state, and local conservationpriority-setting efforts have been completed that overlap, are adjacentto, or are fully within the boundary of the greater Portland-Vancouverregion (see Table 2-4). <strong>The</strong> larger regional analyses generally share anoverall project goal with the <strong>Biodiversity</strong> <strong>Guide</strong> and Regional ConservationStrategy—i.e., identifying where best to direct conservationactions so as to preserve overall biodiversity at the regional scale.Previous conservation planning efforts focused on the WillametteValley (e.g., the Oregon Department of Fish and Wildlife’s OregonConservation Strategy in 2006 and the Nature Conservancy-ledWillamette Synthesis project in 2009), the Willamette Basin (thePacific Northwest Ecosystem Research Consortium’s Willamette RiverBasin Planning Atlas), or even multi-state ecoregions like the CascadeMountains or Coast Range (<strong>The</strong> Nature Conservancy and its partners’ecoregional assessments in 2006 and 2007). In contrast, more localefforts, such as those conducted by Metro, counties, cities, soil andwater conservation districts, watershed councils, and other nonprofitorganizations, tend to address individual areas or single watershedswithin the region and do not evaluate the areas within the context ofthe larger regional landscape. Finally, projects like U.S. Fish and WildlifeService recovery plans focus on particular species or habitats. <strong>The</strong>resulting lack of consistent data sets, methods, and project objectivesmake it difficult to align and adequately integrate larger and smallerscale priorities into the specific geography of the greater Portland-Vancouver region.One of the principal weaknesses of the previous regional efforts wastheir lack of attention to urban and near-urban areas. Historically, thevalue of urban areas in supporting regional conservation efforts hasbeen underrated; analyses have been skewed by the available data sets,the large scale of analysis, and the lack of appreciation of the role thaturban natural areas can play in connecting sites and watersheds, bothwithin the region itself and in linking the region to the larger ecologicallandscape.This <strong>Biodiversity</strong> <strong>Guide</strong> aims to build on the previous regional andlocal-scale analyses and prioritizations by filling in the gaps betweenplans done with a larger landscape context and local plans. <strong>The</strong> finalproduct will allow for conservation priorities to be set at a geographicscale that matches the region but that can also integrate smaller,watershed-based plans and nest within larger bioregional analyses.20 21