Carlisle is the most northerly city in England, and the ... - NHS Cumbria
Carlisle is the most northerly city in England, and the ... - NHS Cumbria
Carlisle is the most northerly city in England, and the ... - NHS Cumbria
- No tags were found...

Create successful ePaper yourself
Turn your PDF publications into a flip-book with our unique Google optimized e-Paper software.
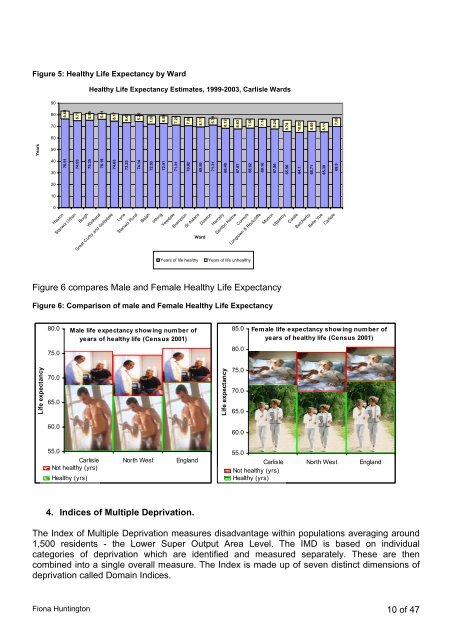
Figure 5: Healthy Life Expectancy by WardHealthy Life Expectancy Estimates, 1999-2003, <strong>Carl<strong>is</strong>le</strong> Wards9080706.696.775.855.016.176.475.267.076.597.297.088.115.798.128.637.687.148.249.7410.008.698.117.5060Years50403076.5174.9375.3576.1974.6373.2374.1472.0372.5171.3170.6269.5971.3168.4867.8768.6269.1667.8665.5664.765.7165.3969.920100HaytonStanwix UrbanBurghWe<strong>the</strong>ralGreat Corby <strong>and</strong> GeltsdaleLyneStanwix RuralBelahIrth<strong>in</strong>gYewdaleBramptonSt AidansWardDalstonHarrabyDenton HolmeCurrockLongtown & RockcliffeMortonUpperbyCastleBotcherbyBelle Vue<strong>Carl<strong>is</strong>le</strong>Years of life healthyYears of life unhealthyFigure 6 compares Male <strong>and</strong> Female Healthy Life ExpectancyFigure 6: Compar<strong>is</strong>on of male <strong>and</strong> Female Healthy Life Expectancy80.075.0Male life expectancy show <strong>in</strong>g number ofyears of healthy life (Census 2001)85.080.0Female life expectancy show<strong>in</strong>g number ofyears of healthy life (Census 2001)Life expectancy70.065.0Life expectancy75.070.065.060.060.055.0<strong>Carl<strong>is</strong>le</strong> North West <strong>Engl<strong>and</strong></strong>Not healthy (yrs)Healthy (yrs)55.0<strong>Carl<strong>is</strong>le</strong> North West <strong>Engl<strong>and</strong></strong>Not healthy (yrs)Healthy (yrs)4. Indices of Multiple Deprivation.The Index of Multiple Deprivation measures d<strong>is</strong>advantage with<strong>in</strong> populations averag<strong>in</strong>g around1,500 residents - <strong>the</strong> Lower Super Output Area Level. The IMD <strong>is</strong> based on <strong>in</strong>dividualcategories of deprivation which are identified <strong>and</strong> measured separately. These are <strong>the</strong>ncomb<strong>in</strong>ed <strong>in</strong>to a s<strong>in</strong>gle overall measure. The Index <strong>is</strong> made up of seven d<strong>is</strong>t<strong>in</strong>ct dimensions ofdeprivation called Doma<strong>in</strong> Indices.Fiona Hunt<strong>in</strong>gton 10 of 47